1. Introduction
Seismic exploration technology is the most reliable and commonly used technology in oil exploration and plays an important role in the detection of oil reserves [
1]. Traditional wired seismic exploration equipment has bulky cables making it very difficult to artificially deploy geophones in complex environments, thus making it impossible to meet the requirements of seismic exploration [
2,
3]. The rapid development of exploration equipment has mainly manifested in the following two aspects: the demand for mineral resources, which is continuously increasing, and seismic exploration areas, which have gradually developed into complex environments such as hills and rainforests [
4,
5]. The demand for “high-efficiency, wideband and high sensitivity“ equipment has prompted the development of seismic exploration instruments towards flexible and portable large-scale wireless ad hoc networks [
6]. Additionally, the emergence of new technologies such as “big data” and the “internet of things” has further improved the performance of wireless communication local area networks, which has greatly helped the development of wireless seismic data acquisition systems in the field environment [
7].
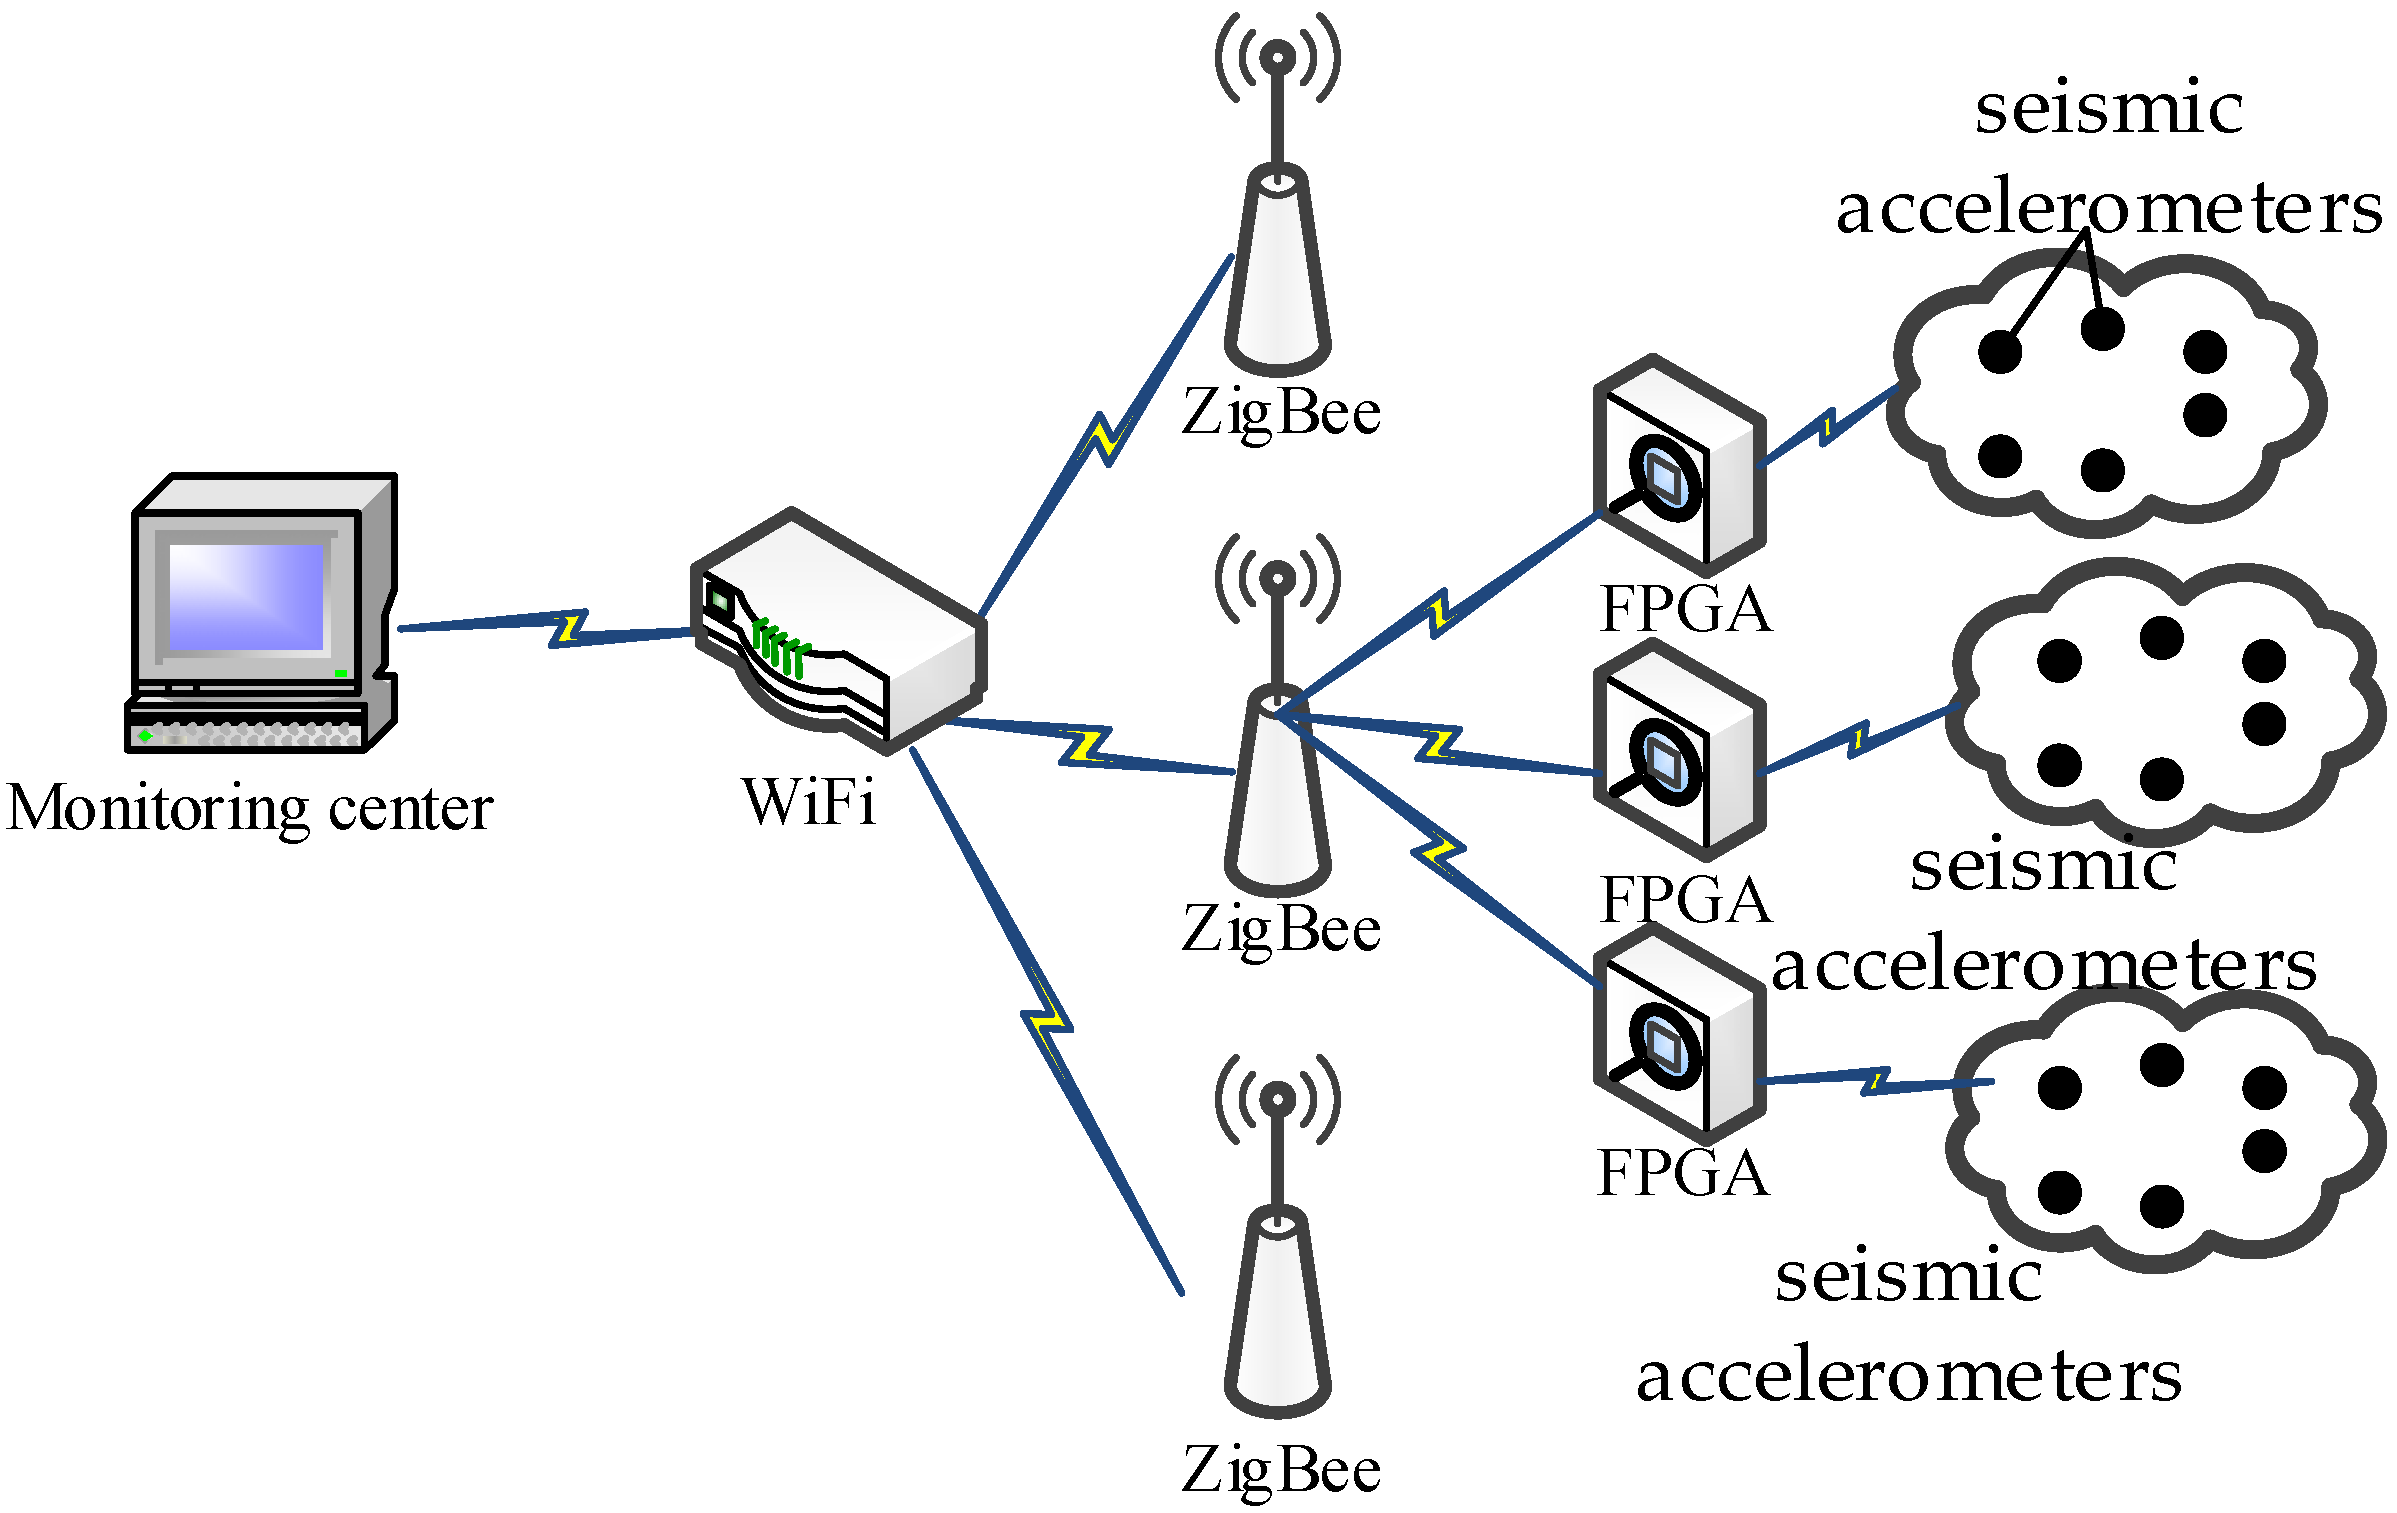
In seismic exploration, a general wireless sensor network cannot meet the needs of seismic exploration wireless acquisition due to the wider exploration area, the larger number of seismic accelerometers, and the huge amount of seismic data. Aiming to improve on the shortcomings of traditional seismic exploration data acquisition systems, a digital seismic data acquisition system, based on ZigBee and WiFi, is designed, as shown in
Figure 1. The ZigBee protocol, with a slower signal transmission speed and lower computing capacity, is usually used at the end of the seismic acquisition network, but the cost and power consumption of using it are low [
8]. In the core network of the wireless gateway, WiFi protocol, with high speed and real-time performance, is used to meet the needs of a seismic exploration system for power consumption and transmission rate [
9]. A digital seismic data acquisition system is designed to meet the exploration requirements of high sensitivity and wideband, including the seismic accelerometers node, an analog-to-digital converter (ADC), and digital data acquisition module based on FPGA.
As a key component of seismic data acquisition, the development of seismic accelerometers directly influences the accuracy of exploration [
10].
A seismic piezoelectric accelerometer is a vibration detector that converts vibration acceleration signals into electrical signals [
11], and is composed of a piezoelectric (PE) transducer, integral electronics, a shell, and coupling elements. The PE transducer uses piezoelectric crystals, artificial polarized ceramics, or organic polymer piezoelectric materials as sensing elements [
10,
12]. There are three main transducer construction designs used in piezoelectric accelerometers: compression mode, shear mode, and bending or flexural mode [
13,
14]. A commonly used seismic piezoelectric accelerometer is a compressed detector based on thickness deformation, which has a simple structure and good performance with a high frequency bandwidth and high signal-to-noise ratio [
13,
14,
15]. However, since a large mass is included inside the accelerometer and it has a poor low-frequency response, it fails to meet the standards of high-precision seismic exploration.
The sensitivity of piezoelectric accelerometers is greatly affected by the dielectric constant, piezoelectric constant, and electromechanical coupling coefficient of piezoelectric materials. In previous studies, lead zirconate titanate (PZT) ceramics were widely applied as sensing elements in piezoelectric accelerometers [
15,
16,
17]. Due to the limited performance of the piezoelectric elements, the sensitivity of existing piezoelectric accelerometers is not high enough and needs to be improved.
As new types of piezoelectric materials, xPb(Mg1/3Nb2/3)O3-(1-x)PbTiO3 (PMN-PT or PMNT) relaxation ferroelectric single crystals with high piezoelectric performance have attracted continuous attention, the piezoelectric strain constant (d33) and electromechanical coupling coefficient (k33) could reach as high as 2000 pC/N and 0.94, respectively [
18,
19], and the comprehensive performance of PMN-PT is more superior than PZT [
20]. The outstanding performance of PMN-PT makes it an ideal functional material for high sensitivity and low noise sensors. PMN-PT has been preliminarily used in ultrasonic motors [
21], piezoelectric transformers [
22], magnetoelectric sensors [
23], and ultrasonic transducers [
24]. These devices have a superior performance to those made with PZT, which shows promising applications in device fabrications. The sensitivity of the accelerometer will benefit from PMN-PT if it can be used as the sensing element of a seismic piezoelectric accelerometer.
However, high-precision seismic exploration is still limited by the poor low-frequency response of the traditional central compressed mode. The accelerometer in the bending mode has a good low-frequency response [
14]. The commonly used bending mode accelerometer generally adopts a cantilever beam [
25,
26,
27,
28], which has high sensitivity, but with a larger size and a relatively narrow frequency band [
27,
28]. Levinzon designed an ultra-low-noise seismic piezoelectric accelerometer with a double cantilever beam [
10], which is a cylindrical shape with a diameter of about 65 mm and a resonance frequency of about 370 Hz. The seismic piezoelectric accelerometer is linear, and the sensitivity is limited by the onset of nonlinearity [
29]. The resonant accelerometers can tune the electrostatic nonlinearities to enhance the sensitivity [
30], which has the advantages of being small in size with high precision [
31,
32]. Whereas, the resonant accelerometers are not suitable for measuring weak vibration and have a narrow bandwidth [
31]. In addition, the structure, manufacturing and packaging processes of resonant accelerometers are complicated [
33]. Seismic piezoelectric accelerometers are still the most commonly land-used sensor for acquiring seismic data. In summary, how to realize a piezoelectric accelerometer with high sensitivity, a good low-frequency response, and small size is a key problem to be solved in the exploration domain.
To solve the aforementioned problems, this paper achieves a PE transducer with a simply supported beam structure, using PMN-PT as its piezoelectric element, which has the advantages of having high sensitivity, a good low-frequency response performance, and being small in size. The charge conversion, filtering, amplification, and digitization of the output signal of the PE transducer are processed and are finally wirelessly transmitted to the monitoring centre, realizing the design of a seismic data acquisition system based on wireless transmission.
This paper is organized as follows. Firstly, the piezoelectric transducer of simple beam type is designed and verified by simulation, and then the charge conversion, filtering, and amplification, digital processing is designed. Finally, the experimental verification is carried out.
2. Design and Implementation
The system mainly includes a piezoelectric transducer, charge conversion circuit, high and low pass filter, amplifier, the ADC, and the microcontroller FPGA, as shown in
Figure 2. The piezoelectric transducer converts the vibration signal into an electrical signal and outputs it in the form of an electric charge. The charge conversion circuit converts the high-impedance charge signal into a low-impedance voltage signal and sends it to a high and low pass filter for filtering then amplifies it by an amplifier circuit, and finally uses an ADC to digitize the acceleration signal and send it to the FPGA. These whole procedures achieve the functions of data acquisition and data transmission of the seismic data acquisition system. The wireless transmission network sends the seismic data sampled by FPGA to the monitoring centre to analyse and process the signal for real-time monitoring and measurement.
2.1. Piezoelectric Transducer-Capturing Raw Seismic Data
The structure of the piezoelectric accelerometer is shown in
Figure 3a. The PE transducer and the charge amplifier circuit are all embedded in the accelerometer. As shown in
Figure 3b, the PE transducer proposed in the paper consists of three parts: a simply supported beam, piezoelectric element, and mass. The PE transducer vibrates with the vibration generated by the artificial excitation source, causing deformation of the piezoelectric element and the supported beam. The deformation of the piezoelectric element will transform the mechanical energy of the vibration into an electrical signal, which is known as the positive piezoelectric effect. The spring is a caging device to enhance the shock resistance of the piezoelectric accelerometer.
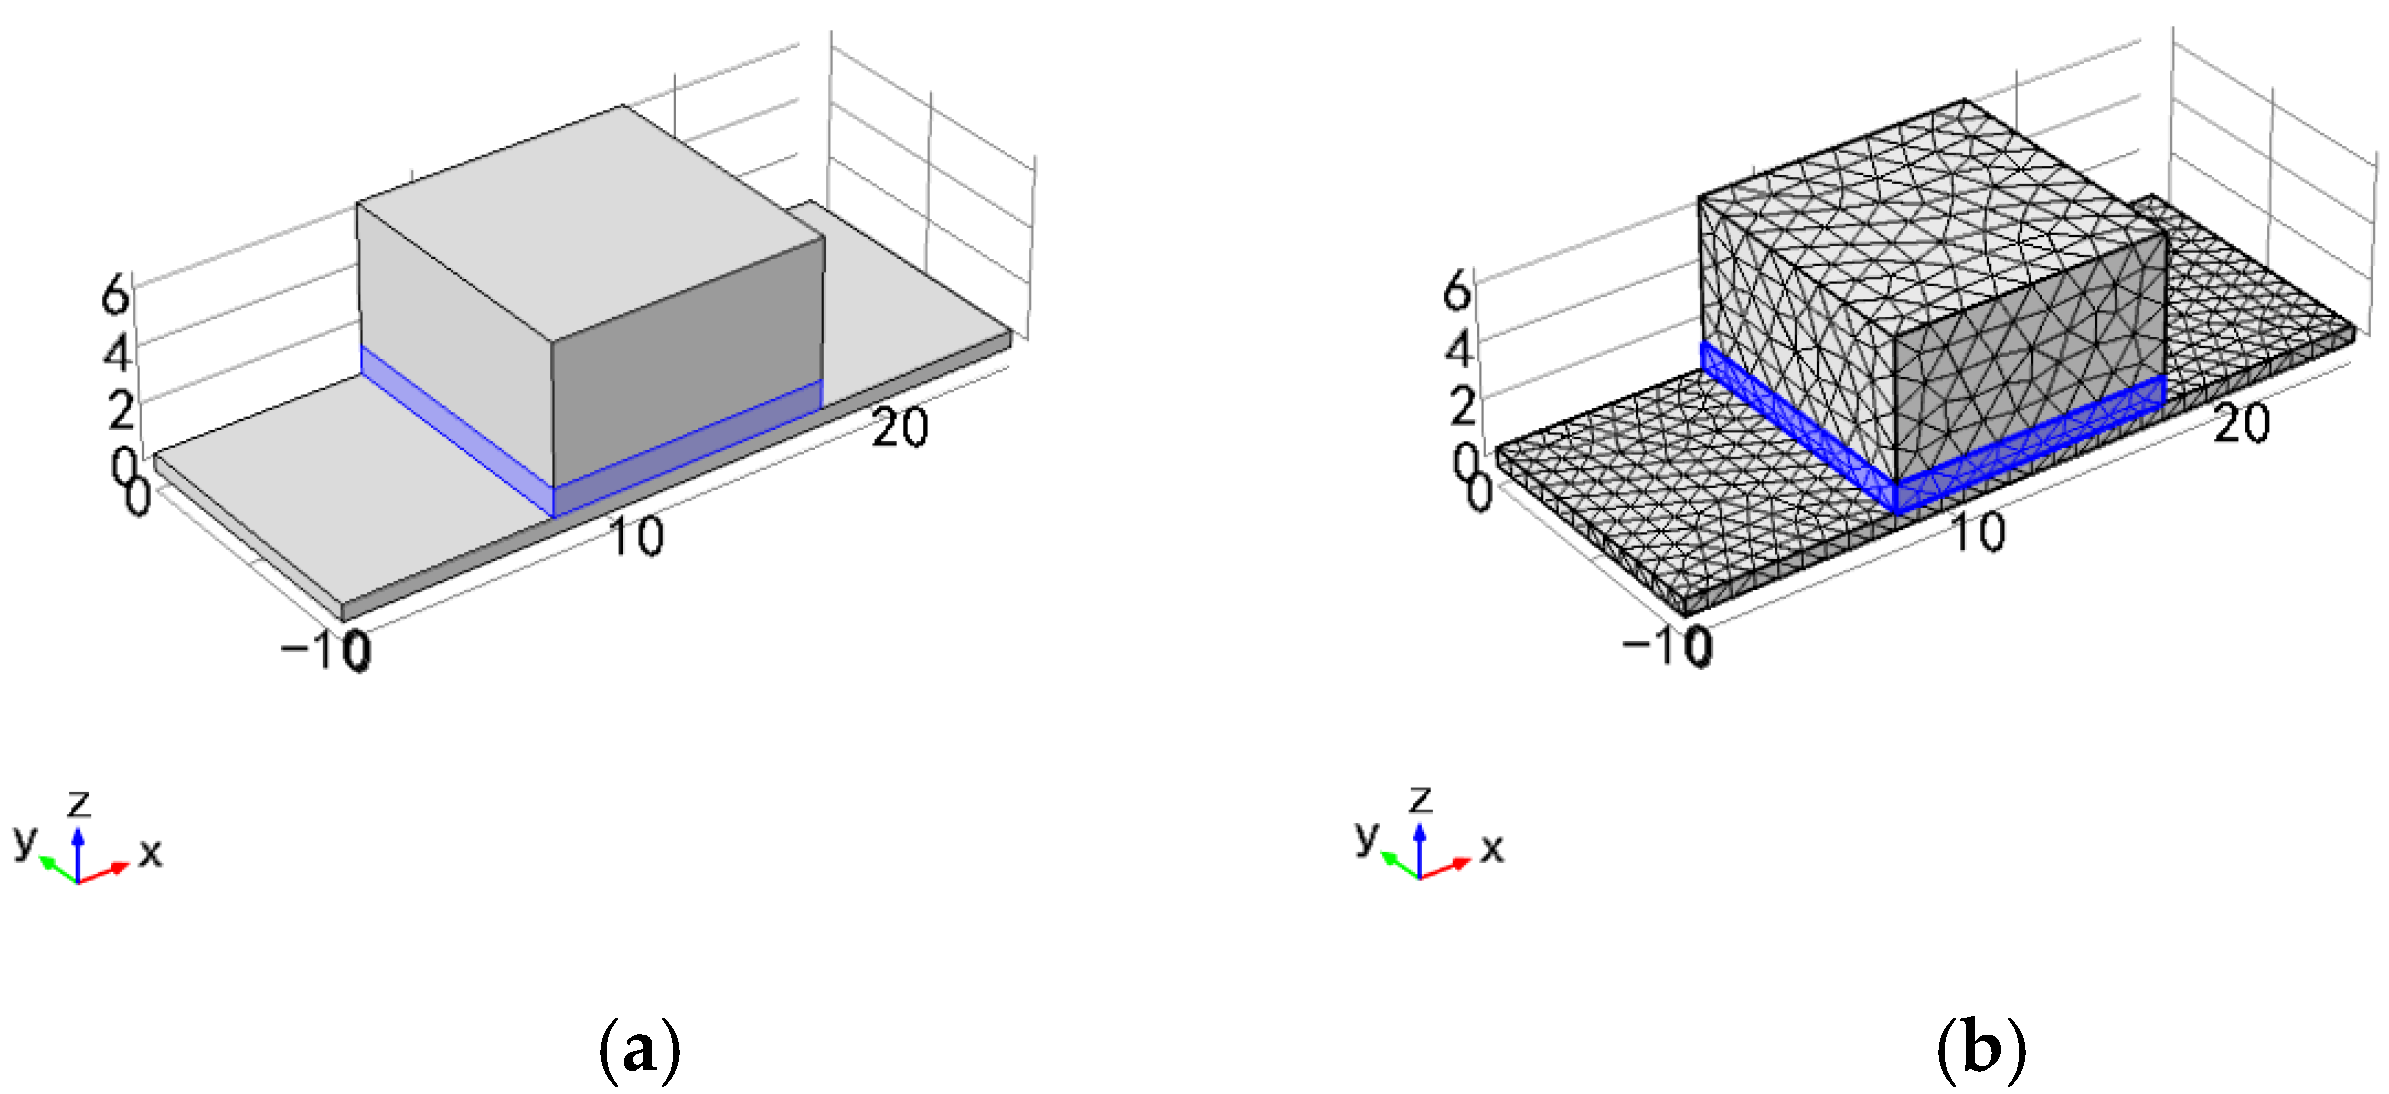
A simplified simulation model of the PE transducer with the simply supported beam is established in a multi-physical field analysis software COMSOL 5.2. As shown in
Figure 4, the size of the simply supported beam is 25 mm × 10 mm × 0.6 mm (length × width × thickness), and the Mass is 10 mm × 10 mm × 5 mm (length × width × thickness). The piezoelectric element and mass in the model are closely combined and located in the middle of the simply supported beam. The piezoelectric element has a polarization direction of [001] and a size of 10 mm × 10 mm × 1 mm. We use PZT and PMN-PT as piezoelectric elements for simulation experiments and compare their performance.
In the simulation, the analysis of the electromechanical coupling relationship is mainly carried out, and the physical fields involved are the circuit, the solid, and the electrostatic field. There are three main simulation steps: modelling, loading solution, and result analysis. First, establish the designed model, define the required parameters and functions, add the required physical fields, perform meshing, then define the solving equation, solve the required physical quantities, and finally analyse the results. The damping loss factor is the main method to describe spillage of material in the frequency domain and the damping type in the simulation is the isotropic loss factor, which can be user-defined. The boundary condition of the simply supported beam is set as zero displacements and bending moment at both ends of the simply supported beam:
where
l is the length of the simply supported beam, and the solver is a modal solver.
2.1.1. Force Simulation in Different Directions
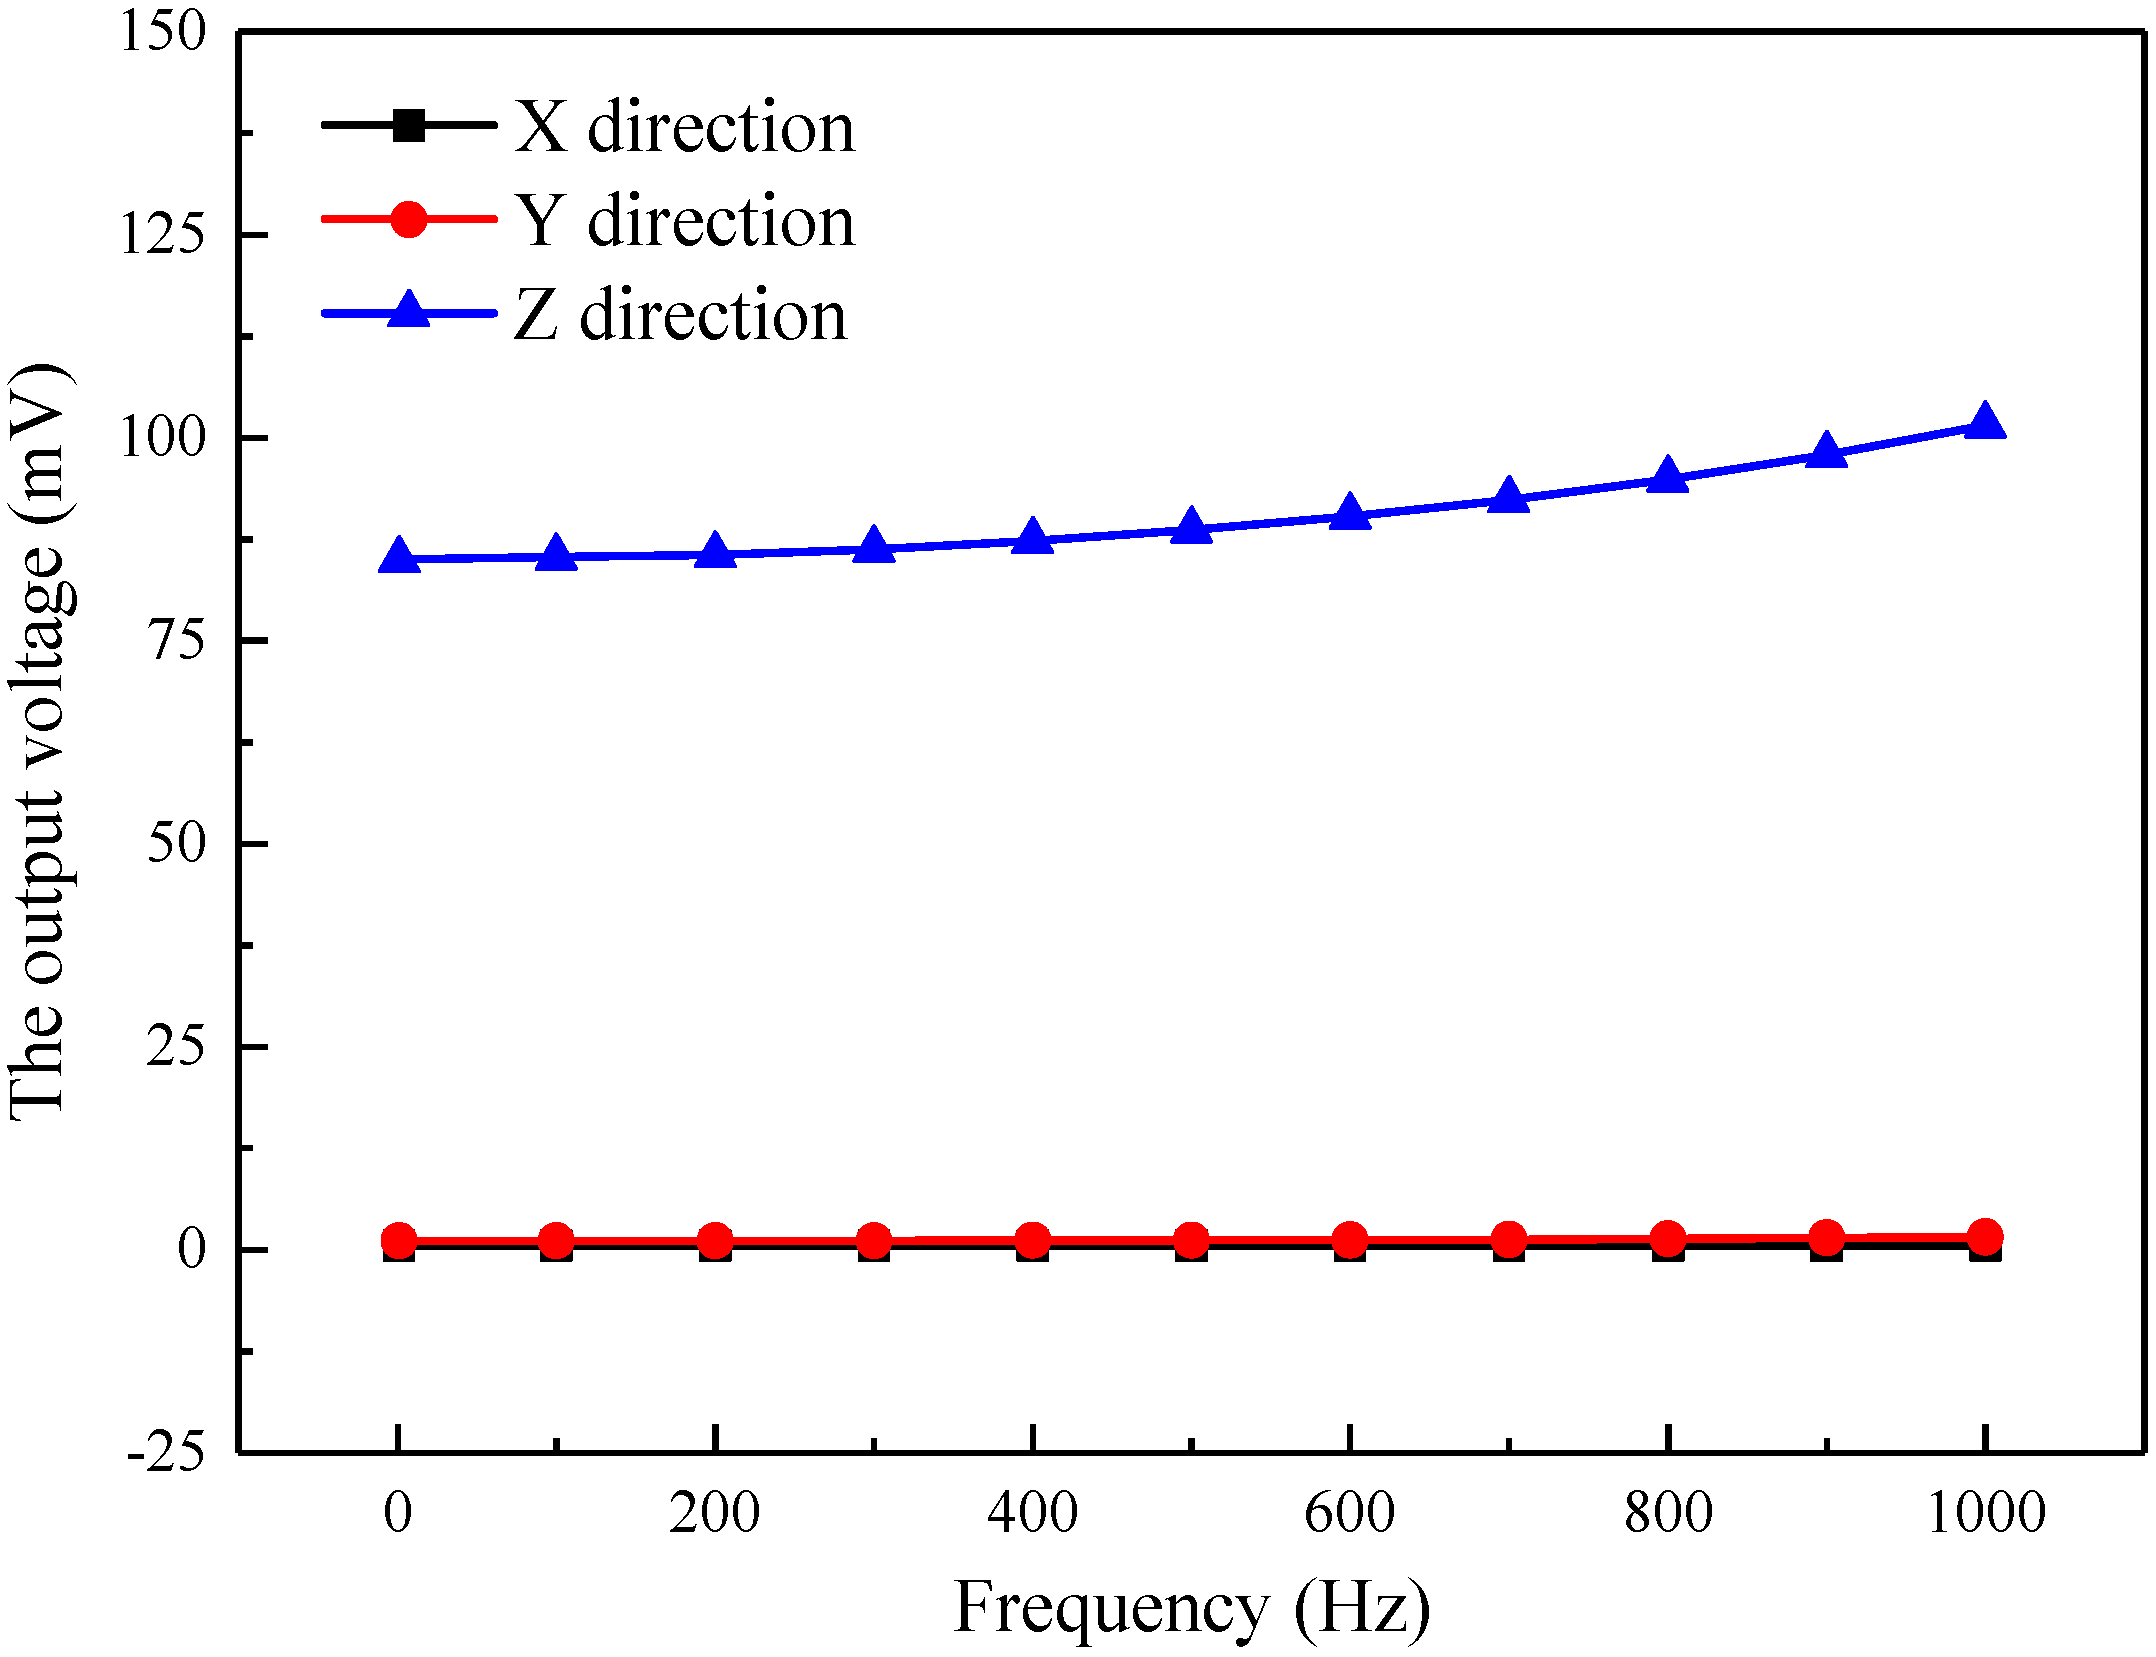
Seismic waves are transmitted to the accelerometer from the points of explosion during seismic prospecting. The vibration directions of the seismic waves are random which can be considered into X, Y, and Z directions. The vibration in one special direction, such as the Z direction, needs to be detected accurately by a one-component accelerometer. At the same time, the accelerometer should have the ability to suppress vibration interference in other directions, which is usually evaluated using transverse sensitivity. In this part, the force applied to the model is simulated along X, Y, and Z directions, respectively, the vibration acceleration is always 3 m/s2, and PMN-PT is used as a piezoelectric element.
As shown in
Figure 5, the simulation model is very sensitive to the vibration in the direction of
Z, but not sensitive to the vibration of
X and
Y directions. The output voltage of the model in different directions is shown in
Figure 5. In the 0–1000 Hz band, the output voltage of the model in the
Z direction is 85–101.6 mV, and the voltage variation is 16.6 mV. Whereas the output voltages of the model along
X and
Y directions are 0.049 mV and 0.48 mV, respectively, which are far less than the output voltage in the
Z direction. The transverse sensitivity is less than 0.56%, indicating that the model can effectively suppress transverse interference. In addition, when the simulation model is subjected to vibrations with the same acceleration and different frequencies, the output voltage is different. The higher the vibration frequency usually combines the higher the output voltage. In summary, the piezoelectric simply supported beam model employed in this paper is very sensitive to vibration acceleration and has great transverse interference suppression, which is suitable for designing the seismic piezoelectric accelerometer.
2.1.2. Different Piezoelectric Elements
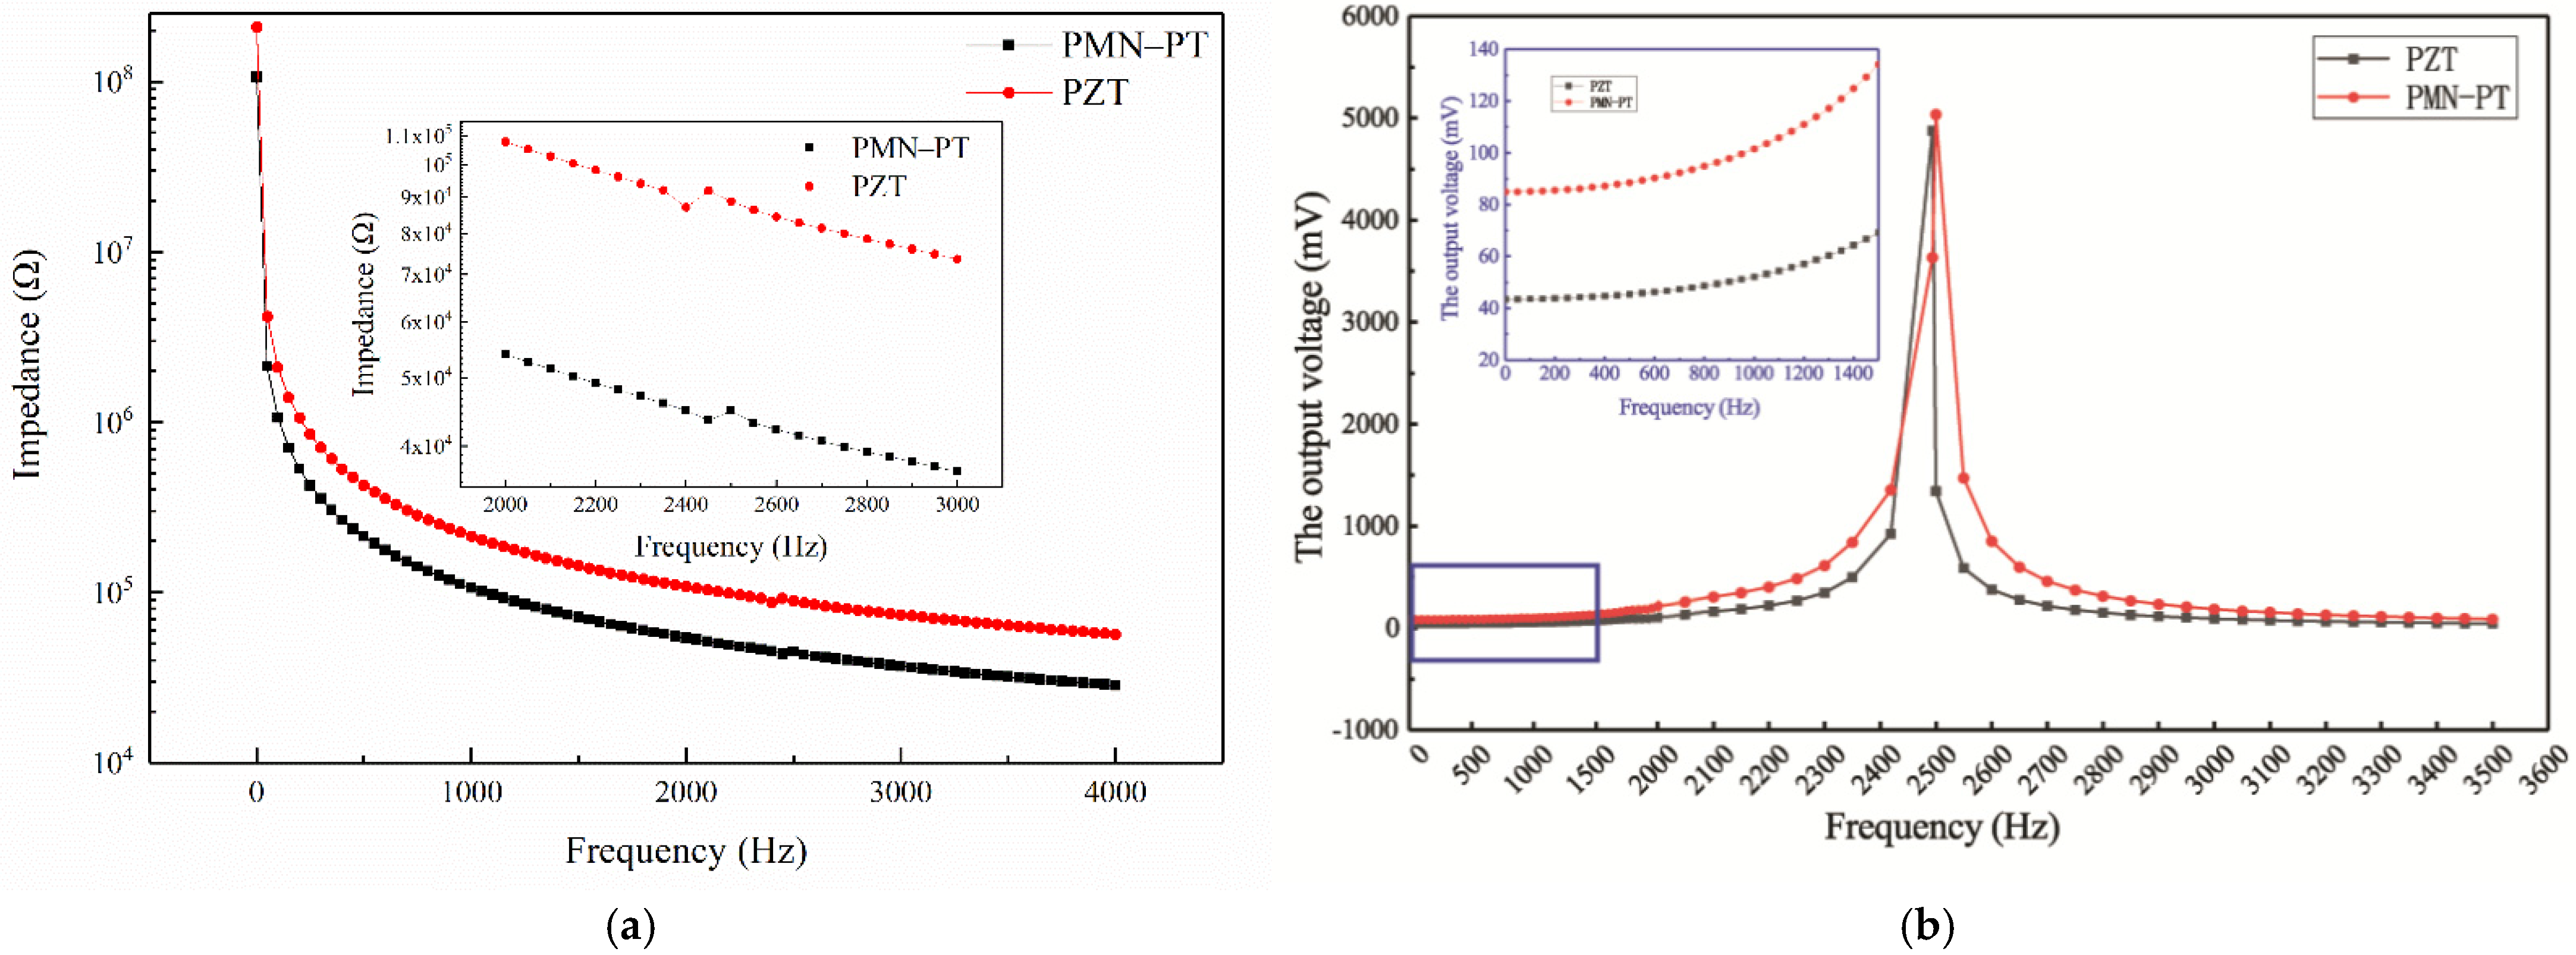
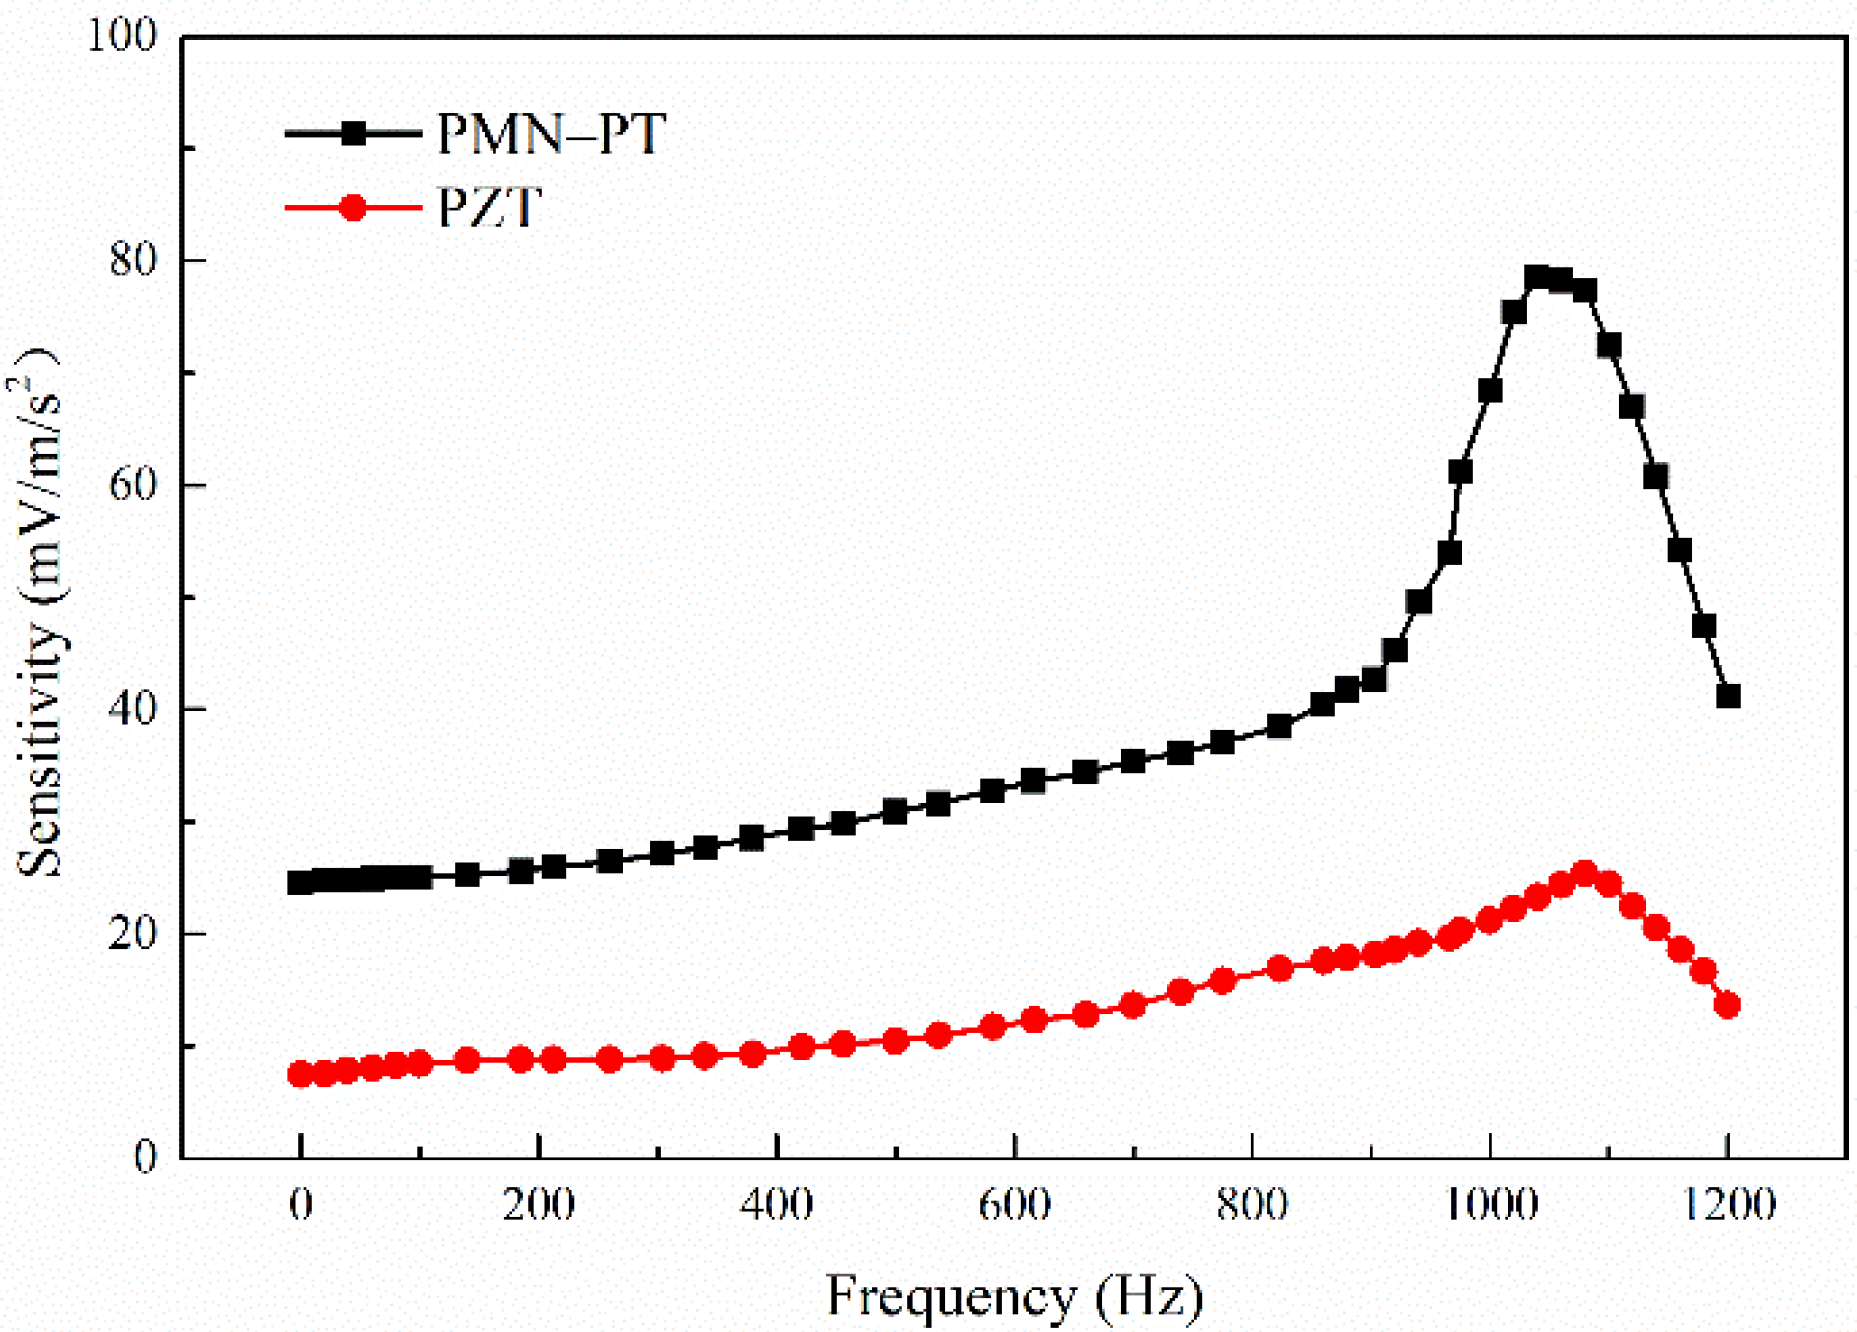
In the simulation experiment of different piezoelectric elements, PZT-5A is used as the piezoelectric element in comparison with the same size of relaxation ferroelectric single crystal PMN-PT. The output voltage is related to the parameters of the piezoelectric element. The comparison table for the material properties of PMN-PT and PZT is shown in
Table 1. The impedance spectrum of the different elements is shown in
Figure 6a. It can be seen that the impedance of the PZT element is significantly higher than that of PMN-PT. Consider the piezoelectric element as a voltage source, when the output impedance is constant, the larger the voltage source impedance combines the smaller the output voltage. Acceleration-invariant and frequency-varying vibrations are applied to a length of 25 mm simply supported beam along the
Z direction, and the output voltages of the models based on PZT-5A and PMN-PT at different frequencies are shown in
Figure 6b. The resonant frequency of the piezoelectric simply supported beam based on PMN-PT is 2500 Hz, while the PZT is 2450 Hz, which is higher than the maximum frequency of a seismic wave signal with a bandwidth of 0–800 Hz. Therefore, the frequency bandwidth of the piezoelectric simply supported beam can meet the design requirement of seismic accelerometers. It can also be seen from
Figure 6b that the response of the beam based on PMN-PT to vibration is superior to that of the beam based on PZT. The output voltage of the beam based on PMN-PT is 95% higher than that based on PZT in 0–1000 Hz.
For a seismic PE transducer, the sensitivity is the ratio of the transducer’s output voltage variation to the vibration acceleration variation [
13]:
In the simulation experiment, we measured the voltage sensitivity. In general, the sensitivities are divided into charge sensitivity and voltage sensitivity [
13],
, where
c is the sum of the capacitance of the piezoelectric element and the attached cable.
The sensitivity of the models based on PMN-PT and PZT are 28.38–52.03 mV/ms
−2 and 14.5–23.08 mV/ms
−2 in 0–1500 Hz, respectively, shown in
Figure 7. The sensitivity of the model based on PMN-PT is 95% higher than that of the model based on PZT, indicating that PMN-PT can significantly improve the sensitivity of the PE transducer model.
2.1.3. Different Structural Models
Central compressed structure based on thickness deformation has been widely used in PE transducers. In this simulation, a central compressed model (schematic in
Figure 8) is compared with the simply supported beam model. The piezoelectric element of the models is PMN-PT of 10 mm × 10 mm × 1 mm and the Mass is 10 mm × 10 mm × 5 mm.
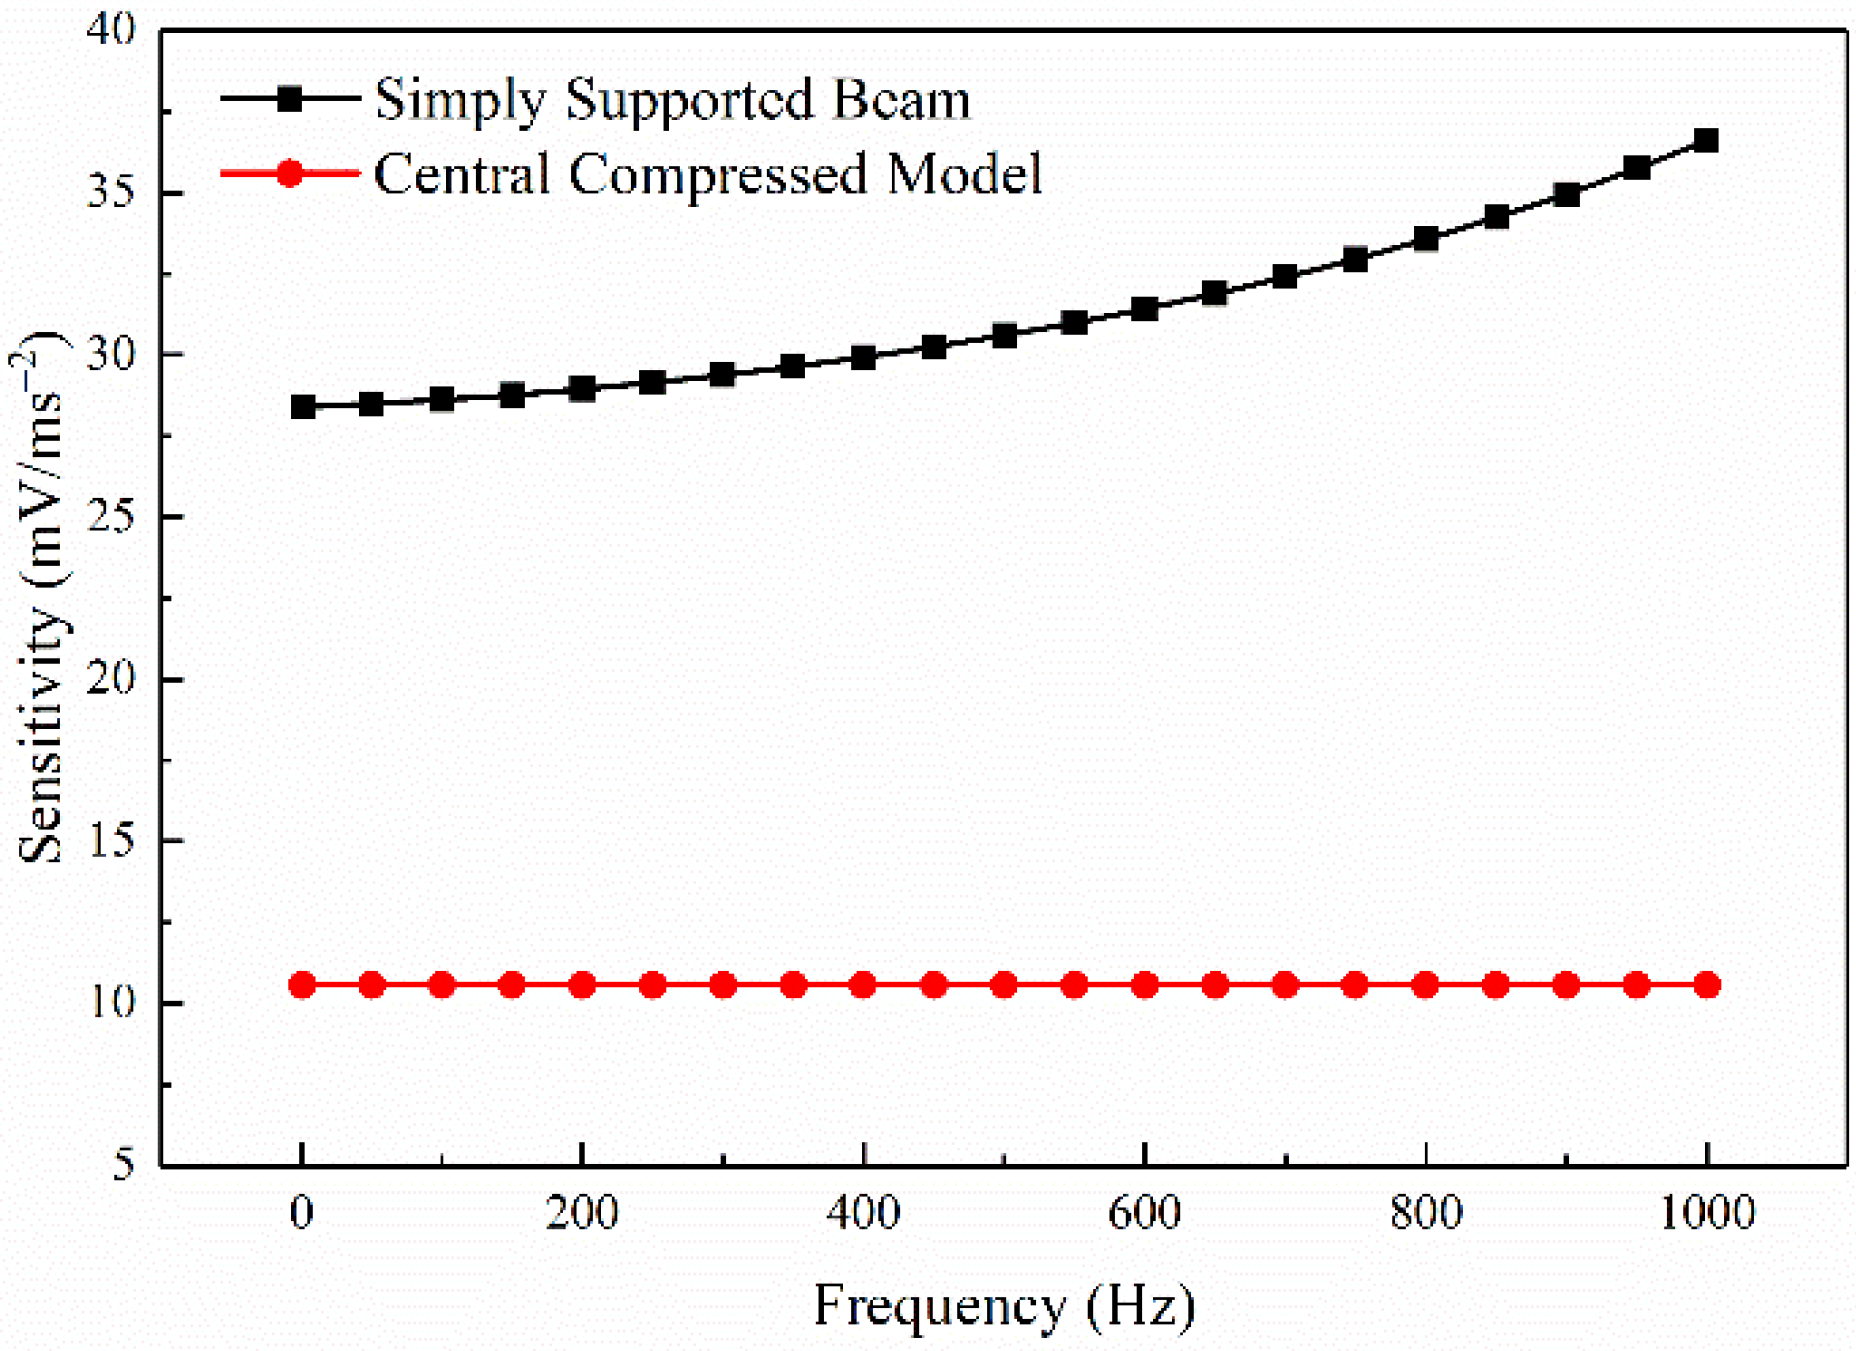
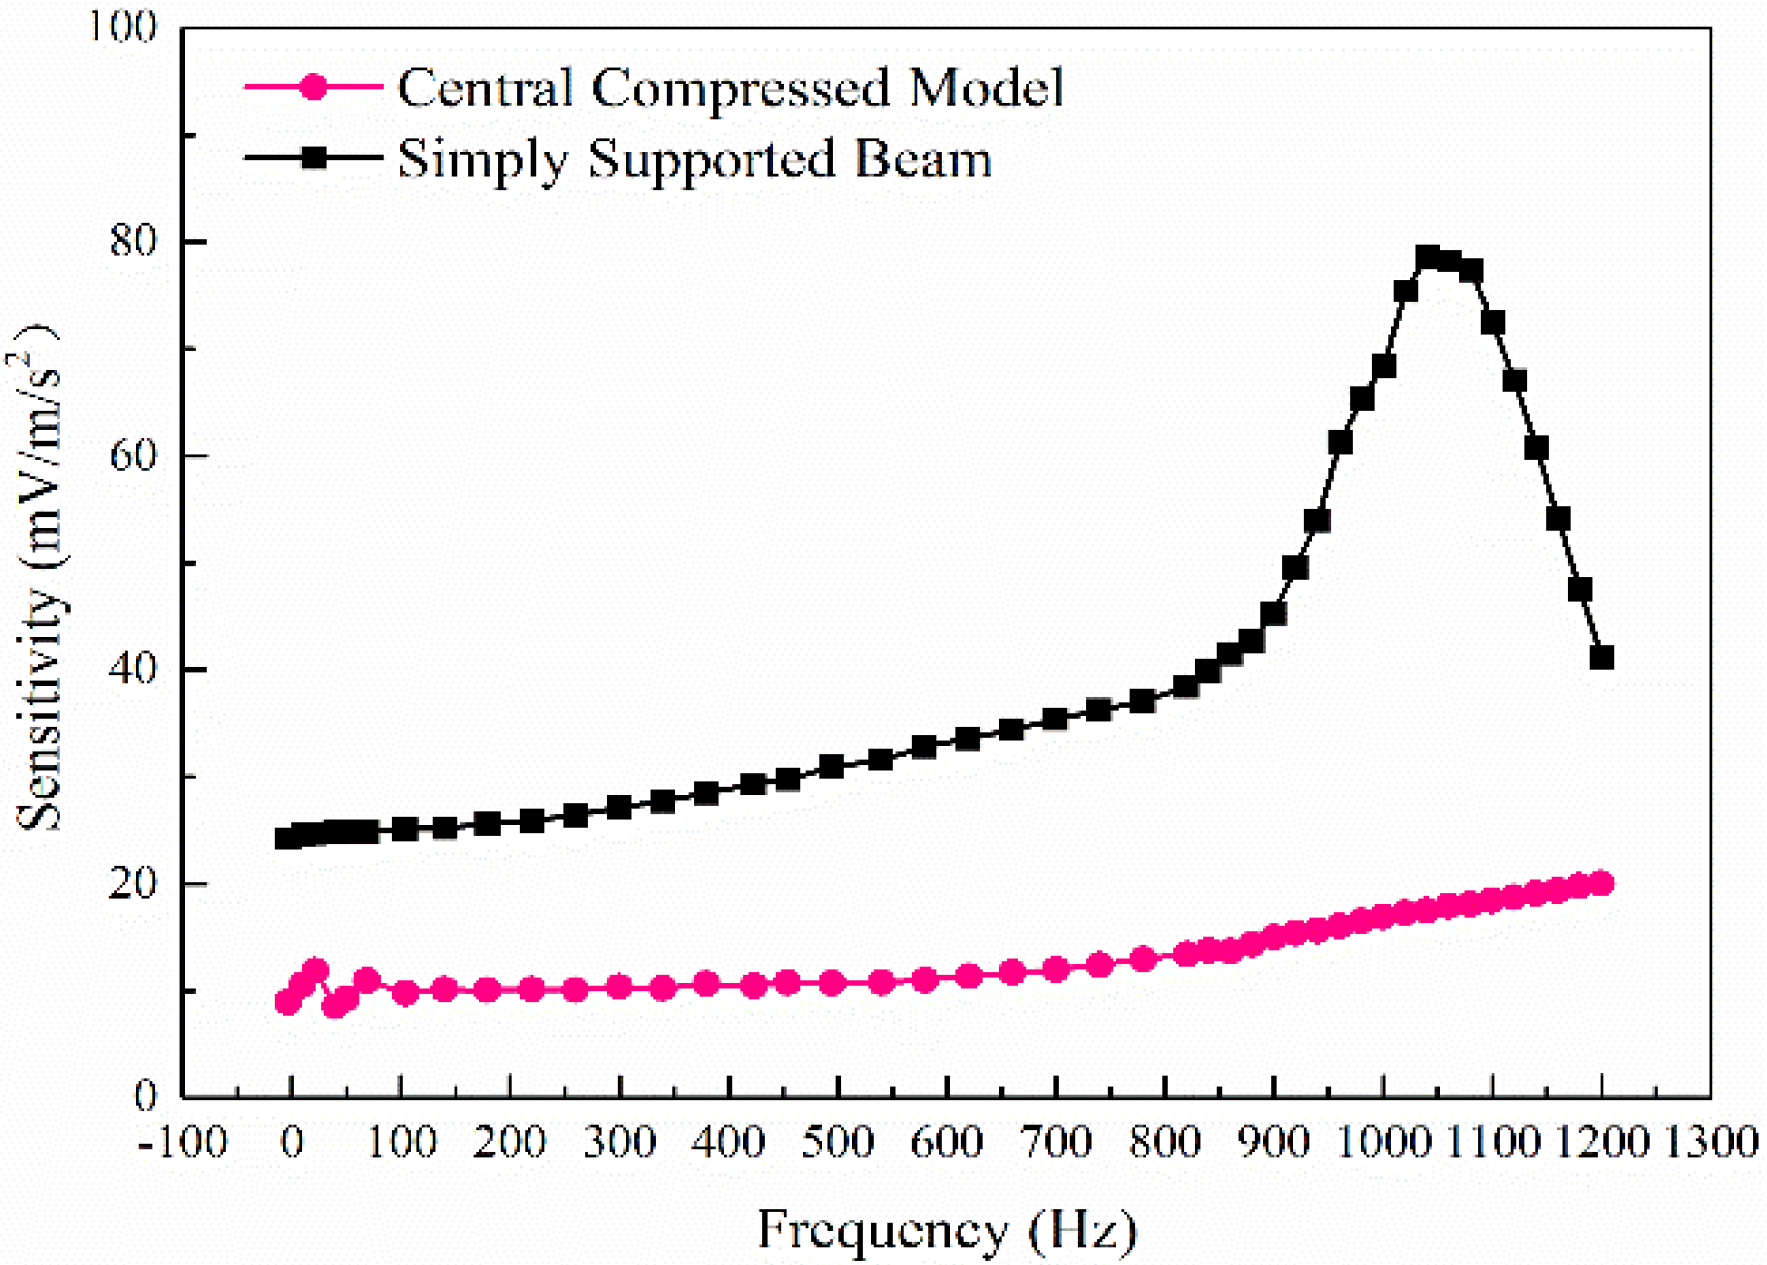
Figure 9 shows that the sensitivity of the simply supported beam model and the central compressed model is 28.38–36.61 mV/ms
−2 and 10.56–10.57 mV/ms
−2 in 0–1000 Hz, respectively. It can be seen from the sensitivity of the simply supported beam for the same vibration is twice more than that of the central compressed structure. The construction of the simply supported beam provides mechanical amplification of motion giving the high values of the sensitivity of the PE transducer. Due to the high resonance frequency and low sensitivity of the central compressed model, its sensitivity is relatively stable within 1–1000 Hz, while the sensitivity of the simply supported beam increases as the frequency. Seismic wave signals have a loss in the process of propagation, and the higher the frequency of the seismic wave combines the greater the amplitude attenuation [
34]. The sensitivity of the piezoelectric simply supported beam model increases with the increase of frequency under a certain acceleration, which can compensate for the attenuation of the seismic wave amplitude with frequency to a certain extent.
The above multiple simulation results show that the piezoelectric simply supported beam can be used to improve the sensitivity of a seismic PE transducer. The response of the piezoelectric simply supported beam with PMN-PT to vibration is better than the PZT-5A, which is 95% higher than that of the PZT model. And the sensitivity of the simply supported beam at the same vibration is twice larger than that of the commonly used central compressed structure.
2.2. The Analog Circuit–Charge Conversion, Filtering, and Amplification
2.2.1. Charge Conversion Circuit
The charge conversion circuit (
Figure 10) converts the high-impedance charge signal output by the piezoelectric transducer into a low-impedance voltage signal. The advantage is that the output voltage is only related to the magnitude of the charge Q and the value of the feedback capacitor
Cf, the output voltage:
The operational amplifier uses TL084, the feedback capacitor Cf uses CB10 polystyrene film capacitor with Cf = 1000 pF, and feedback resistance Rf = 1 GΩ. The adjustable DC balancing resistor R3 is to reduce the offset current and offset voltage. The purpose of parallel capacitor C2 at both ends of R1 is to realize phase compensation and to avoid the self-excited oscillation caused by the pole formed of the R1 and the input capacitor of the op-amp, and R1 ≈ R3. C1 is a DC blocking capacitor, which is used to isolate the DC offset of the seismic accelerometer; R2, R4, and R5 form a T-type resistor network, which is equivalent to obtain a feedback resistance of 1 GΩ at both ends of R2 and R5.
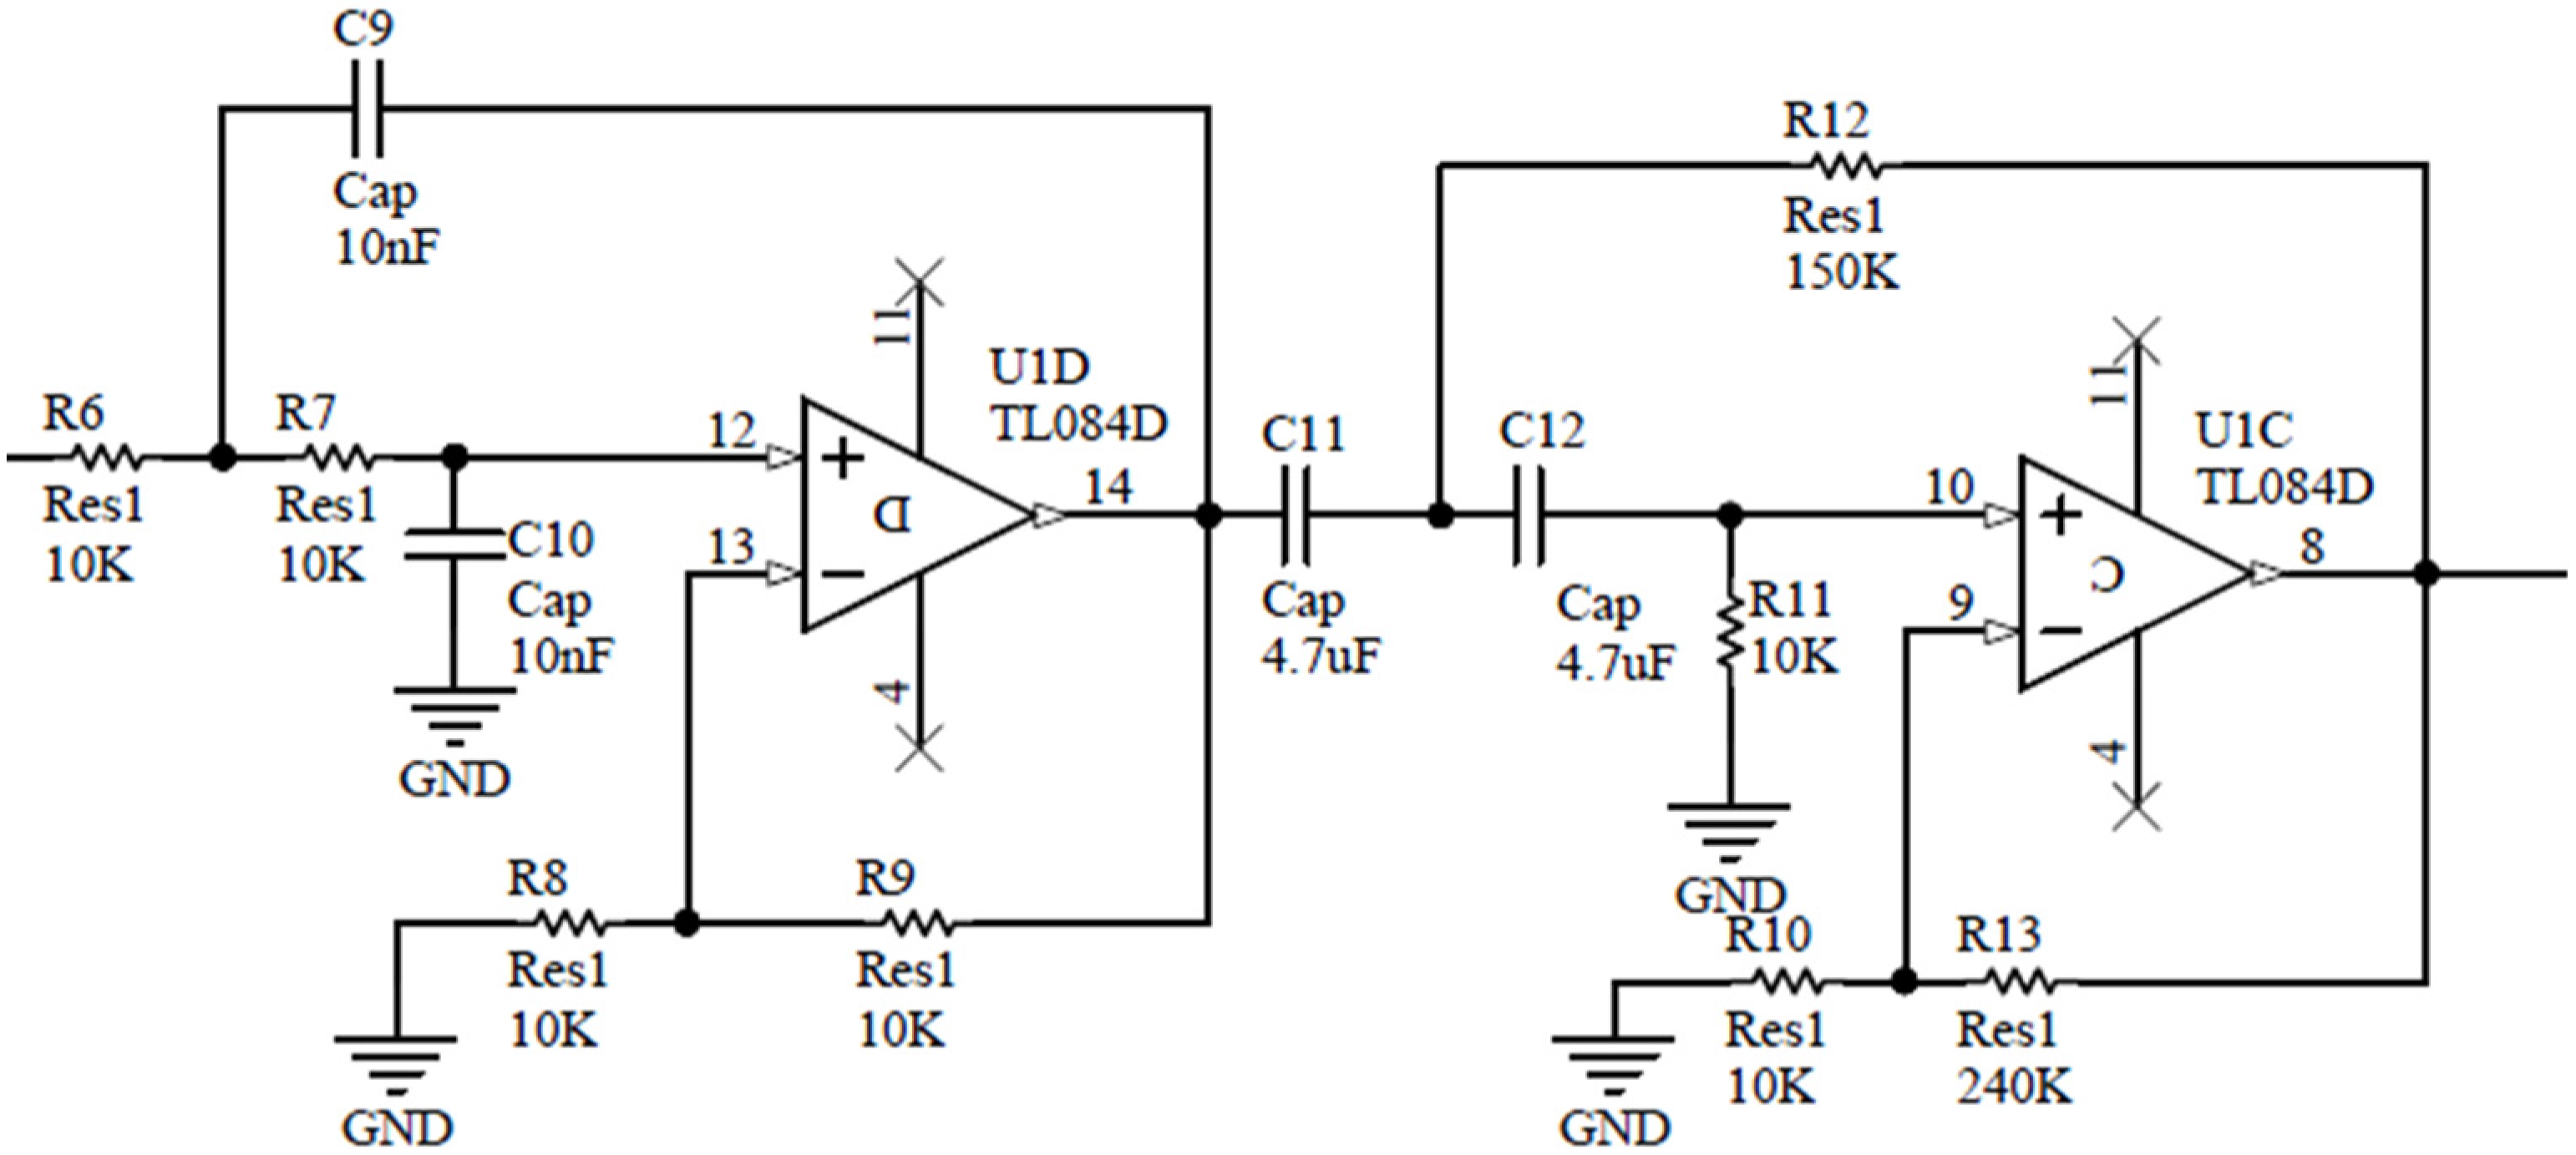
2.2.2. Filter and Amplifier Circuit
The piezoelectric accelerometer is a weakly damped vibration system, so its amplitude-frequency characteristic has a strong resonance peak in the high-frequency band, which introduces a lot of high-frequency noise, causing great interference or even distortion to the signal. Therefore, this paper designs a Butterworth second-order low-pass filter to extract useful low-frequency effective signals. According to the bandwidth of a PE transducer, the cut-off frequency is set as 1.5 kHz and the amplification gain is 2. Based on the characteristics of the Butterworth filter, the quality factor is set as 0.707, the capacitance
C9 =
C10 is 10 nF, the low-pass cut-off frequency of the circuit is dependent on its RC time constant according to the following relationship:
R6 =
R7 is calculated as 10 kΩ; Set
R8 =
R9 as 10 kΩ and the gain is 2, as shown in
Figure 11.
Due to various reasons, the circuit is prone to zero drift when the charge is converted into a voltage. Thus, this paper designs a high-pass filter after the low-pass filter circuit to filter out the unnecessary DC part of the circuit. In addition, the filter circuit must also have the function of output amplification. After the signal is amplified to a reasonable range, data acquisition is performed. The input impedance of the non-inverting amplifier is high, but the output impedance is low. It has relatively little effect on the output signal. Hence, the non-inverting proportional amplifier is used in the paper, and the circuit schematic diagram is shown in
Figure 11.
Set the cut-off frequency of the high-pass filter as 1 Hz to collect more low-frequency signals, then calculated the results as
C11 =
C12 = 4.7 μF, and
R11 = 10 kΩ,
R12 = 150 kΩ. The op-amp TL084 and resistors
R10 and
R13 form the non-inverting amplifier circuit. The output gain of the entire circuit can be changed by changing the gain of the non-inverting amplifier circuit, and the output signal can be guaranteed to maintain in-phase with the piezoelectric transducer. For piezoelectric transducers with different sensitivities, a suitable magnification should be selected to adapt the output range. Thus,
R13 is set as an adjustable resistor, and the magnification can be adjusted according to actual needs. According to the equation of gain (Equation (5)), the corresponding resistance values of
R13 and
R12 can be calculated.
The overall gain of the circuit is mainly achieved through the gain of this stage (i.e., U1C TL084D), and this gain needs to be designed based on two factors: the maximum expected voltage that the PE transducers generated and the maximum voltage that the ADC support (5 V in our case). For example, when the gain is set to 25, then R12 = 10 kΩ and R13 = 240 kΩ. Then the PCB board is made for a smaller seismic accelerometer.
2.3. The FPGA and ADC—Sampling and Digitization
After the raw seismic signal is converted, filtered, amplified, and further sampled and quantized with a resolution of 24 bits/sample for digital transmission.
The voltage signal output by the amplifying circuit is converted from analog to digital by the ADC ADS1256 and sent to FPGA for data processing and transmission, including a process of saving the data to an SD card and sending the data to ZigBee to be wirelessly transmitted to the gateway in real-time.
The ADS1256 is a greatly low-noise, 24-bit analog-to-digital (A/D) converter, which can provide a data rate of up to 30 k samples per second (SPS) and an internal SPI serial interface to connect with FPGA.
The FPGA selected in this paper is the Cyclone IV series chip EP4CE6F17C8 of Altera Company, which provides 68 IO ports, 5 V power supply, 3.3 V power supply, multiple GND, 40-pin expansion port, and other resources.
The use of Verilog HDL programming to control ADS1256 can realize the sampling, processing, storage, and serial port transmission of seismic data. The flow chart of data processing is shown in
Figure 12.
For the visual display of the data and the convenience of subsequent processing, this paper converts the collected 24-bit data into decimal and then converts it into ASCII code for output.
During the hexadecimal conversion, the positive and negative values of the collected data are firstly judged, and then the hexadecimal results are calculated according to the following formula.
If the output is positive:
Else the output is negative:
The obtained hexadecimal results are decoded and converted into BCD code. Then the BCD code plus 48 to convert into an ASCII value and sent to the Zigbee module through the serial port.
4. Discussion
This paper has completed the design and experimental research of a seismic data acquisition system based on wireless transmission. The system successfully captured seismic data from the PE transducer and transmitted it wirelessly to the gateway unit in real-time.
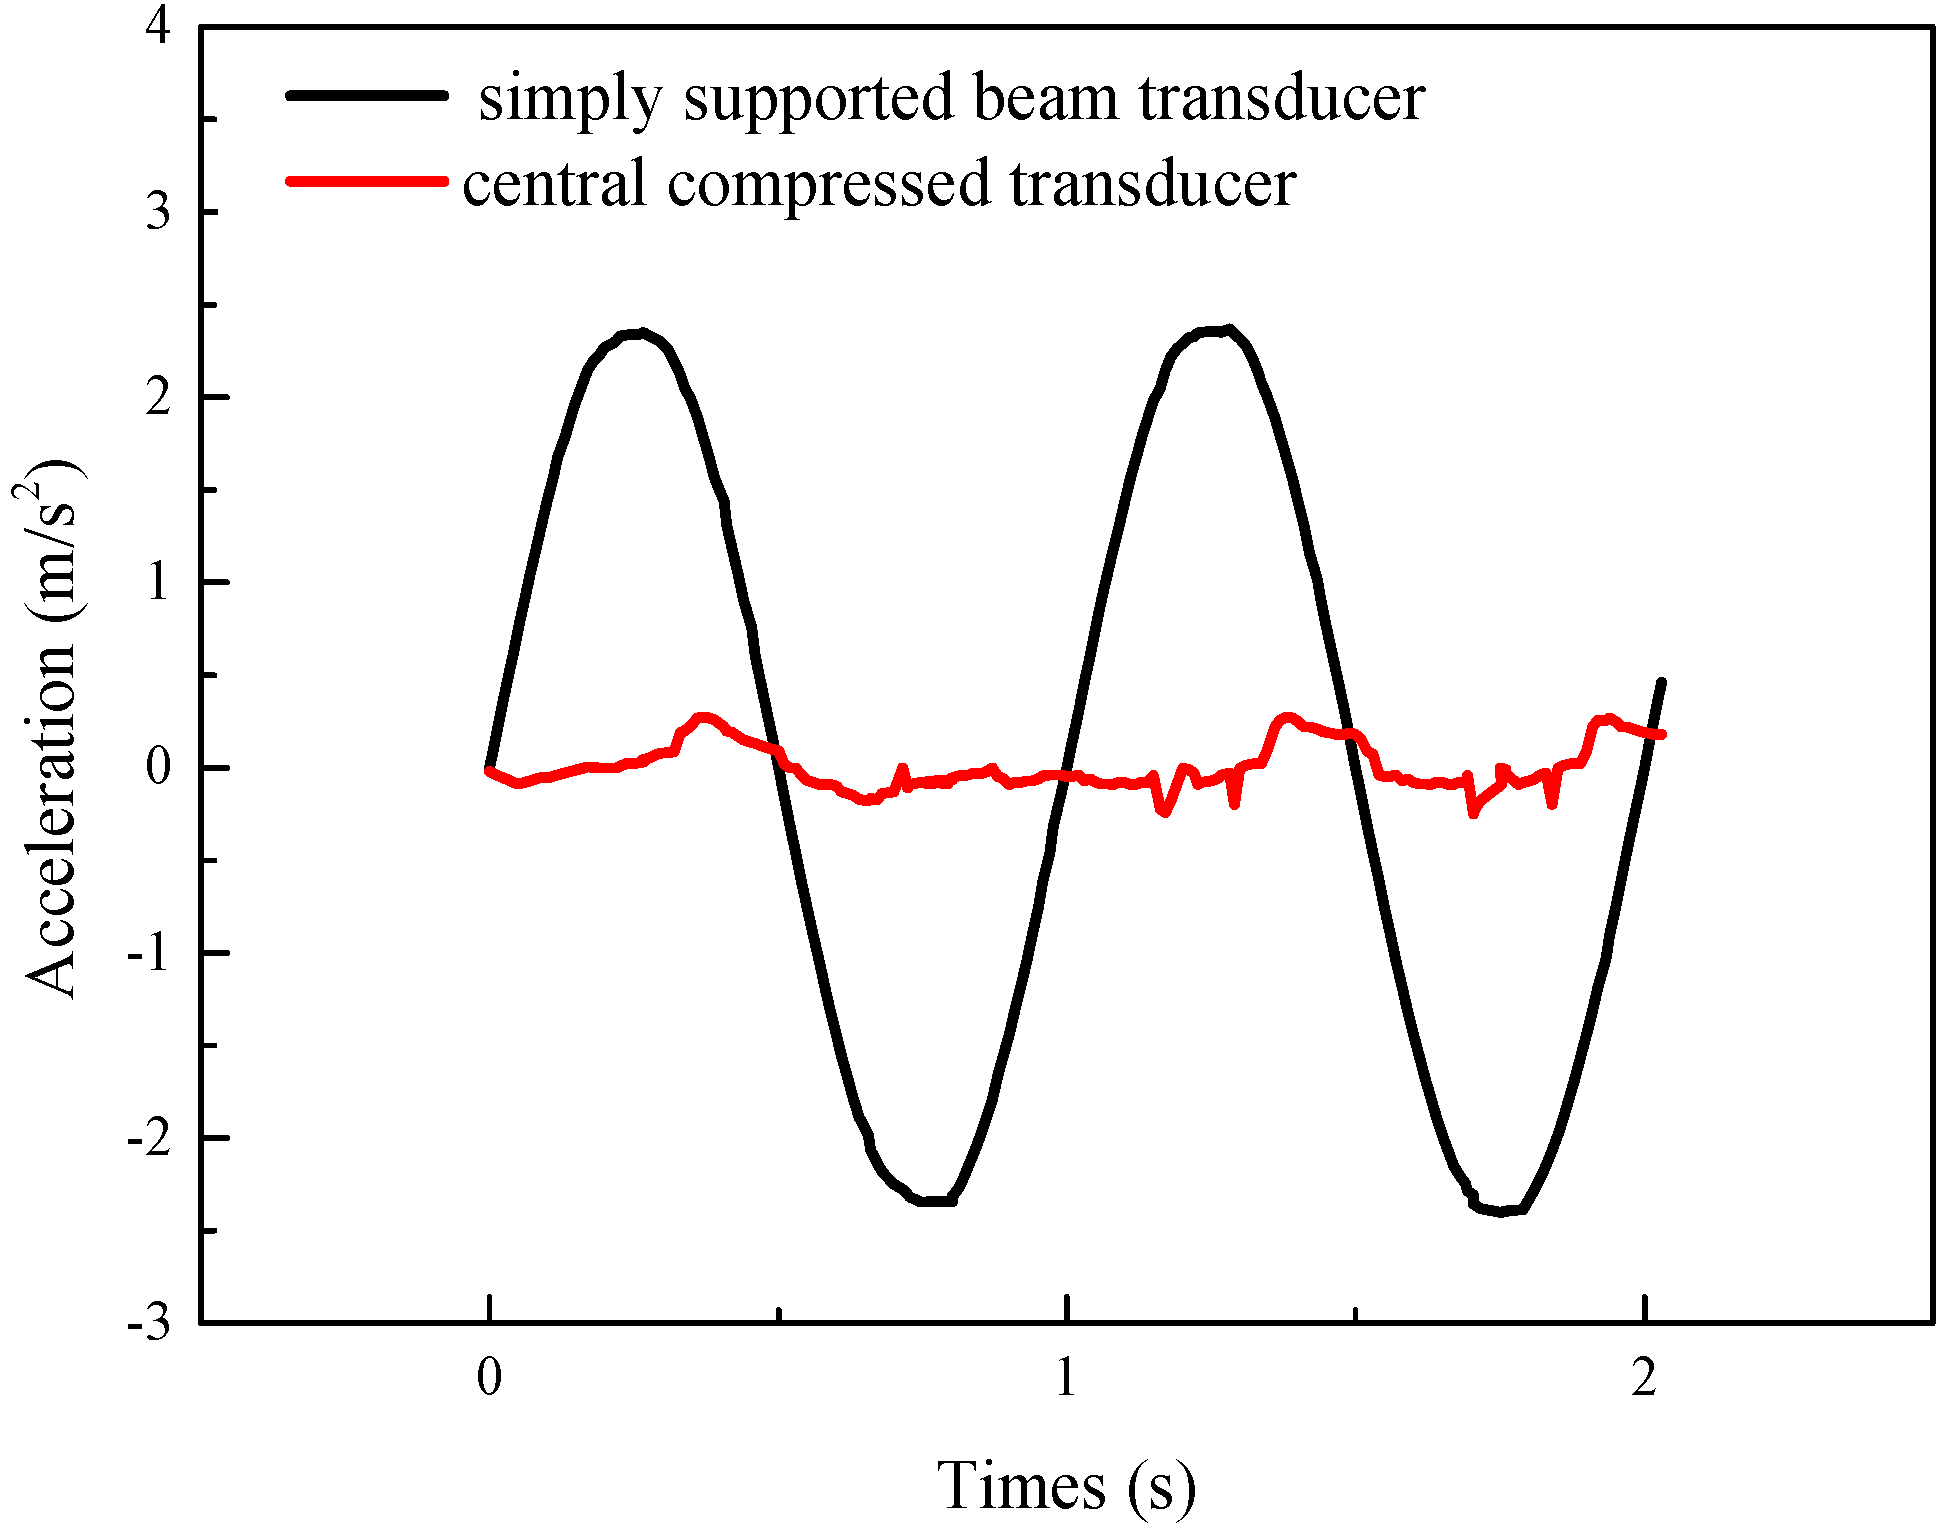
This paper proposes a PE transducer with a simply supported beam structure using PMN-PT as a piezoelectric element, which has high sensitivity, good low-frequency response performance, and is small in size. The simulation calculation and experimental study were carried out. The results showed that applying PMN-PT to the piezoelectric simply supported beam can increase the model sensitivity by more than 190%, compared to using PZT materials. The sensitivity of the simply supported beam model is higher than that of the commonly used central compressed structure. The fidelity of the simply supported beam is better than that of the central compressed structure under the vibration of low frequencies, indicating that a seismic piezoelectric accelerometer based on the piezoelectric simply supported beam has a wider frequency band and a higher sensitivity.
The piezoelectric transducer converts the vibration signal into an electrical charge signal, and the charge conversion circuit converts it into the voltage signal. After the voltage signal is filtered and amplified, it is collected by an ADC and FPGA to digitize the acceleration signal, which achieves the functions of data acquisition and data transmission of the seismic data acquisition system. The wireless transmission network sends the FPGA data to the monitoring centre to analyse and process the signal for real-time monitoring and measurement.
Further works should be focused on completing a three-component digital accelerometer and a hybrid wireless transmission network based on ZigBee and WiFi.


 ,
, 


