
Sound Detection Monitoring Tool in CNC Milling Sounds by K-Means Clustering Algorithm


Abstract
:1. Introduction
2. Proposed System and Methodology for Sound Detection Monitoring Tool in CNC Milling Sounds
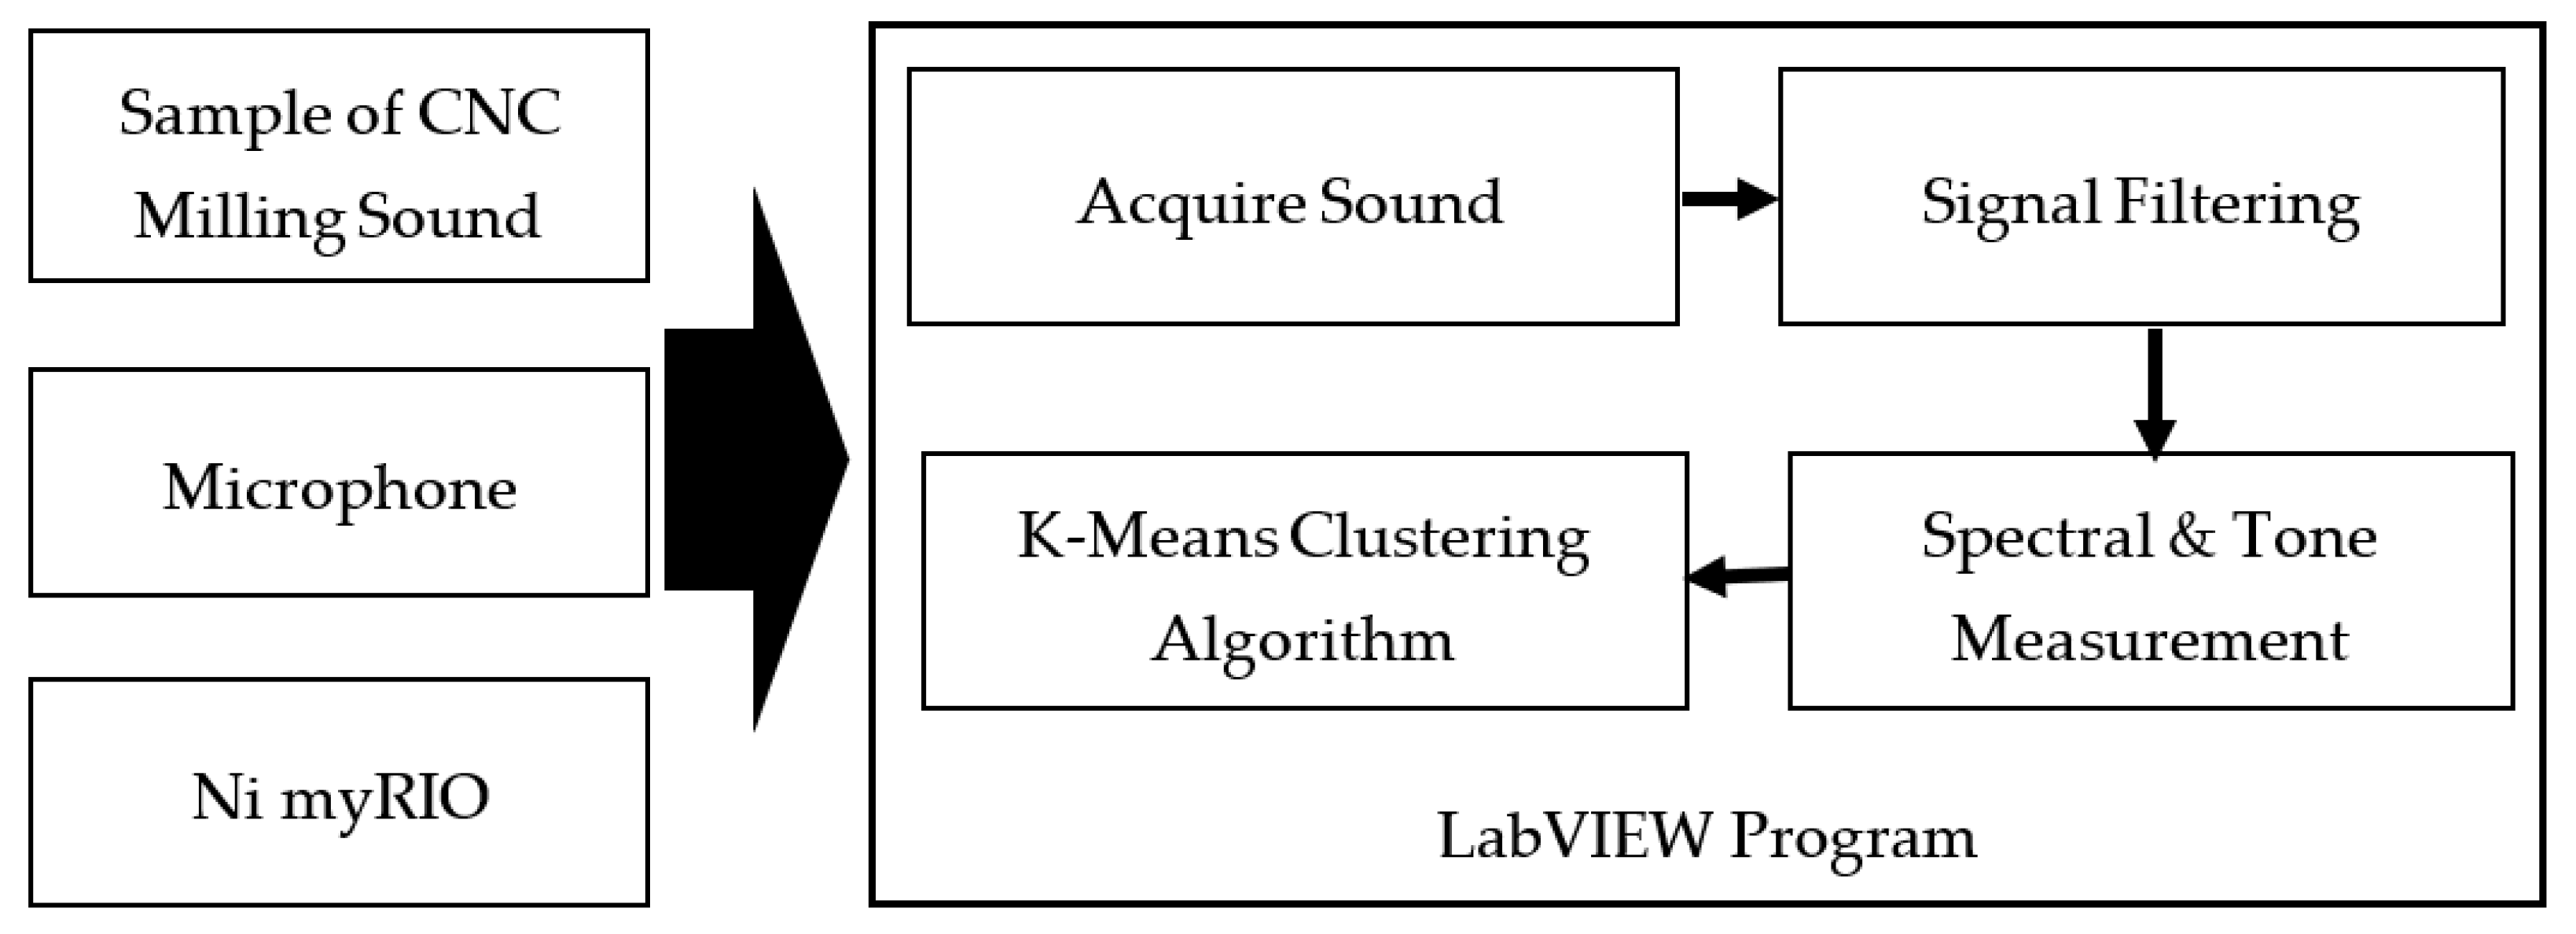
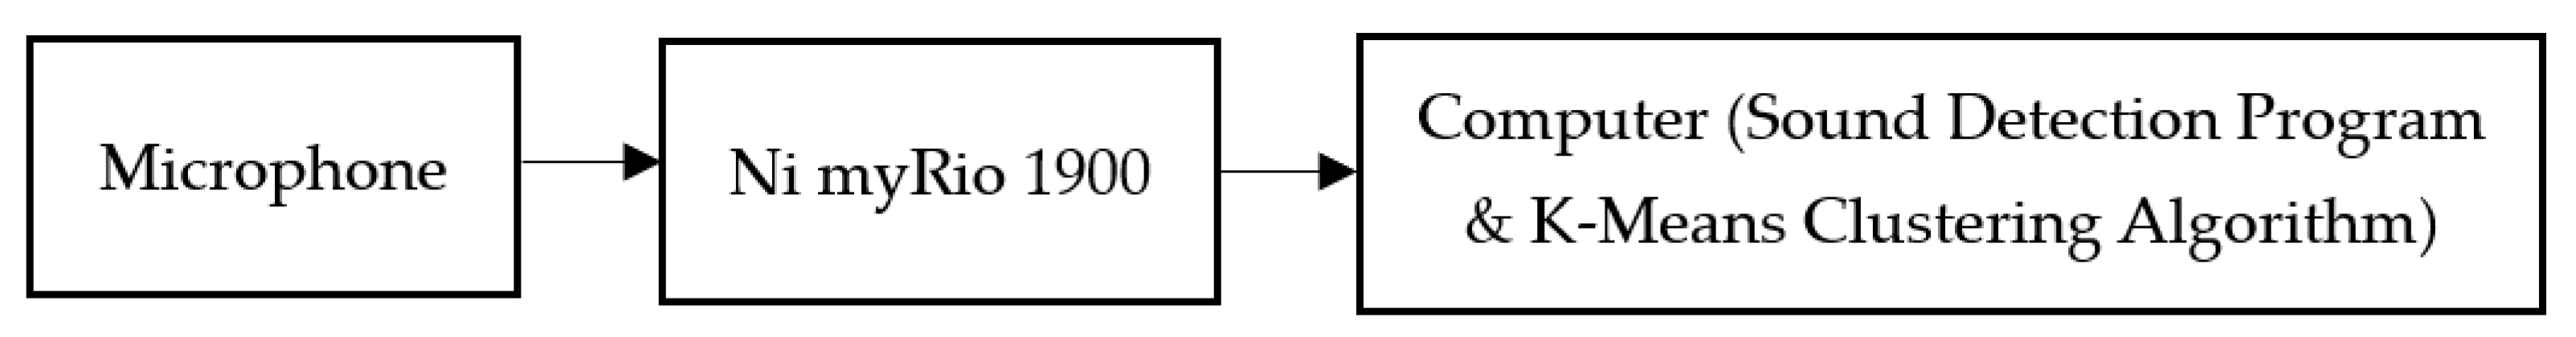
2.1. Block Diagram of Sound Detection Monitoring and Analysis System
2.2. Instrument Design and Experimental Setup
2.2.1. Sound Detection for Hardware Acquisition
- Microphone
- myRIO (National Instrument)
2.2.2. Sound Detection for Software Design
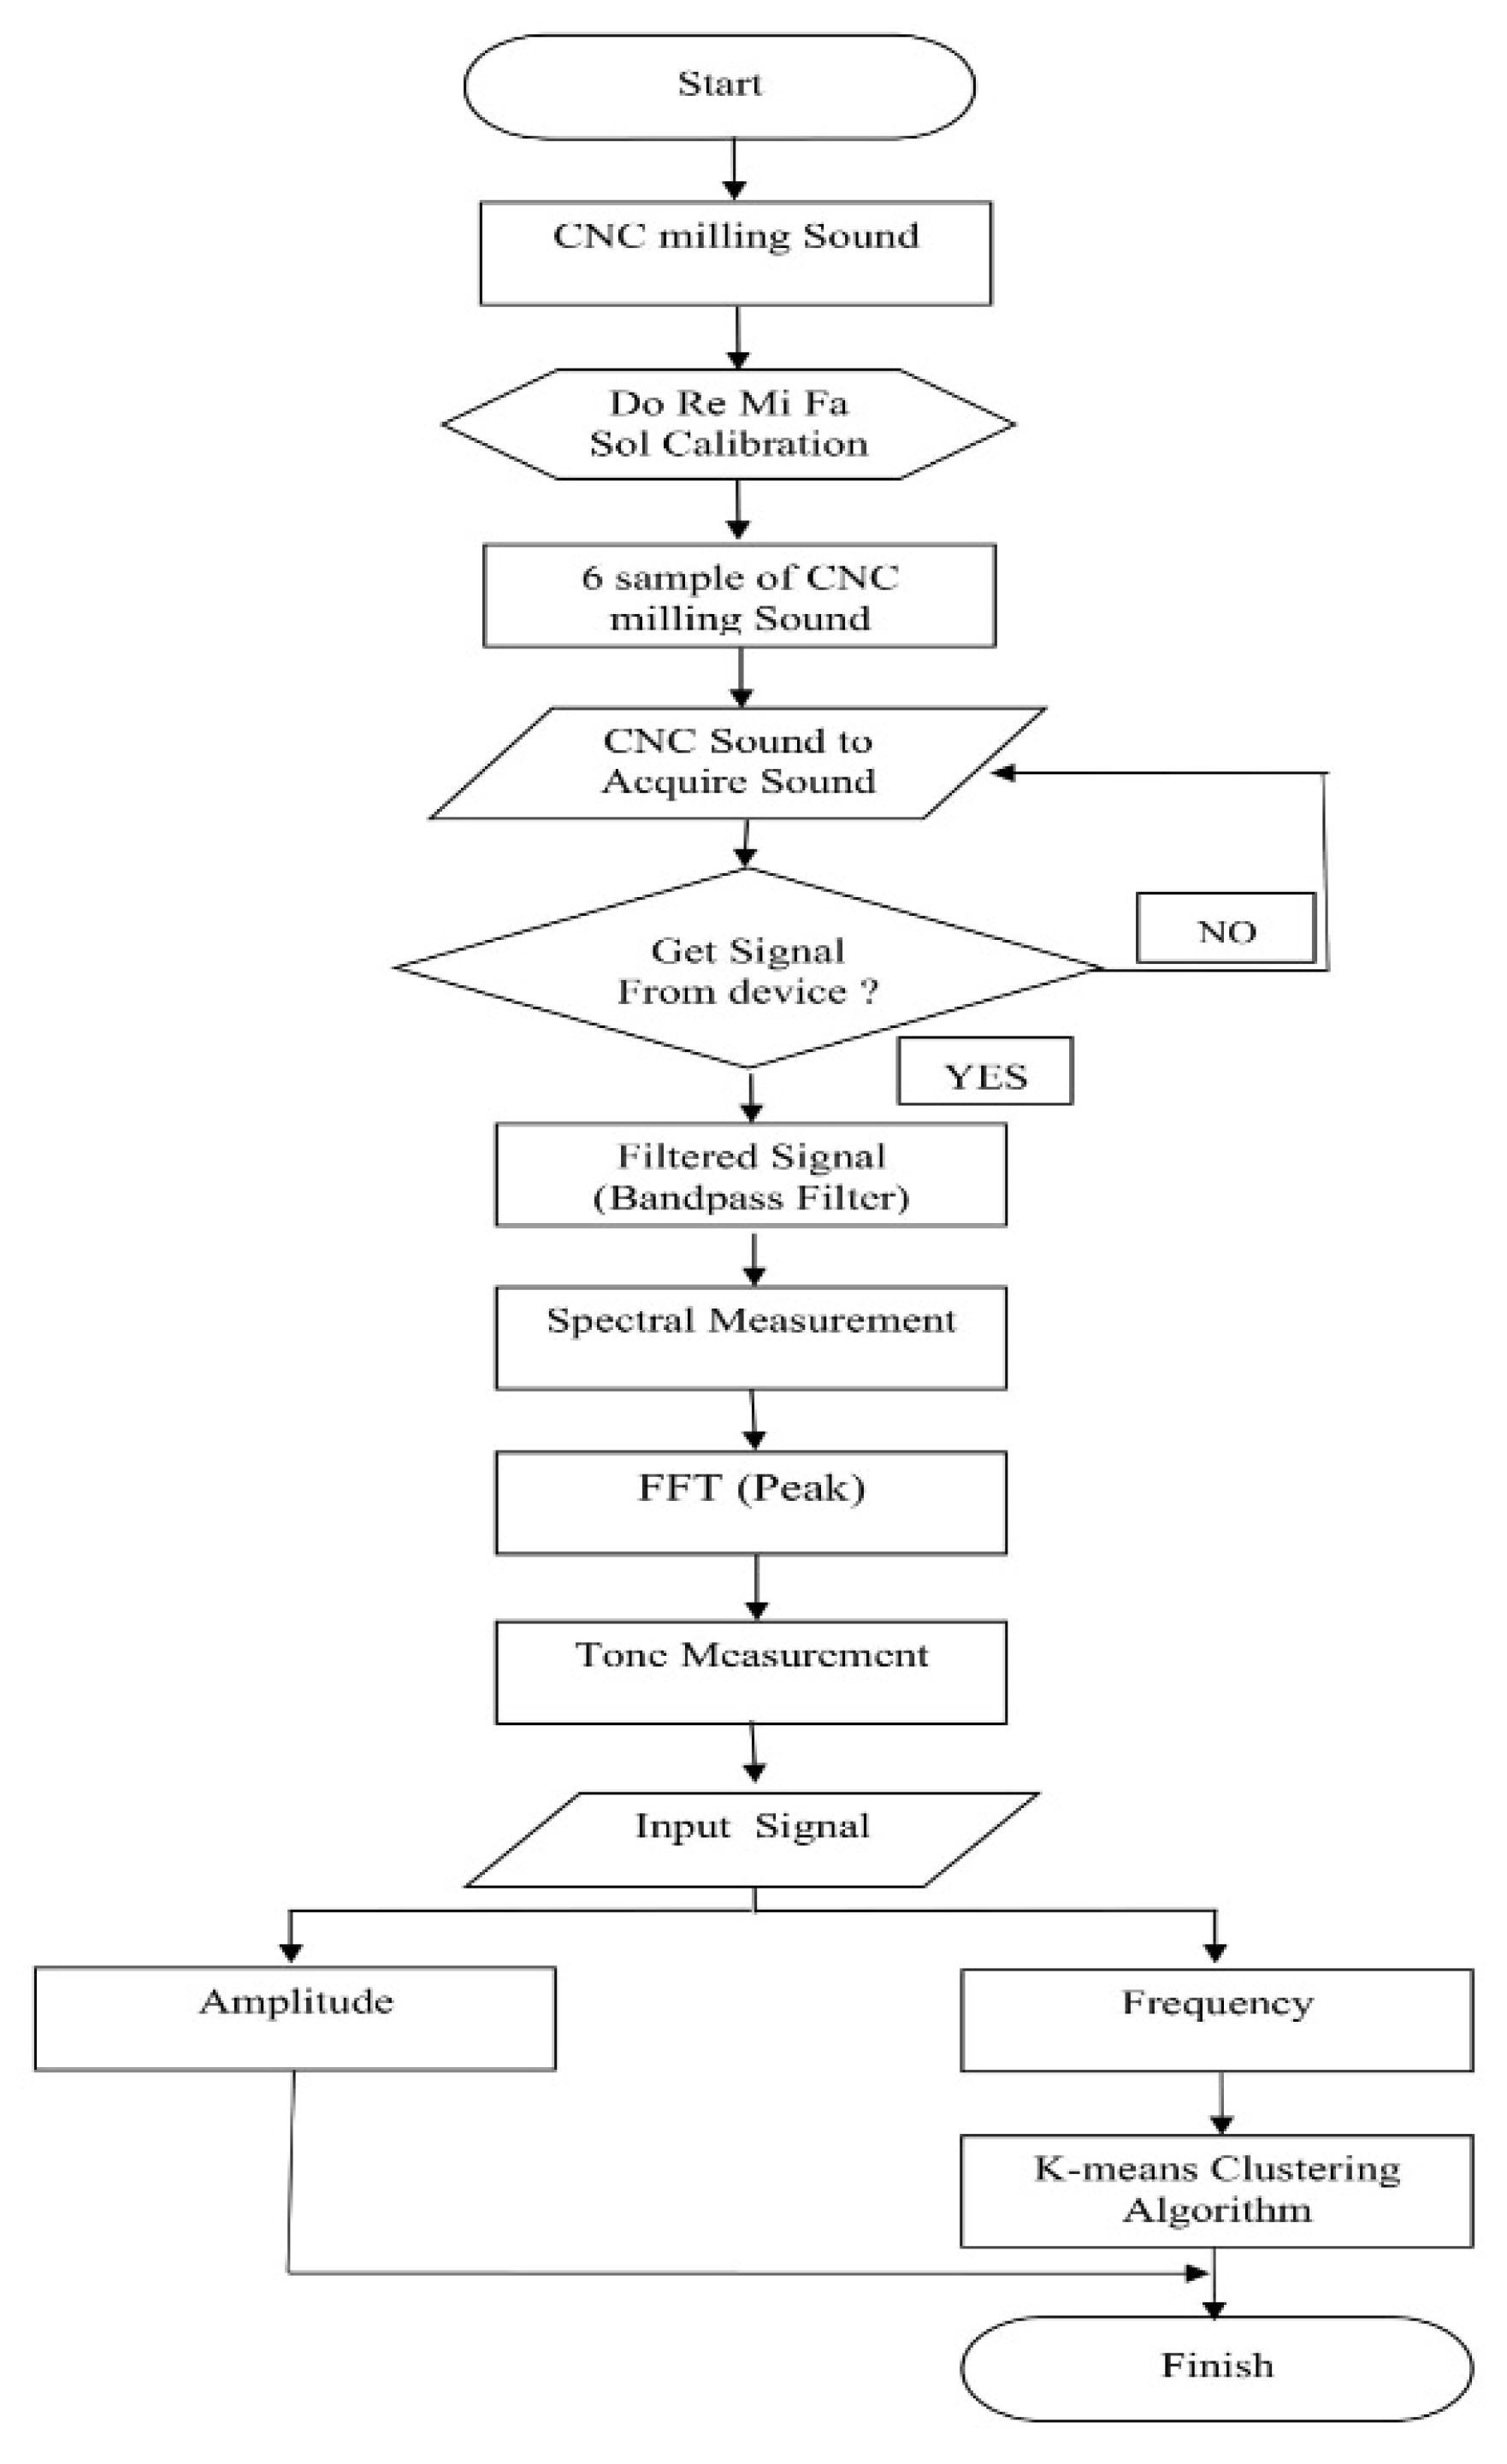
2.2.3. Flowchart Diagram Implementation
2.3. CNC Milling Sounds by Signal Process
2.3.1. Signal Filtering by Butterworth Filter
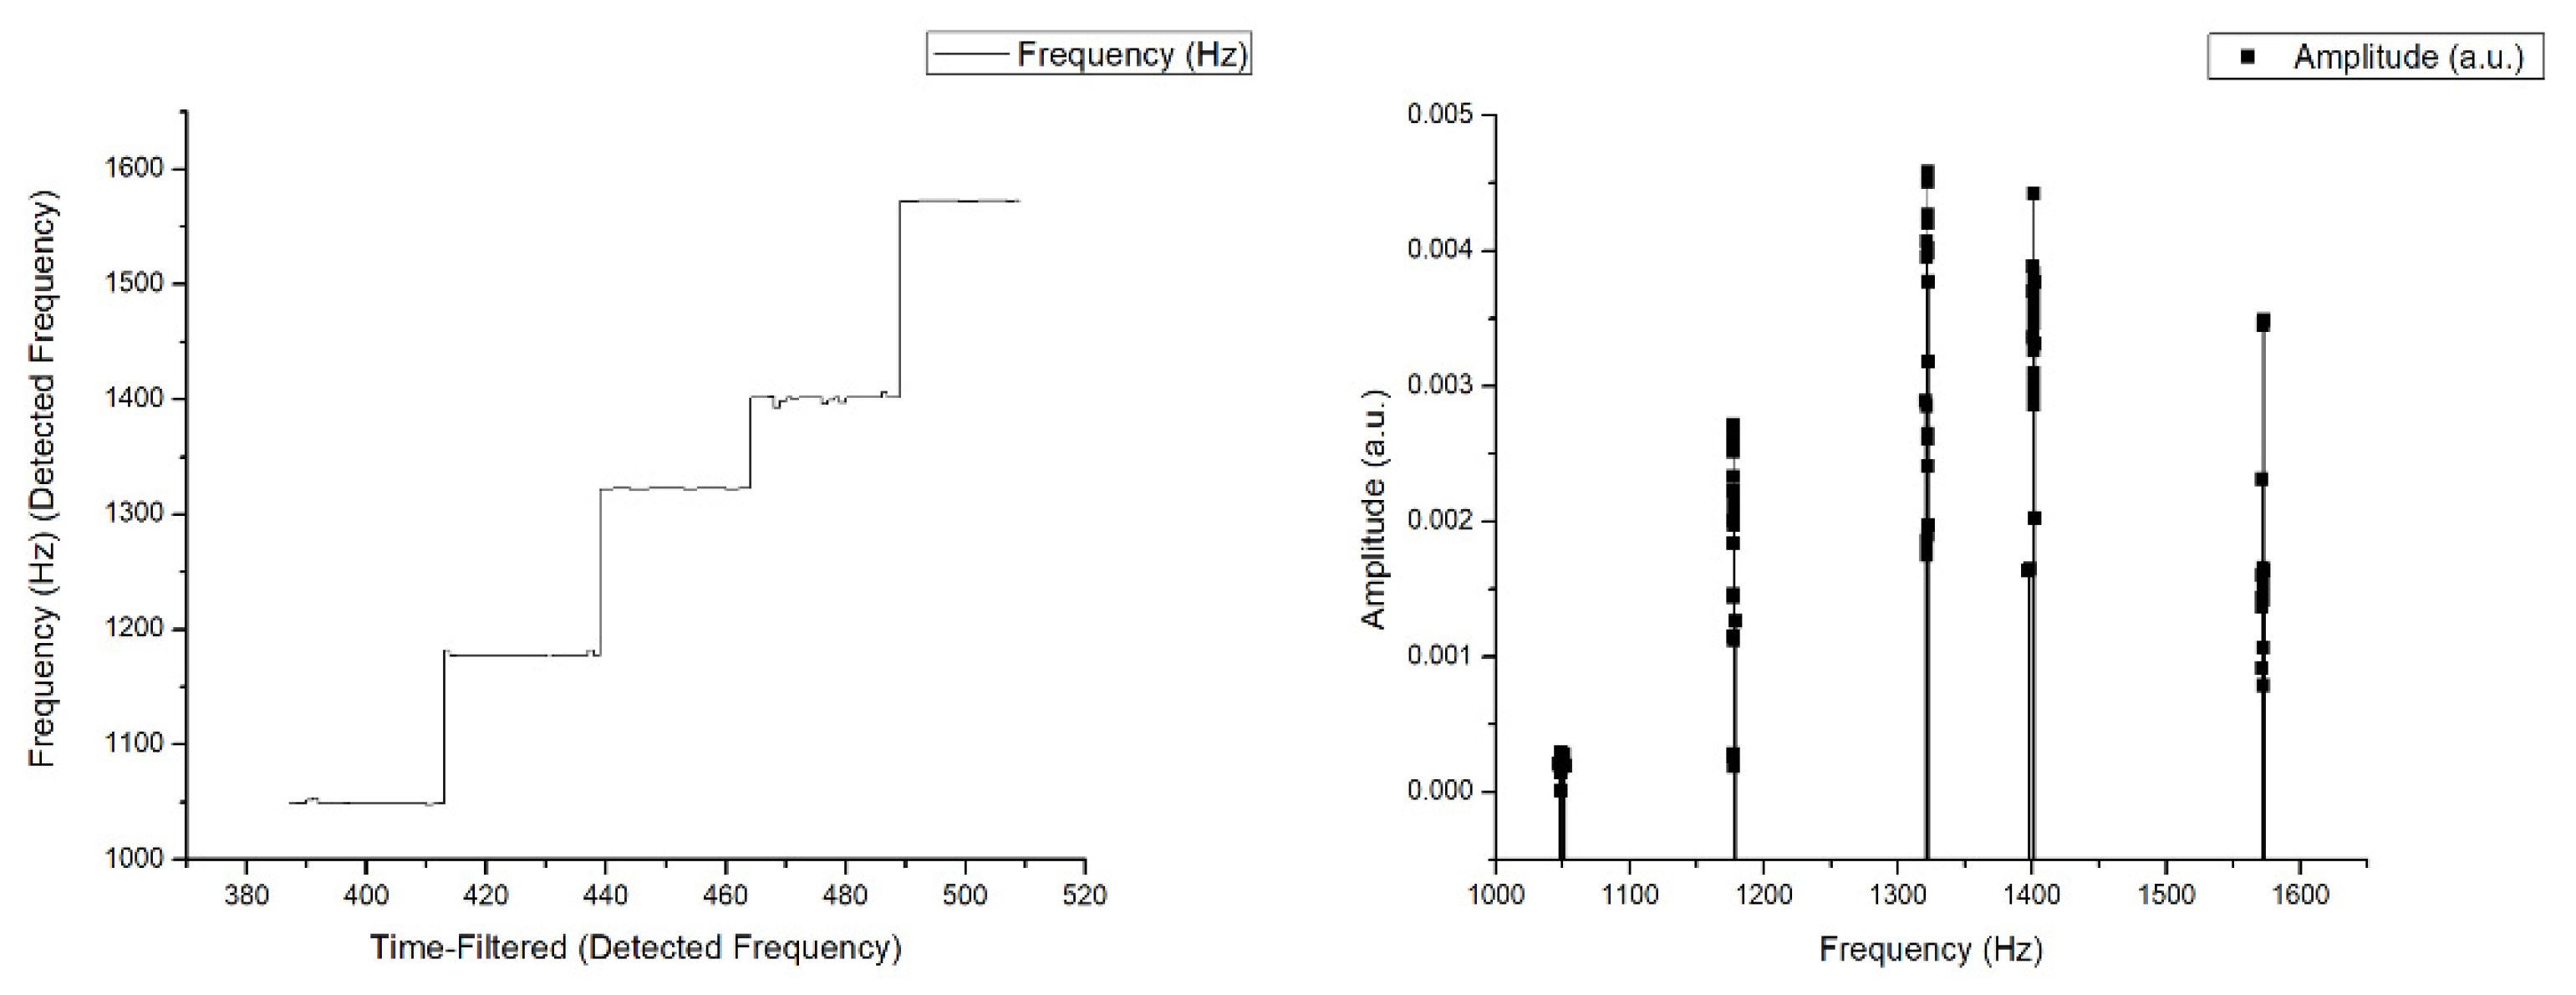
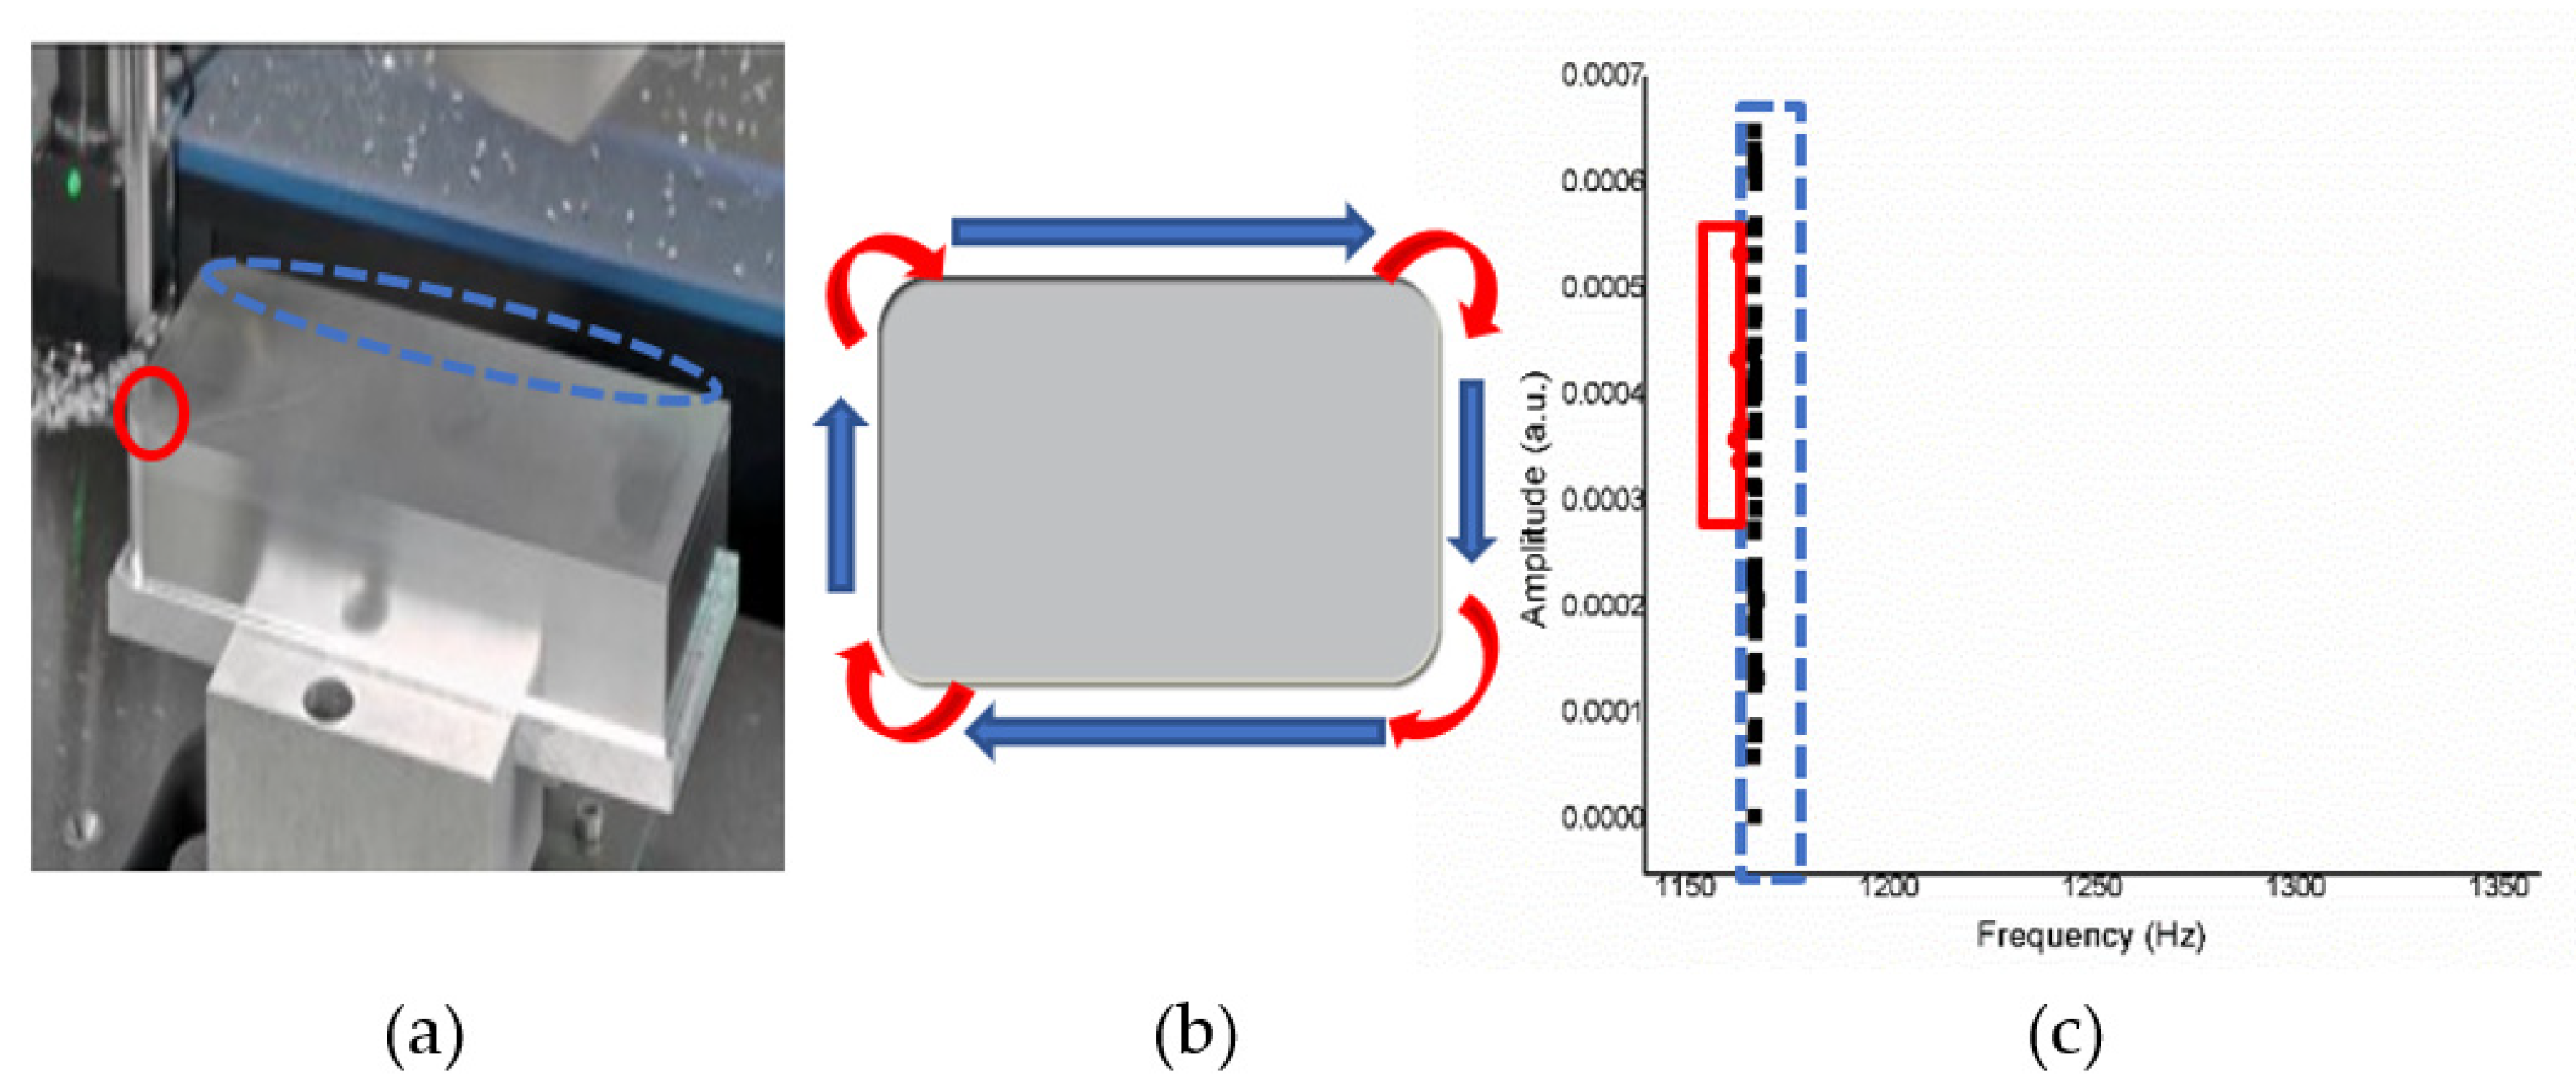
2.3.2. Spectral Measurement
2.3.3. Resonant Frequency and Amplitude by Fast Fourier Transform
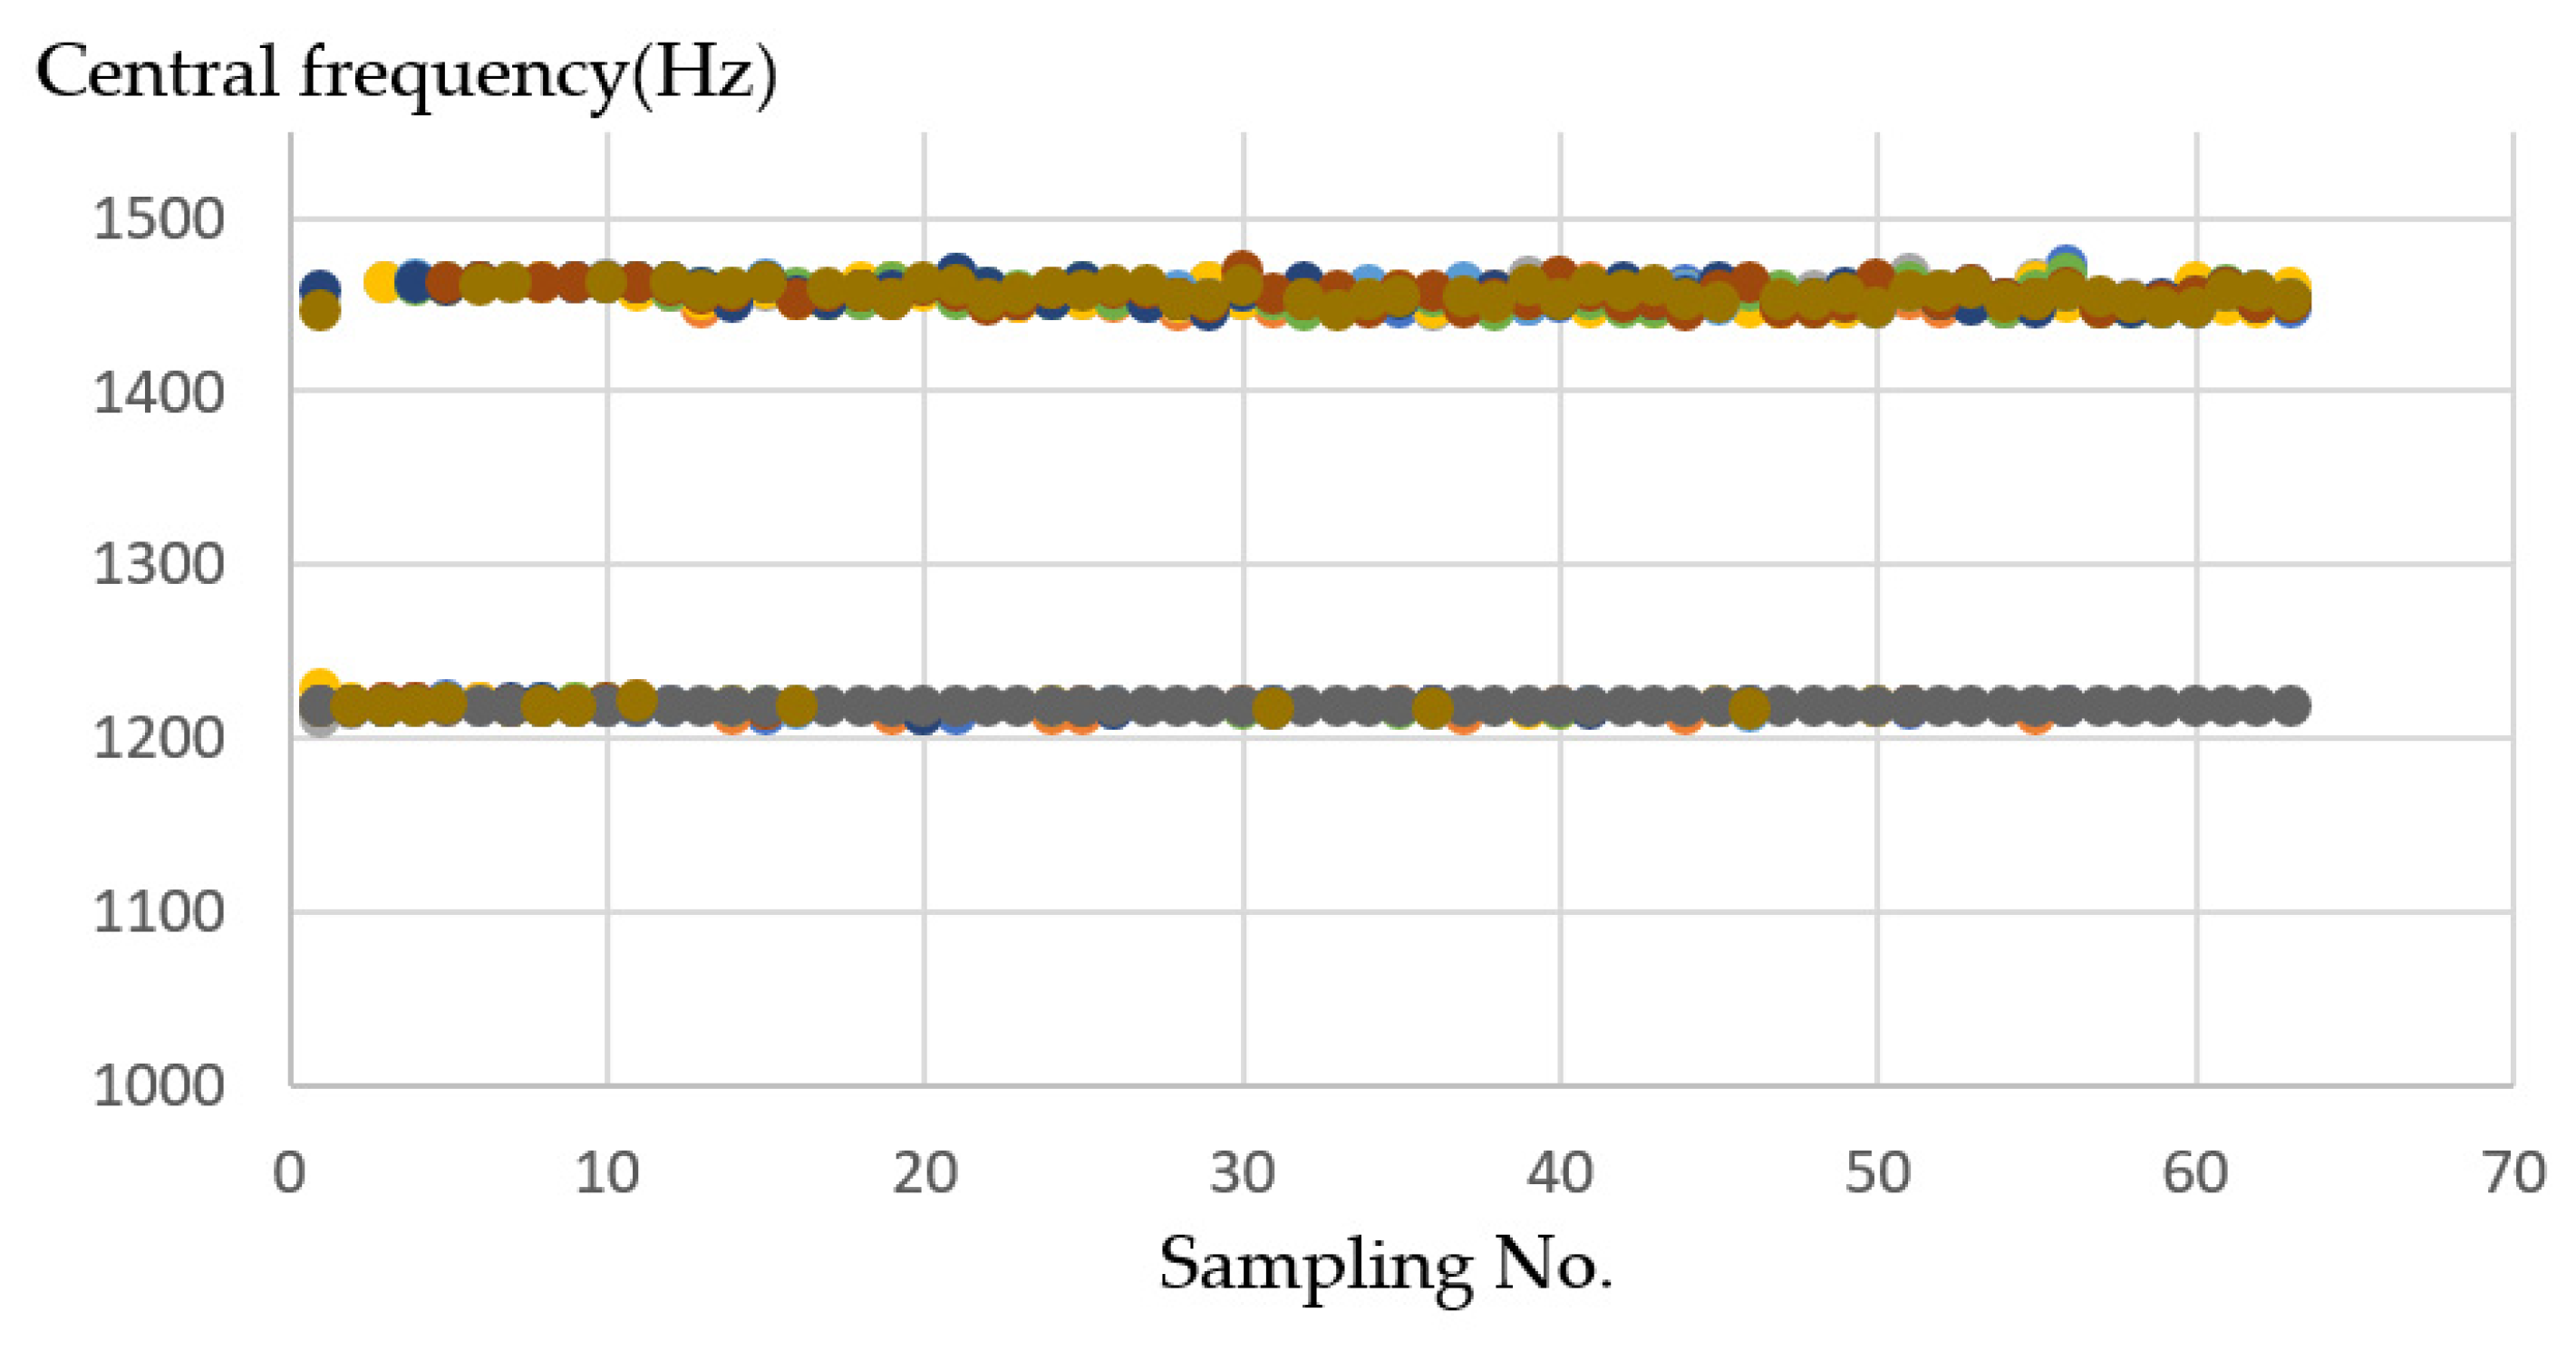
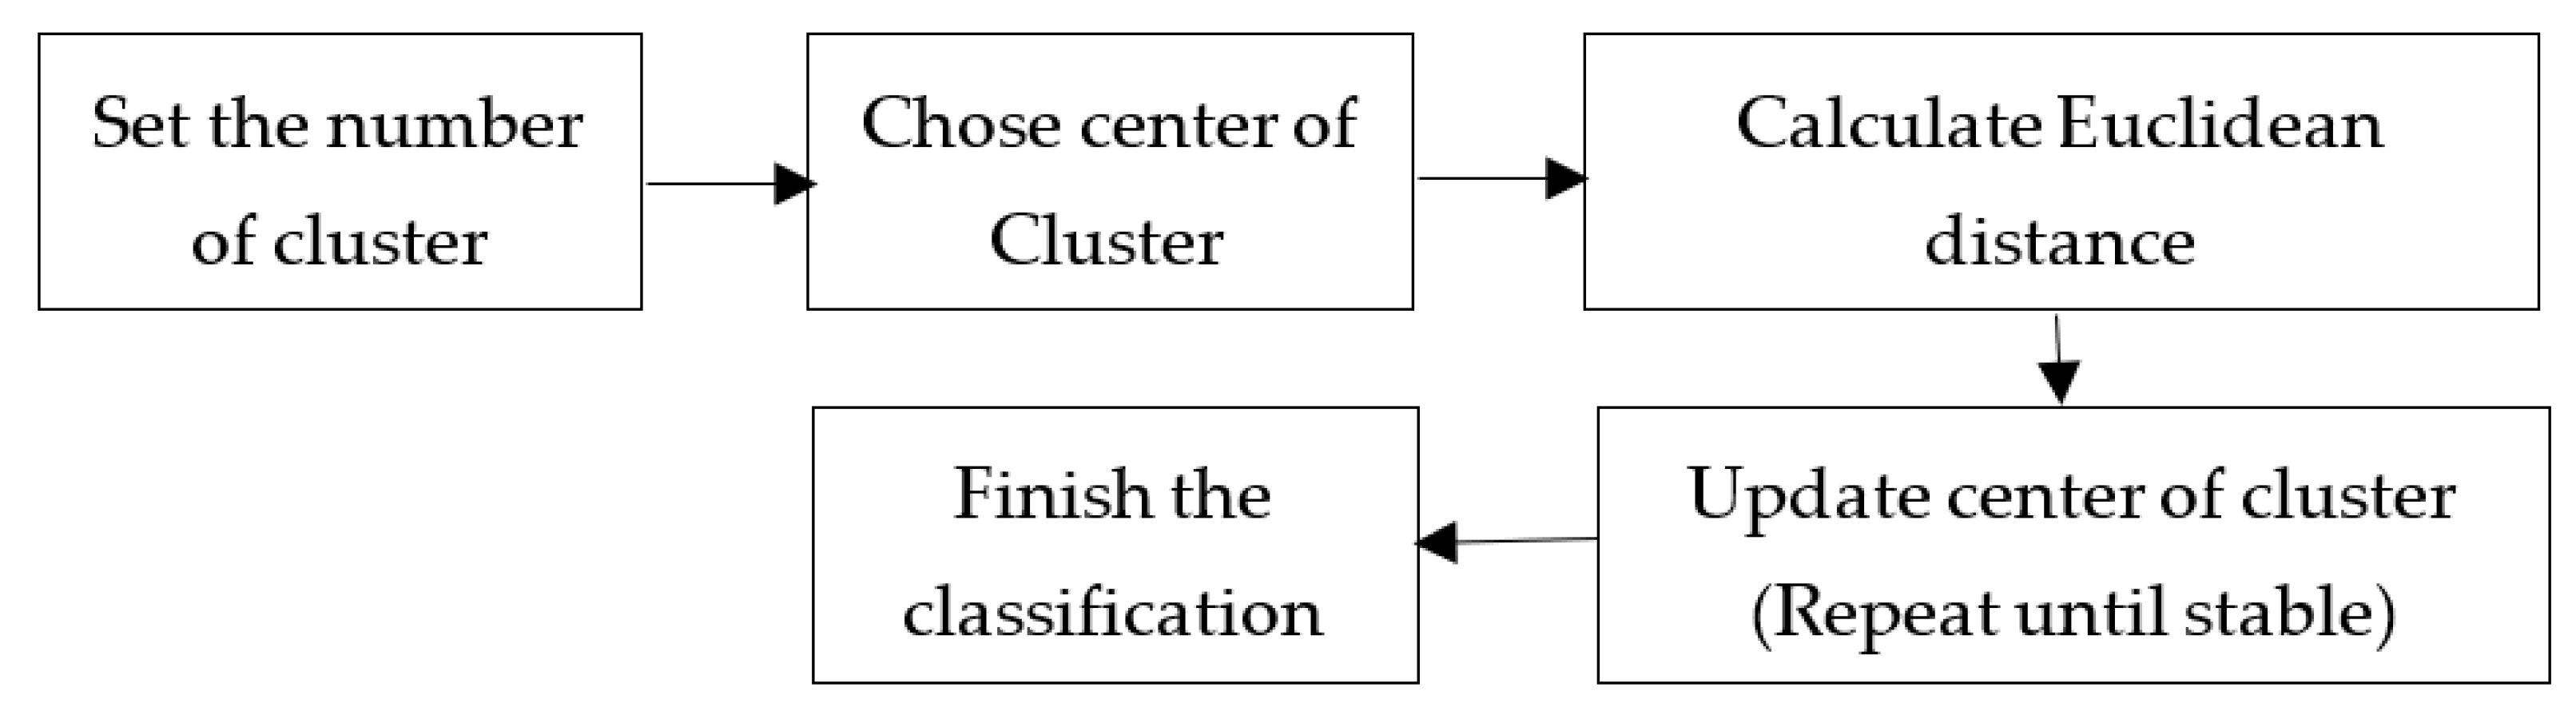
2.3.4. Clustering Algorithm by K-Means
- = objective function;
- k = number of clusters;
- = number of cases;
- = case i;
- = centroid for cluster j;
- = Euclidean distance between and .
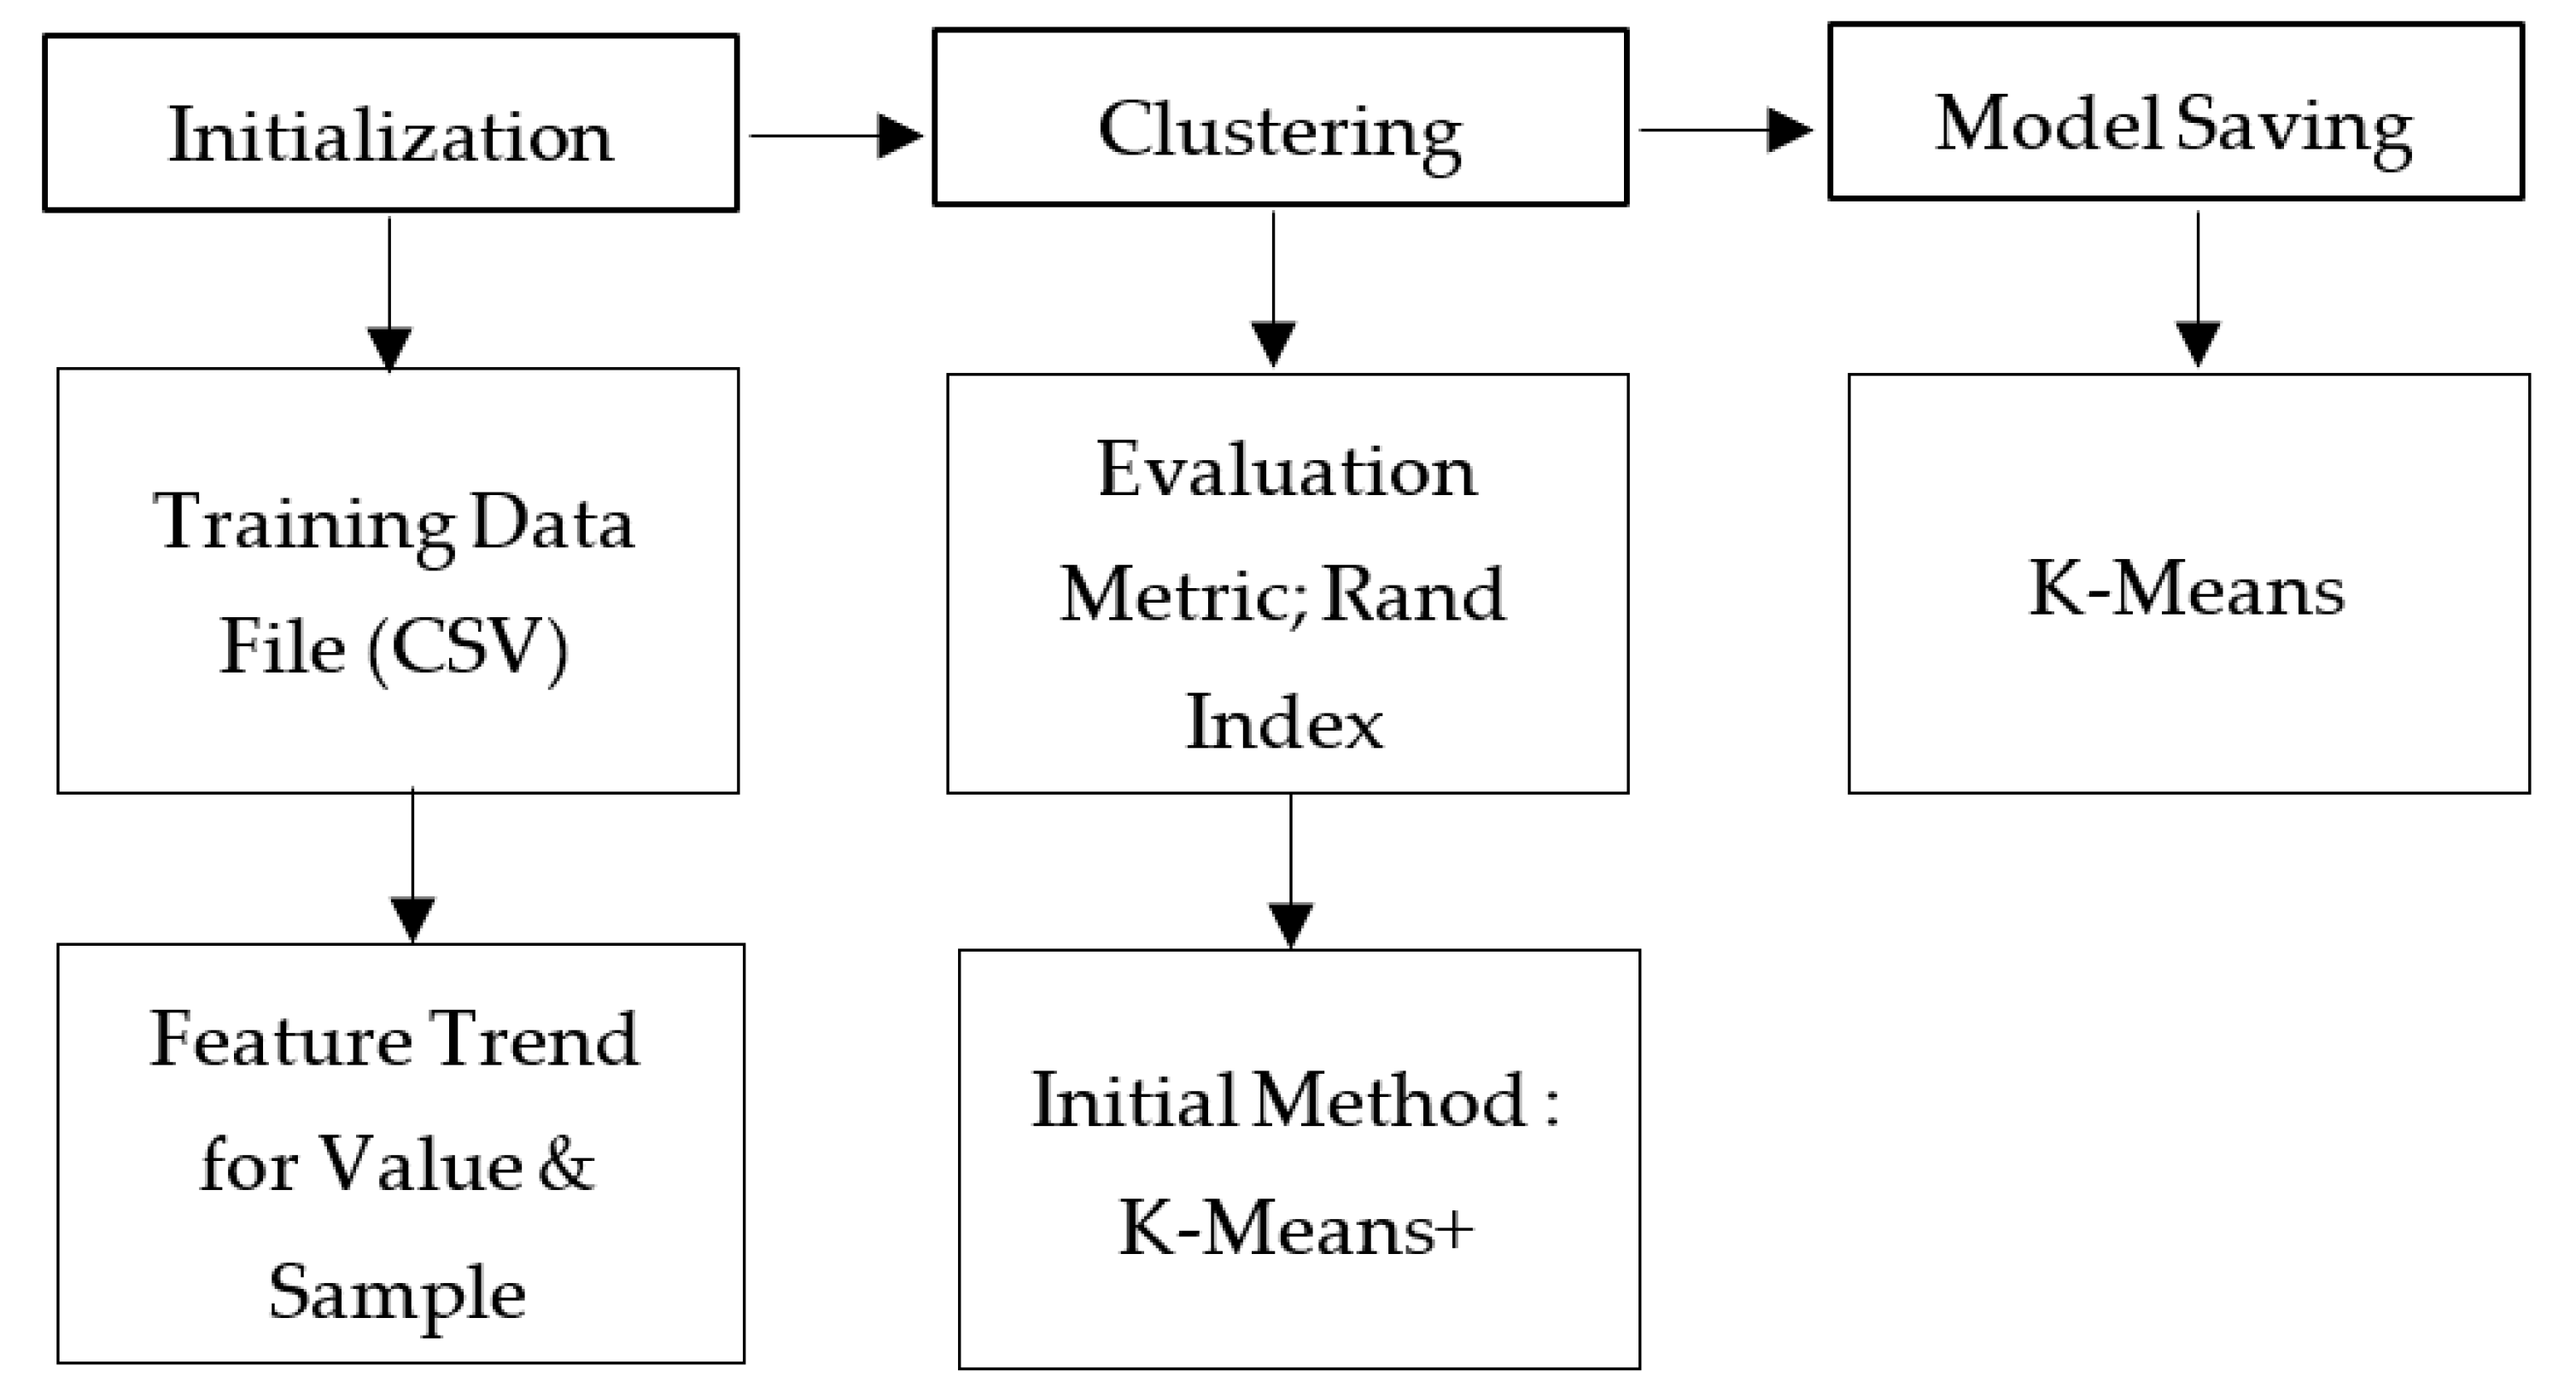
- Initialization
- Clustering
- Model Saving
3. Experiments
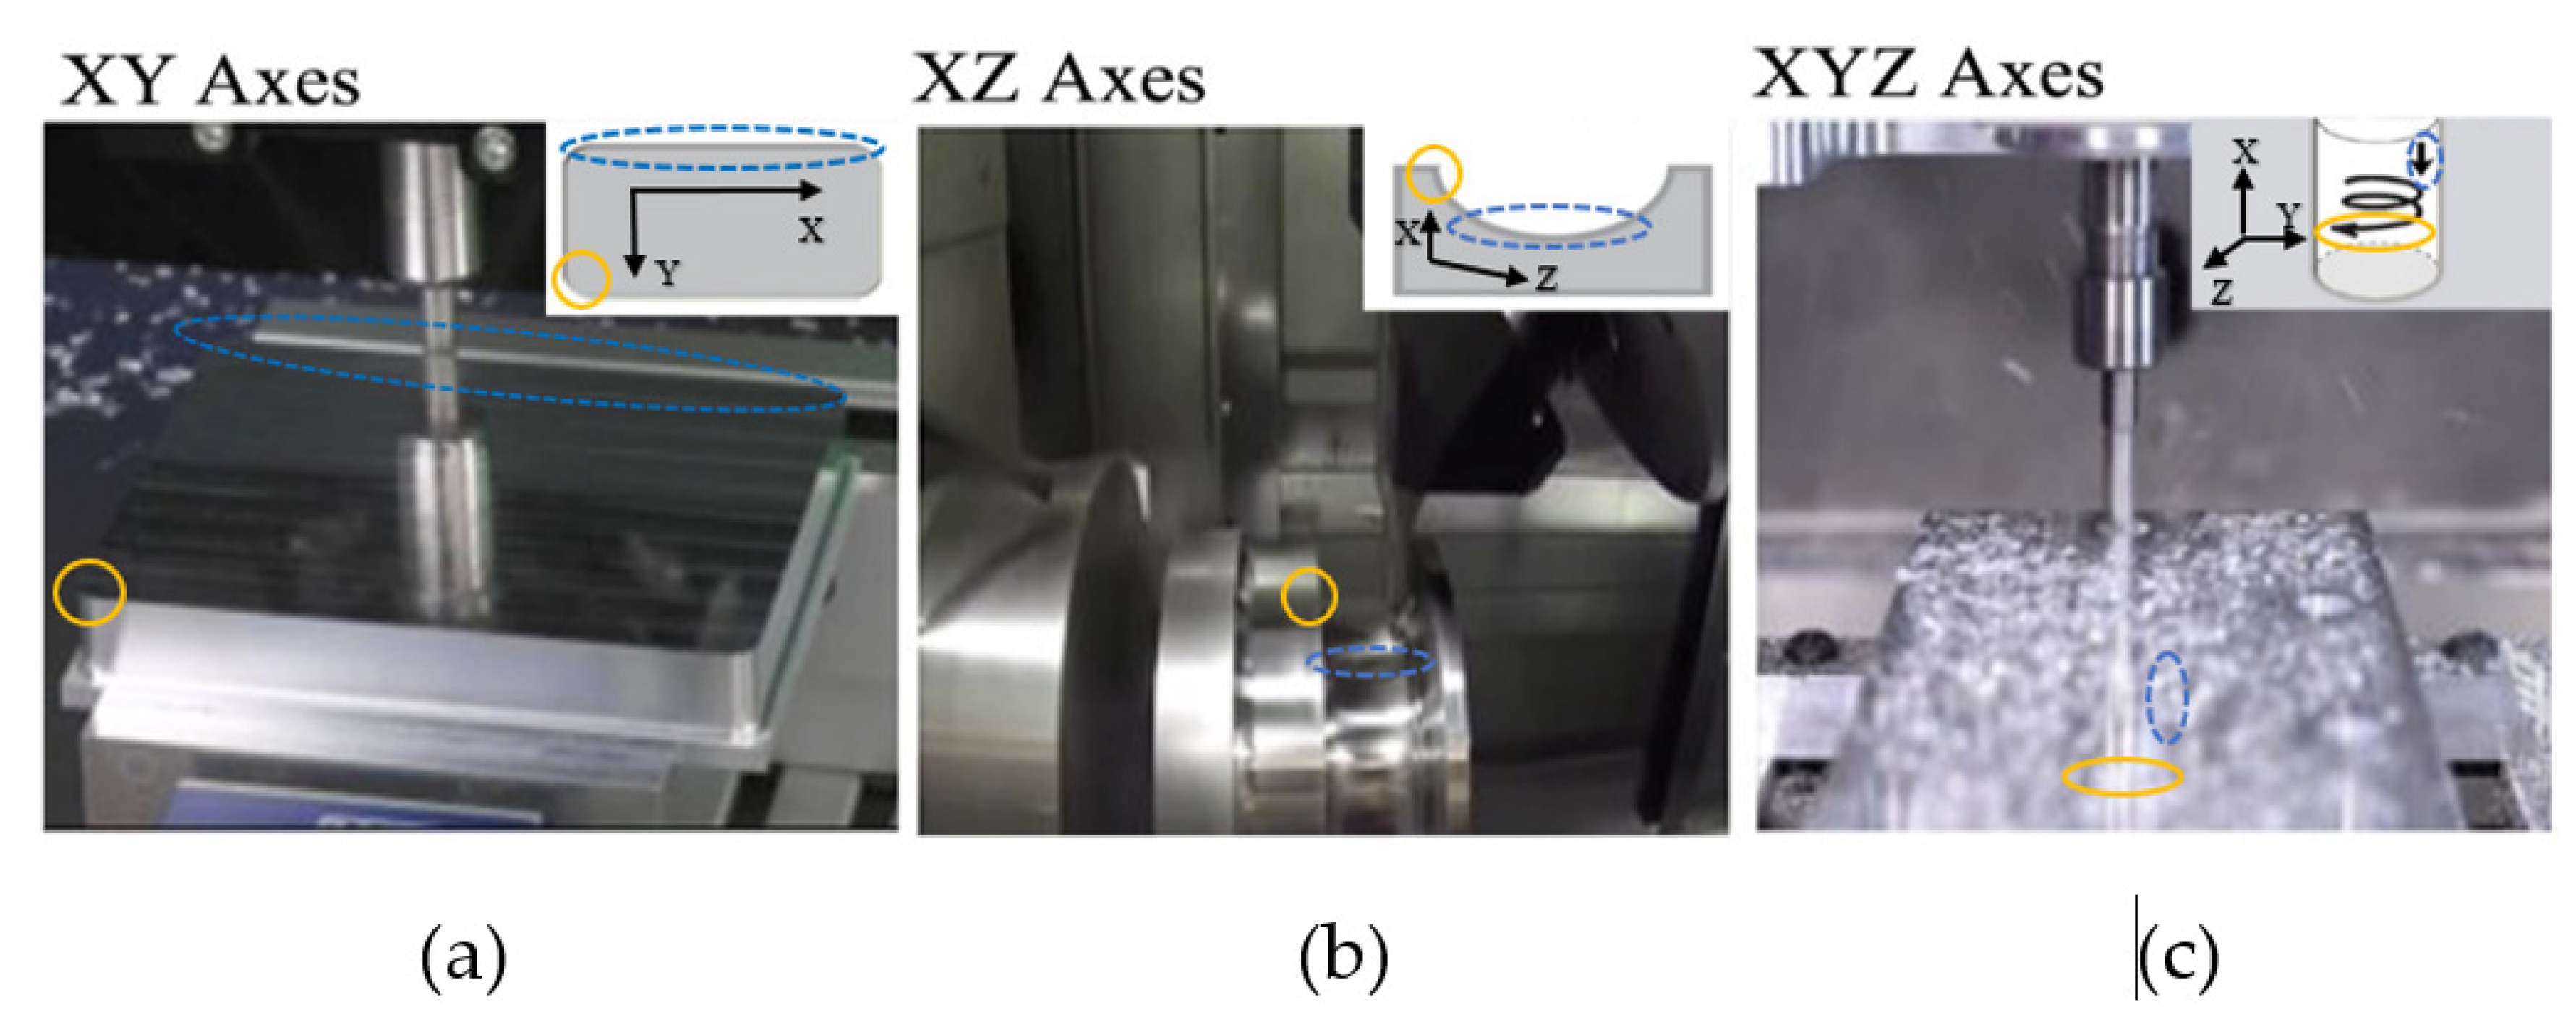
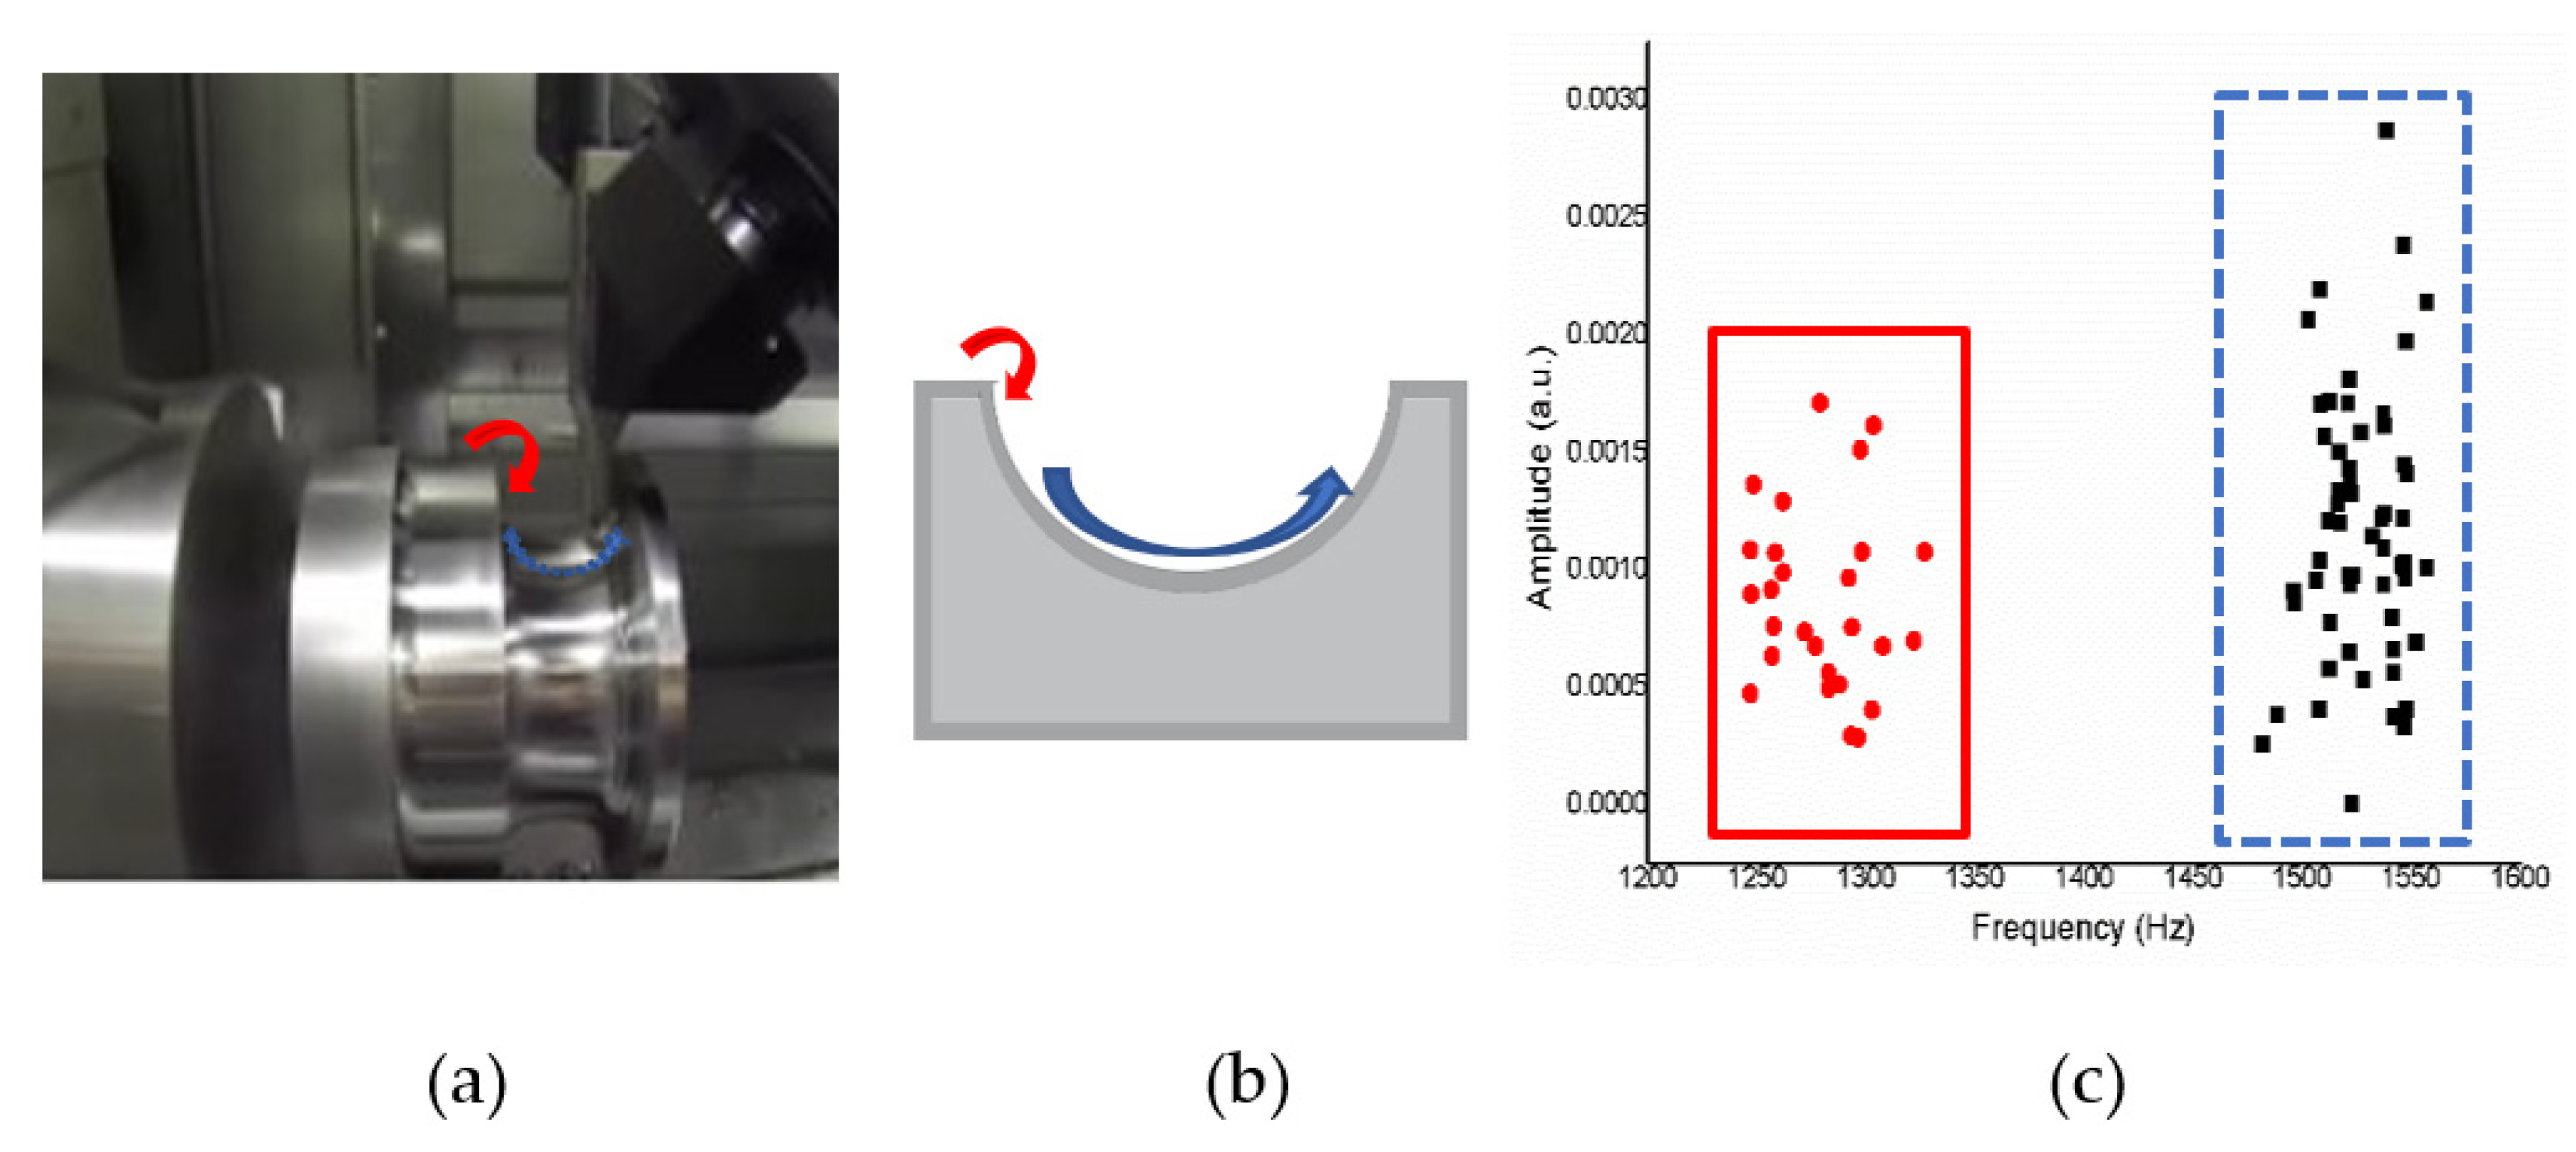
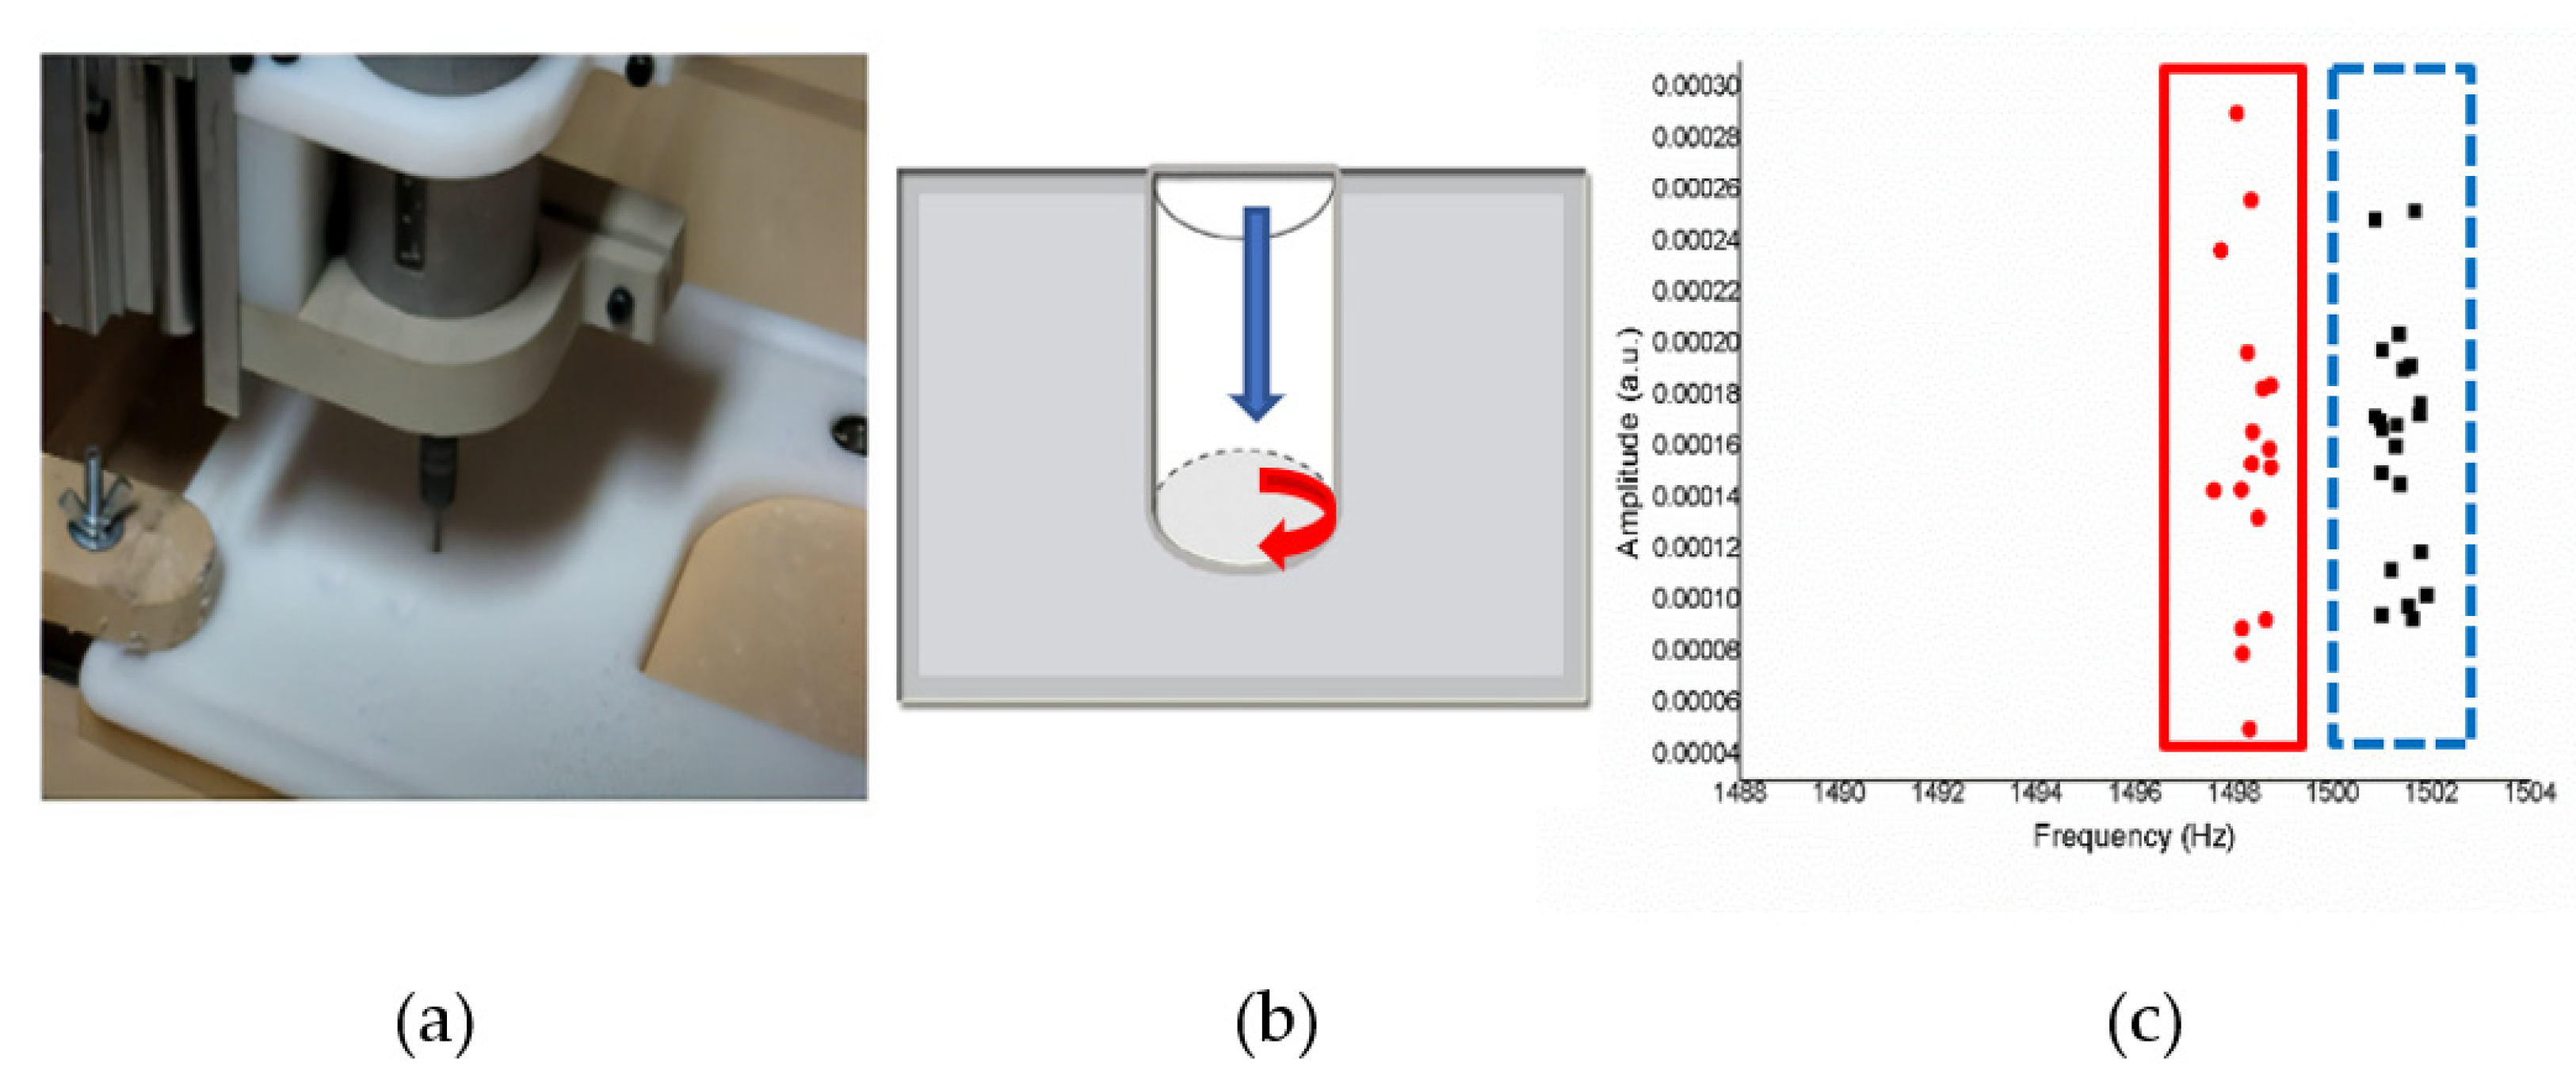
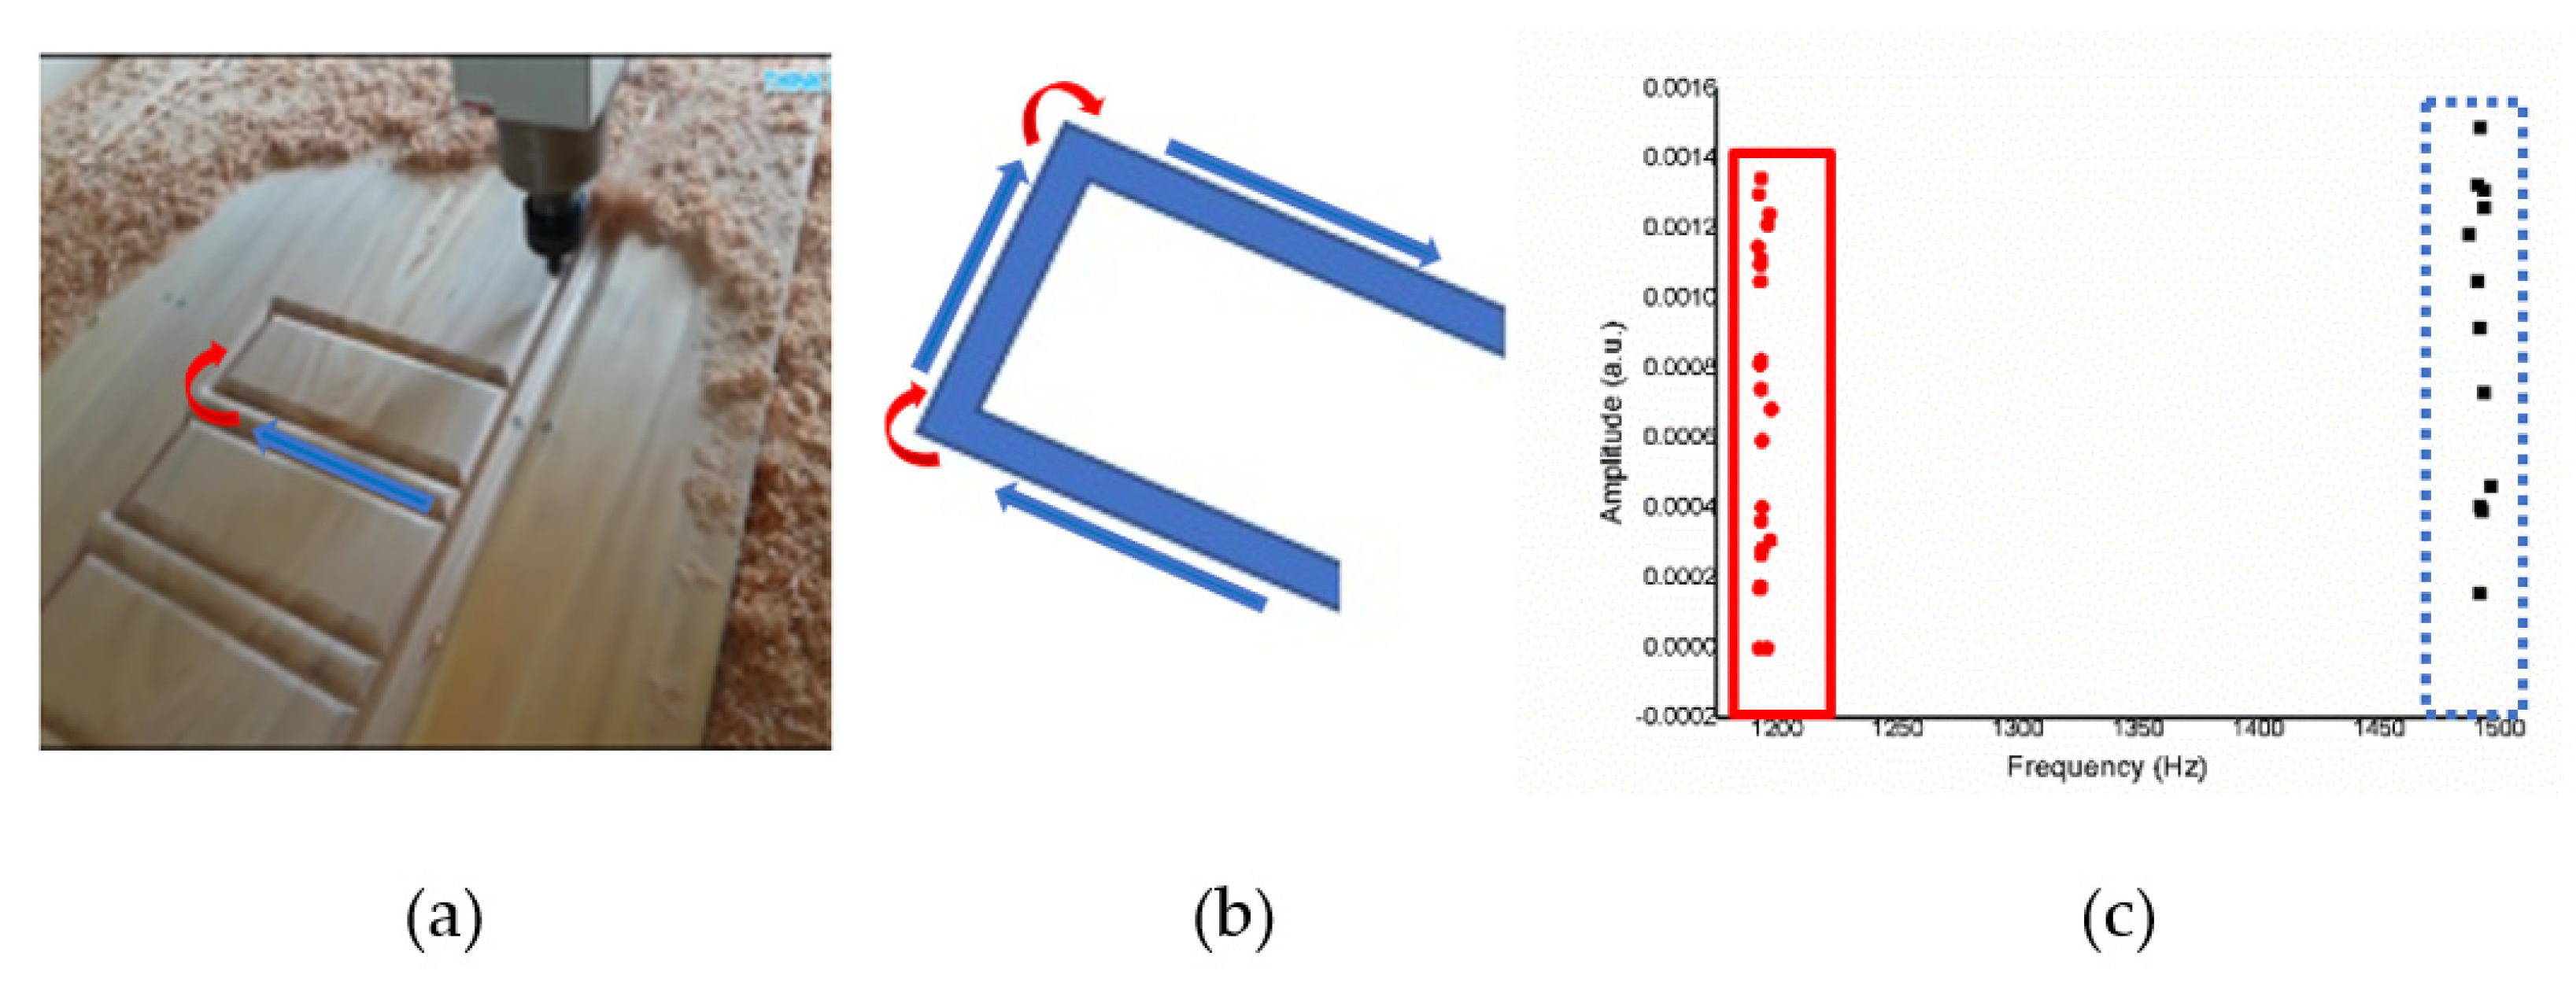
3.1. Working Structure: Operation Shapes of CNC Milling Process
- Movement plane at XY axes to obtain corner and edge information.
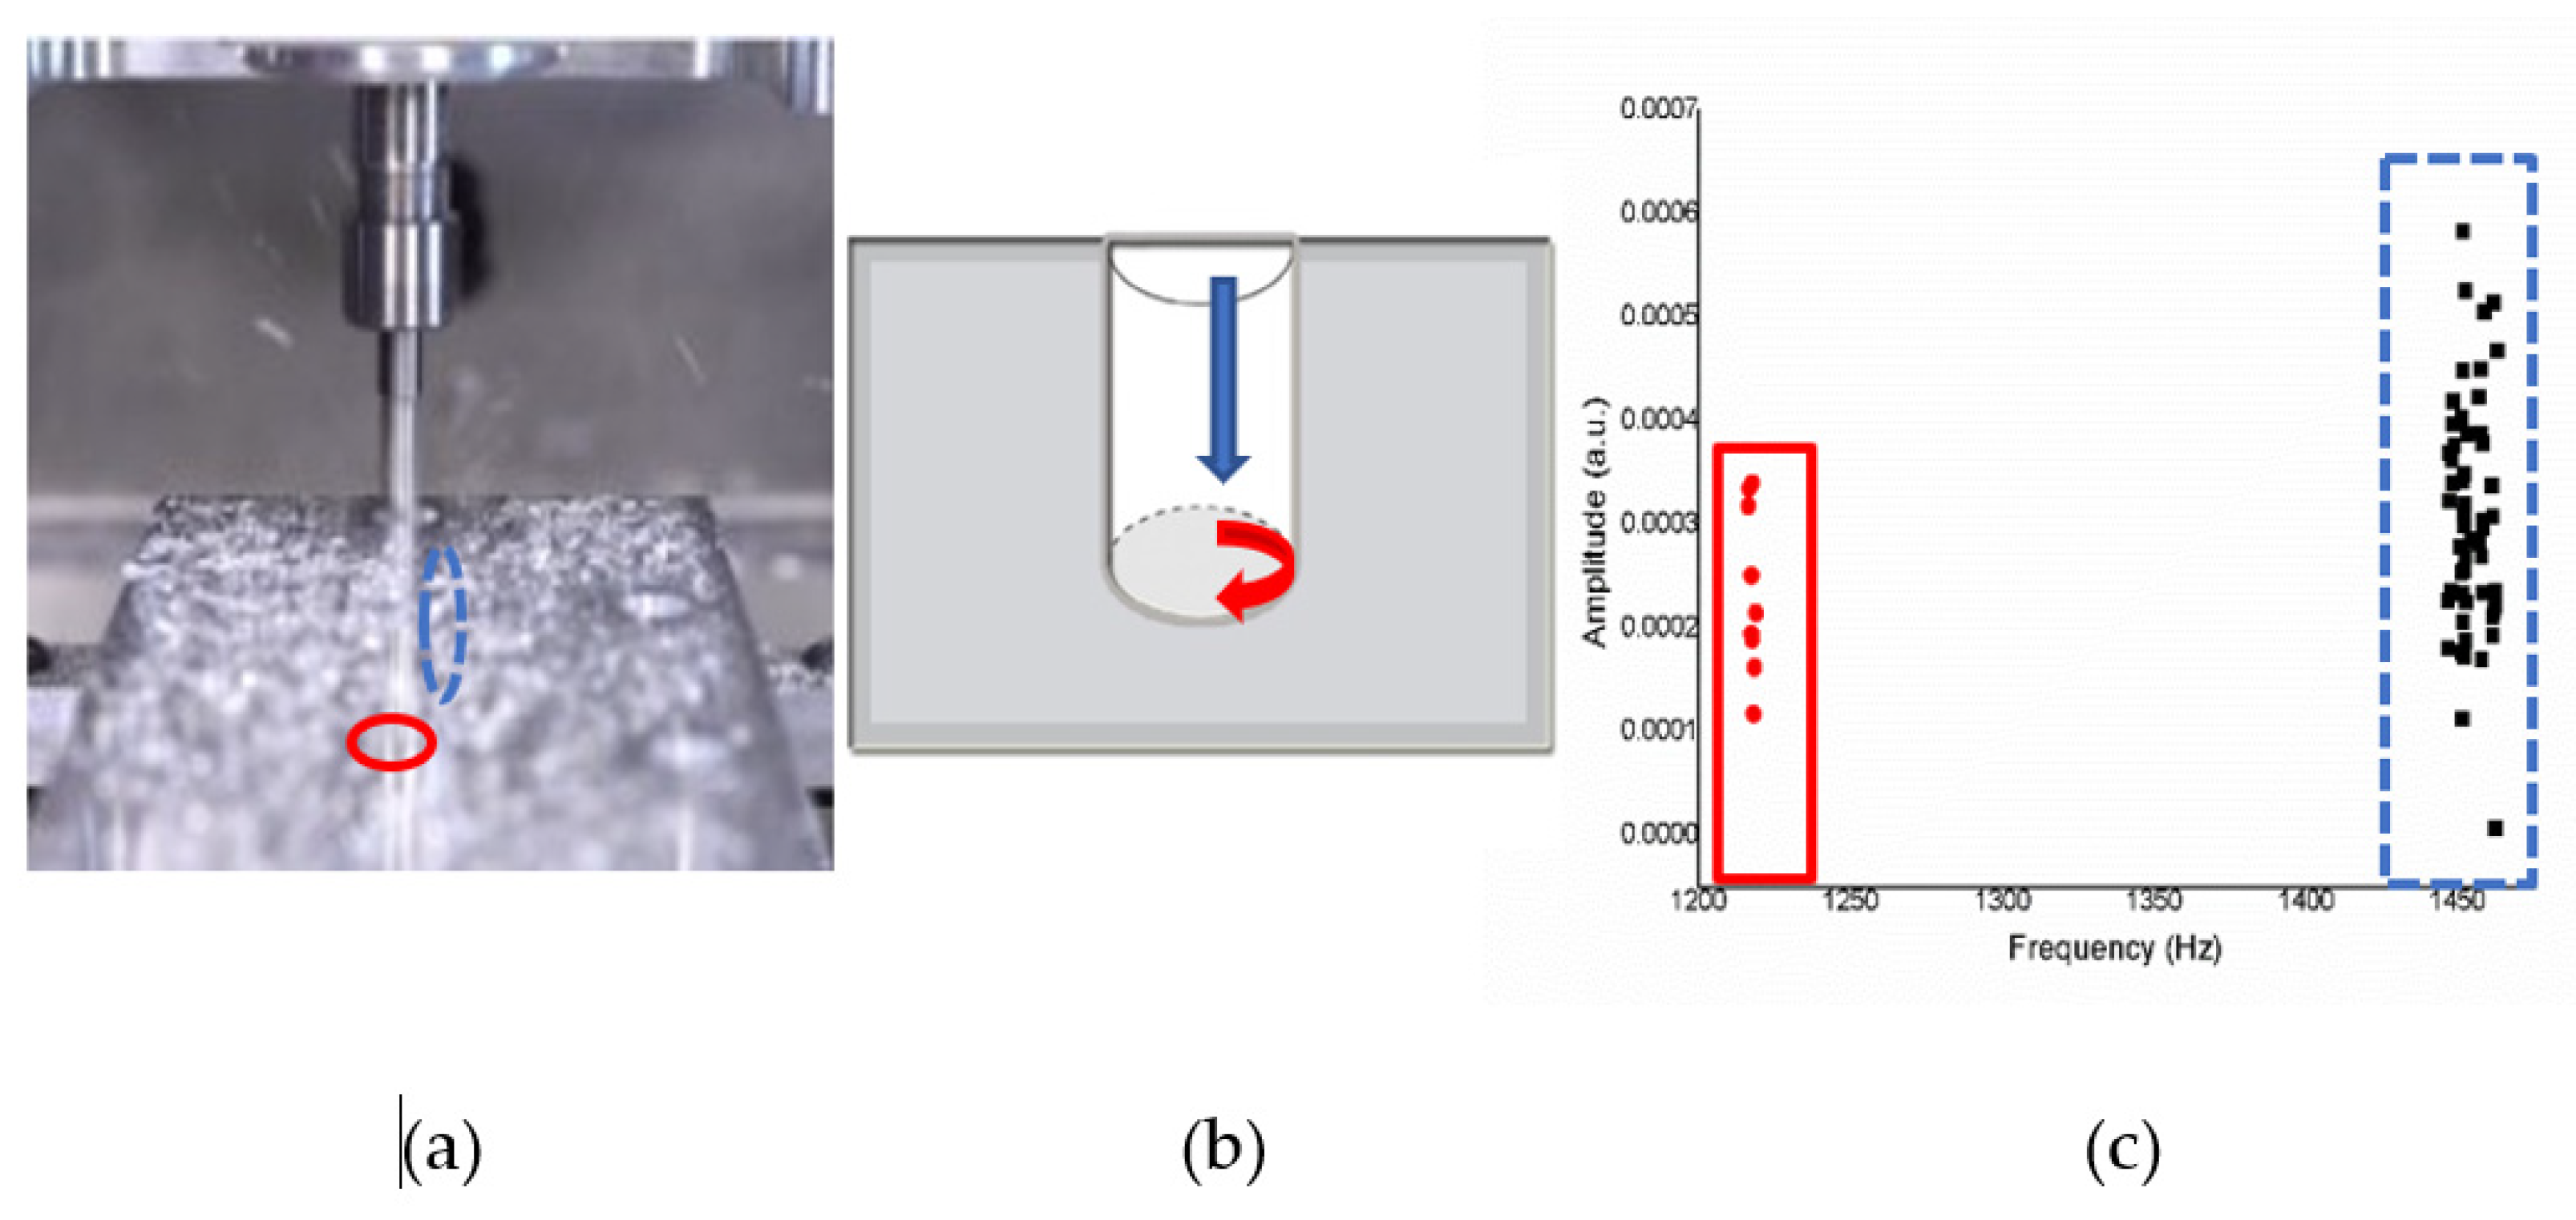
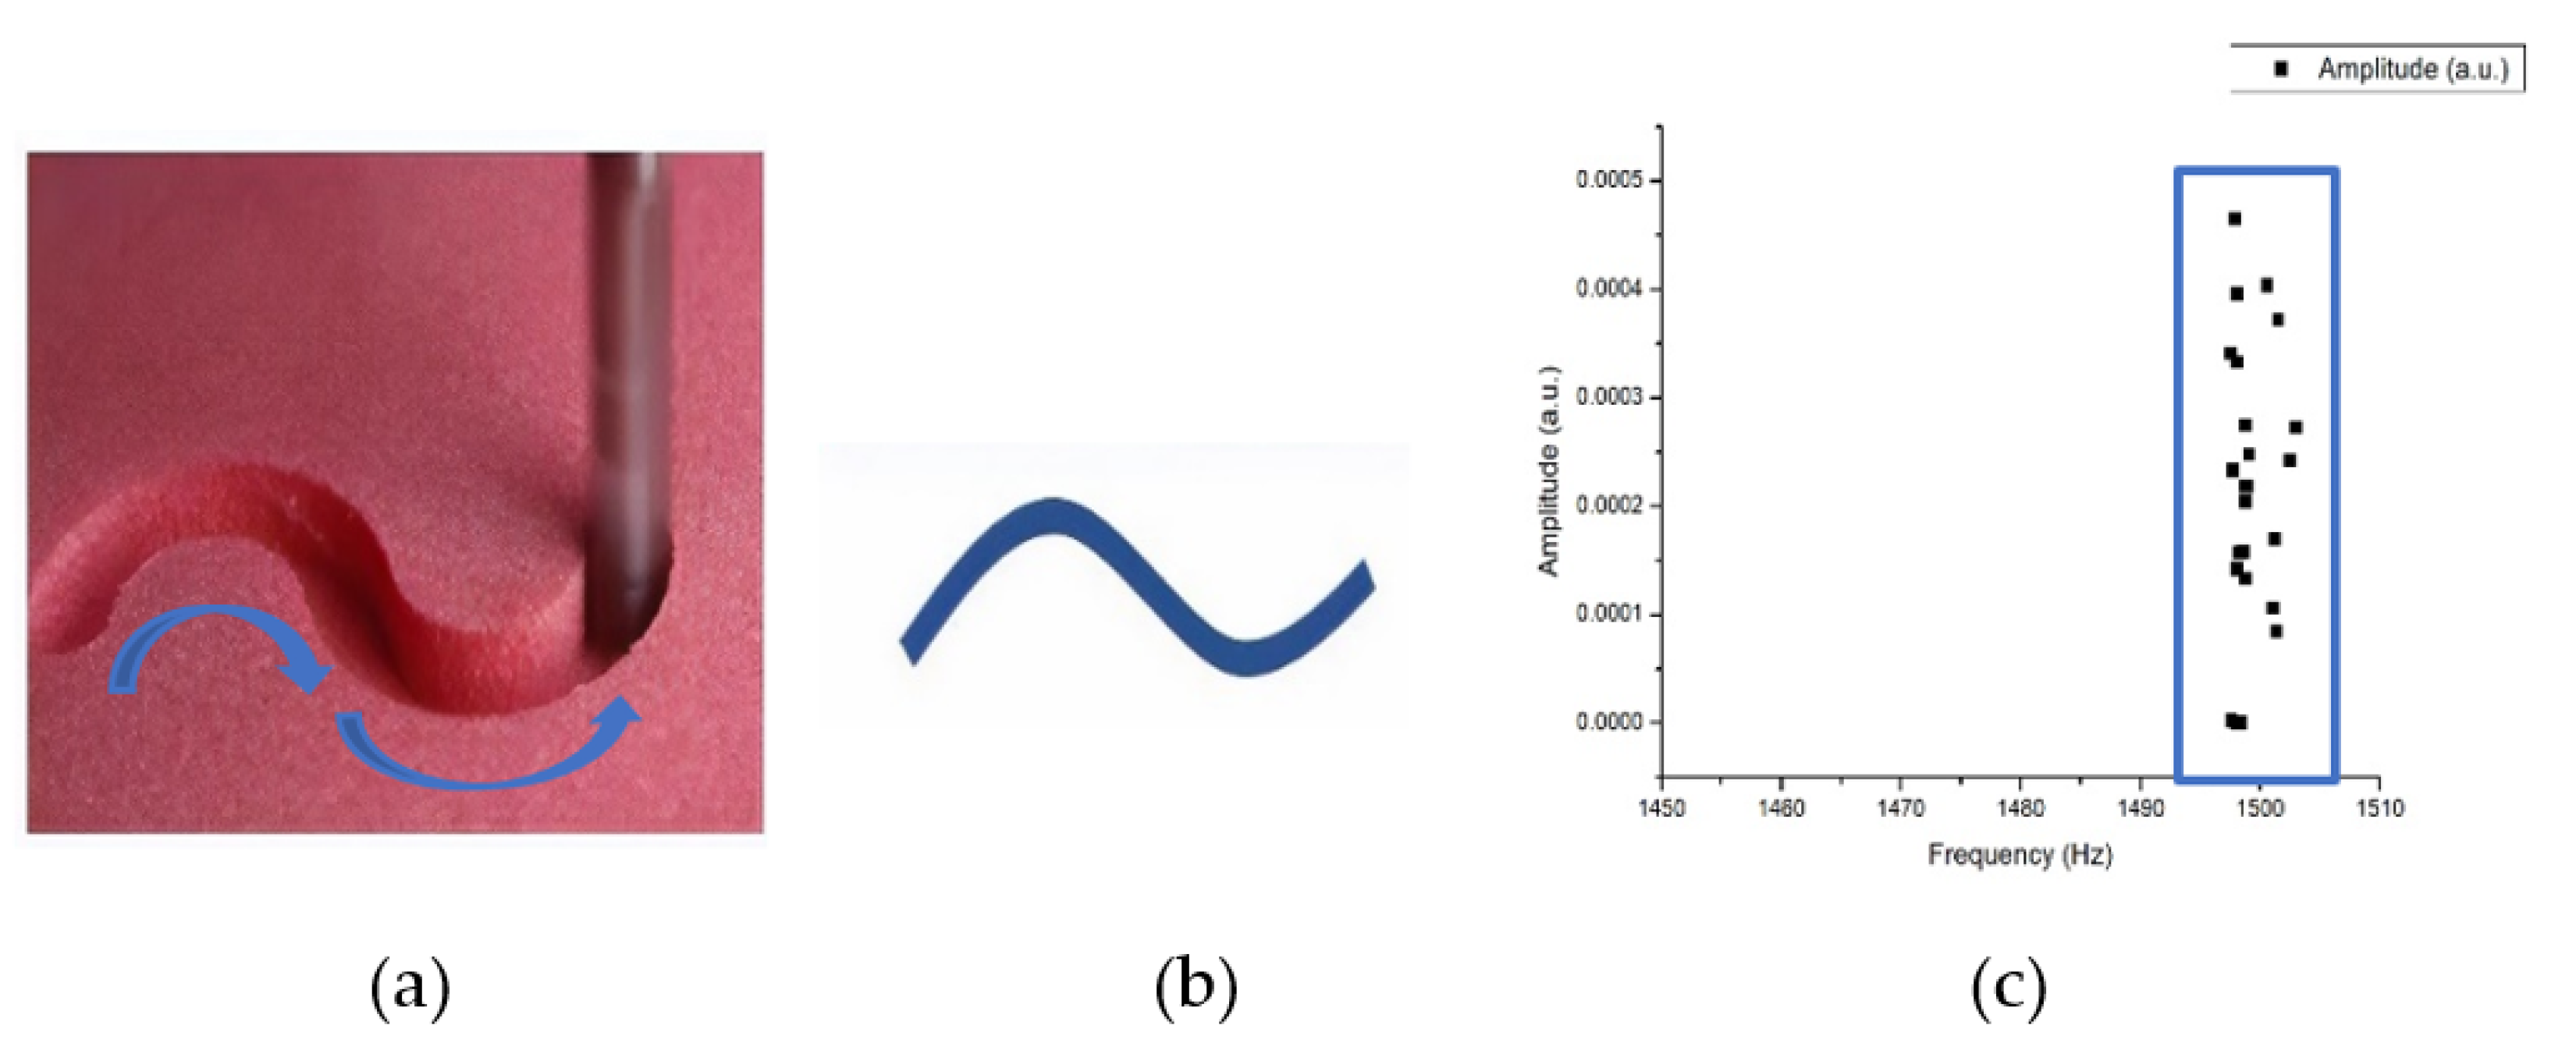
- Movement plane at XZ axes to obtain the low and high information.
- Movement plane at XYZ axes to obtain inward loop information.
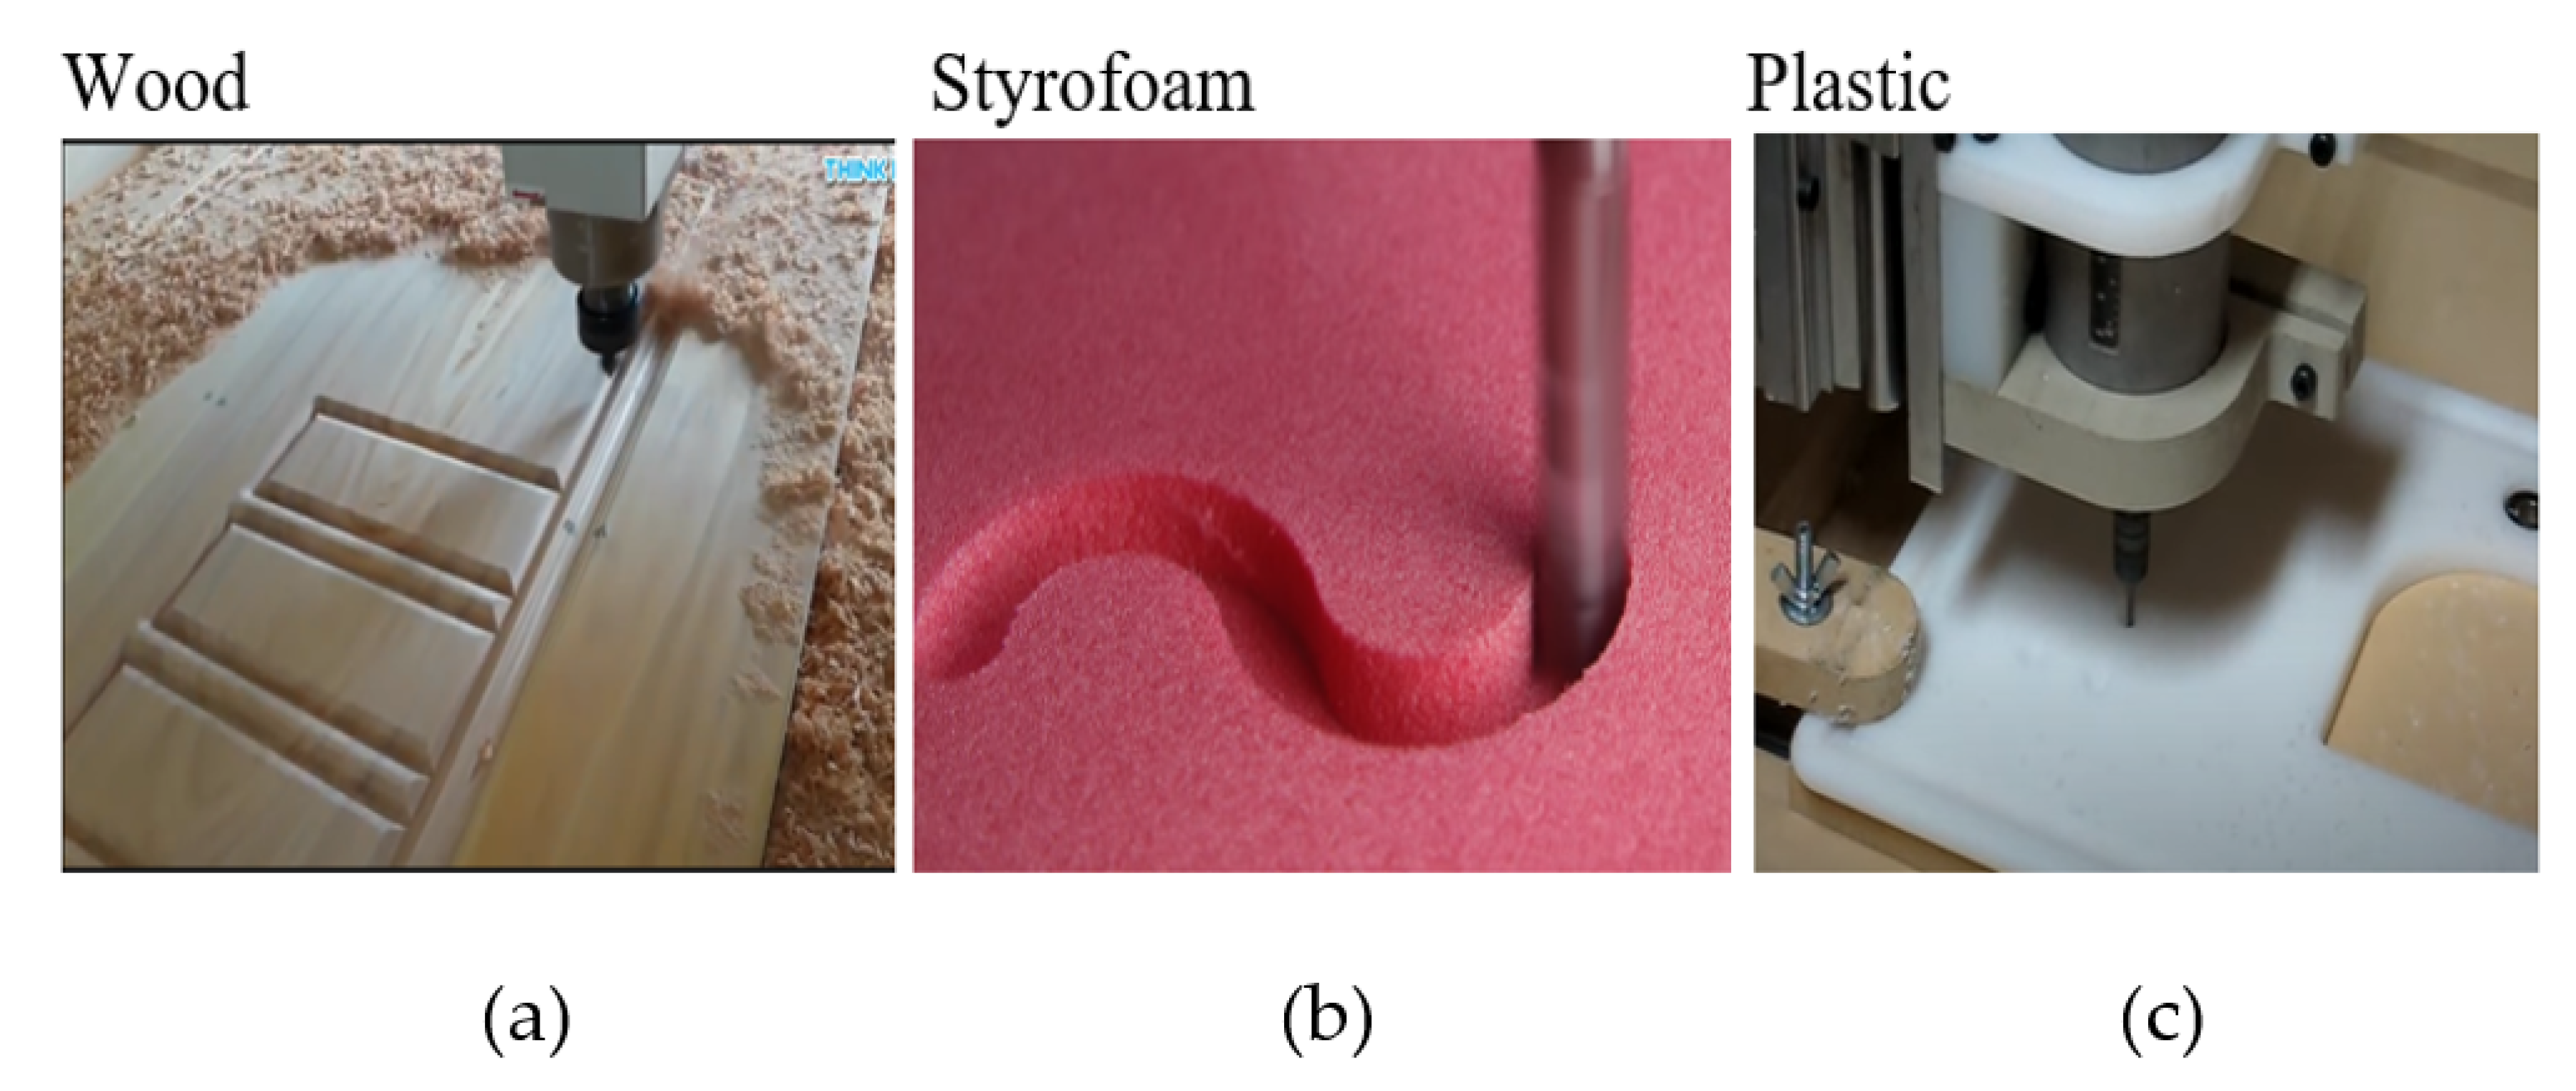
3.2. Different Materials: Operation Materials of CNC Milling Process
- Material Density of Wood to Milling Process Operation
- Material Density of Styrofoam to Milling Process Operation
- Material Density of Plastic to Milling Process Operation
4. Results and Discussion
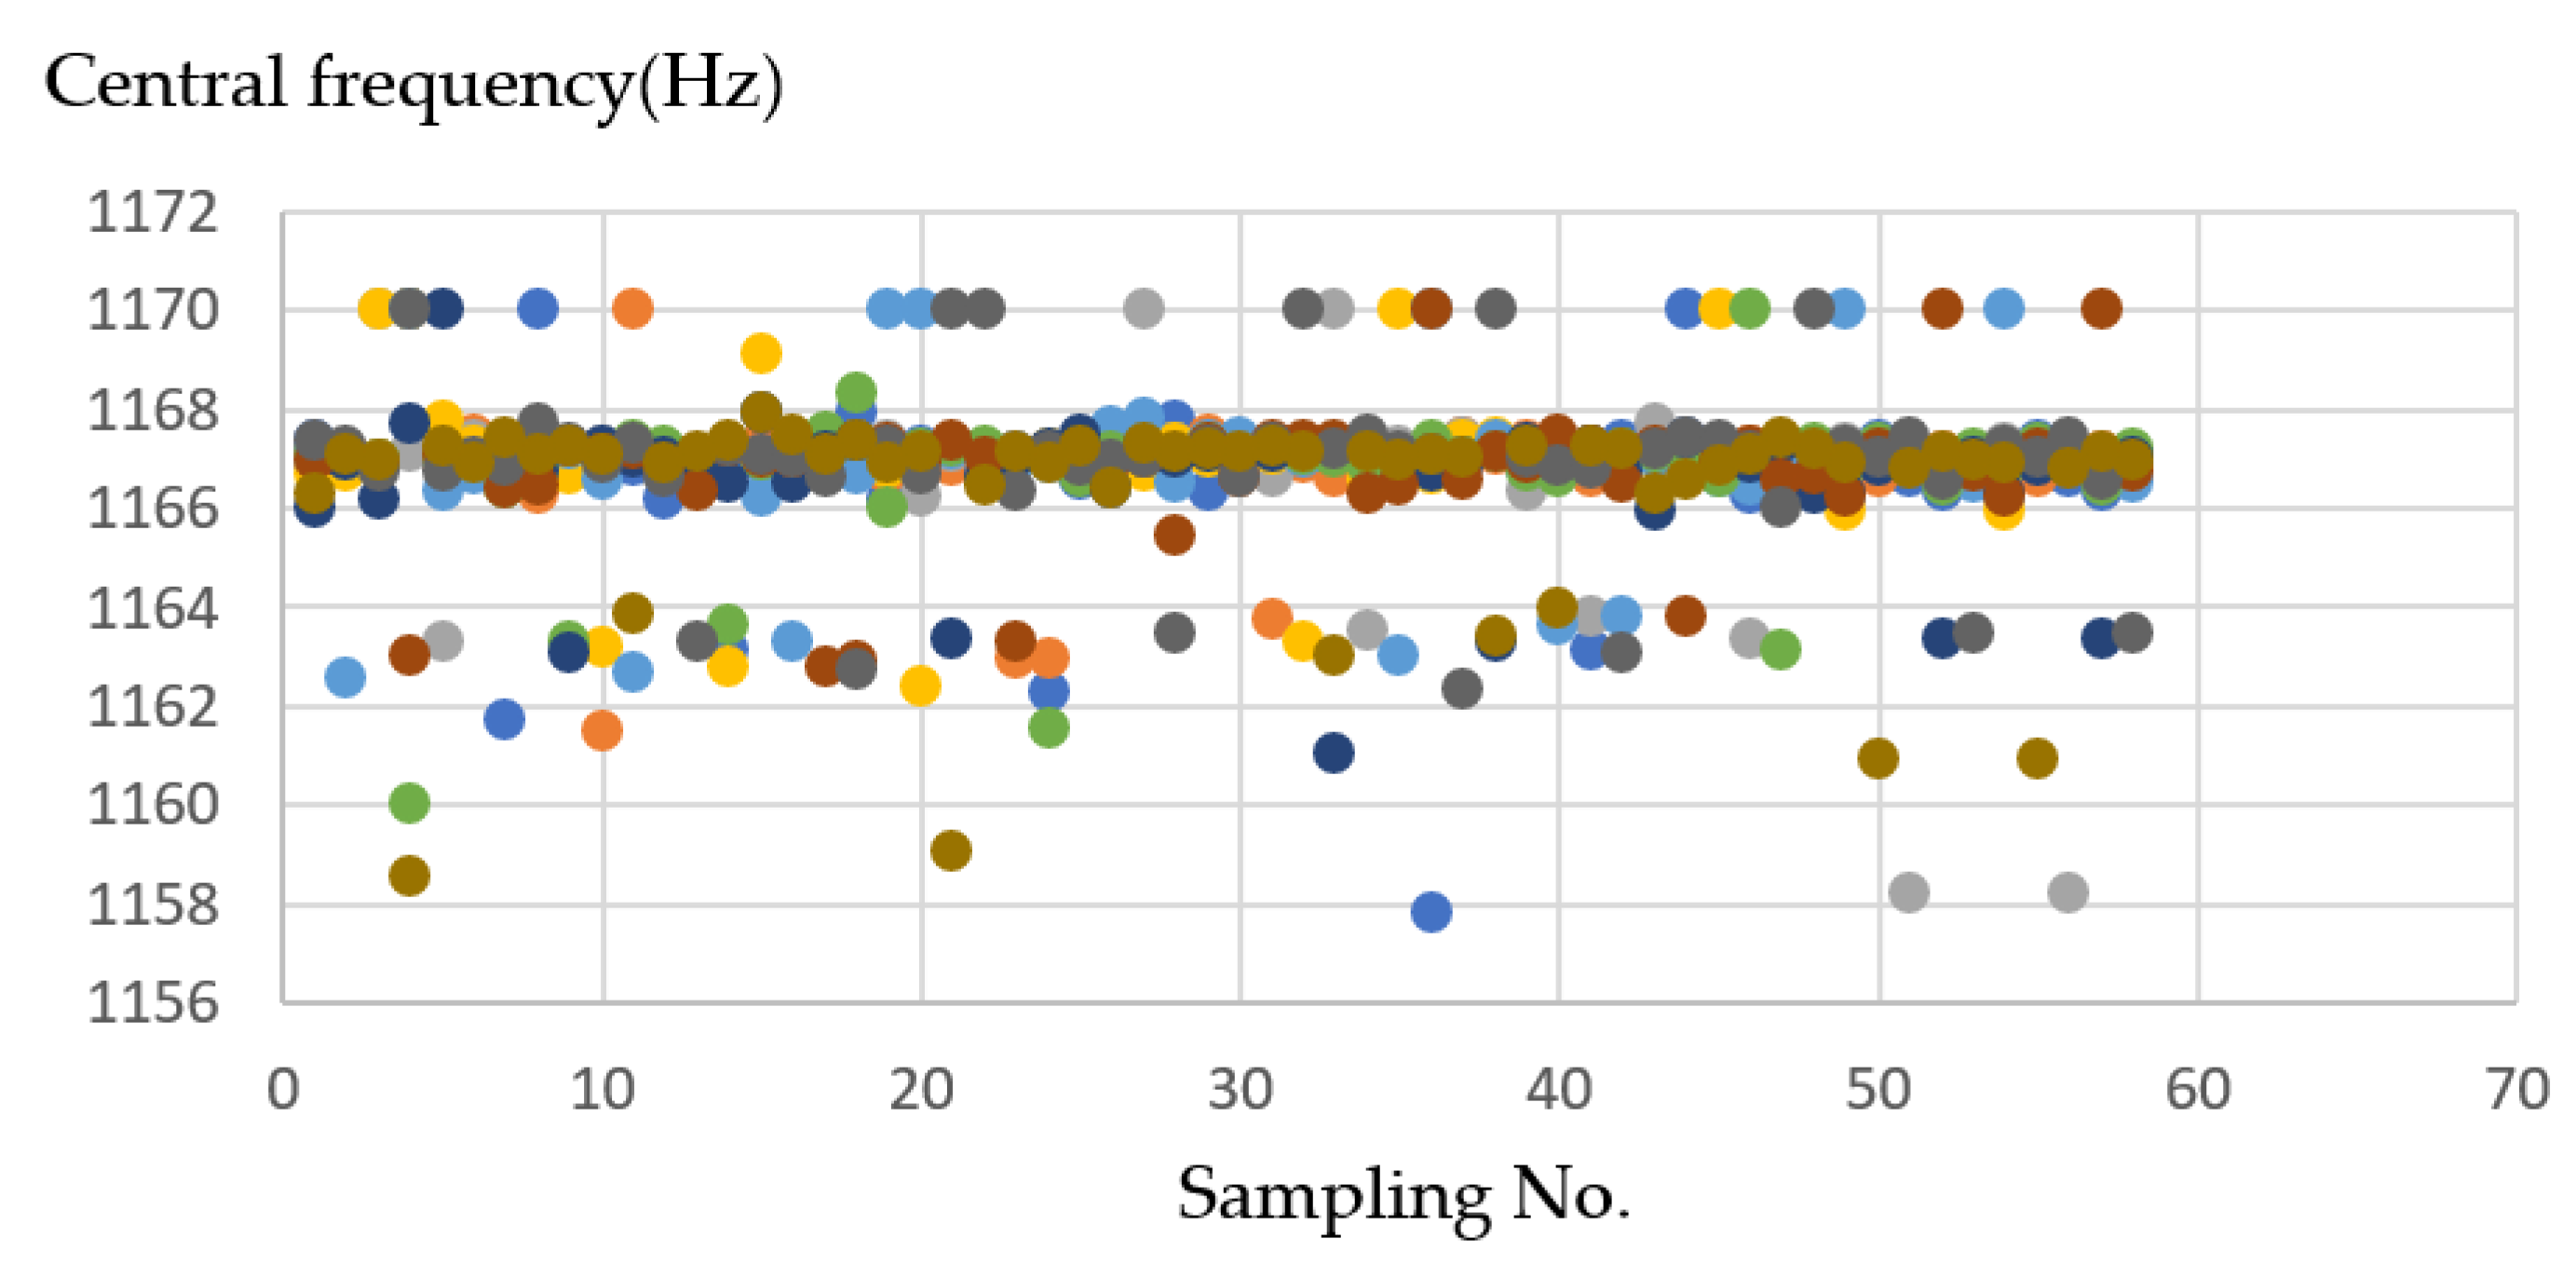
4.1. Resonant Frequency Calibration with Do Re Mi Fa Sol Tone
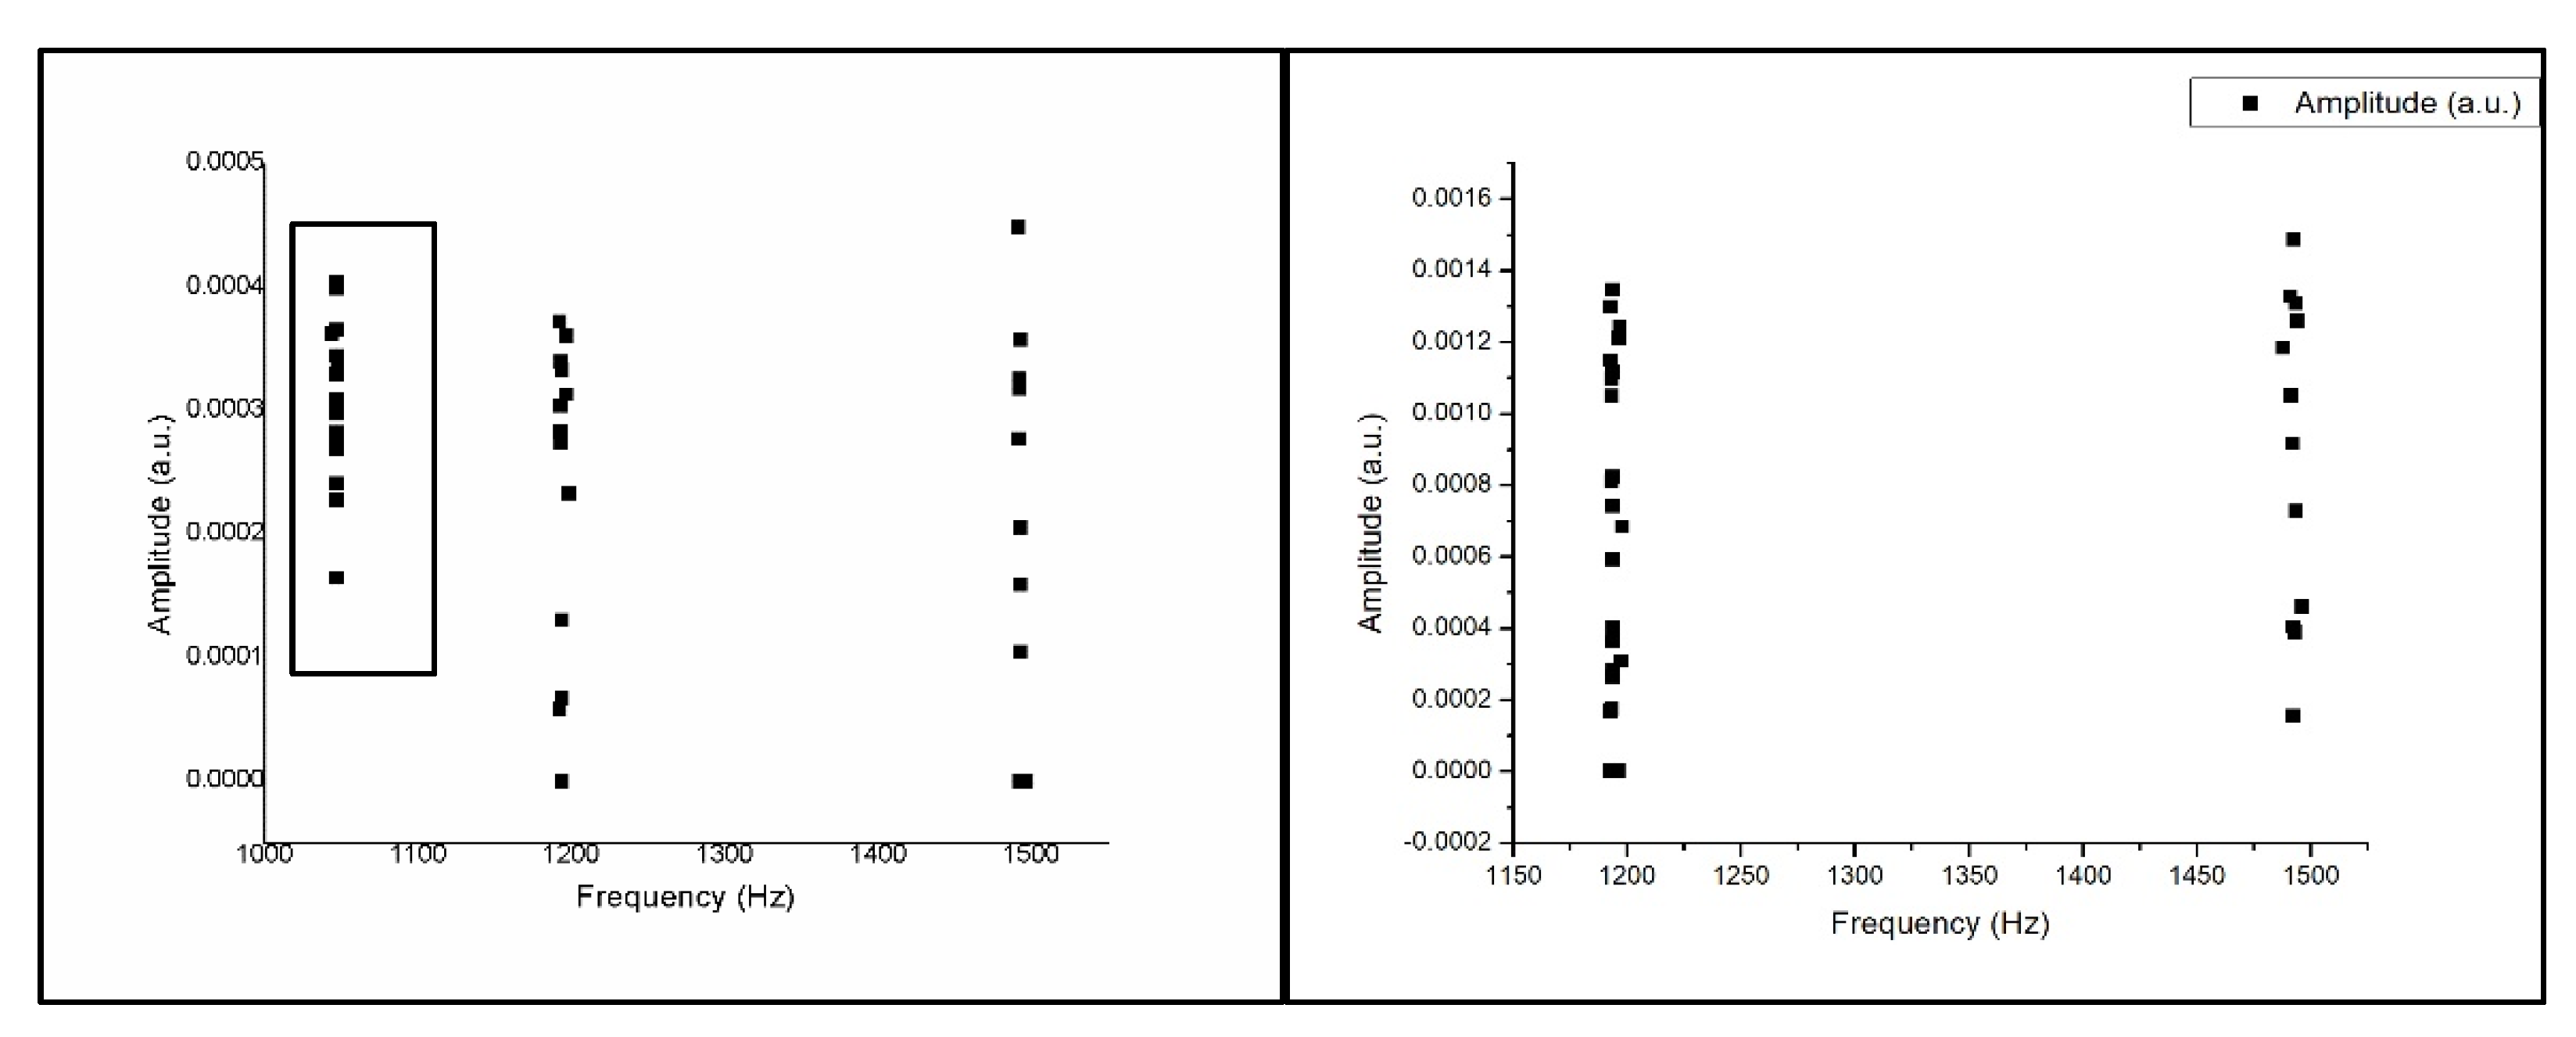
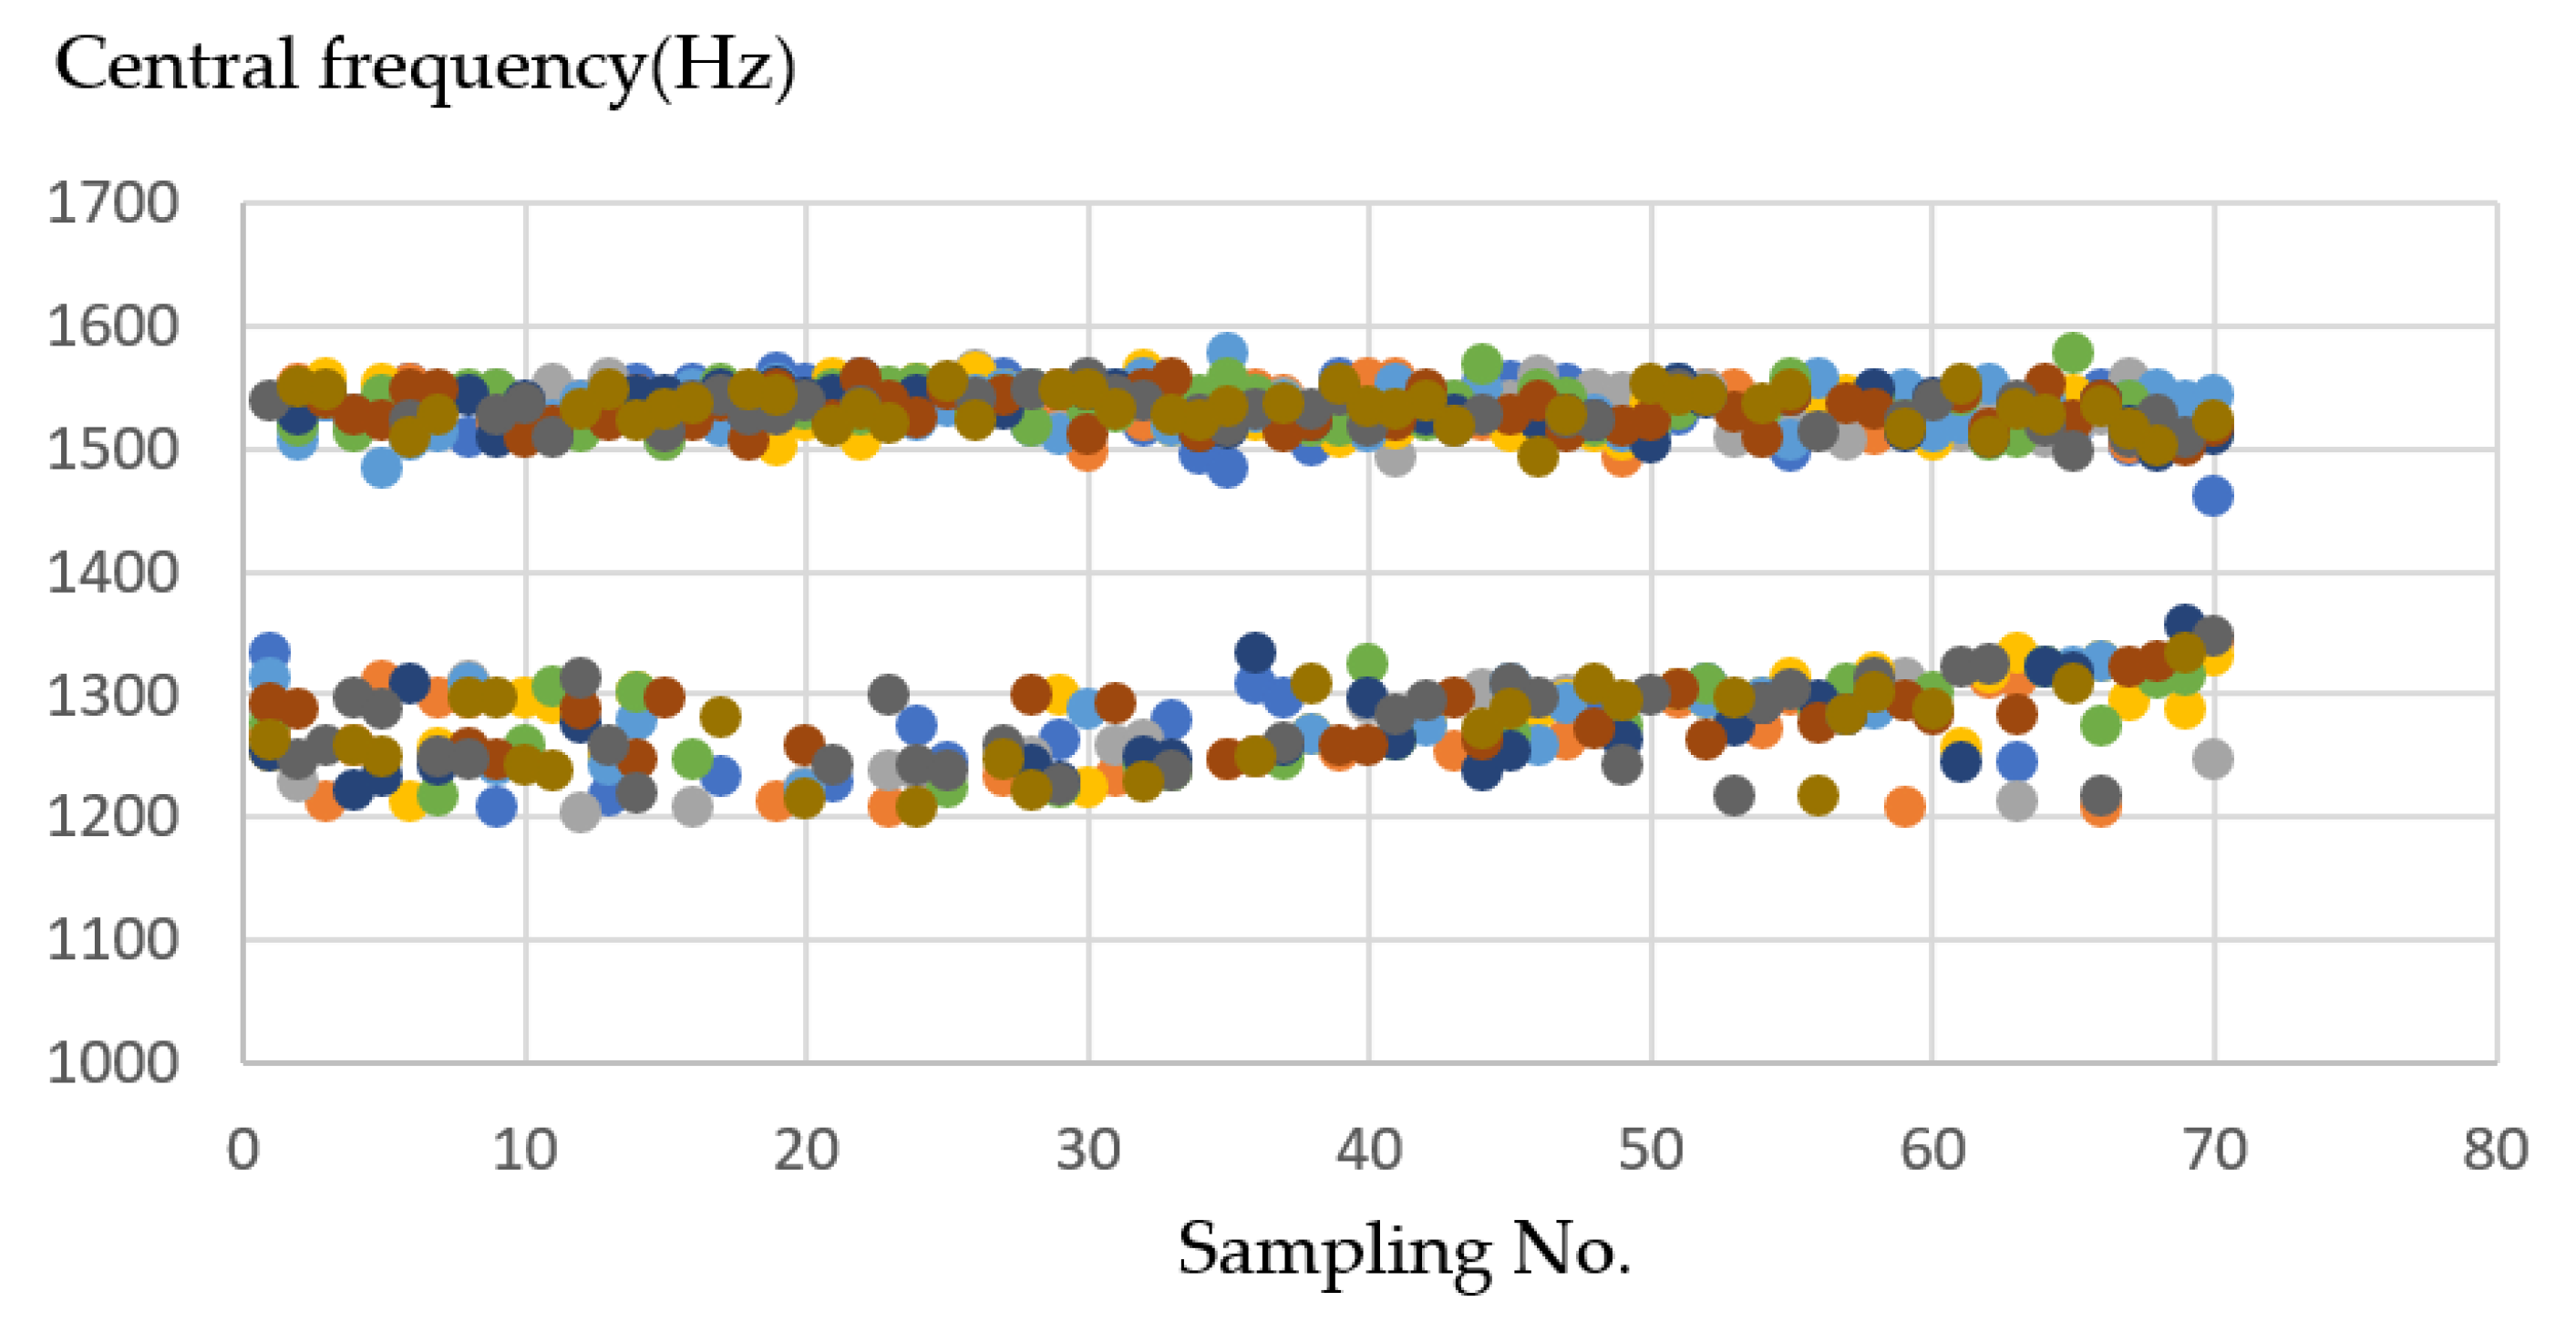
4.2. Analysis for Operation Mode Process
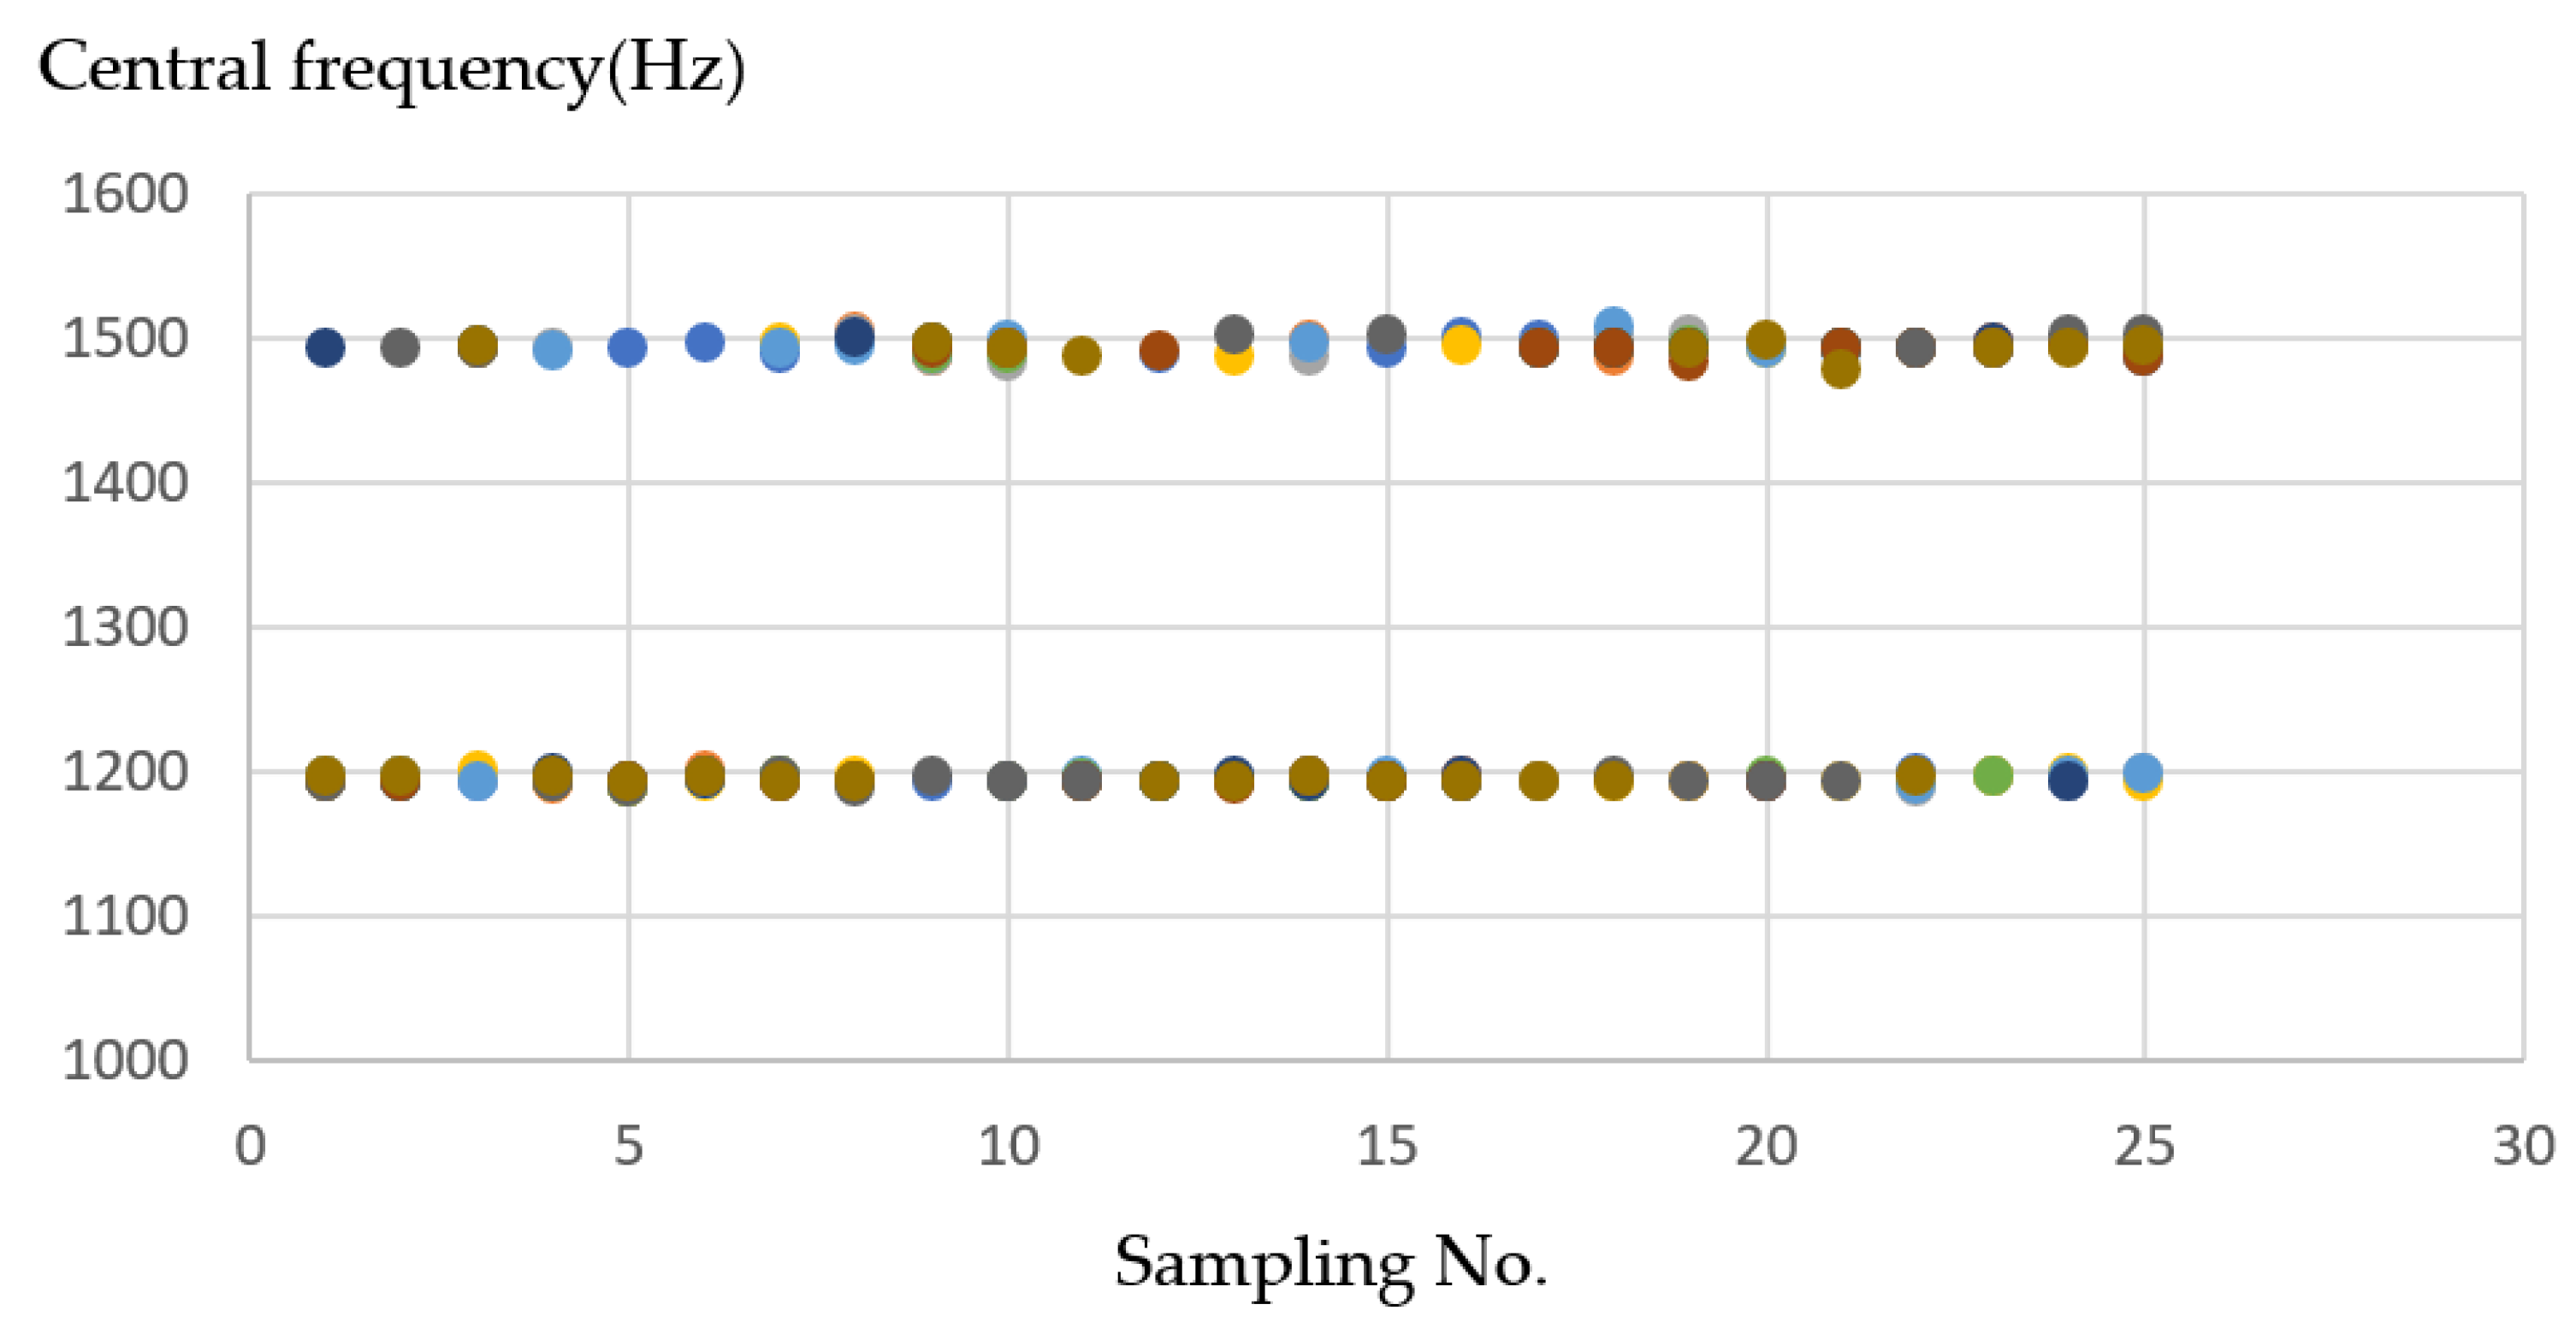
- XY Axes
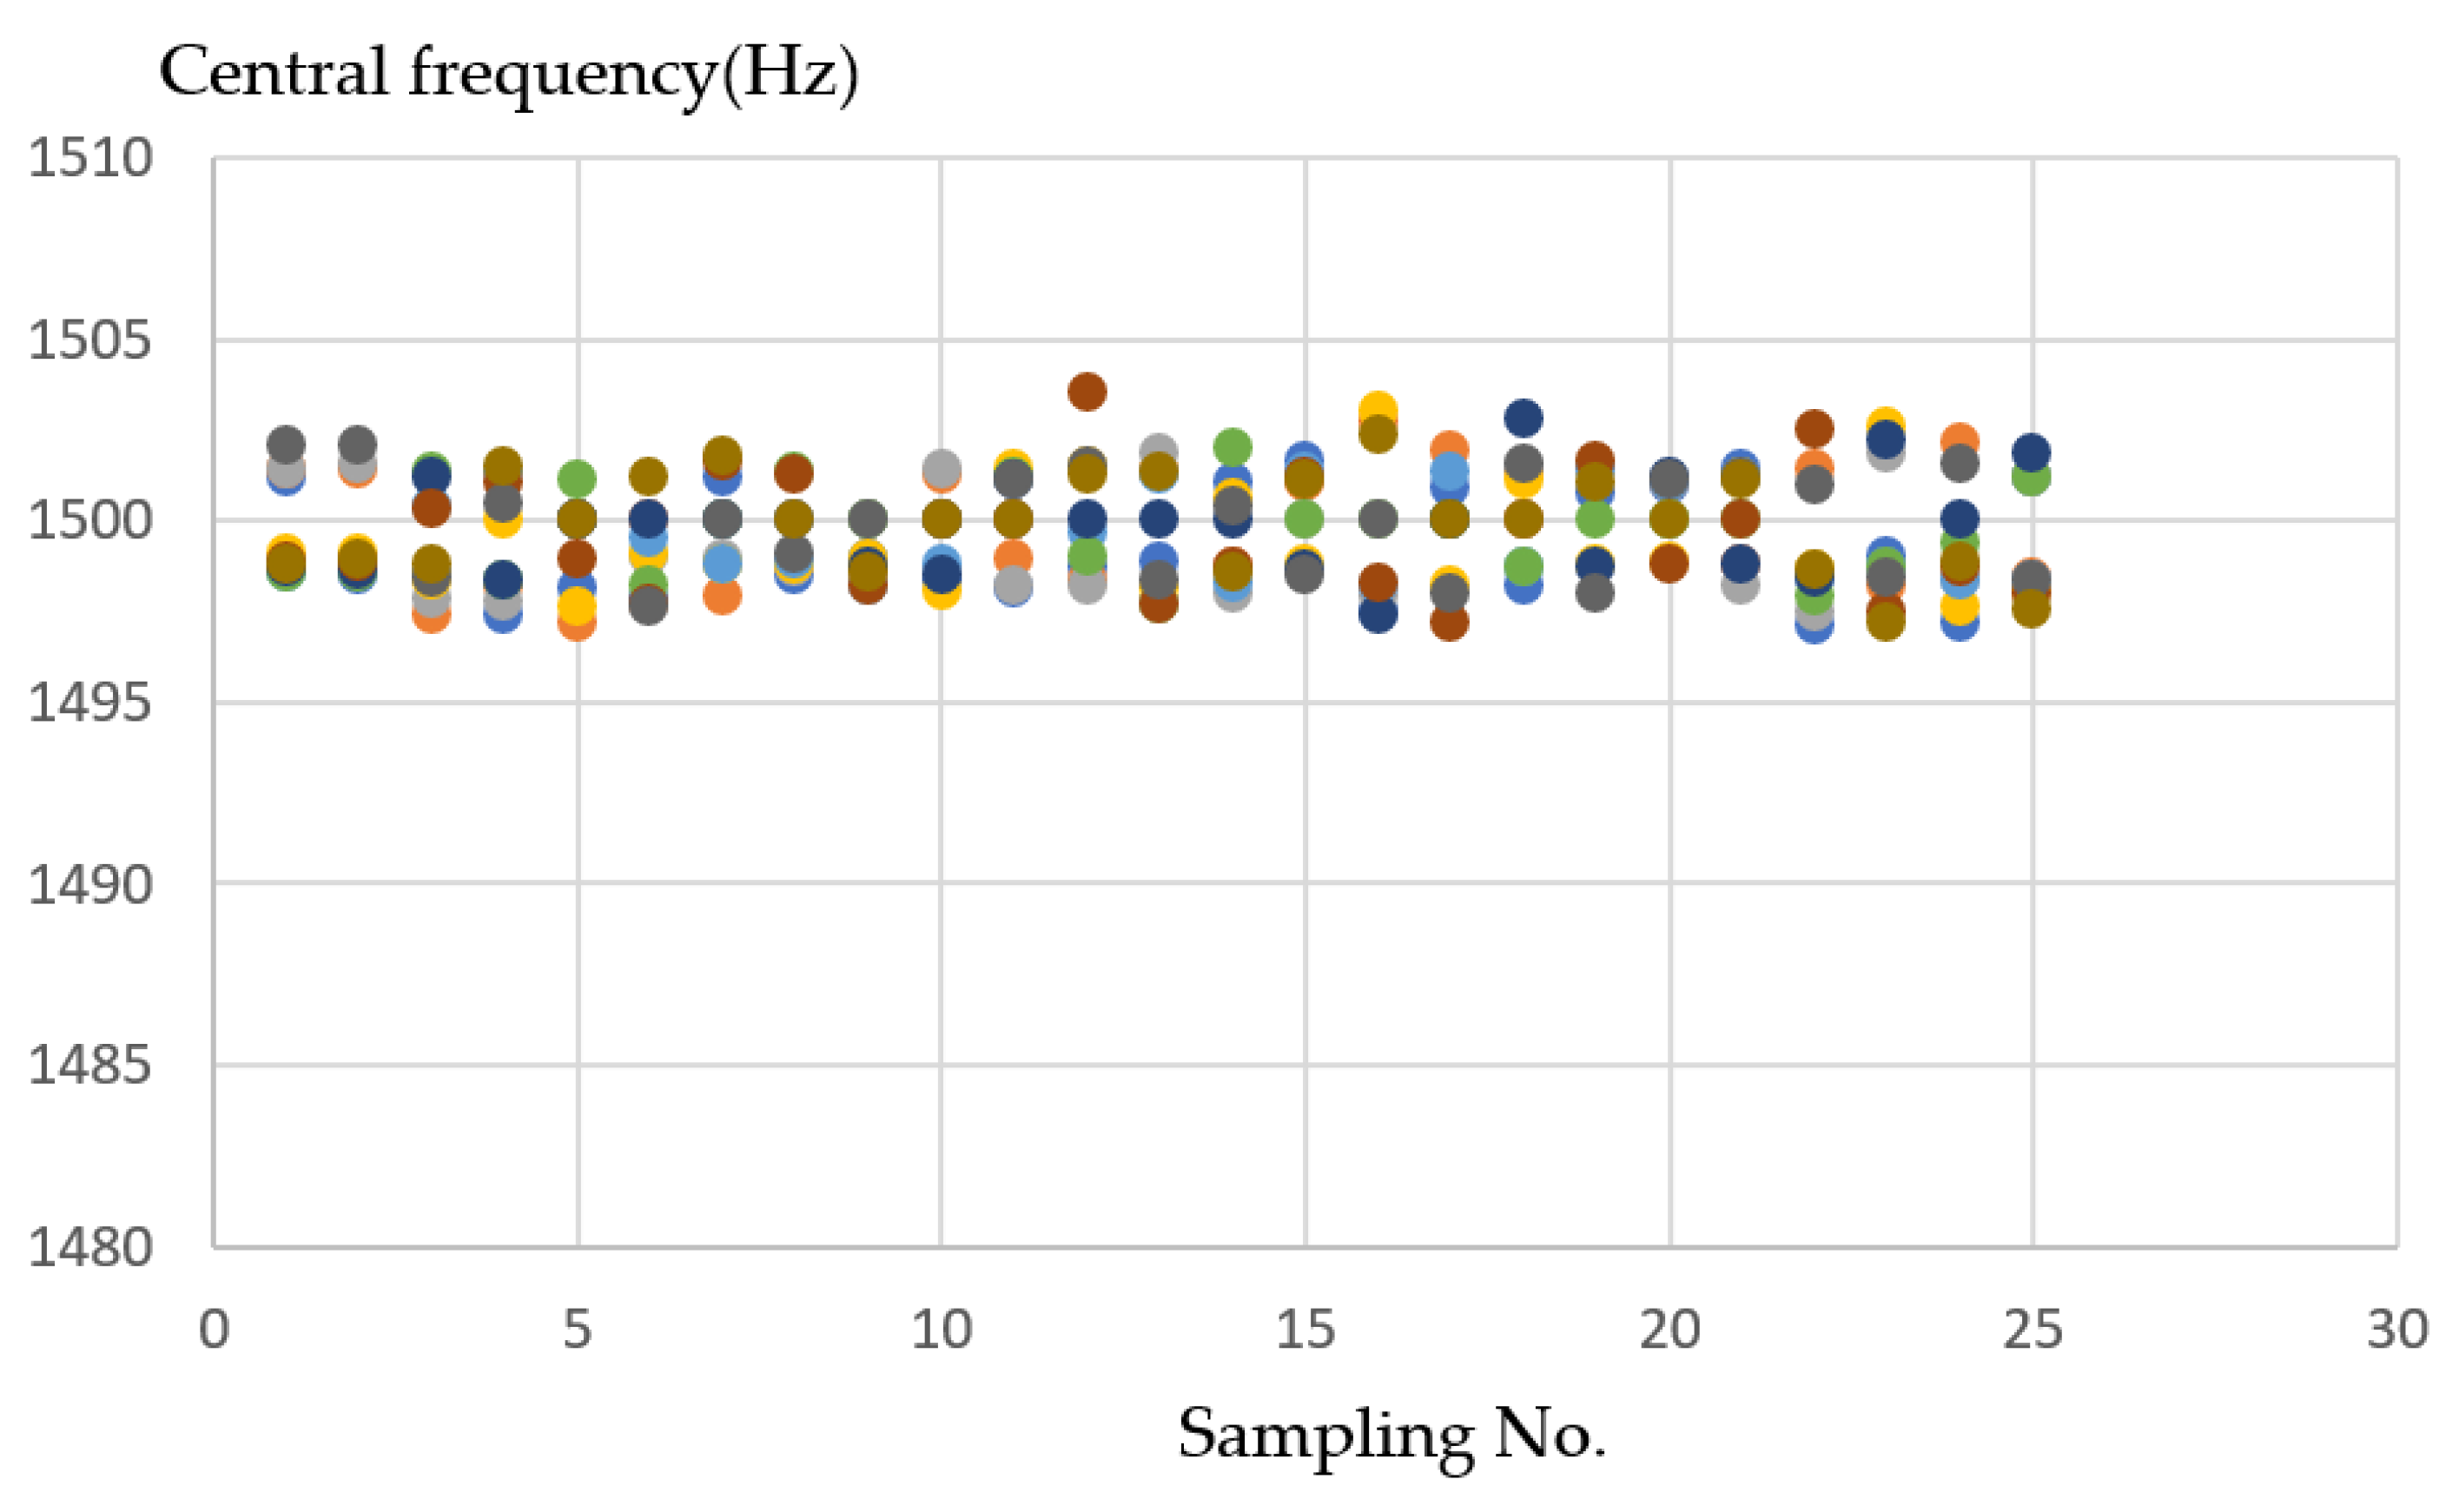
- XZ Axes
- XYZ Axes
4.3. Analysis for Different Material
- Simulation result with wood material.
- Simulation result with Styrofoam material.
- Simulation result with plastic material.
4.4. Results for Example if an Error Occurs
5. Conclusions
Author Contributions
Funding
Institutional Review Board Statement
Informed Consent Statement
Acknowledgments
Conflicts of Interest
References
- Wang, P.-L.; Tsai, Y.-T. Numerical Analysis of CNC Milling Chatter Using Embedded Miniature MEMS Microphone Array System. Inventions 2018, 3, 5. [Google Scholar] [CrossRef] [Green Version]
- Sun, P.; Lu, W.; Hu, H.; Zhang, Y.; Chen, M.; Yan, P. A Bayesian Approach to Predict Blast-Induced Damage of High Rock Slope Using Vibration and Sonic Data. Sensors 2021, 21, 2473. [Google Scholar] [CrossRef] [PubMed]
- Jaber, A.A.; Bicker, R. A Simulation of Non-stationary Signal Analysis Using Wavelet Transform Based on LabVIEW and Matlab. In Proceedings of the 2014 European Modelling Symposium, Pisa, Italy, 21–23 October 2014; pp. 138–144. [Google Scholar]
- Diana, C.; Ileana-Constanta, R. Use of feature extraction algorithm in real-time echo detection application development. In Proceedings of the 2013 E-Health and Bioengineering Conference (EHB), Iasi, Romania, 21–23 November 2013; pp. 1–4. [Google Scholar]
- Tanuska, P.; Spendla, L.; Kebisek, M.; Duris, R.; Stremy, M. Smart Anomaly Detection, and Prediction for Assembly Process Maintenance in Compliance with Industry 4.0. Sensors 2021, 21, 2376. [Google Scholar] [CrossRef] [PubMed]
- Kuo, S.-W.; Raihany, U.; Peng, C.-Y. Sound Detection of CNC Milling Machine by Embedded System. In Proceedings of the 2020 International Symposium on Computer, Consumer and Control (IS3C), Taichung, Taiwan, 13–16 November 2020; pp. 130–133. [Google Scholar]
- Shrenika, R.M.; Chikmath, S.S.; Kumar, A.V.R.; Divyashree, Y.V.; Swamy, R.K. Non-contact Water Level Monitoring System Implemented Using LabVIEW and Arduino. In Proceedings of the 2017 International Conference on Recent Advances in Electronics and Communication Technology (ICRAECT), Bangalore, India, 16–17 March 2017; pp. 306–309. [Google Scholar]
- Monteiro, C.S.; Raposo, M.; Ribeiro, P.A.; Silva, S.O.; Frazão, O. Acoustic Optical Fiber Sensor Based on Graphene Oxide Membrane. Sensors 2021, 21, 2336. [Google Scholar] [CrossRef] [PubMed]
- Kuralkar, A.R. Design of Fast Fourier Transform Using Processing Element for Real-Valued Signal. In Proceedings of the 2015 International Conference on Communications and Signal Processing (ICCSP), Melmaruvathur, India, 2–4 April 2015; pp. 1446–1448. [Google Scholar]
- Kanungo, T.; Mount, D.M.; Netanyahu, N.S.; Piatko, C.D.; Silverman, R.; Wu, A.Y. An efficient k-means clustering algorithm: Analysis and implementation. IEEE Trans. Pattern Anal. Mach. Intell. 2002, 24, 881–892. [Google Scholar] [CrossRef]
- Shah, S.; Singh, M. Comparison of a Time Efficient Modified K-mean Algorithm with K-Mean and K-Medoid Algorithm. In Proceedings of the 2012 International Conference on Communication Systems and Network Technologies, Rajkot, India, 11–13 May 2012; pp. 435–437. [Google Scholar]
- Changalasetty, S.B.; Badawy, A.S.; Thota, L.S.; Ghribi, W. Classification of moving vehicles using k-means clustering. In Proceedings of the 2015 IEEE International Conference on Electrical, Computer and Communication Technologies (ICECCT), Coimbatore, India, 5–7 March 2015; pp. 1–6. [Google Scholar]
- Altrabsheh, B. Measurement and classification of heart and lung sound using LabVIEW for educational use. J. Med Eng. Technol. 2010, 34, 340–349. [Google Scholar] [CrossRef] [PubMed]
- Józwik, J. Identification and Monitoring of Noise Sources of CNC Machine Tools by Acoustic Holography Methods. Adv. Sci. Technol. Res. J. 2016, 10, 127–137. [Google Scholar] [CrossRef]
- Józwik, J.; Wac-Włodarczyk, A.; Michałowska, J.; Kłoczko, E.M. Monitoring of the Noise Emitted by Machine Tools in Industrial Conditions. J. Ecol. Eng. 2018, 19, 83–93. [Google Scholar] [CrossRef]
- Rong, H.; Ramirez-Serrano, A.; Guan, L.; Gao, Y. Image Object Extraction Based on Semantic Detection and Improved K-Means Algorithm. IEEE Access 2020, 8, 171129–171139. [Google Scholar] [CrossRef]
- Wu, R.; Xu, Z.; Zhang, J.; Zhang, L. Robust Global Motion Estimation for Video Stabilization Based on Improved K-Means Clustering and Superpixel. Sensors 2021, 21, 2505. [Google Scholar] [CrossRef] [PubMed]
- Aisyah, S.; Untari, D.; Wijanarko, H. Design of Data Acquisition System of Environmental Parameter in Riau Islands using myRIO. In Proceedings of the 2019 2nd International Conference on Applied Engineering (ICAE), Batam, Indonesia, 2–3 October 2019; pp. 1–6. [Google Scholar]
- Chen, X.; Shum, P.; Hu, J.J. Special Control of the Cutoff Frequencies in a 2D Photonic Crystal Coupled-Cavity Waveguide. Opt. Commun. 2007, 276, 93–96. [Google Scholar] [CrossRef]
- Agrawal, N.; Kumar, A.; Bajaj, V.; Singh, G.K. Design of Bandpass and Bandstop Infinite Impulse Response Filters Using Fractional Derivative. IEEE Trans. Ind. Electron. 2019, 66, 1285–1295. [Google Scholar] [CrossRef]
- Nam, S.; Lee, B.; Lee, J. Theory for Pseudo-Butterworth Filter Response and Its Application to Bandwidth Tuning. IEEE Trans. Microw. Theory. Tech. 2017, 65, 2847–2856. [Google Scholar] [CrossRef]
- Clark, C.J.; Silva, C.P.; Moulthrop, A.A.; Muha, M.S. Power-amplifier characterization using a two-tone measurement technique. IEEE Trans. Microw. Theory Tech. 2002, 50, 1590–1602. [Google Scholar] [CrossRef]
- Sowjanya, K.; Kumari, B. Design and Performance Analysis of 32 And 64 Point FFT Using Radix-2 Algorithm. Int. J. Comput. Appl. 2013, 78, 25–29. [Google Scholar] [CrossRef]
- Rafezi, H.; Akbari, J.; Behzad, M. Tool Condition Monitoring based on sound and vibration analysis and wavelet packet decomposition. In Proceedings of the 2012 8th International Symposium on Mechatronics and Its Applications, Sharjah, United Arab Emirates, 10–12 April 2012; pp. 1–4. [Google Scholar]
- Banerjee, S.; Choudhary, A.; Pal, S. Empirical evaluation of K-Means, Bisecting K-Means, Fuzzy C-Means, and Genetic K-Means clustering algorithms. In Proceedings of the 2015 IEEE International WIE Conference on Electrical and Computer Engineering (WIECON-ECE), Dhaka, Bangladesh, 19–20 December 2015; pp. 168–172. [Google Scholar]
- Mahmud, S.M.H.; Hossin, M.A.; Jahan, H.; Noori, S.R.H.; Bhuiyan, T. CSV-ANNOTATE: Generate annotated tables from CSV file. In Proceedings of the 2018 International Conference on Artificial Intelligence and Big Data (ICAIBD), Chengdu, China, 26–28 May 2018; pp. 71–75. [Google Scholar]
- Tewinkel, G.C. Mathematical Basis of Analytic Aerotriangulation; Aerial Triangulation; U.S. Government Printing Office: Washington, DC, USA, 1959; Volume 4. [Google Scholar]
- Rochardjo, H.S.B.; Sakanegara, B.G. Development of styrofoam cutter NC machine for intricate cutting path. In Proceedings of the 2017 7th International Annual Engineering Seminar (InAES), Yogyakarta, Indonesia, 1–2 August 2017; pp. 1–4. [Google Scholar]
- Wu, L.; Ye, Q.; Yao, L.; Huang, R.; Wang, J. The Data Processing System of CNC Wood-Working Milling Machine. In Proceedings of the 2011 Second International Conference on Digital Manufacturing & Automation, Zhangjiajie, China, 5–7 August 2011; pp. 1240–1243. [Google Scholar]
- Zhang, H.; Ai, C.; Zhao, F.; Ze, X. The CNC development of the sawing and milling machining center for plastic door and window PVC profile based on Fanuc0. In Proceedings of the 2008 7th World Congress on Intelligent Control and Automation, Chongqing, China, 25–27 June 2008; pp. 9362–9367. [Google Scholar]
- Datron, A.G. DATRON CNC Project: Packaging Industry [Video]. Available online: https://youtu.be/qQi3EN_wR80 (accessed on 18 May 2017).
- Gobekoglu, H. EdgecamWaveform on Okuma Multus U3000 [Video]. Available online: https://youtu.be/gRZMiyjv-S4 (accessed on 10 December 2020).
- Bantam Tools. What Does it Sound like to Machine Aluminum? [Video]. Available online: https://youtu.be/lwyqQCDKY_g (accessed on 9 July 2020).
- Liu, Y.; Zhang, H.; Wang, X. Analysis on Influence of Perpendicularity Error of Five-Axes NC Machine Tool Error Modeling Accuracy and Complexity. Procedia Eng. 2017, 174, 557–565. [Google Scholar] [CrossRef]
- Liu, Y.; Wan, M.; Xing, W.-J.; Zhang, W.-H. Identification of position-independent geometric errors of rotary axes for five-axes machine tools with structural restrictions. Robot. Comput. Integr. Manuf. 2018, 53, 45–57. [Google Scholar] [CrossRef]
- Xie, Y.; Li, Y.; Cheung, C.F.; Zhu, Z.; Chen, X. Design and analysis of a novel compact XYZ parallel precision positioning stage. Microsyst. Technol. 2020, 27, 1925–1932. [Google Scholar] [CrossRef]
- THink Media 79. Giant Wooden Door Design with Automated CNC Router—Amazing Modern Woodworking Machine [Video]. Available online: https://youtu.be/5Ua1_vdUnV0 (accessed on 8 September 2020).
- Datron, A.G. DATRON Schaumstofffräser-Hochgeschwindigkeits-Fräsen von PU-Schaum [Video]. Available online: https://youtu.be/q_36kSEvWdM (accessed on 13 April 2014).
- Walky. My CNC Cutting Some Plastic [Video]. Available online: https://youtu.be/vurdVkGl05w (accessed on 10 June 2011).
- Godfrey, M.W.; Zou, L. Using origin analysis to detect merging and splitting of source code entities. IEEE Trans. Softw. Eng. 2005, 31, 166–181. [Google Scholar] [CrossRef]
- Zhang, X.; Xu, Q. Design and analysis of an in-plane flexure XYZ micro/nano-positioning stage. In Proceedings of the 2016 International Conference on Advanced Robotics and Mechatronics (ICARM), Macau, China, 18–20 August 2016; pp. 359–363. [Google Scholar]
- Nilsson, H.; Sidén, J.; Gulliksson, M. An incontinence alarm solution utilizing RFID based sensor technology. In Proceedings of the 2011 IEEE International Conference on RFID-Technologies and Applications, Sitges, Spain, 15–16 September 2011; pp. 359–363. [Google Scholar]
- Xiao, F.; Miao, Q.; Xie, X.; Sun, L.; Wang, R. Indoor Anti-Collision Alarm System Based on Wearable Internet of Things for Smart Healthcare. IEEE Commun. Mag. 2018, 56, 53–59. [Google Scholar] [CrossRef]
- Deshpande, S.M.; Ainapure, B. An Intelligent Virtual Machine Monitoring System Using KVM for Reliable and Secure Environment in Cloud. In Proceedings of the 2016 IEEE International Conference on Advances in Electronics, Communication and Computer Technology (ICAECCT), Pune, India, 2–3 December 2016; pp. 314–319. [Google Scholar]


| Parameters | Experiment Data in Simulation |
|---|---|
| Microphone (Realtek High Definition Audio) | Channel 1 |
| Lower cut-off frequency [19], ωl | 1000 (Hz) |
| Uppercut-off frequency, ωu | 1700 (Hz) |
| Butterworth topology | Order (3) |
| Approximate frequency | 1350 (Hz) |
Publisher’s Note: MDPI stays neutral with regard to jurisdictional claims in published maps and institutional affiliations. |
© 2021 by the authors. Licensee MDPI, Basel, Switzerland. This article is an open access article distributed under the terms and conditions of the Creative Commons Attribution (CC BY) license (https://creativecommons.org/licenses/by/4.0/).
Share and Cite
Peng, C.-Y.; Raihany, U.; Kuo, S.-W.; Chen, Y.-Z. Sound Detection Monitoring Tool in CNC Milling Sounds by K-Means Clustering Algorithm. Sensors 2021, 21, 4288. https://doi.org/10.3390/s21134288
Peng C-Y, Raihany U, Kuo S-W, Chen Y-Z. Sound Detection Monitoring Tool in CNC Milling Sounds by K-Means Clustering Algorithm. Sensors. 2021; 21(13):4288. https://doi.org/10.3390/s21134288
Chicago/Turabian StylePeng, Cheng-Yu, Ully Raihany, Shu-Wei Kuo, and Yen-Zuo Chen. 2021. "Sound Detection Monitoring Tool in CNC Milling Sounds by K-Means Clustering Algorithm" Sensors 21, no. 13: 4288. https://doi.org/10.3390/s21134288
APA StylePeng, C.-Y., Raihany, U., Kuo, S.-W., & Chen, Y.-Z. (2021). Sound Detection Monitoring Tool in CNC Milling Sounds by K-Means Clustering Algorithm. Sensors, 21(13), 4288. https://doi.org/10.3390/s21134288