
A 3D-Printed Soft Fingertip Sensor for Providing Information about Normal and Shear Components of Interaction Forces

 ,
, 
Abstract
:1. Introduction
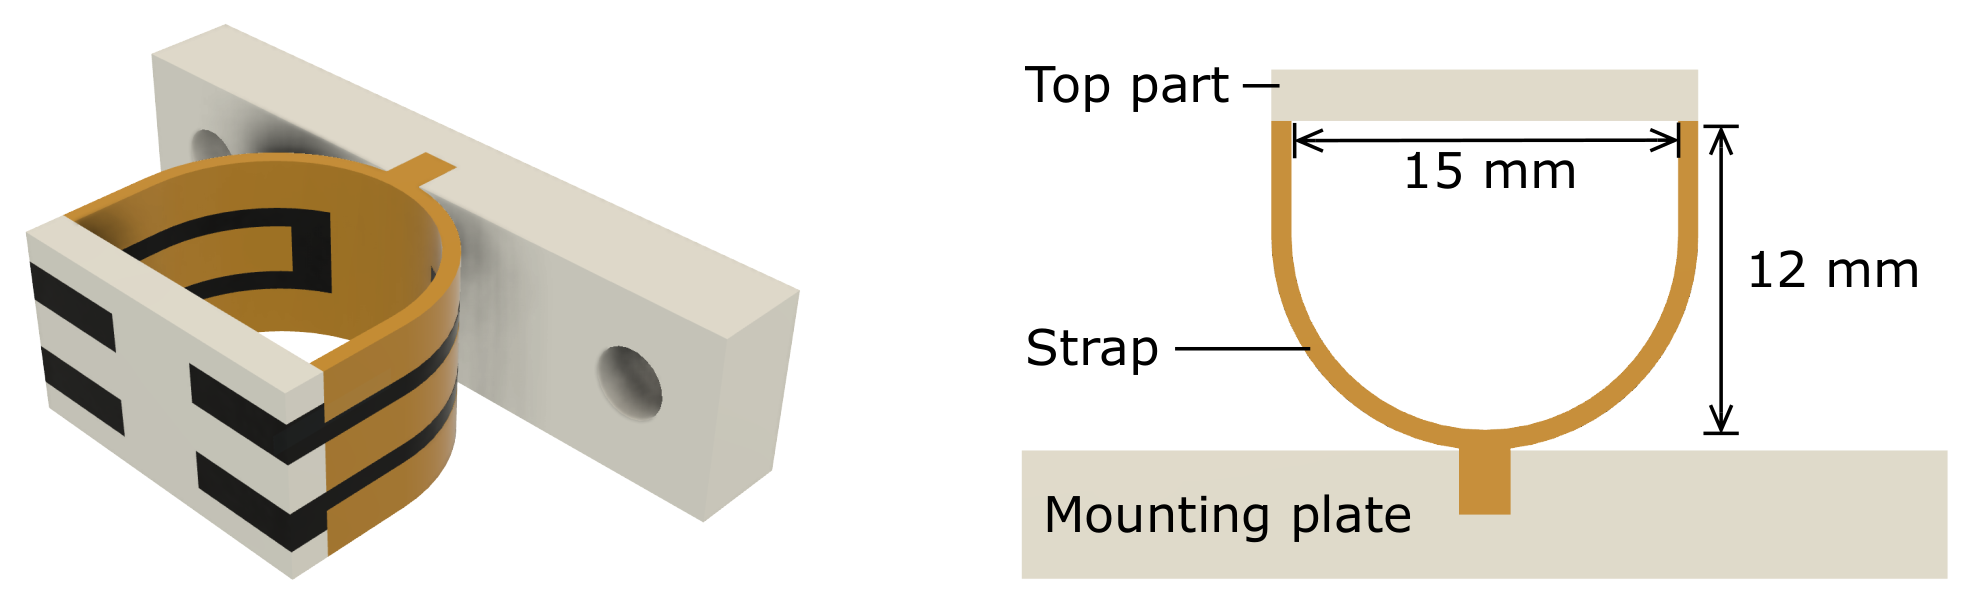
2. Design
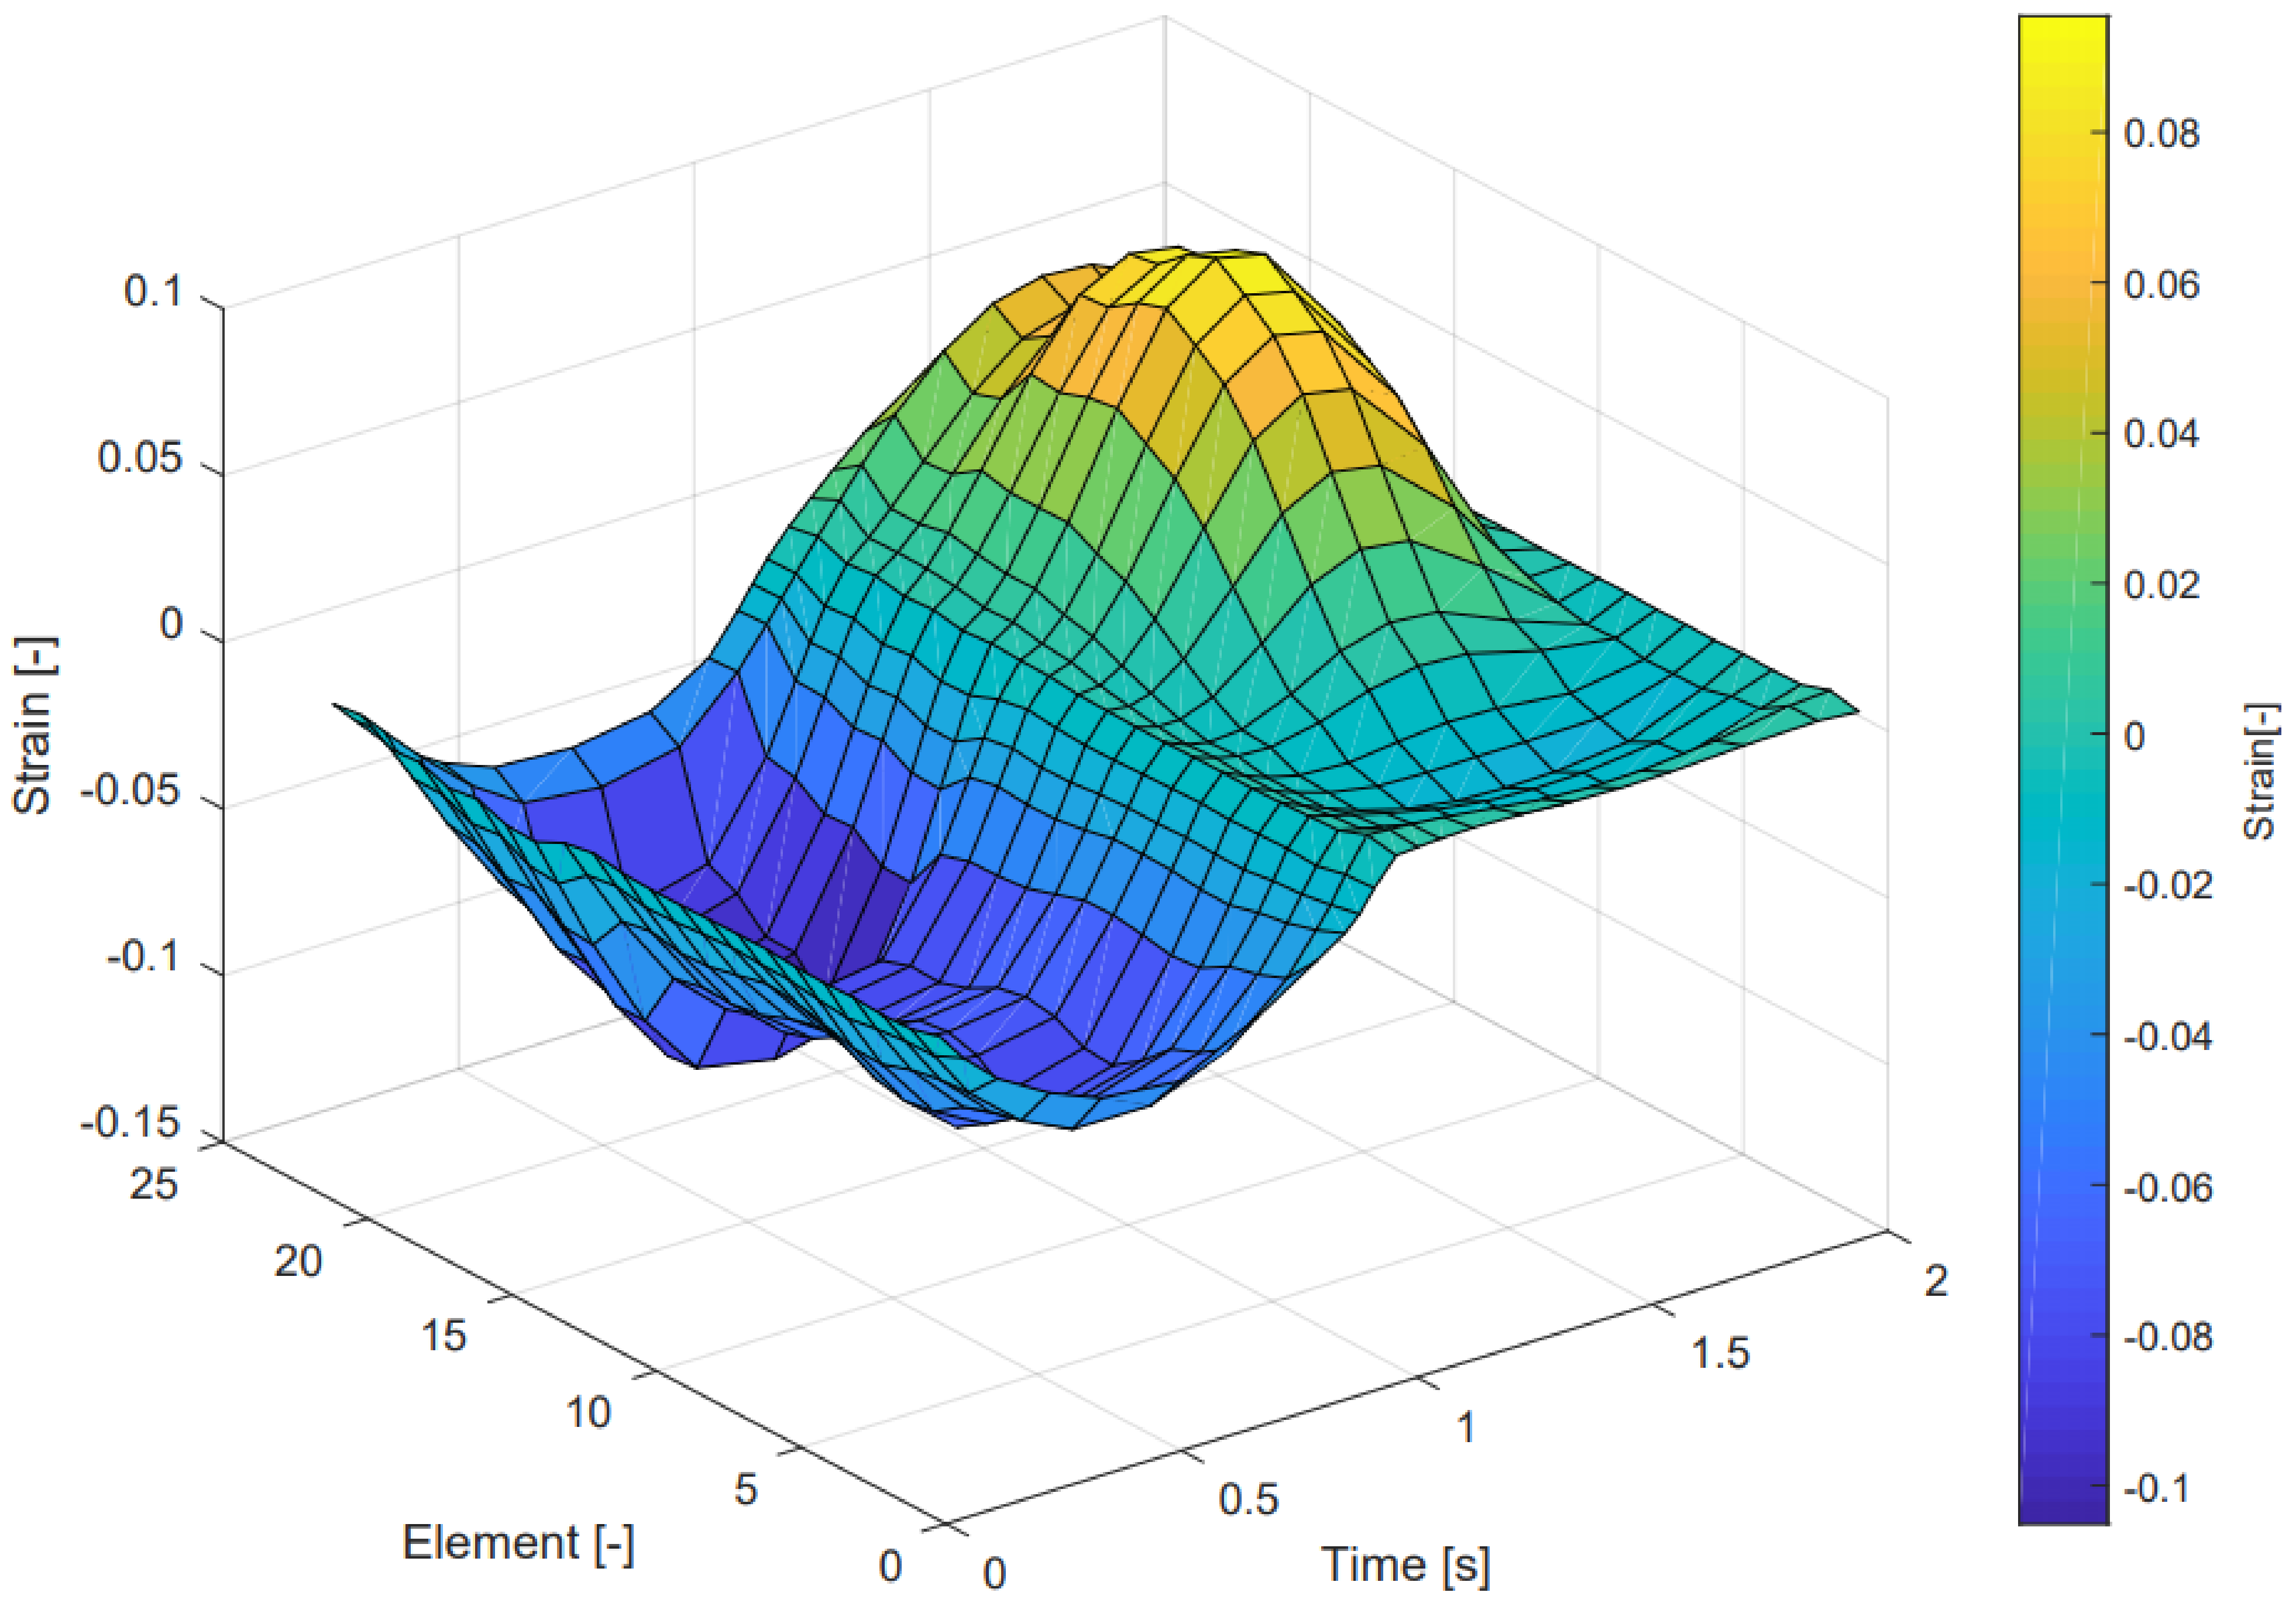
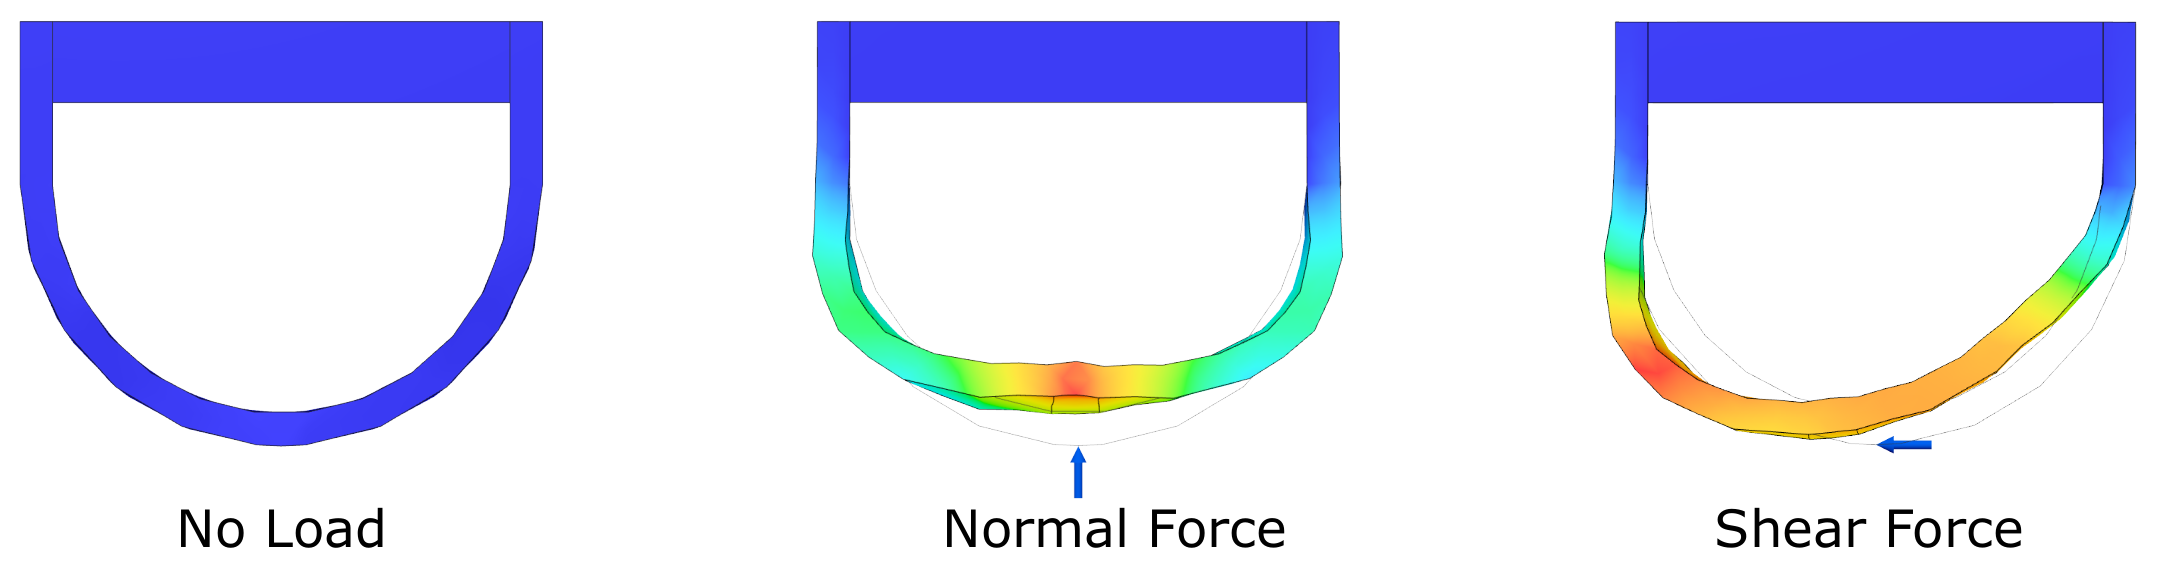
3. Numerical Simulation
4. Methods
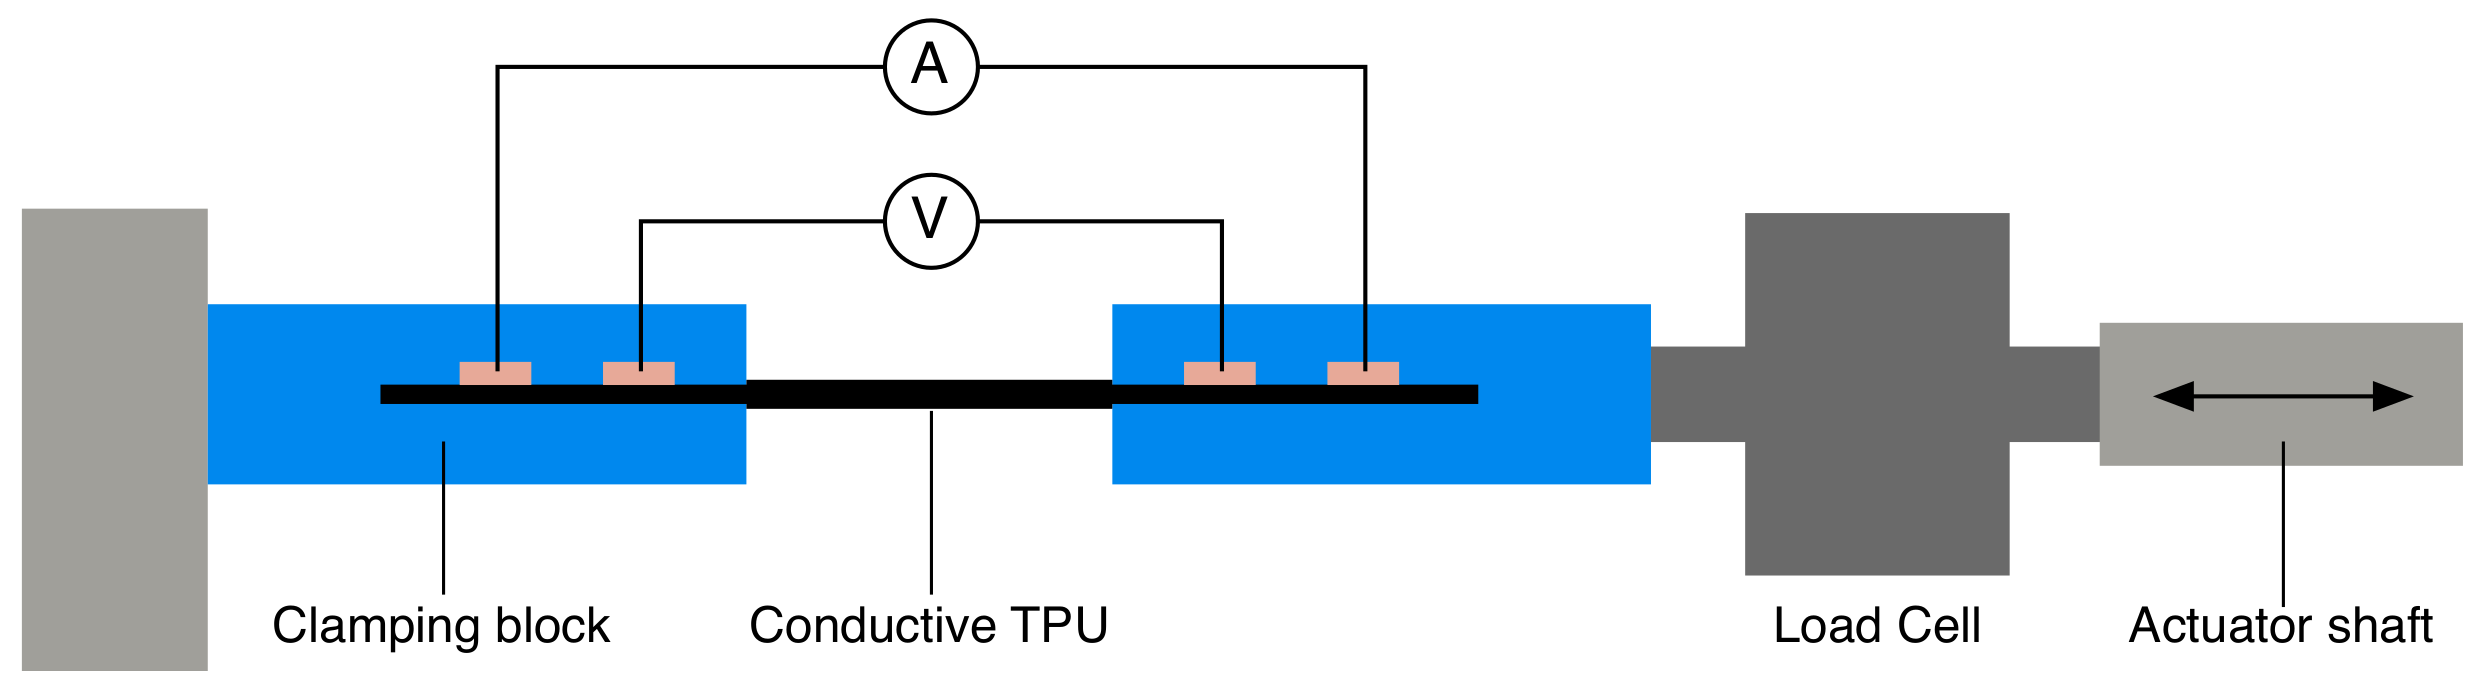
4.1. Characterization of Conductive TPU
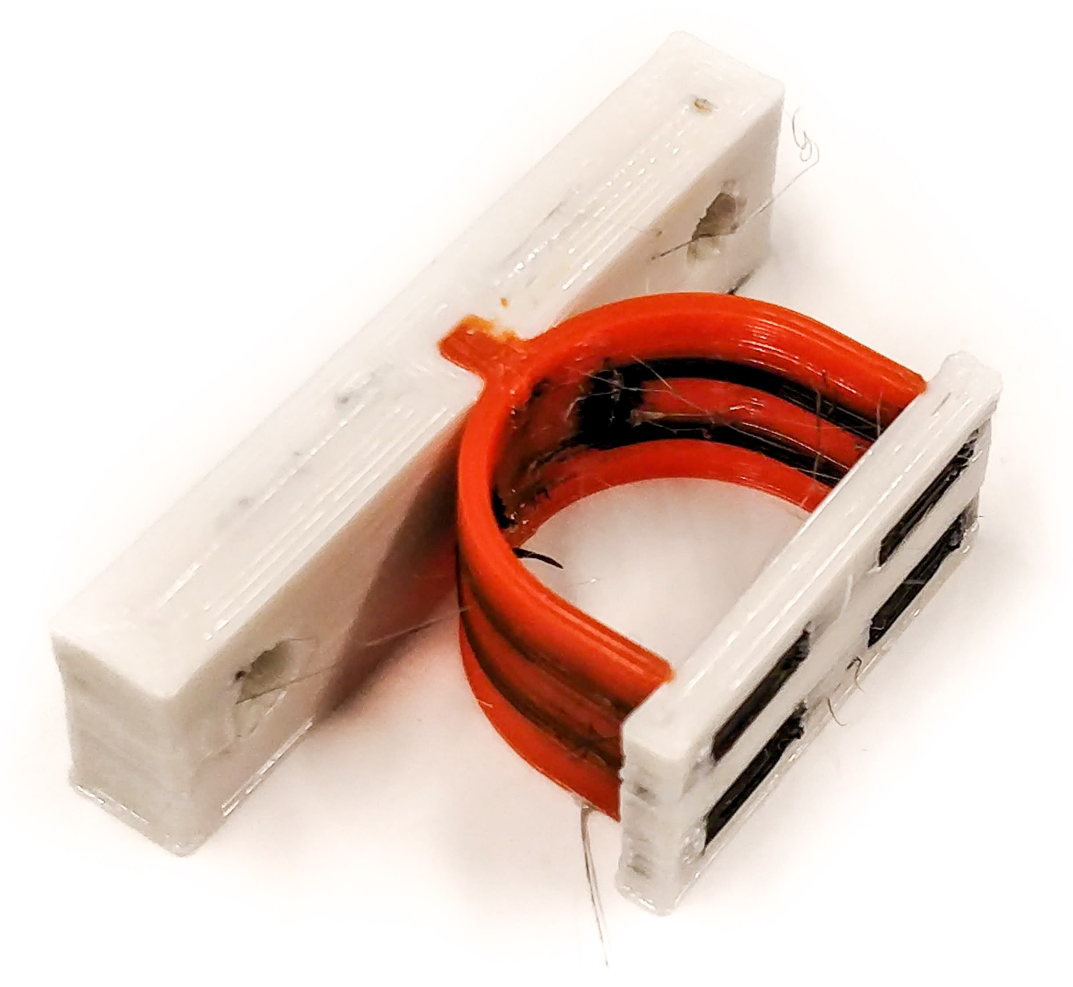
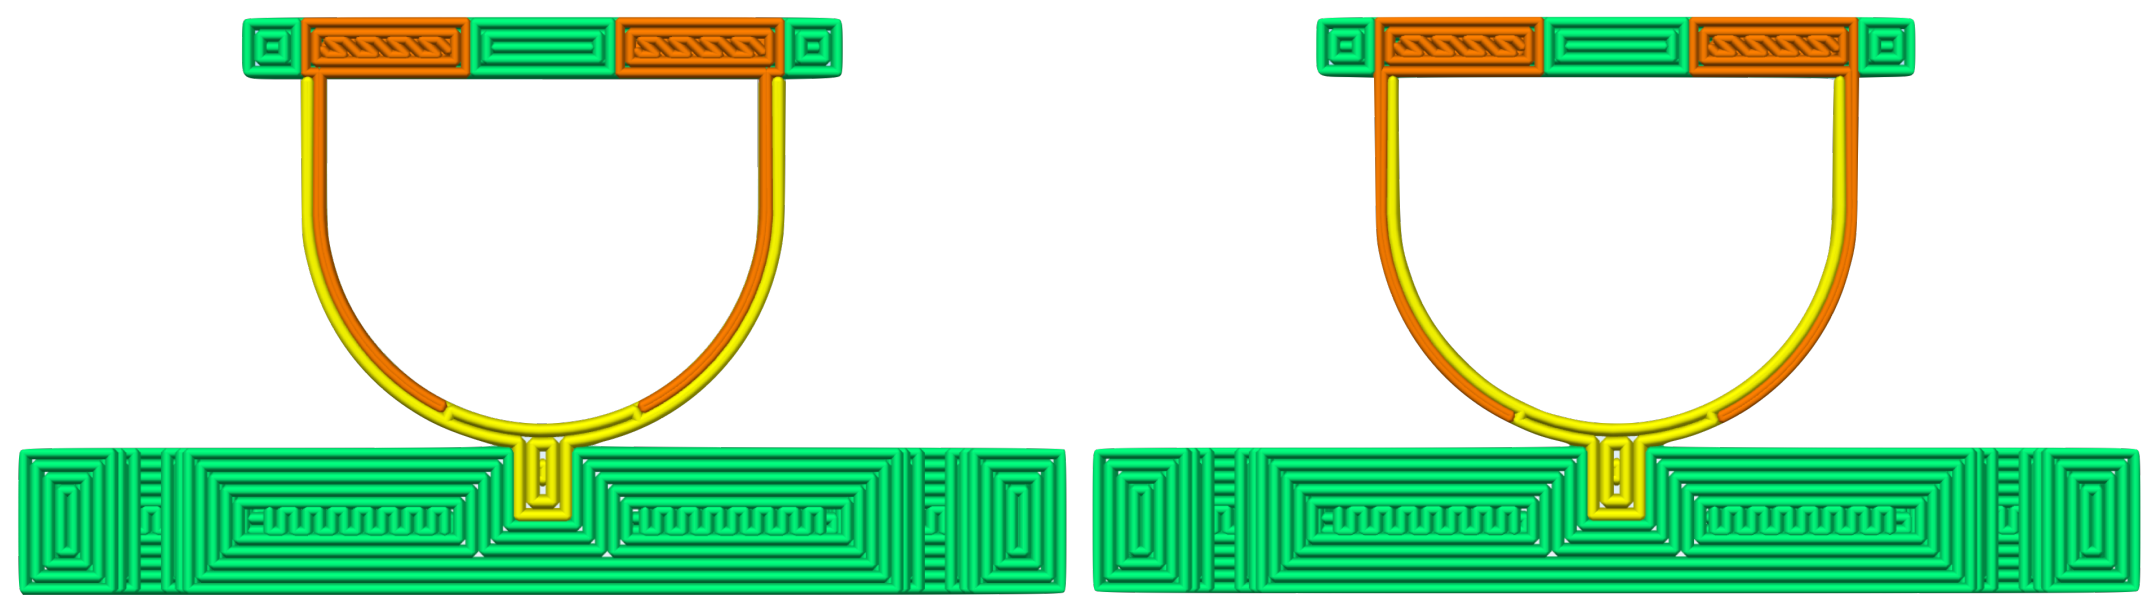
4.2. Sensor Fabrication
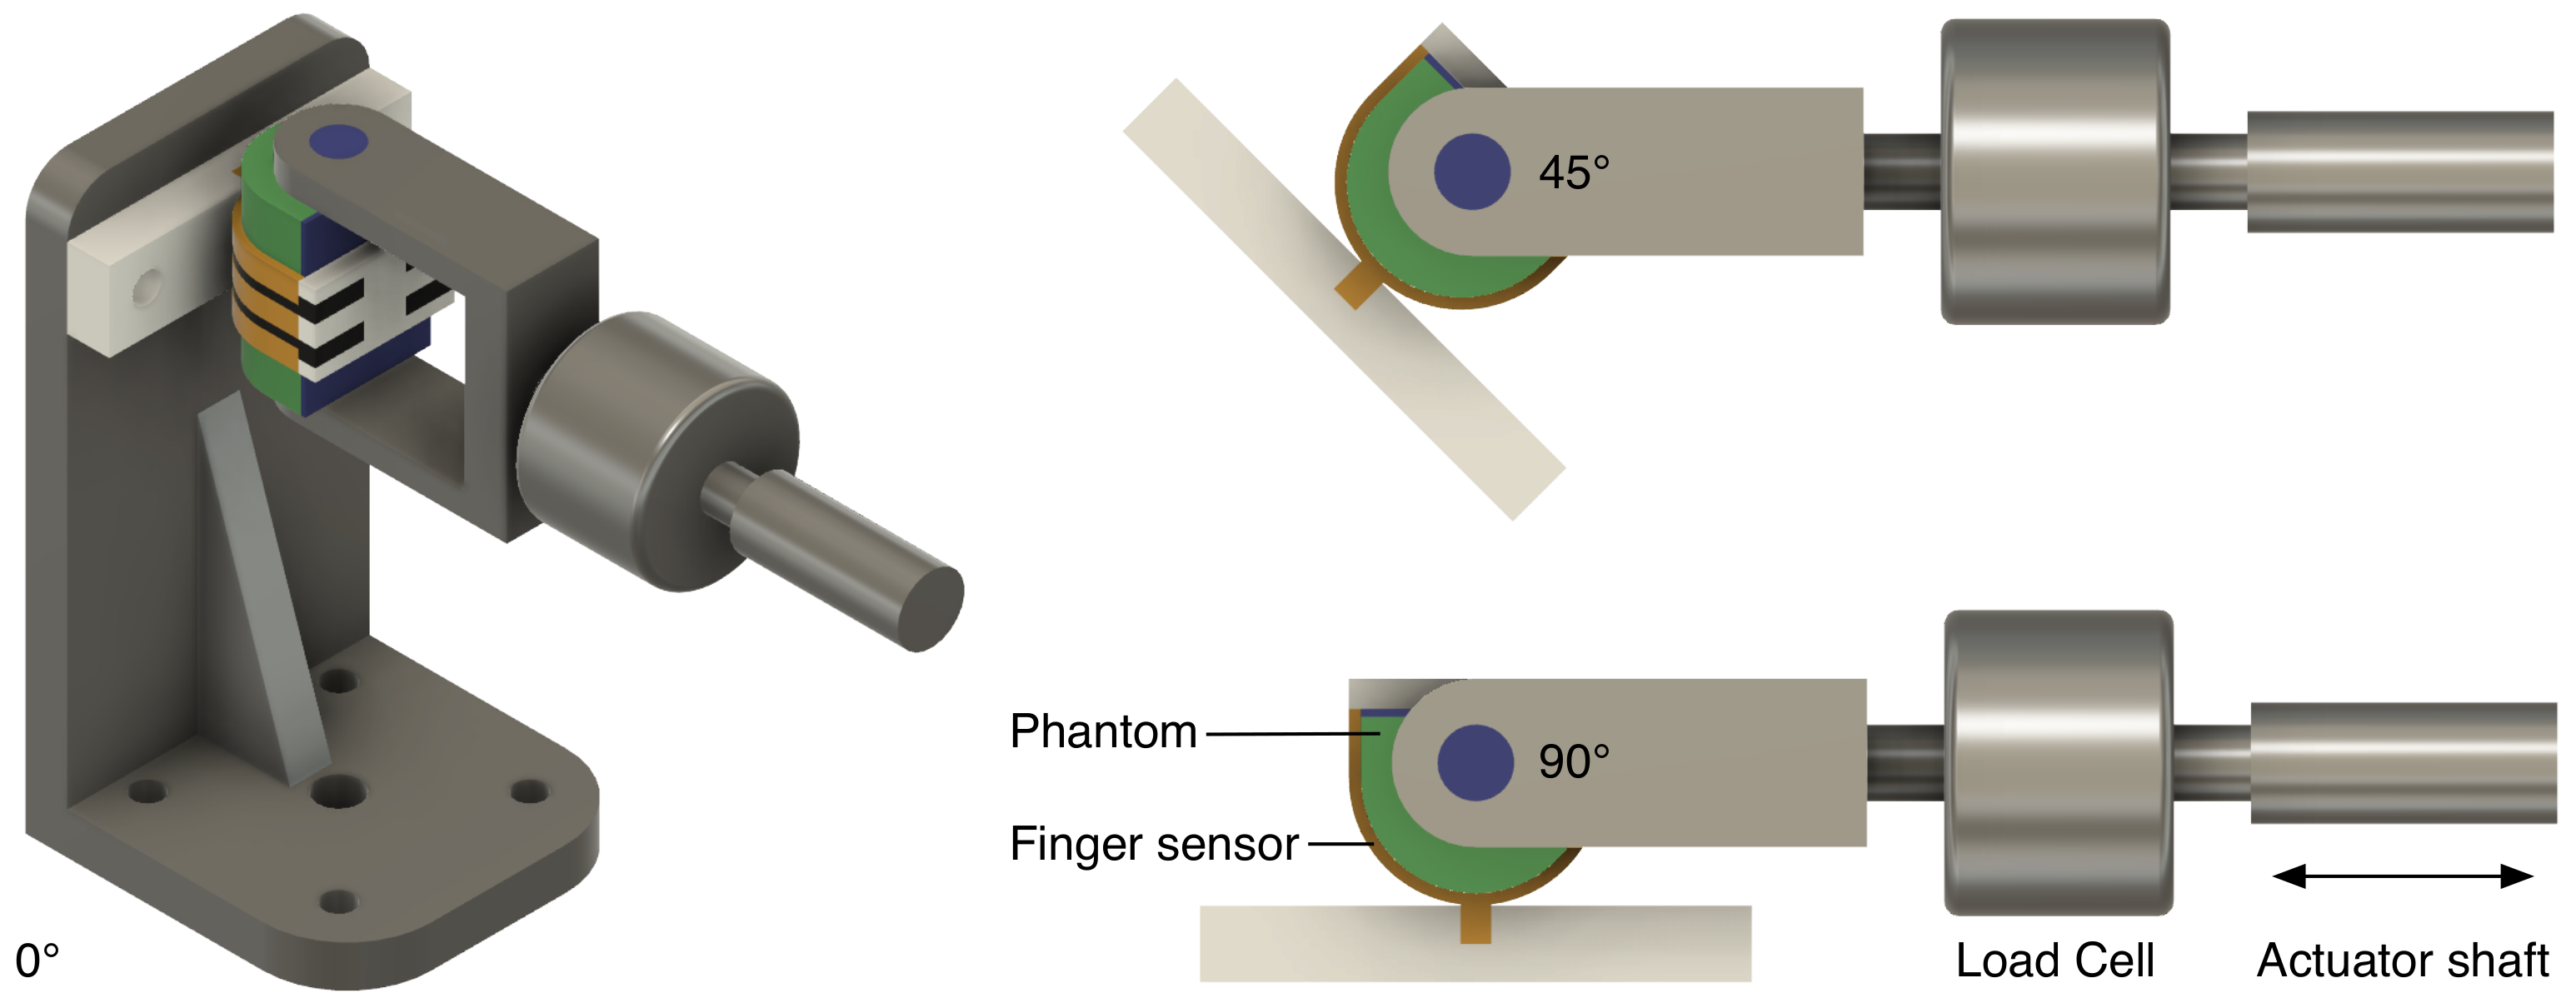
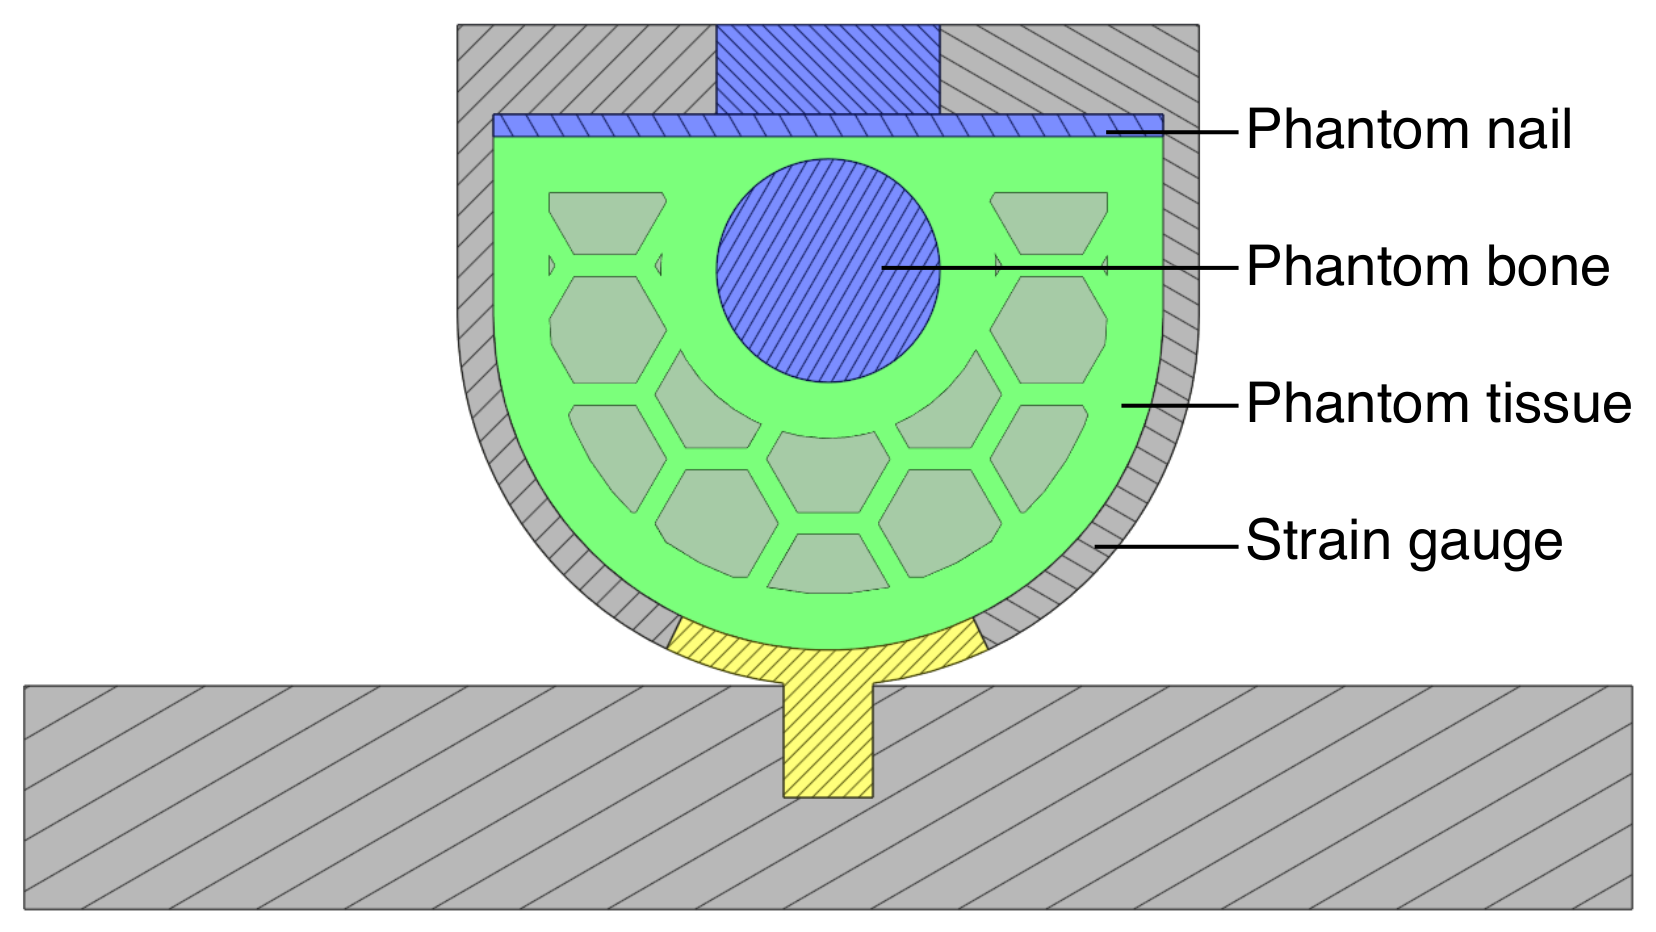
4.3. Sensor Characterisation
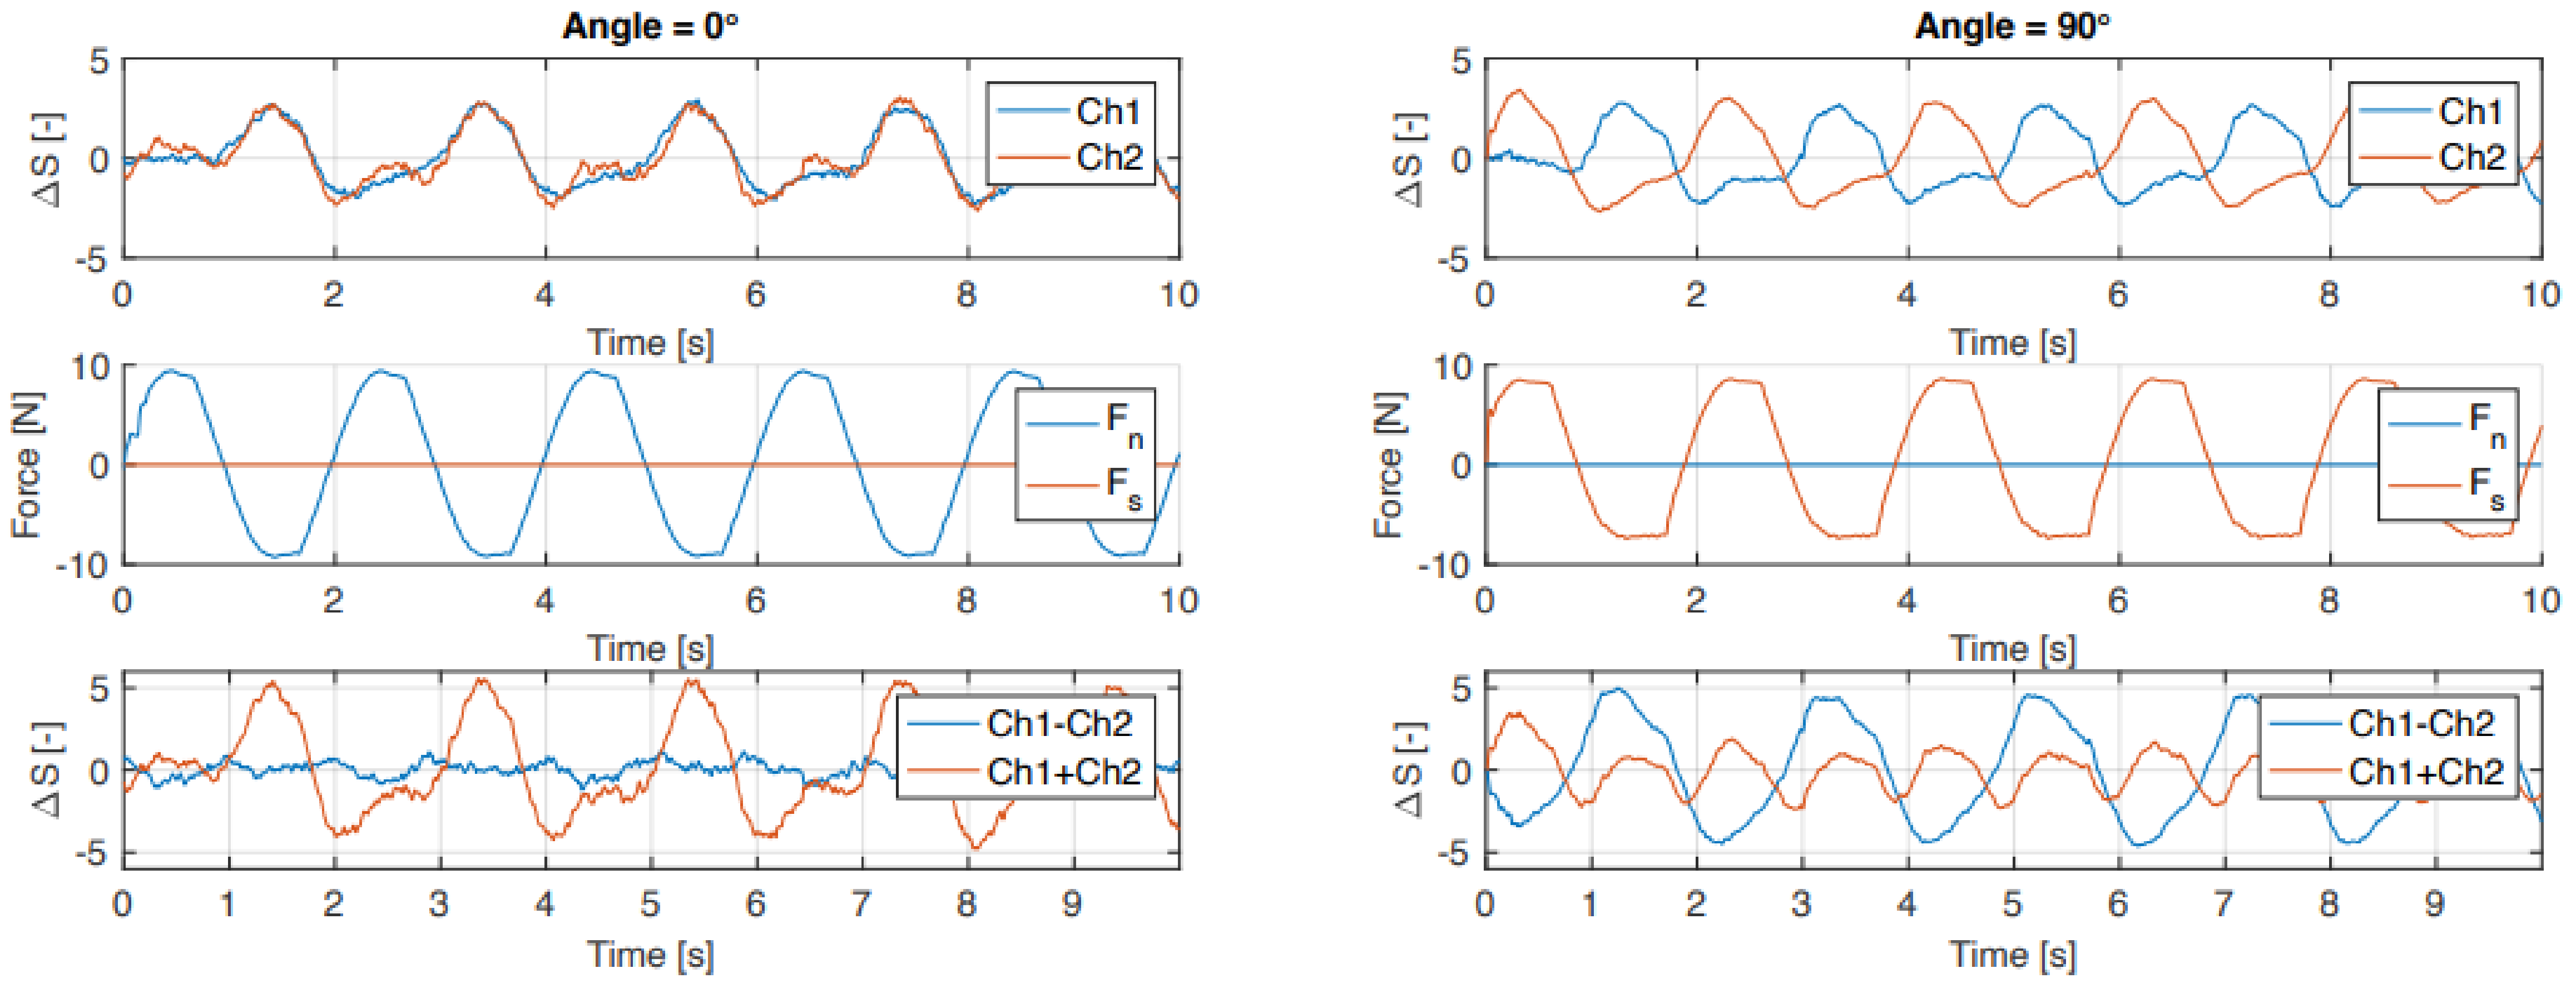
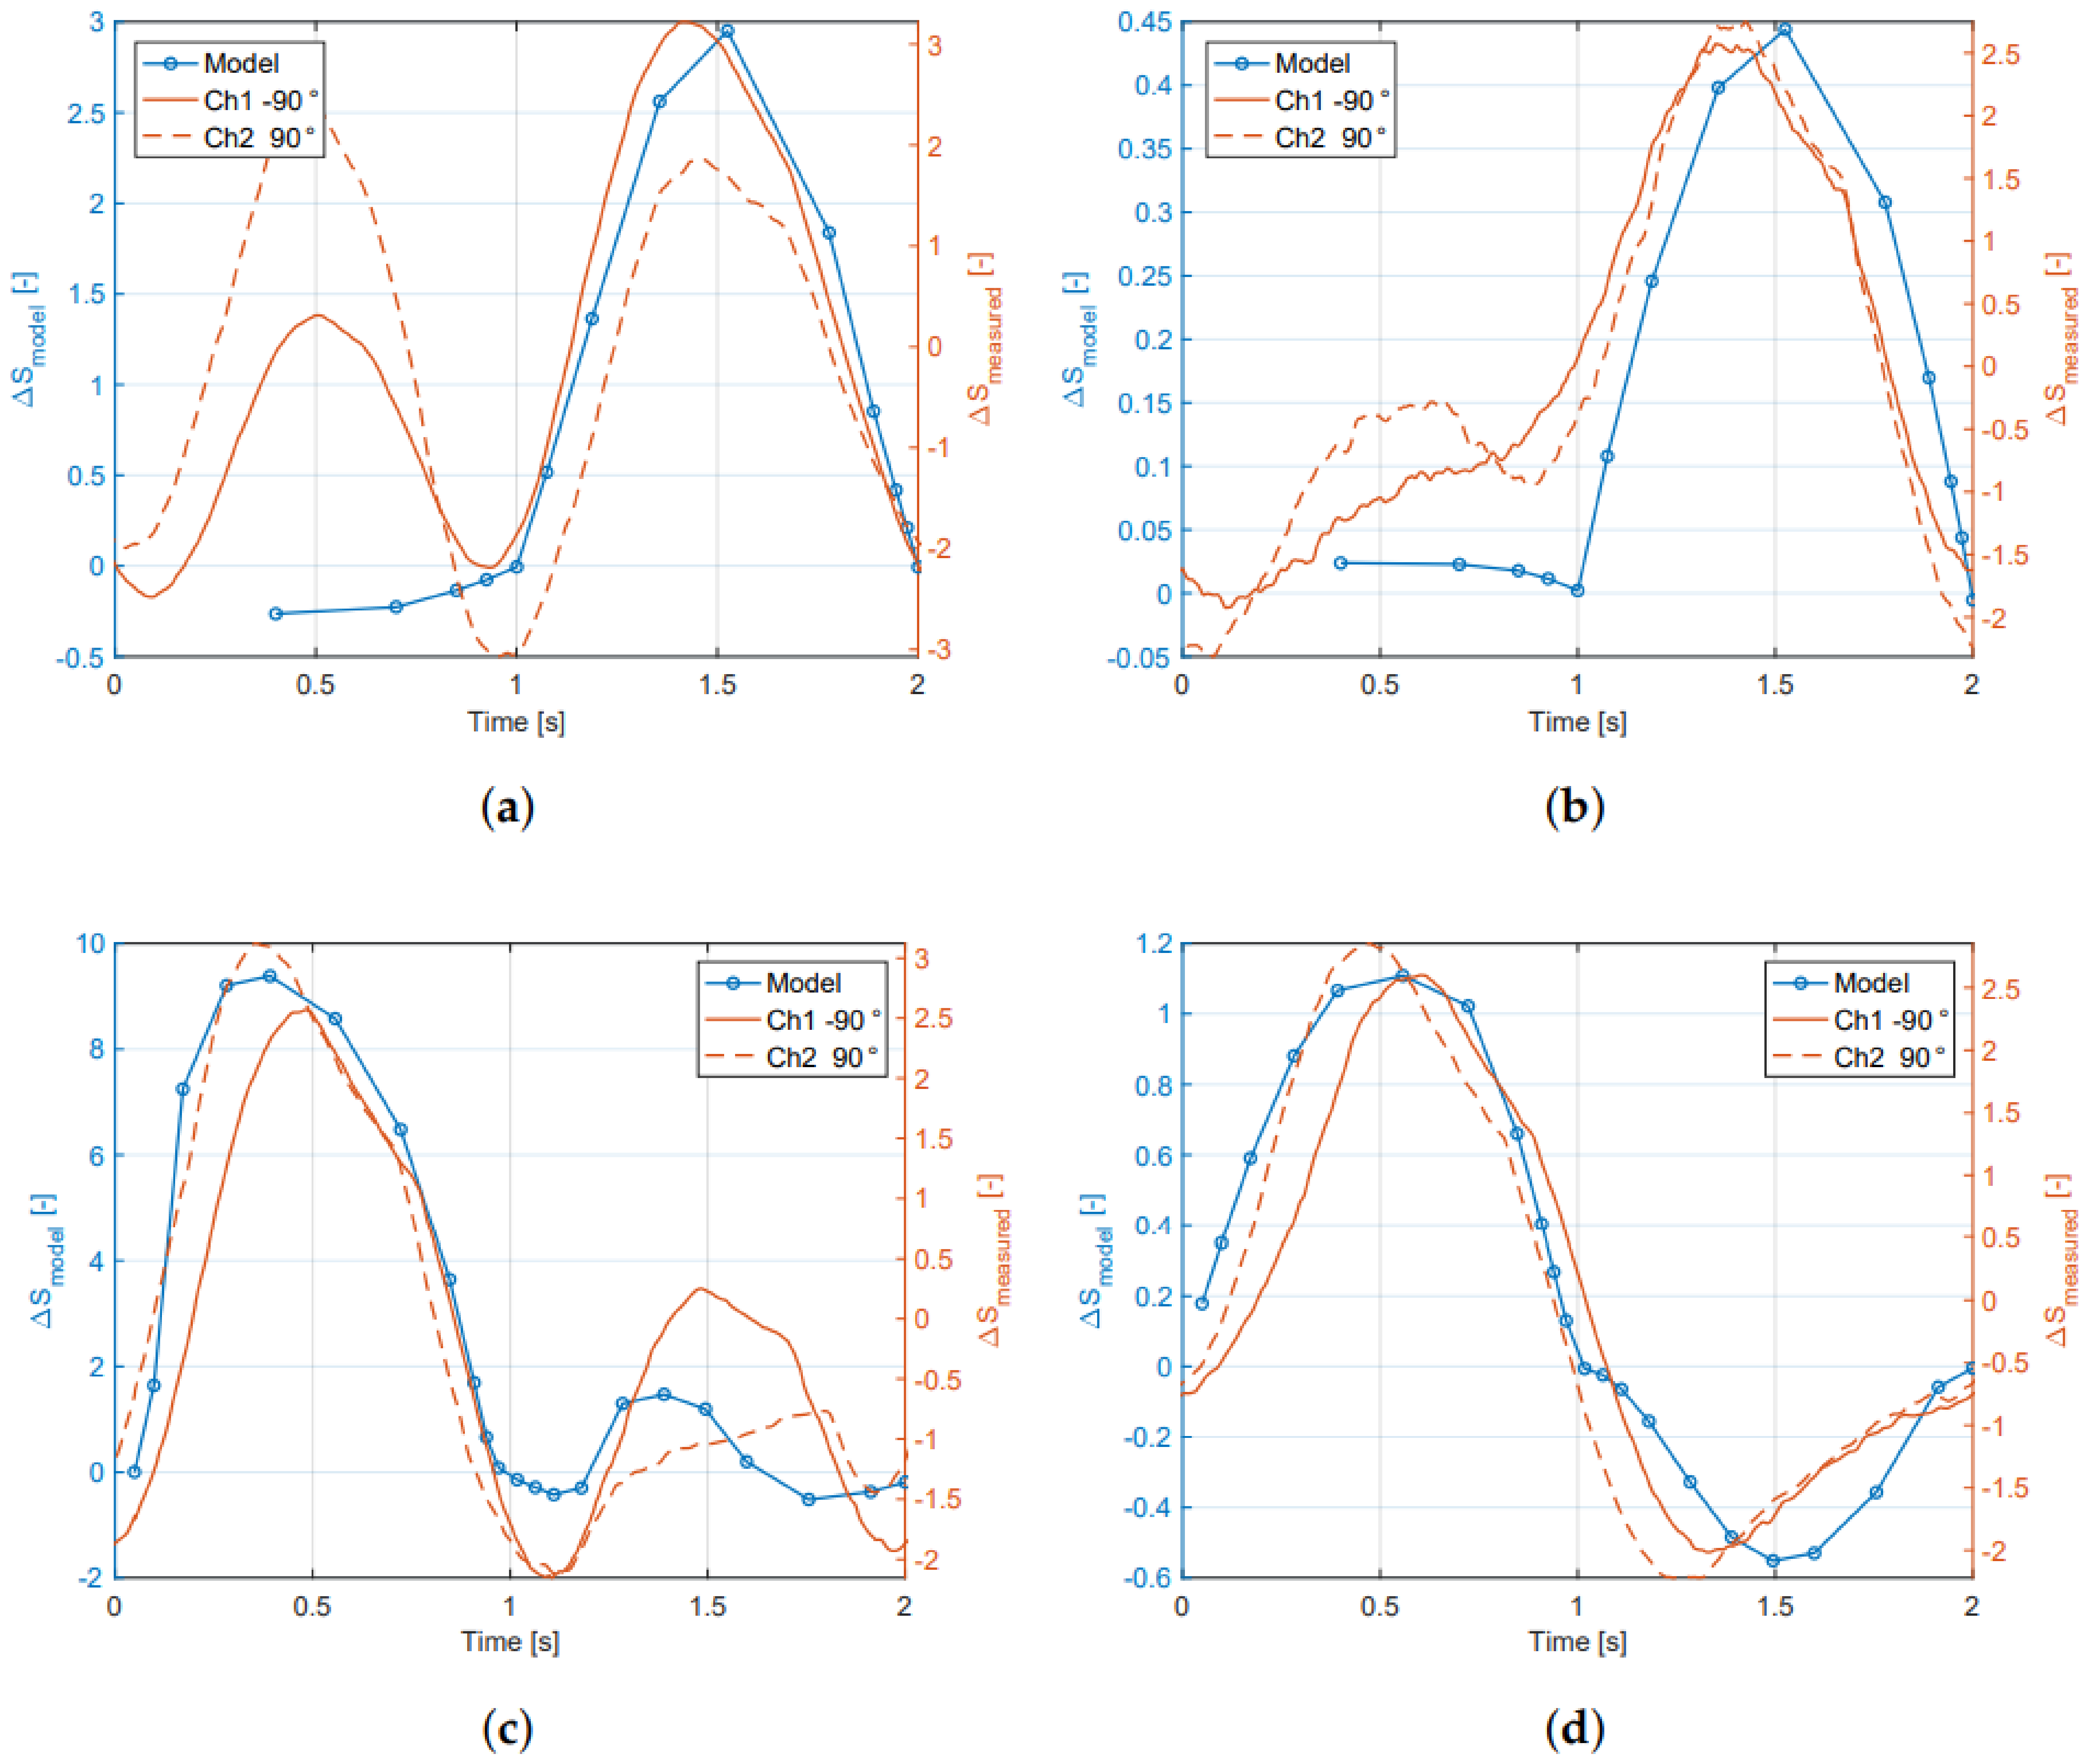
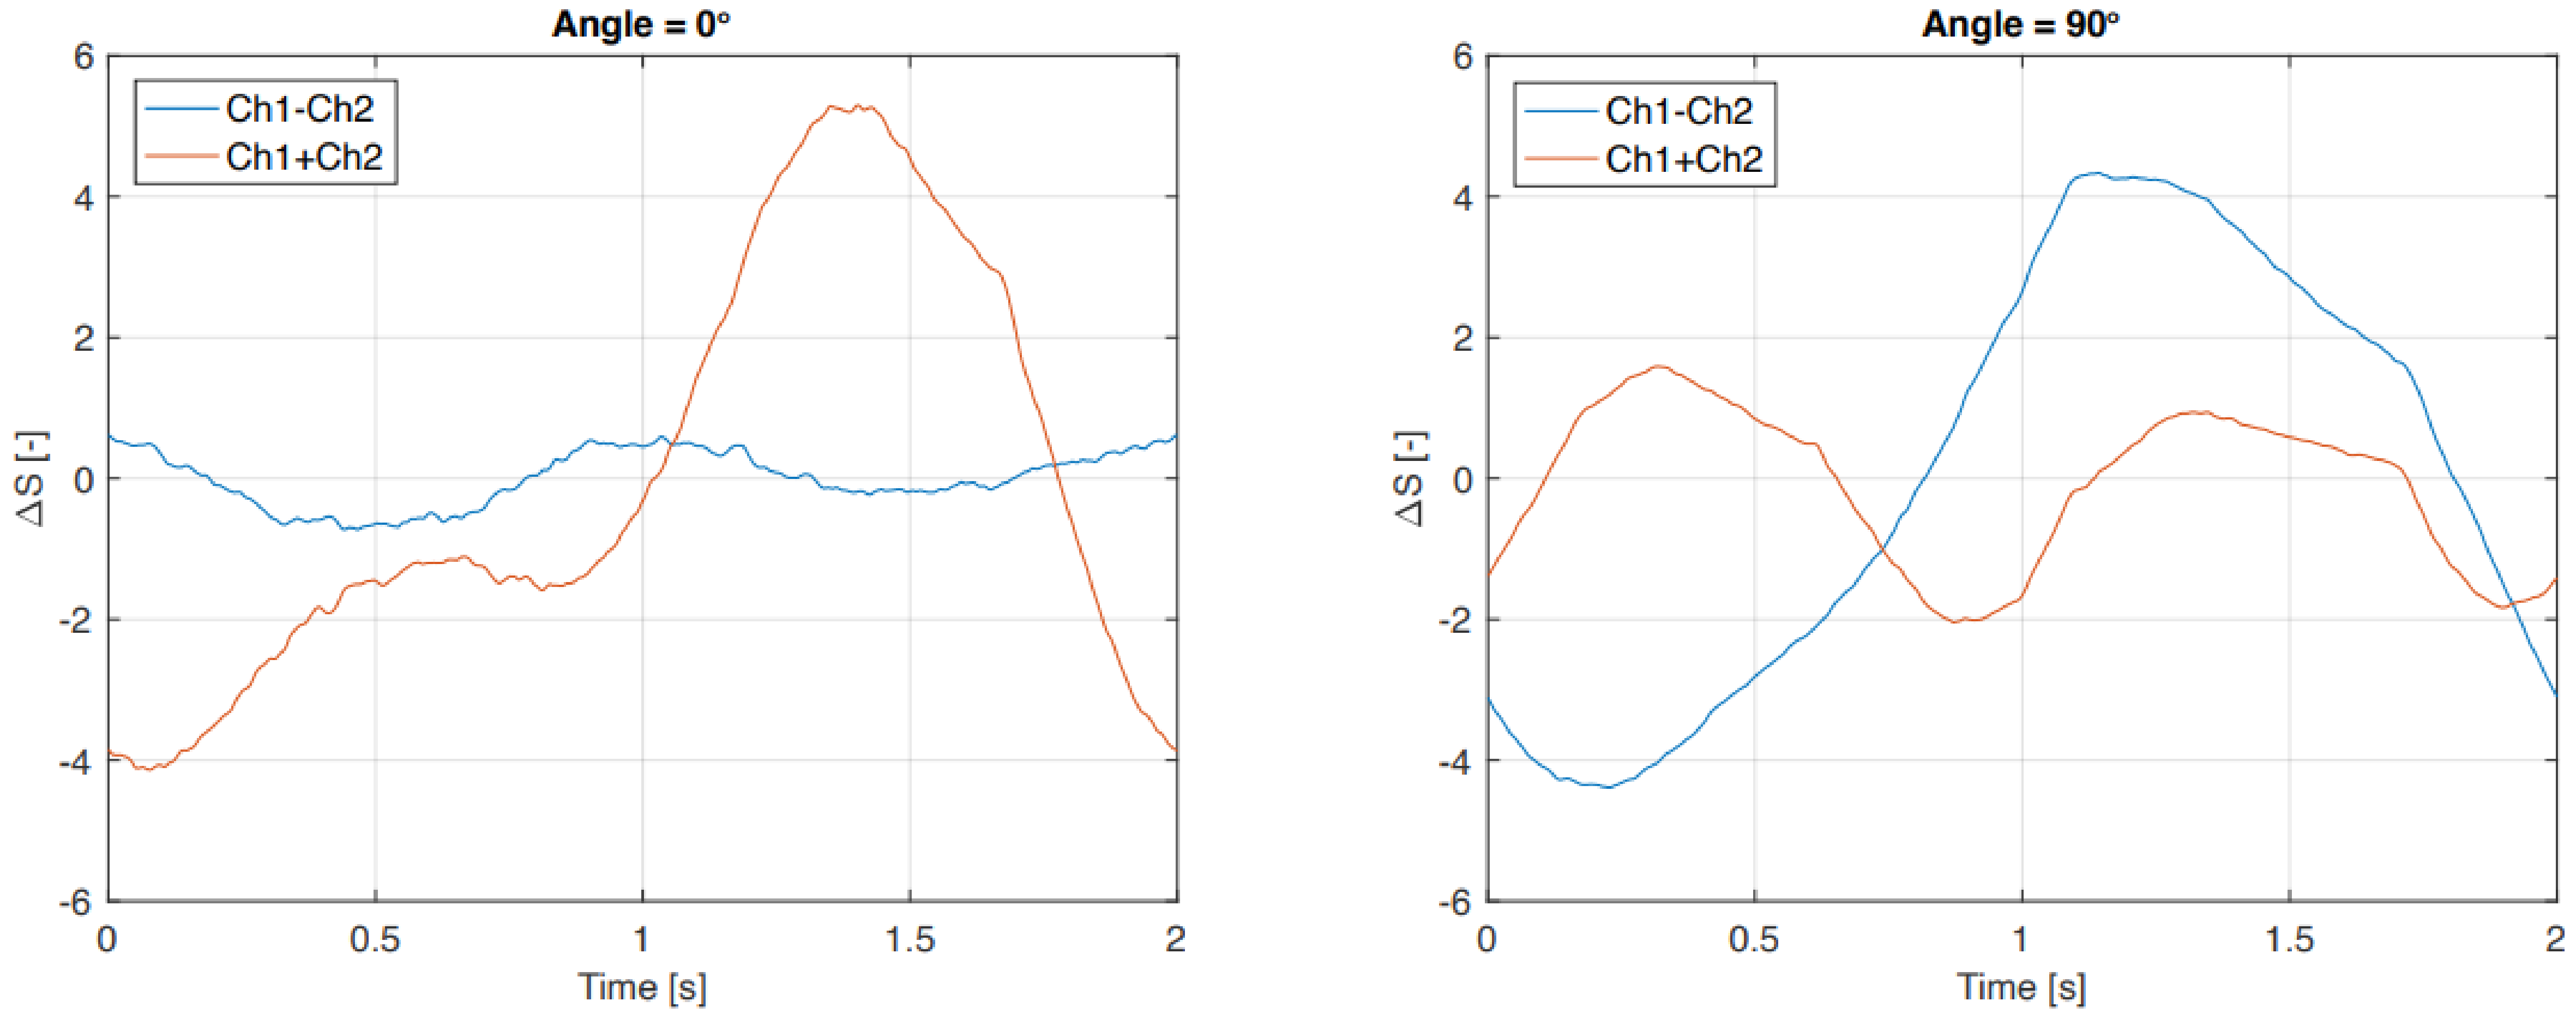
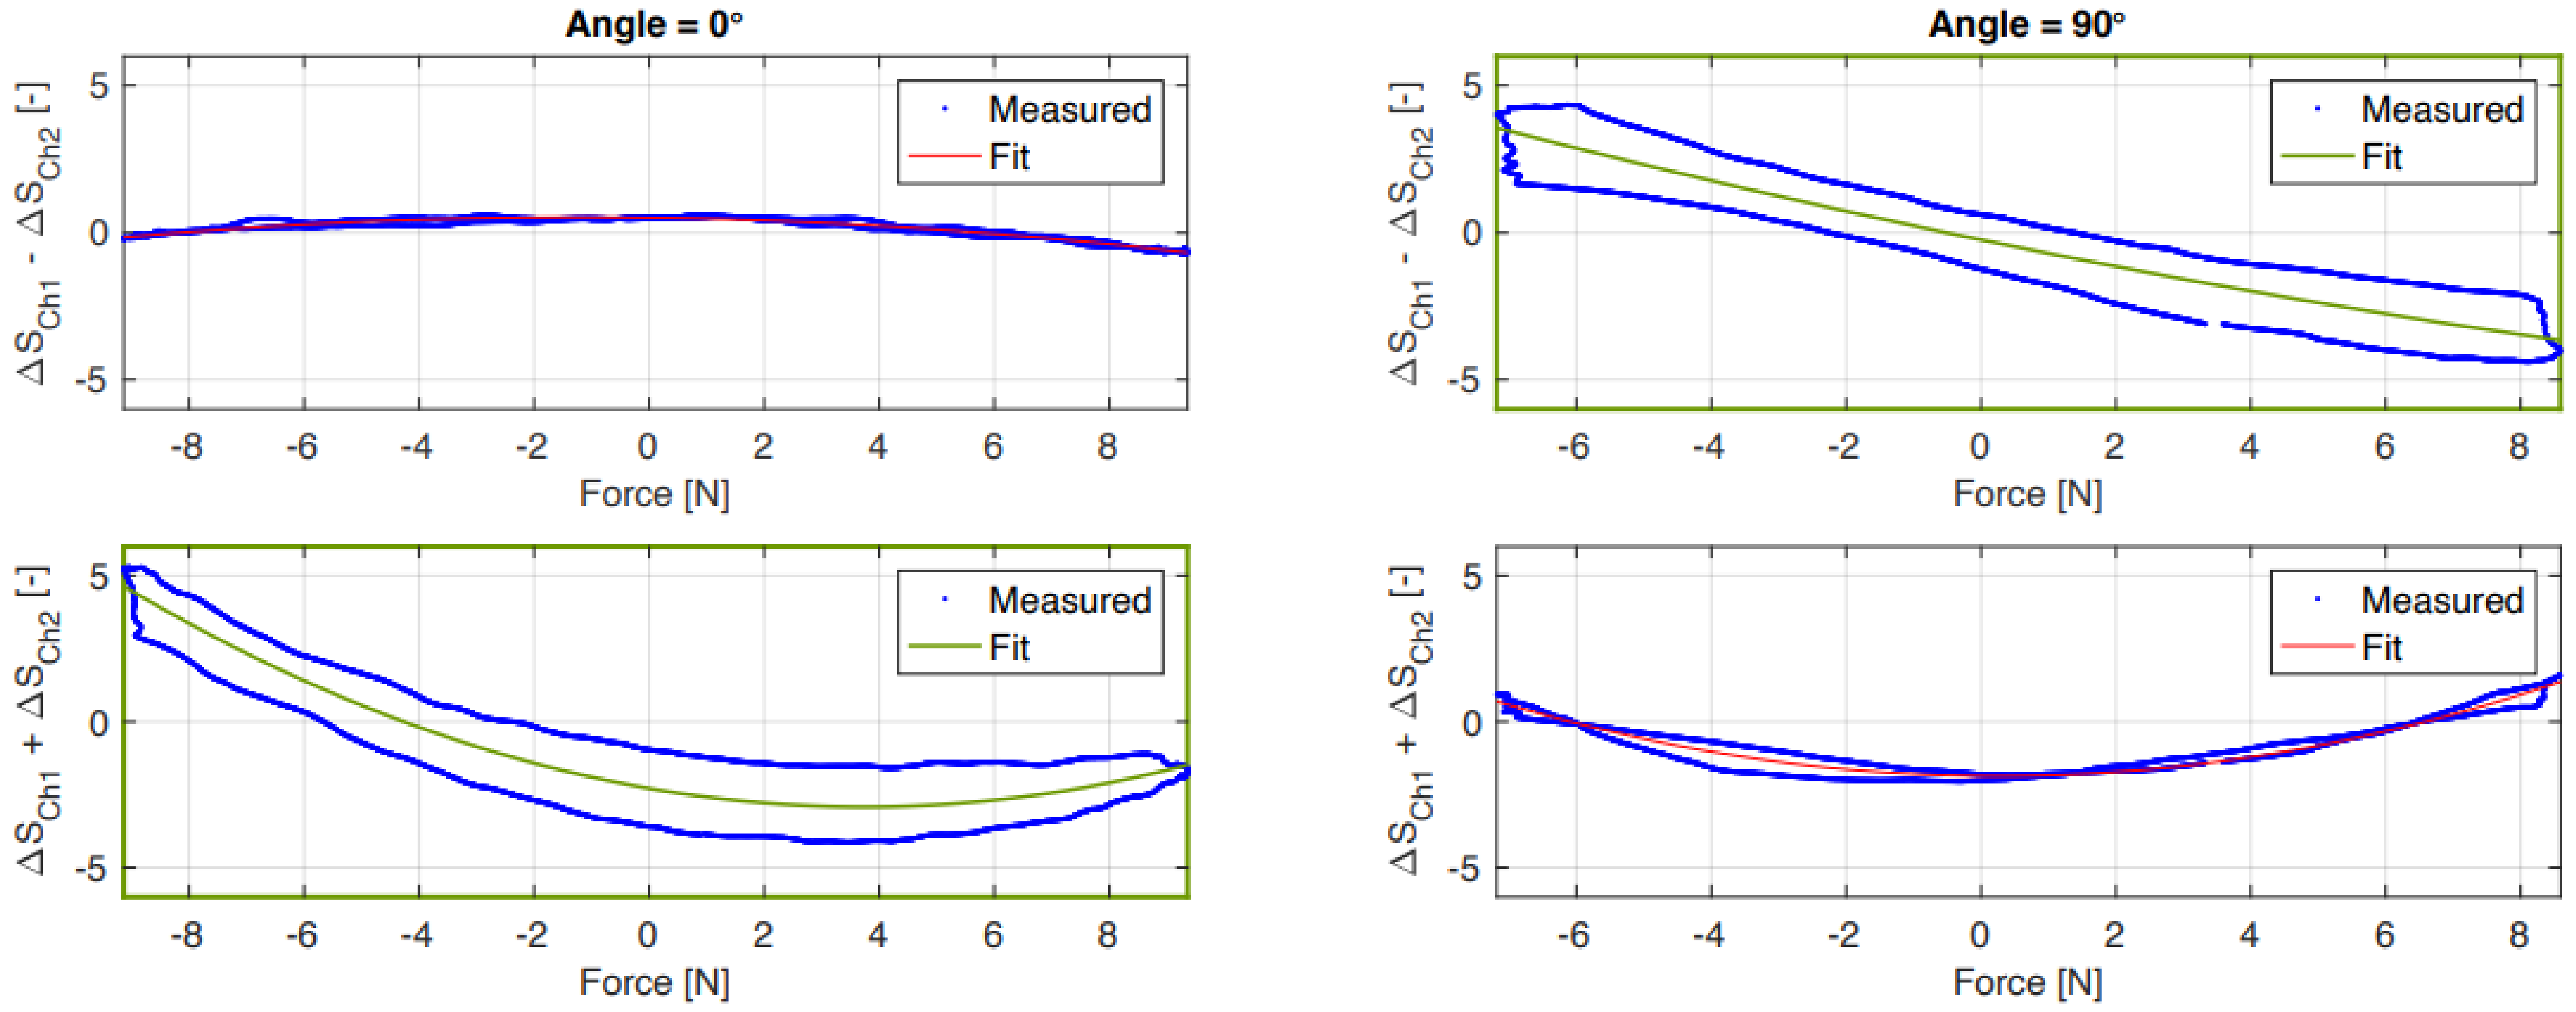
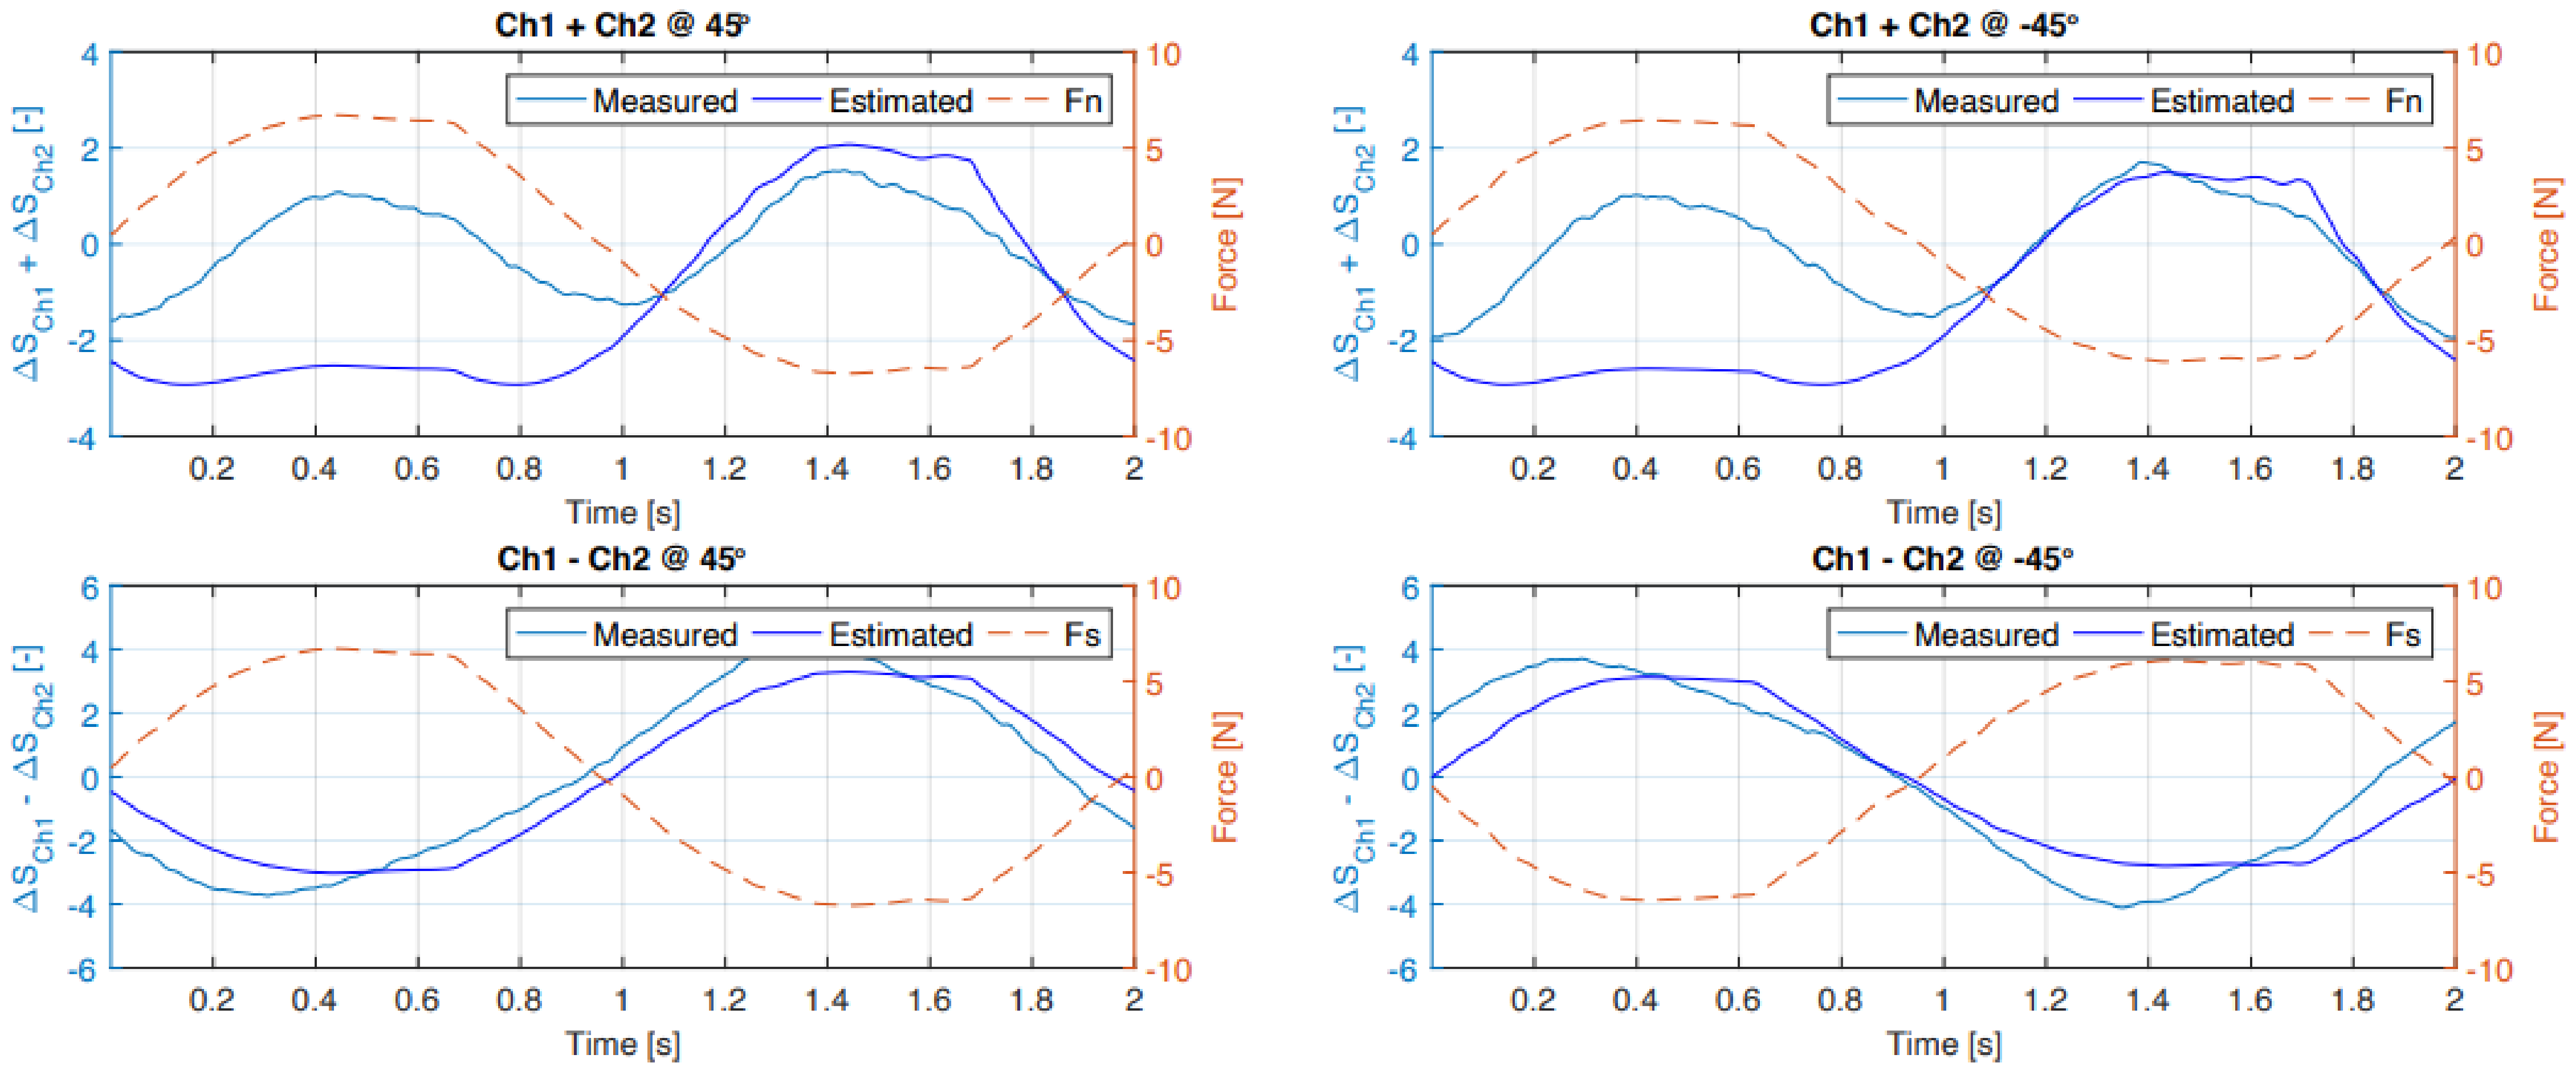
5. Results
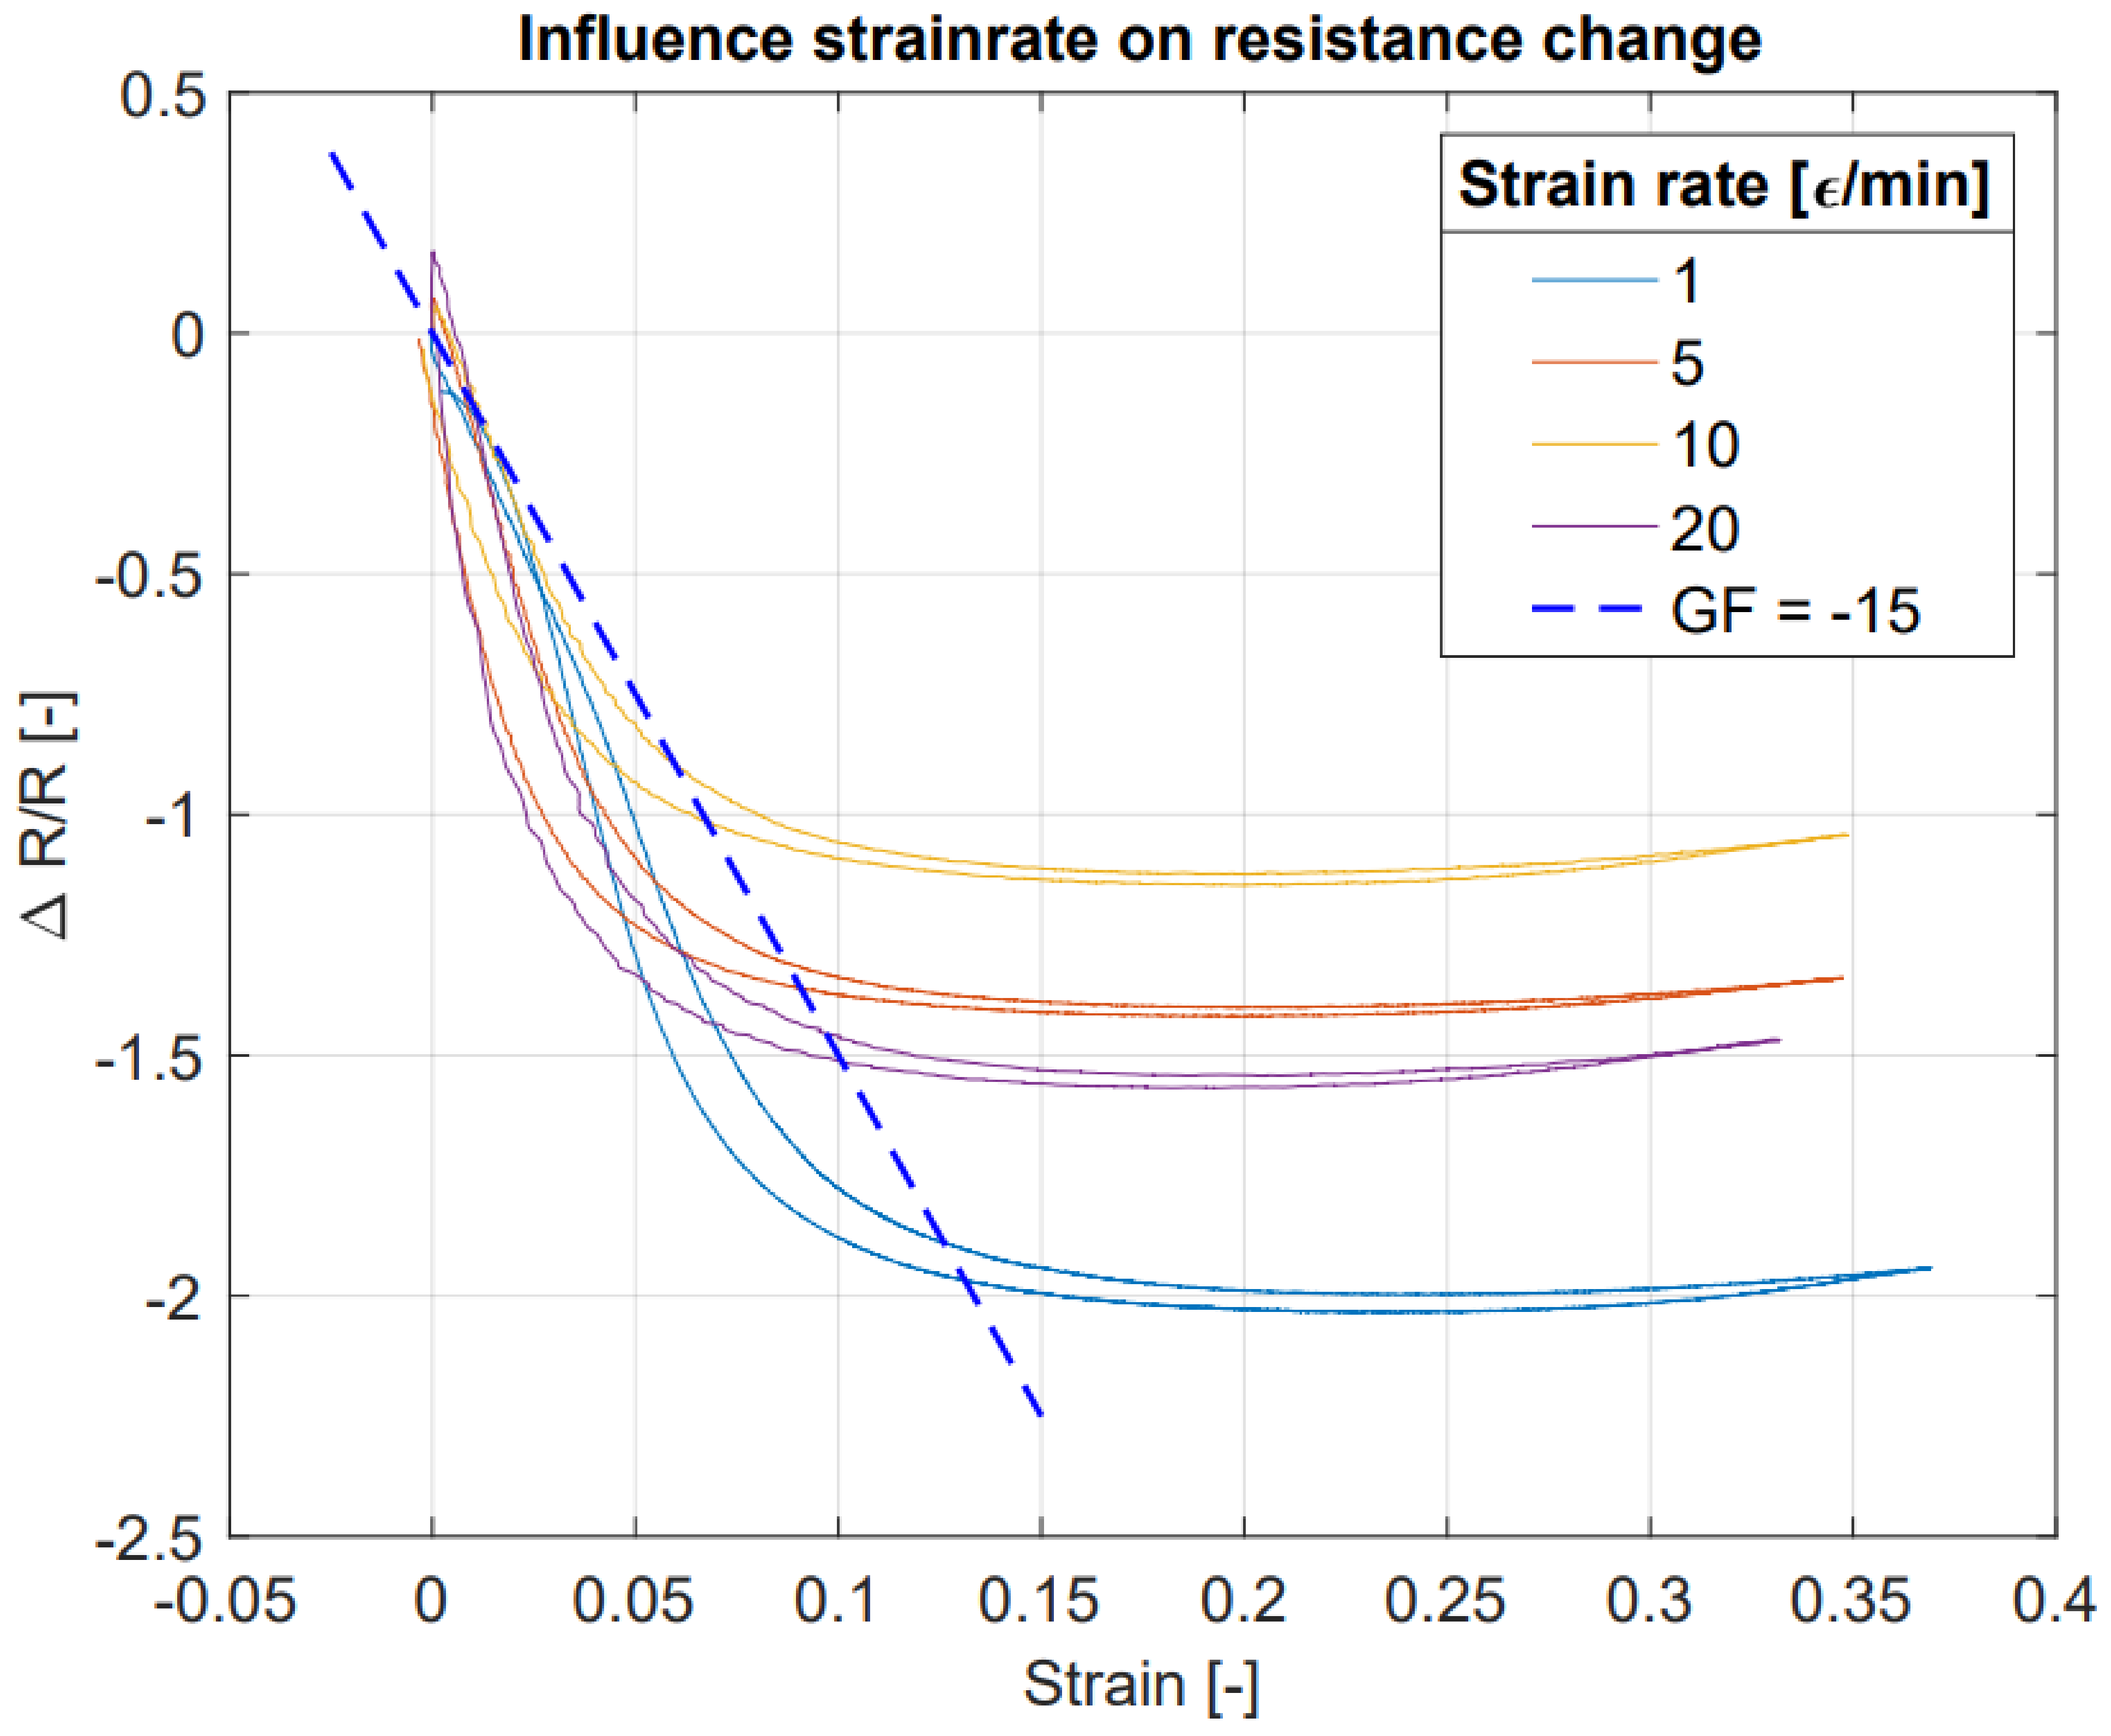
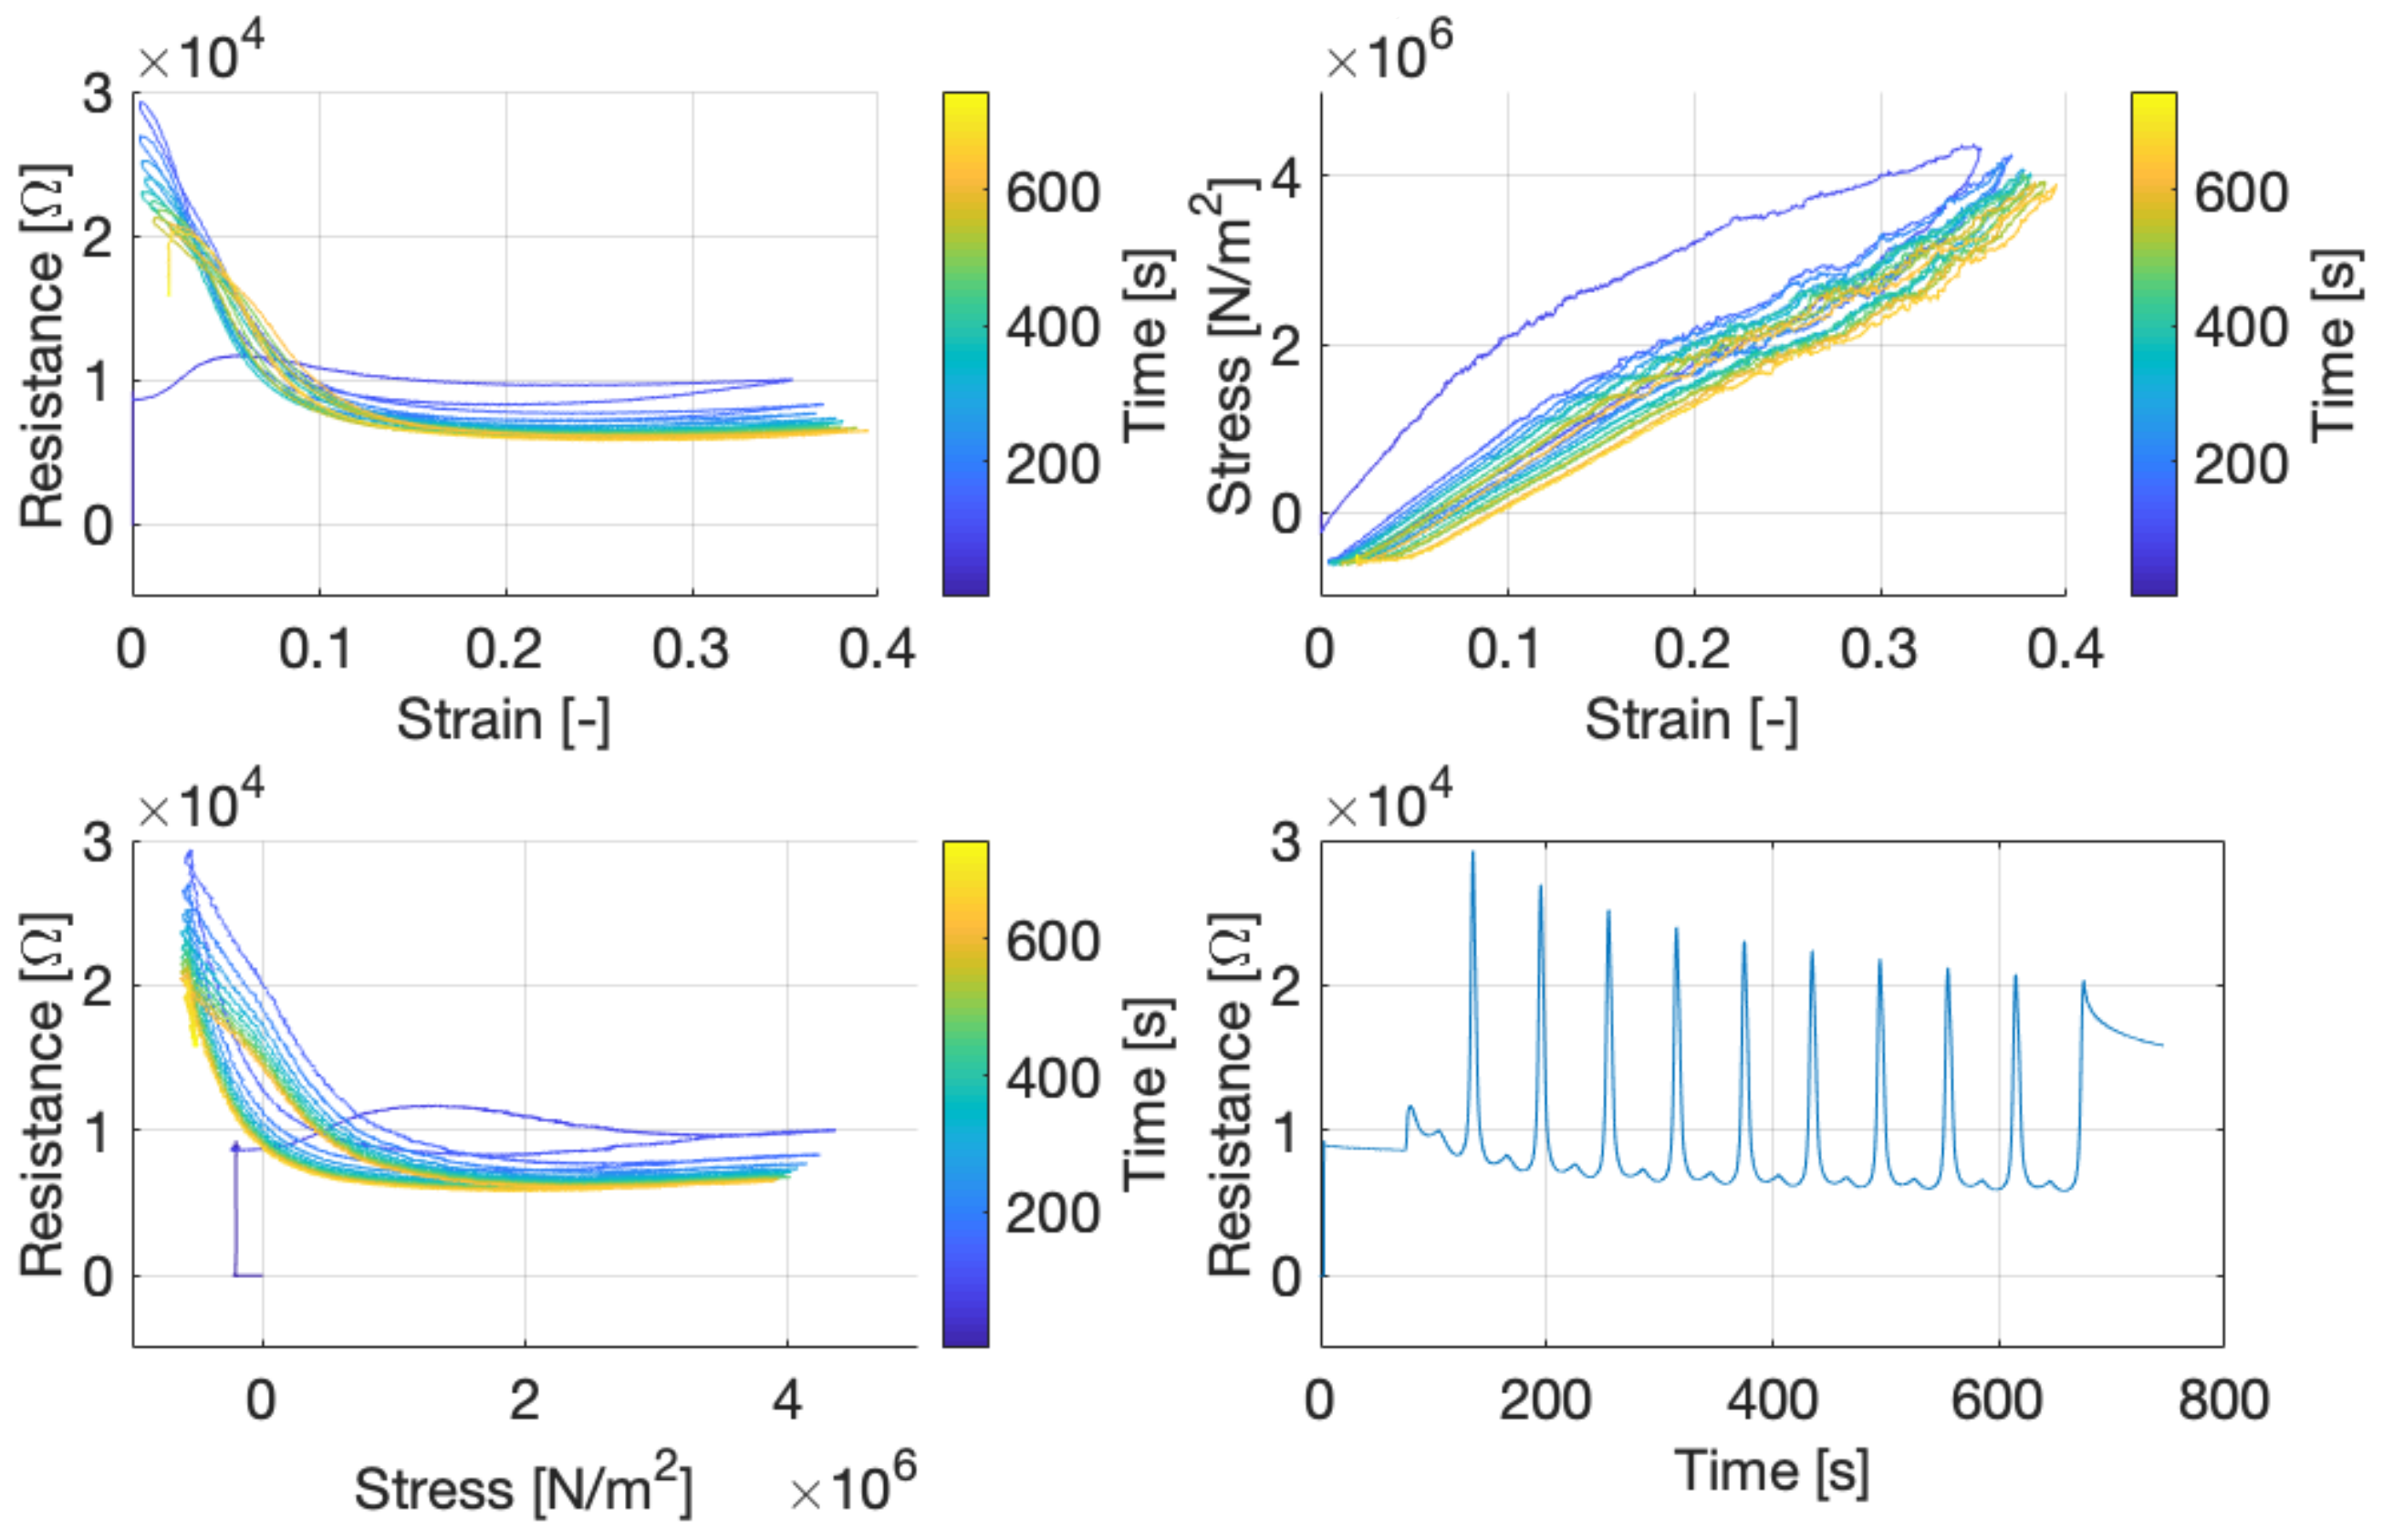
5.1. Characterization of Conductive TPU
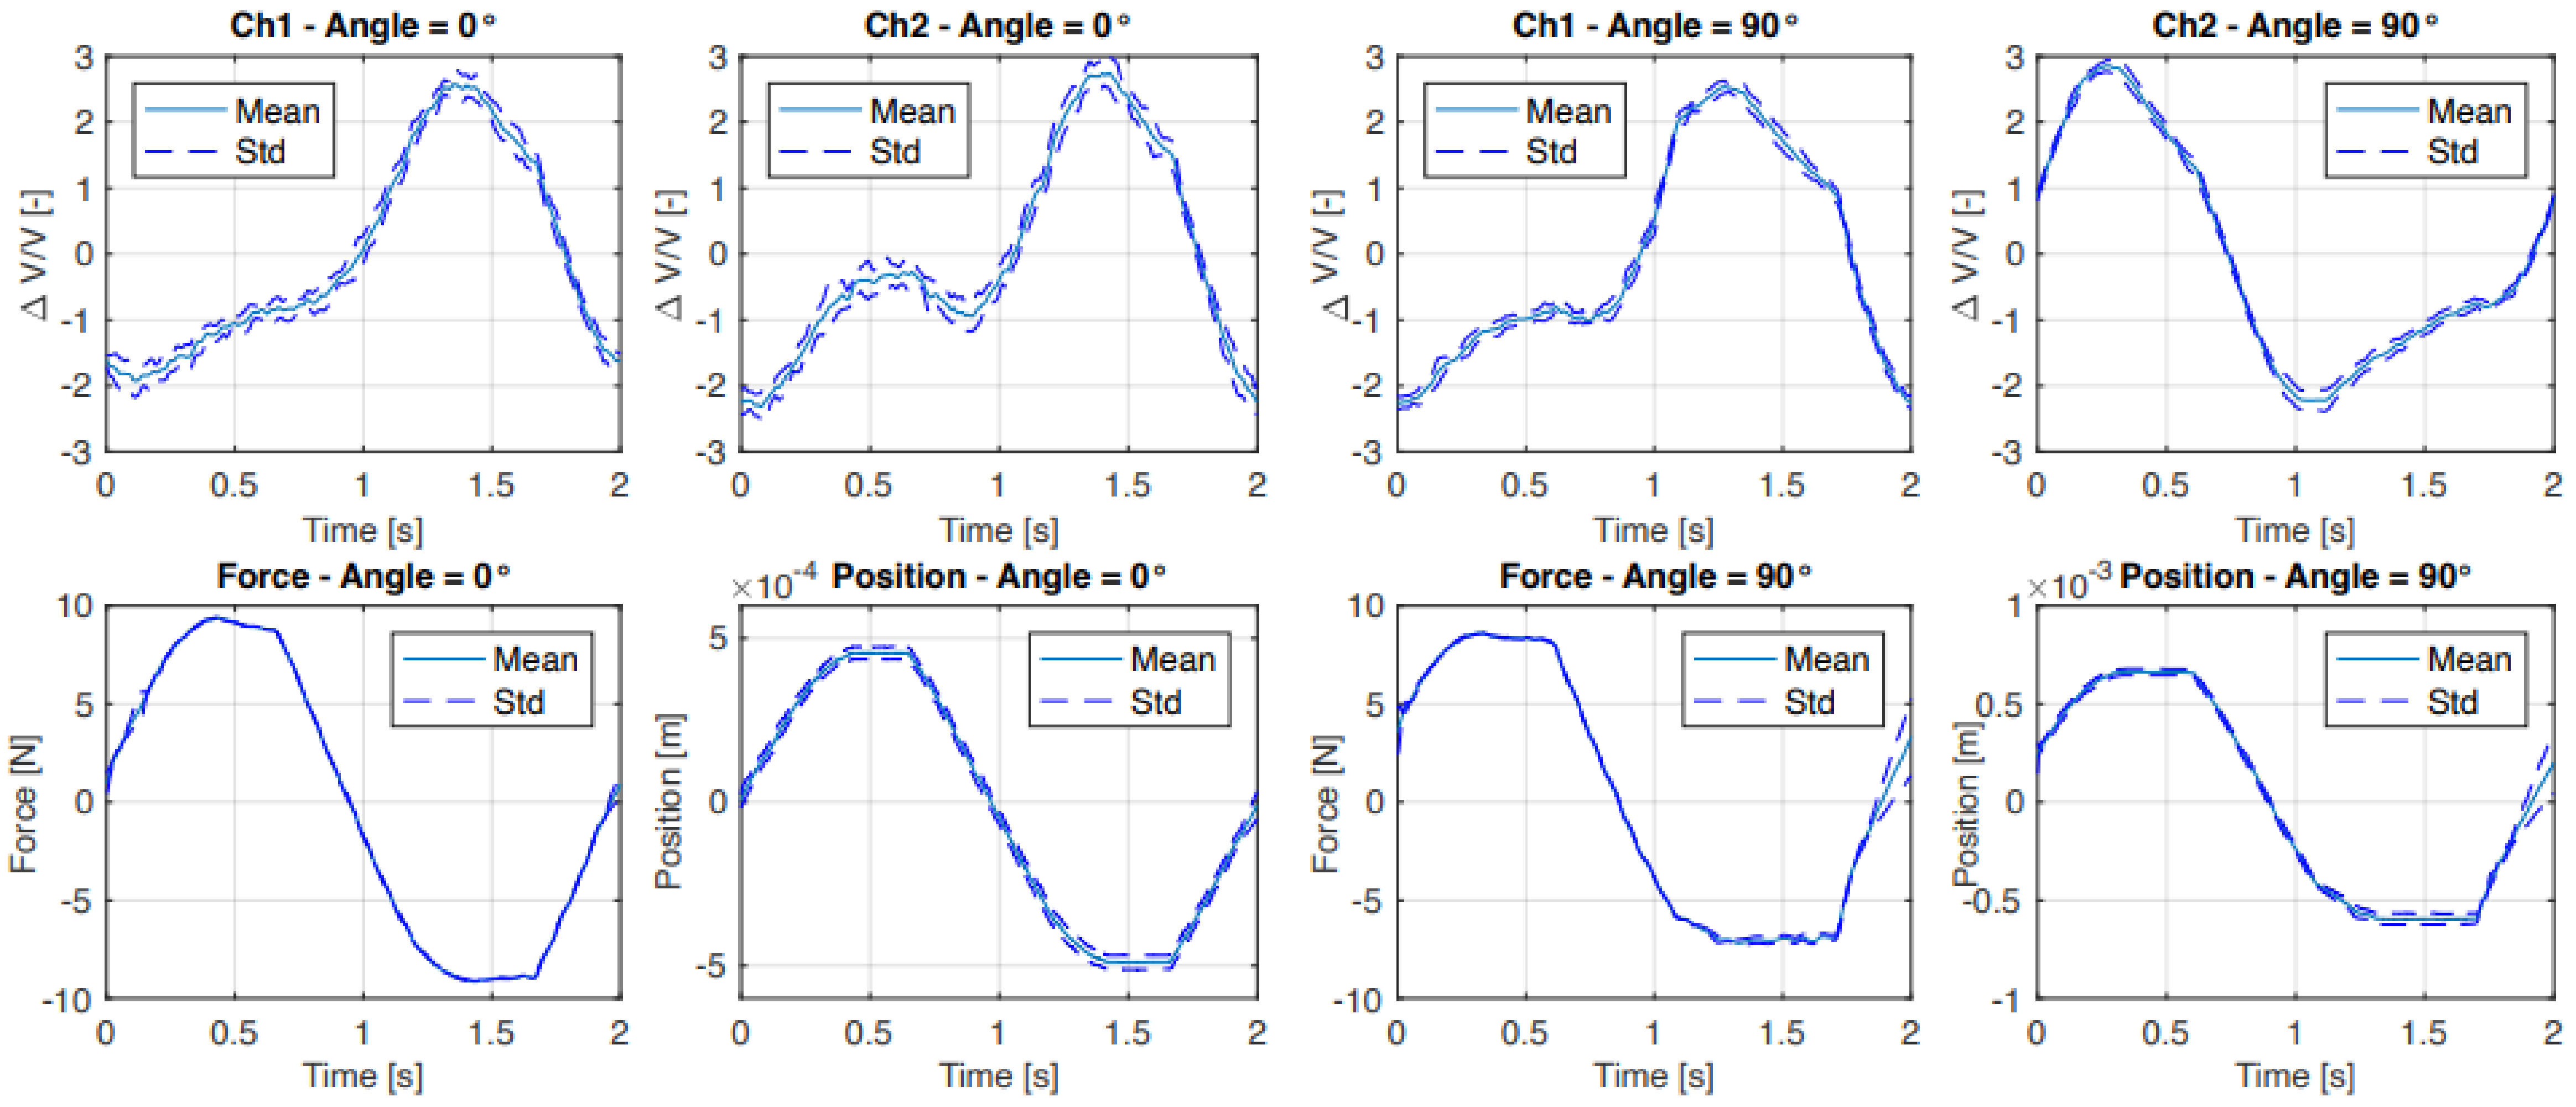
5.2. Force Sensor
6. Discussion
6.1. Characterization of Conductive TPU
6.2. Force Sensor
7. Conclusions
Author Contributions
Funding
Conflicts of Interest
References
- Veltink, P.H.; Kortier, H.; Schepers, H.M. Sensing power transfer between the human body and the environment. IEEE Trans. Biomed. Eng. 2009, 56, 1711–1718. [Google Scholar] [CrossRef] [Green Version]
- Battaglia, E.; Bianchi, M.; Altobelli, A.; Grioli, G.; Catalano, M.G.; Serio, A.; Santello, M.; Bicchi, A. ThimbleSense: A Fingertip-Wearable Tactile Sensor for Grasp Analysis. IEEE Trans. Haptics 2016, 9, 121–133. [Google Scholar] [CrossRef]
- Yin, J.; Santos, V.J.; Posner, J.D. Bioinspired flexible microfluidic shear force sensor skin. Sens. Actuators A Phys. 2017, 264, 289–297. [Google Scholar] [CrossRef]
- Kortier, H.G.; Schepers, H.M.; Veltink, P.H. Identification of Object Dynamics Using Hand Worn Motion and Force Sensors. Sensors 2016, 16, 2005. [Google Scholar] [CrossRef] [Green Version]
- Schwarz, A.; Bhagubai, M.; Wolterink, G.; Held, J.P.O.; Luft, A.R.; Veltink, P.H. Assessment of Upper Limb Movement Impairments after Stroke Using Wearable Inertial Sensing. Sensors 2020, 20, 4770. [Google Scholar] [CrossRef]
- Xu, Y.; Wu, X.; Guo, X.; Kong, B.; Zhang, M.; Qian, X.; Mi, S.; Sun, W. The Boom in 3D-Printed Sensor Technology. Sensors 2017, 17, 1166. [Google Scholar] [CrossRef]
- Schouten, M.; Wolterink, G.; Dijkshoorn, A.; Kosmas, D.; Stramigioli, S.; Krijnen, G. A Review of Extrusion-Based 3D Printing for the Fabrication of Electro-and Biomechanical Sensors. IEEE Sensors J. 2021, 21, 12900–12912. [Google Scholar] [CrossRef]
- Christ, J.F.; Aliheidari, N.; Ameli, A.; Pötschke, P. 3D printed highly elastic strain sensors of multiwalled carbon nanotube/thermoplastic polyurethane nanocomposites. Mater. Des. 2017, 131, 394–401. [Google Scholar] [CrossRef]
- Zolfagharian, A.; Kaynak, A.; Kouzani, A. Closed-loop 4D-printed soft robots. Mater. Des. 2020, 188, 108411. [Google Scholar] [CrossRef]
- Krachunov, S.; Casson, A.J. 3D Printed Dry EEG Electrodes. Sensors 2016, 16, 1635. [Google Scholar] [CrossRef]
- Wolterink, G.; Dias, P.; Sanders, R.G.; Muijzer, F.; van Beijnum, B.J.; Veltink, P.; Krijnen, G. Development of soft semg sensing structures using 3d-printing technologies. Sensors 2020, 20, 4292. [Google Scholar] [CrossRef] [PubMed]
- Guo, S.Z.; Qiu, K.; Meng, F.; Park, S.H.; McAlpine, M.C. 3D Printed Stretchable Tactile Sensors. Adv. Mater. 2017, 29, 1–8. [Google Scholar] [CrossRef]
- Christ, J.F.; Aliheidari, N.; Pötschke, P.; Ameli, A. Bidirectional and stretchable piezoresistive sensors enabled by multimaterial 3D printing of carbon nanotube/thermoplastic polyurethane nanocomposites. Polymers 2018, 11, 11. [Google Scholar] [CrossRef] [Green Version]
- Wolterink, G.; Sanders, R.; Krijnen, G. A flexible, three material, 3D-printed, shear force sensor for use on finger tips. Proc. IEEE Sens. 2019, 2019, 8956757. [Google Scholar] [CrossRef] [Green Version]
- Shimawaki, S.; Sakai, N. Quasi-static Deformation Analysis of a Human Finger using a Three-dimensional Finite Element Model Constructed from CT Images. J. Environ. Eng. 2007, 2, 56–63. [Google Scholar] [CrossRef] [Green Version]
- Tawk, C.; Alici, G. Finite element modeling in the design process of 3D printed pneumatic soft actuators and sensors. Robotics 2020, 9, 52. [Google Scholar] [CrossRef]
- Qi, H.J.; Boyce, M.C. Stress–strain behavior of thermoplastic polyurethanes. Mech. Mater. 2005, 37, 817–839. [Google Scholar] [CrossRef]
- Al-Rubaiai, M.; Tsuruta, R.; Gandhi, U.; Wang, C.; Tan, X. A 3D-printed stretchable strain sensor for wind sensing. Smart Mater. Struct. 2019, 28, 084001. [Google Scholar] [CrossRef]
- Rusinek, A.; Robles, G.; Arias, A. Conductive 3D Printed PLA Composites: On the interplay of mechanical, electrical and thermal behaviours. Compos. Struct. 2021, 265, 113744. [Google Scholar] [CrossRef]
- Das, N.C.; Chaki, T.K.; Khastgir, D. Effect of axial stretching on electrical resistivity of short carbon fibre and carbon black filled conductive rubber composites. Polym. Int. 2002, 51, 156–163. [Google Scholar] [CrossRef]
- Sau, K.P.; Chaki, T.K.; Khastgir, D. The effect of compressive strain and stress on electrical conductivity of conductive rubber composites. Rubber Chem. Technol. 2000, 73, 310–324. [Google Scholar] [CrossRef]
- Dijkshoorn, A.; Schouten, M.; Wolterink, G.; Sanders, R.; Stramigioli, S.; Krijnen, G. Characterizing the Electrical Properties of Anisotropic, 3D-Printed Conductive Sheets for Sensor Applications. IEEE Sens. J. 2020, 20, 14218–14227. [Google Scholar] [CrossRef]
- Wolterink, G.; Sanders, R.; Krijnen, G. Thin, flexible, capacitive force sensors based on anisotropy in 3D-printed structures. In Proceedings of the 2018 IEEE Sensors, New Delhi, India, 28–31 October 2018; IEEE: Piscataway, NJ, USA, 2018; pp. 1–4. [Google Scholar]
- Tognetti, A.; Lorussi, F.; Mura, G.D.; Carbonaro, N.; Pacelli, M.; Paradiso, R.; Rossi, D.D. New generation of wearable goniometers for motion capture systems. J. Neuroeng. Rehabil. 2014, 11, 1–17. [Google Scholar] [CrossRef] [PubMed]
- Schouten, M.; Prakken, B.; Sanders, R.; Krijnen, G. Linearisation of a 3D printed flexible tactile sensor based on piezoresistive sensing. Proc. IEEE Sens. 2019, 2019, 2019–2022. [Google Scholar] [CrossRef] [Green Version]
- Brookhuis, R.A.; Droogendijk, H.; De Boer, M.J.; Sanders, R.G.; Lammerink, T.S.; Wiegerink, R.J.; Krijnen, G.J. Six-axis force-torque sensor with a large range for biomechanical applications. J. Micromech. Microeng. 2014, 24, 035015. [Google Scholar] [CrossRef]
- Xie, R.; Xie, Y.; López-Barrón, C.R.; Gao, K.Z.; Wagner, N.J. Ultra-Stretchable Conductive Iono-Elastomer And Motion Strain Sensor System Developed Therefrom. Technol. Innov. 2018, 19, 613–626. [Google Scholar] [CrossRef]


Publisher’s Note: MDPI stays neutral with regard to jurisdictional claims in published maps and institutional affiliations. |
© 2021 by the authors. Licensee MDPI, Basel, Switzerland. This article is an open access article distributed under the terms and conditions of the Creative Commons Attribution (CC BY) license (https://creativecommons.org/licenses/by/4.0/).
Share and Cite
Wolterink, G.; Sanders, R.; van Beijnum, B.-J.; Veltink, P.; Krijnen, G. A 3D-Printed Soft Fingertip Sensor for Providing Information about Normal and Shear Components of Interaction Forces. Sensors 2021, 21, 4271. https://doi.org/10.3390/s21134271
Wolterink G, Sanders R, van Beijnum B-J, Veltink P, Krijnen G. A 3D-Printed Soft Fingertip Sensor for Providing Information about Normal and Shear Components of Interaction Forces. Sensors. 2021; 21(13):4271. https://doi.org/10.3390/s21134271
Chicago/Turabian StyleWolterink, Gerjan, Remco Sanders, Bert-Jan van Beijnum, Peter Veltink, and Gijs Krijnen. 2021. "A 3D-Printed Soft Fingertip Sensor for Providing Information about Normal and Shear Components of Interaction Forces" Sensors 21, no. 13: 4271. https://doi.org/10.3390/s21134271
APA StyleWolterink, G., Sanders, R., van Beijnum, B.-J., Veltink, P., & Krijnen, G. (2021). A 3D-Printed Soft Fingertip Sensor for Providing Information about Normal and Shear Components of Interaction Forces. Sensors, 21(13), 4271. https://doi.org/10.3390/s21134271