
Near-Infrared Reflectance Spectroscopy for Predicting the Phospholipid Fraction and the Total Fatty Acid Composition of Freeze-Dried Beef

 ,
,  ,
,  ,
, 

 , ,
, , 
Abstract
1. Introduction
2. Materials and Methods
2.1. Animal and Rearing Conditions
2.2. Sampling and Measurements
2.3. Collection of NIR Reflectance Spectra
2.4. Fatty Acid Composition Analysis
2.5. Chemometrics
3. Results and Discussion
3.1. Sample Composition
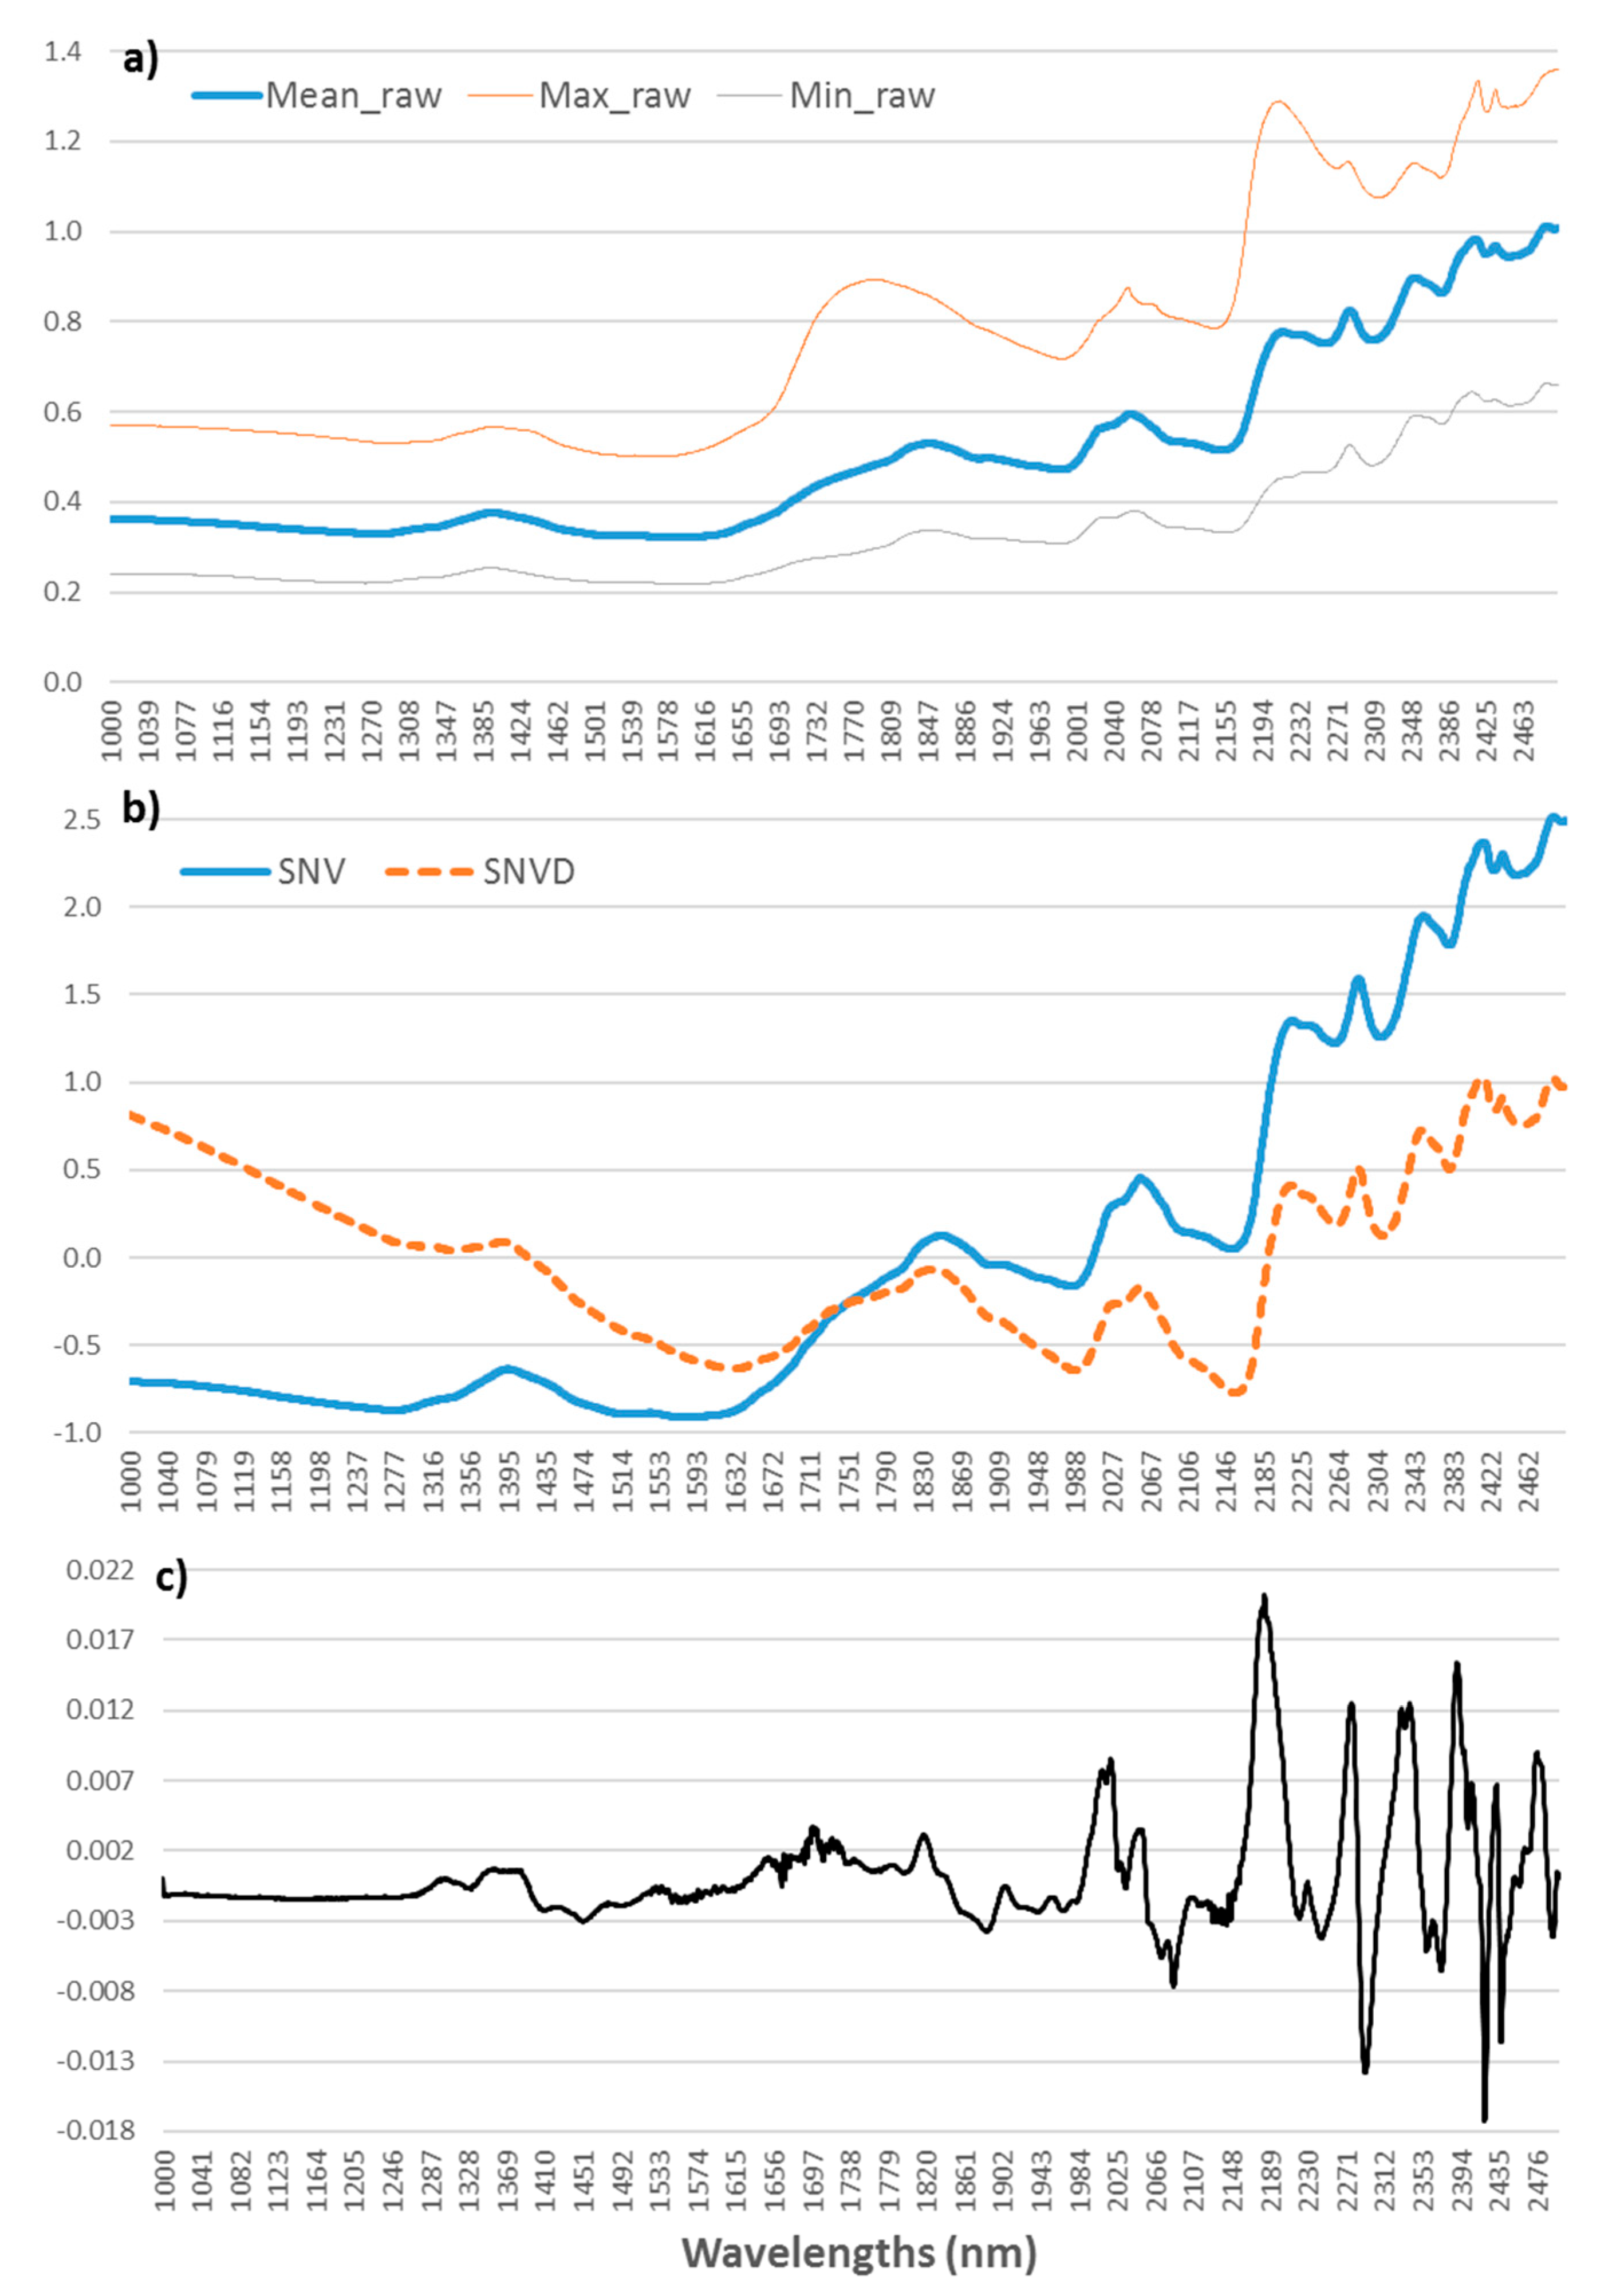
3.2. Spectral Characteristics
3.3. Prediction Models
4. Conclusions
Author Contributions
Funding
Institutional Review Board Statement
Informed Consent Statement
Data Availability Statement
Acknowledgments
Conflicts of Interest
References
- Denoyelle, C.; Cartier, P. Measurement of ground beef composition by near infrared spectrophotometry. Viandes Prod. Carnes 1996, 17, 191–196. [Google Scholar]
- Prieto, N.; Andres, S.; Giraldez, F.J.; Mantecon, A.R.; Lavin, P. Potential use of near infrared reflectance spectroscopy (NIRS) for the estimation of chemical composition of oxen meat samples. Meat Sci. 2006, 74, 487–496. [Google Scholar] [CrossRef]
- Olivan, M.; de la Roza, B.; Mocha, M.; Martinez, M.J. Prediction of physico-chemical and texture characteristics of beef by near infrared transmittance spectroscopy. In Proceedings of the 10th International Conference on Near Infrared Spectroscopy, Kyongju, Korea, 10–15 June 2002; pp. 197–202. [Google Scholar]
- Ripoll, G.; Lobon, S.; Joy, M. Use of visible and near infrared reflectance spectra to predict lipid peroxidation of light lamb meat and discriminate dam’s feeding systems. Meat Sci. 2018, 143, 24–29. [Google Scholar] [CrossRef]
- Ripoll, G.; Albertí, P.; Panea, B.; Olleta, J.L.; Sañudo, C. Near-infrared reflectance spectroscopy for predicting chemical, instrumental and sensory quality of beef. Meat Sci. 2008, 80, 697–702. [Google Scholar] [CrossRef]
- Aït-Kaddour, A.; Andueza, D.; Dubost, A.; Roger, J.-M.; Hocquette, J.-F.; Listrat, A. Visible and Near-Infrared Multispectral Features in Conjunction with Artificial Neural Network and Partial Least Squares for Predicting Biochemical and Micro-Structural Features of Beef Muscles. Foods 2020, 9, 1254. [Google Scholar] [CrossRef] [PubMed]
- Williams, C.M. Dietary fatty acids and human health. Ann. Zootech. 2000, 49, 165–180. [Google Scholar] [CrossRef]
- Galli, C.; Calder, P.C. Effects of fat and fatty acid intake on inflammatory and immune responses: A critical review. Ann. Nutr. Metab. 2009, 55, 123–139. [Google Scholar] [CrossRef] [PubMed]
- Enser, M.; Richardson, R.; Wood, J.; Gill, B.; Sheard, P. Feeding linseed to increase the n-3 PUFA of pork: Fatty acid composition of muscle, adipose tissue, liver and sausages. Meat Sci. 2000, 55, 201–212. [Google Scholar] [CrossRef]
- De Souza, R.J.; Mente, A.; Maroleanu, A.; Cozma, A.I.; Ha, V.; Kishibe, T.; Uleryk, E.; Budylowski, P.; Schünemann, H.; Beyene, J. Intake of saturated and trans unsaturated fatty acids and risk of all cause mortality, cardiovascular disease, and type 2 diabetes: Systematic review and meta-analysis of observational studies. Bmj 2015, 351, h3978. [Google Scholar] [CrossRef]
- Elmore, J.S.; Cooper, S.L.; Enser, M.; Mottram, D.S.; Sinclair, L.A.; Wilkinson, R.G.; Wood, J.D. Dietary manipulation of fatty acid composition in lamb meat and its effect on the volatile aroma compounds of grilled lamb. Meat Sci. 2005, 69, 233–242. [Google Scholar] [CrossRef]
- Mottram, D.S. Flavour formation in meat and meat products: A review. Food Chem. 1998, 62, 415–424. [Google Scholar] [CrossRef]
- Warren, H.E.; Scollan, N.D.; Nute, G.R.; Hughes, S.I.; Wood, J.D.; Richardson, R.I. Effects of breed and a concentrate or grass silage diet on beef quality in cattle of 3 ages. II: Meat stability and flavour. Meat Sci. 2008, 78, 270–278. [Google Scholar] [CrossRef] [PubMed]
- Mourot, B.P.; Gruffat, D.; Durand, D.; Chesneau, G.; Prache, S.; Mairesse, G.; Andueza, D. New approach to improve the calibration of main fatty acids by near-infrared reflectance spectroscopy in ruminant meat. Anim. Prod. Sci. 2014, 54, 1848. [Google Scholar] [CrossRef]
- Prieto, N.; Dugan, M.E.; Lopez-Campos, O.; Aalhus, J.L.; Uttaro, B. At line prediction of PUFA and biohydrogenation intermediates in perirenal and subcutaneous fat from cattle fed sunflower or flaxseed by near infrared spectroscopy. Meat Sci. 2013, 94, 27–33. [Google Scholar] [CrossRef] [PubMed]
- Pullanagari, R.R.; Yule, I.J.; Agnew, M. On-line prediction of lamb fatty acid composition by visible near infrared spectroscopy. Meat Sci. 2015, 100, 156–163. [Google Scholar] [CrossRef] [PubMed]
- Andueza, D.; Listrat, A.; Durand, D.; Normand, J.; Mourot, B.P.; Gruffat, D. Prediction of beef meat fatty acid composition by visible-near-infrared spectroscopy was improved by preliminary freeze-drying. Meat Sci. 2019, 158, 107910. [Google Scholar] [CrossRef] [PubMed]
- Blanco, M.; Peguero, A. Determination of organic additives in mortars by near-IR spectroscopy. A novel approach to designing a sample set with high-variability components. Anal. Bioanal. Chem. 2007, 387, 1525–1532. [Google Scholar] [CrossRef] [PubMed]
- Núñez-Sánchez, N.; Serradilla, J.; Ares, J.; Garrido-Varo, A. Effect of moisture uptake on the repeatability of near infrared spectroscopy analyses of ewe milk using the dry extract system for infrared (DESIR) method. J. Near Infrared Spectrosc. 2008, 16, 381. [Google Scholar] [CrossRef]
- Maeda, H.; Ozaki, Y.; Tanaka, M.; Hayashi, N.; Kojima, T. Near Infrared Spectroscopy and Chemometrics Studies of Temperature-Dependent Spectral Variations of Water: Relationship between Spectral Changes and Hydrogen Bonds. J. Near Infrared Spectrosc. 1995, 3, 191–201. [Google Scholar] [CrossRef]
- Coppa, M.; Ferlay, A.; Leroux, C.; Jestin, M.; Chilliard, Y.; Martin, B.; Andueza, D. Prediction of milk fatty acid composition by near infrared reflectance spectroscopy. Int. Dairy J. 2010, 20, 182–189. [Google Scholar] [CrossRef]
- Meurens, M.; Eydne, O.; Vanbelle, M. Fine Analysis of Liquids by NIR Reflectance Spectroscopy of Dry Extract on Solid Support (DESIR); Hollow, J., Kaffka, K.J., Gonczy, J.L., Eds.; Akademiai Kiado: Budapest, Hungary, 1987; pp. 297–302. [Google Scholar]
- Ripoll, G.; Casasús, I.; Joy, M.; Molino, F.; Blanco, M. Fat color and reflectance spectra to evaluate the β-carotene, lutein and α-tocopherol in the plasma of bovines finished on meadows or on a dry total mixed ration. Anim. Feed Sci. Technol. 2015, 207, 20–30. [Google Scholar] [CrossRef]
- Giaretta, E.; Mordenti, A.; Palmonari, A.; Brogna, N.; Canestrari, G.; Belloni, P.; Cavallini, D.; Mammi, L.; Cabbri, R.; Formigoni, A. NIRs calibration models for chemical composition and fatty acid families of raw and freeze-dried beef: A comparison. J. Food Compos. Anal. 2019, 83, 103257. [Google Scholar] [CrossRef]
- Beak, S.H.; Lee, Y.; Lee, E.B.; Kim, K.H.; Kim, J.G.; Bok, J.D.; Kang, S.K. Study on the fatty acid profile of phospholipid and neutral lipid in Hanwoo beef and their relationship to genetic variation. J. Anim. Sci. Technol. 2019, 61, 69–76. [Google Scholar] [CrossRef] [PubMed]
- Bourre, J. Where to find omega-3 fatty acids and how feeding animals with diet enriched in omega-3 fatty acids to increase nutritional value of derived products for human: What is actually useful. J. Nutr. Health Aging 2005, 9, 232–242. [Google Scholar] [PubMed]
- Scollan, N.D.; Dannenberger, D.; Nuernberg, K.; Richardson, I.; MacKintosh, S.; Hocquette, J.F.; Moloney, A.P. Enhancing the nutritional and health value of beef lipids and their relationship with meat quality. Meat Sci. 2014, 97, 384–394. [Google Scholar] [CrossRef]
- Blesso, C.N. Egg phospholipids and cardiovascular health. Nutrients 2015, 7, 2731–2747. [Google Scholar] [CrossRef] [PubMed]
- Gandemer, G. Lipides du muscle et qualité de la viande. Phospholipides et flaveur. OCL. OléagineuxCorps GrasLipides 1997, 4, 19–25. [Google Scholar]
- European Union. Directive 2010/63/EU of the European Parliament and of the Council of 22 September 2010 on the protection of animals used for scientific purposes. Off. J. Eur. Union 2010, L276/233-L276/279. Available online: https://eur-lex.europa.eu/LexUriServ/LexUriServ.do?uri=OJ:L:2010:276:0033:0079:en:PDF (accessed on 19 June 2021).
- Albertí, P.; Panea, B.; Sañudo, C.; Olleta, J.L.; Ripoll, G.; Ertbjerg, P.; Christensen, M.; Gigli, S.; Failla, S.; Concetti, S.; et al. Live weight, body size and carcass characteristics of young bulls of fifteen European breeds. Livest. Sci. 2008, 114, 19–30. [Google Scholar] [CrossRef]
- Folch, J.; Lees, M.; Stanley, G. A simple method for the isolation and purification of lipids from animal tissues. J. Biol. Chem. 1957, 226, 497–509. [Google Scholar] [CrossRef]
- Scollan, N.D.; Choi, N.-J.; Kurt, E.; Fisher, A.V.; Enser, M.; Wood, J.D. Manipulating the fatty acid composition of muscle and adipose tissue in beef cattle. Br. J. Nutr. 2001, 85, 115–124. [Google Scholar] [CrossRef]
- Geesink, G.H.; Schreutelkamp, F.H.; Frankhuizen, R.; Vedder, H.W.; Faber, N.M.; Kranen, R.W.; Gerritzen, M.A. Prediction of pork quality attributes from near infrared reflectance spectra. Meat Sci. 2003, 65, 661–668. [Google Scholar] [CrossRef]
- Barlocco, N.; Vadell, A.; Ballesteros, F.; Galietta, G.; Cozzolino, D. Predicting intramuscular fat, moisture and Warner-Bratzler shear force in pork muscle using near infrared reflectance spectroscopy. Anim. Sci. 2006, 82, 111–116. [Google Scholar] [CrossRef]
- Williams, P.; Norris, K. Near-Infrared Technology in the Agricultural and Food Industries; American Association of Cereal Chemists, Inc.: St. Paul, Minnesota, 1987; p. 330. [Google Scholar]
- MacKintosh, S.B.; Richardson, I.; Kim, E.J.; Dannenberger, D.; Coulmier, D.; Scollan, N.D. Addition of an extract of lucerne (Medicago sativa L.) to cattle diets–Effects on fatty acid profile, meat quality and eating quality of the M. longissimus muscle. Meat Sci. 2017, 130, 69–80. [Google Scholar] [CrossRef]
- Wood, J.D.; Enser, M.; Fisher, A.V.; Nute, G.R.; Sheard, P.R.; Richardson, R.I.; Hughes, S.I.; Whittington, F.M. Fat deposition, fatty acid composition and meat quality: A review. Meat Sci. 2008, 78, 343–358. [Google Scholar] [CrossRef] [PubMed]
- Sevane, N.; Nute, G.; Sañudo, C.; Cortes, O.; Cañon, J.; Williams, J.L.; Dunner, S. Muscle lipid composition in bulls from 15 european breeds. Livest. Sci. 2014, 160, 1–11. [Google Scholar] [CrossRef]
- Sevane, N.; Levéziel, H.; Nute, G.R.; Sañudo, C.; Valentini, A.; Williams, J.; Dunner, S. Phenotypic and genotypic background underlying variations in fatty acid composition and sensory parameters in European bovine breeds. J. Anim. Sci. Biotechnol. 2014, 5, 20. [Google Scholar] [CrossRef]
- Khan, M.; Khan, M.I.; Sahar, A.; Jamil, A. Predicting authenticity and physicochemical characteristics of meat through FT-IR spectroscopy coupled with multivariate analysis. Pak. J. Agric. Sci. 2020, 57, 1141–1147. [Google Scholar]
- Warren, H.E.; Scollan, N.D.; Enser, M.; Hughes, S.I.; Richardson, R.I.; Wood, J.D. Effects of breed and a concentrate or grass silage diet on beef quality in cattle of 3 ages. I: Animal performance, carcass quality and muscle fatty acid composition. Meat Sci. 2008, 78, 256–269. [Google Scholar] [CrossRef] [PubMed]
- Lucarini, M.; Durazzo, A.; Sanchez Del Pulgar, J.; Gabrielli, P.; Lombardi-Boccia, G. Determination of fatty acid content in meat and meat products: The FTIR-ATR approach. Food Chem 2018, 267, 223–230. [Google Scholar] [CrossRef] [PubMed]
- Siemens, B.J.; Daun, J.K. Determination of the fatty acid composition of canola, flax, and solin by near-infrared spectroscopy. J. Am. Oil Chem. Soc. 2005, 82, 153–157. [Google Scholar] [CrossRef]
- Tøgersen, G.; Arnesen, J.; Nilsen, B.; Hildrum, K. On-line prediction of chemical composition of semi-frozen ground beef by non-invasive NIR spectroscopy. Meat Sci. 2003, 63, 515–523. [Google Scholar] [CrossRef]
- Cozzolino, D.; Murray, I. Effect of sample presentation and animal muscle species on the analysis of meat by near infrared reflectance spectroscopy. J. Near Infrared Spectrosc. 2002, 10, 37–44. [Google Scholar] [CrossRef]
- Tao, F.; Ngadi, M. Recent advances in rapid and nondestructive determination of fat content and fatty acids composition of muscle foods. Crit. Rev. Food Sci. Nutr. 2018, 58, 1565–1593. [Google Scholar] [CrossRef] [PubMed]
- Zhou, L.J.; Wu, H.; Li, J.T.; Wang, Z.Y.; Zhang, L.Y. Determination of fatty acids in broiler breast meat by near-infrared reflectance spectroscopy. Meat Sci. 2012, 90, 658–664. [Google Scholar] [CrossRef]
- Ortiz, A.; Parrini, S.; Tejerina, D.; Pinto de Araújo, J.P.; Čandek-Potokar, M.; Crovetti, A.; Garcia-Casco, J.M.; González, J.; Hernández-García, F.I.; Karolyi, D.; et al. Potential Use of Near-Infrared Spectroscopy to Predict Fatty Acid Profile of Meat from Different European Autochthonous Pig Breeds. Appl. Sci. 2020, 10, 5801. [Google Scholar] [CrossRef]
- Pieszczek, L.; Czarnik-Matusewicz, H.; Daszykowski, M. Identification of ground meat species using near-infrared spectroscopy and class modeling techniques—Aspects of optimization and validation using a one-class classification model. Meat Sci. 2018, 139, 15–24. [Google Scholar] [CrossRef] [PubMed]
- Prieto, N.; Lopez-Campos, O.; Aalhus, J.L.; Dugan, M.E.; Juarez, M.; Uttaro, B. Use of near infrared spectroscopy for estimating meat chemical composition, quality traits and fatty acid content from cattle fed sunflower or flaxseed. Meat Sci. 2014, 98, 279–288. [Google Scholar] [CrossRef]
- Davies, A.M.C.; Grant, A. Review: Near-Infrared analysis of food. Int. J. Food Sci. Technol. 1987, 22, 191–207. [Google Scholar] [CrossRef]
- Sierra, V.; Aldai, N.; Castro, P.; Osoro, K.; Coto-Montes, A.; Olivan, M. Prediction of the fatty acid composition of beef by near infrared transmittance spectroscopy. Meat Sci. 2008, 78, 248–255. [Google Scholar] [CrossRef] [PubMed]
- Cecchinato, A.; De Marchi, M.; Penasa, M.; Casellas, J.; Schiavon, S.; Bittante, G. Genetic analysis of beef fatty acid composition predicted by near-infrared spectroscopy. J. Anim. Sci. 2012, 90, 429–438. [Google Scholar] [CrossRef] [PubMed][Green Version]
- Zomeño, C.; Juste, V.; Hernandez, P. Application of NIRS for predicting fatty acids in intramuscular fat of rabbit. Meat Sci. 2012, 91, 155–159. [Google Scholar] [CrossRef] [PubMed]
- Hargrave-Barnes, K.M.; Azain, M.J.; Miner, J.L. Conjugated linoleic acid-induced fat loss dependence on Delta6-desaturase or cyclooxygenase. Obesity 2008, 16, 2245–2252. [Google Scholar] [CrossRef]
- Cruz-Hernandez, C.; Deng, Z.; Zhou, J.; Hill, A.R.; Yurawecz, M.P.; Delmonte, P.; Mossoba, M.M.; Dugan, M.E.; Kramer, J.K. Methods for analysis of conjugated linoleic acids and trans-18: 1 isomers in dairy fats by using a combination of gas chromatography, silver-ion thin-layer chromatography/gas chromatography, and silver-ion liquid chromatography. J. AOAC Int. 2004, 87, 545–562. [Google Scholar] [CrossRef]
- Scollan, N.; Hocquette, J.F.; Nuernberg, K.; Dannenberger, D.; Richardson, I.; Moloney, A. Innovations in beef production systems that enhance the nutritional and health value of beef lipids and their relationship with meat quality. Meat Sci. 2006, 74, 17–33. [Google Scholar] [CrossRef] [PubMed]
- Barragan-Hernandez, W.; Mahecha-Ledesma, L.; Burgos-Paz, W.; Olivera-Angel, M.; Angulo-Arizala, J. Using near-infrared spectroscopy to determine intramuscular fat and fatty acids of beef applying different prediction approaches. J. Anim Sci. 2020, 98. [Google Scholar] [CrossRef]
- Sato, T.; Kawano, S.; Iwamoto, M. Near infrared spectral patterns of fatty acid analysis from fats and oils. J. Am. Oil Chem. Soc. 1991, 68, 827–833. [Google Scholar] [CrossRef]
- Balabin, R.M.; Lomakina, E.I. Support vector machine regression (SVR/LS-SVM)--an alternative to neural networks (ANN) for analytical chemistry? Comparison of nonlinear methods on near infrared (NIR) spectroscopy data. Analyst 2011, 136, 1703–1712. [Google Scholar] [CrossRef]
- Geladi, P.; MacDougall, D.; Martens, H. Linearization and scatter-correction for near-infrared reflectance spectra of meat. Appl. Spectrosc 1985, 39, 491–500. [Google Scholar] [CrossRef]


| Calibration Set | Validation Set | |||||||||
|---|---|---|---|---|---|---|---|---|---|---|
| Fatty Acid | Mean | Min | Max | S.D. | C.V. | Mean | Min | Max | S.D. | C.V. |
| 12:0 | 0.06 | 0.00 | 0.53 | 0.08 | 133.33 | 0.09 | 0.57 | 1.32 | 0.16 | 177.78 |
| 14:0 | 1.64 | 0.34 | 6.34 | 1.13 | 68.90 | 1.62 | 2.49 | 4.96 | 1.05 | 64.81 |
| 16:0 | 64.42 | 34.05 | 109.85 | 14.34 | 22.26 | 65.92 | 64.20 | 103.23 | 14.93 | 22.65 |
| 16:0 ald | 23.42 | 3.91 | 43.46 | 6.42 | 27.41 | 24.00 | 4.650 | 40.99 | 7.27 | 30.29 |
| 16:1 | 7.36 | 3.07 | 19.35 | 2.33 | 31.66 | 7.47 | 6.17 | 13.79 | 2.30 | 30.79 |
| 18:0 | 52.38 | 29.16 | 83.93 | 8.85 | 16.90 | 53.44 | 69.77 | 73.38 | 8.81 | 16.49 |
| 18:0 ald | 15.87 | 3.47 | 26.64 | 4.48 | 28.23 | 16.64 | 3.36 | 31.87 | 5.47 | 32.87 |
| 18:1 t9 | 4.39 | 0.93 | 14.20 | 2.75 | 62.64 | 4.47 | 6.95 | 16.85 | 2.91 | 65.10 |
| 18:1 c9 | 76.72 | 26.06 | 182.51 | 24.35 | 31.74 | 77.08 | 53.77 | 137.56 | 24.19 | 31.38 |
| 18:1 c11 | 14.58 | 7.87 | 25.92 | 3.43 | 23.53 | 14.79 | 11.29 | 26.03 | 3.69 | 24.95 |
| 18:2 n-6 | 124.47 | 62.45 | 210.43 | 29.61 | 23.79 | 127.88 | 67.43 | 199.28 | 29.67 | 23.20 |
| 20:1 | 0.57 | 0.00 | 1.20 | 0.22 | 38.60 | 0.59 | 0.30 | 1.26 | 0.23 | 38.98 |
| 18:3 n-3 | 6.37 | 1.51 | 22.07 | 4.35 | 68.29 | 6.57 | 3.58 | 19.57 | 4.55 | 69.25 |
| 18:2 9c11tCLA | 0.75 | 0.18 | 2.49 | 0.41 | 54.67 | 0.77 | 0.70 | 2.71 | 0.45 | 58.44 |
| 20:3 n-6 | 8.43 | 4.94 | 15.00 | 2.00 | 23.72 | 8.44 | 3.60 | 13.66 | 2.22 | 26.30 |
| 20:4 n-6 | 37.84 | 20.29 | 69.55 | 9.39 | 24.82 | 38.63 | 16.27 | 69.77 | 9.69 | 25.08 |
| 20:5 n-3 | 4.02 | 1.00 | 12.07 | 2.01 | 50.00 | 4.20 | 1.23 | 10.97 | 2.27 | 54.05 |
| 22:4 n-6 | 4.59 | 1.34 | 10.40 | 1.82 | 39.65 | 4.67 | 1.10 | 10.21 | 1.94 | 41.54 |
| 22:5 n-3 | 9.17 | 4.26 | 21.13 | 2.94 | 32.06 | 9.35 | 3.43 | 20.38 | 3.30 | 35.29 |
| 22:6 n-3 | 0.87 | 0.00 | 4.85 | 0.48 | 55.17 | 0.85 | 0.00 | 2.28 | 0.40 | 47.06 |
| Total FA | 493.81 | 270.43 | 813.78 | 85.49 | 17.31 | 504.13 | 467.25 | 726.78 | 89.74 | 17.80 |
| SFA | 157.80 | 89.26 | 252.16 | 28.679 | 18.17 | 161.71 | 101.33 | 228.035 | 31.09 | 19.23 |
| MUFA | 103.61 | 46.35 | 228.31 | 28.18 | 27.20 | 104.400 | 47.82 | 169.93 | 28.26 | 27.07 |
| PUFA | 196.51 | 107.55 | 319.65 | 39.61 | 20.16 | 201.36 | 103.90 | 297.84 | 40.64 | 20.18 |
| Calibration Set | Validation Set | |||||||||
|---|---|---|---|---|---|---|---|---|---|---|
| Fatty Acid | Mean | Min | Max | S.D. | C.V. | Mean | Min | Max | S.D. | C.V. |
| 12:0 | 2.10 | 0.00 | 8.86 | 1.87 | 89.05 | 2.06 | 0.06 | 8.69 | 1.80 | 87.38 |
| 14:0 | 73.63 | 0.87 | 313.13 | 58.97 | 80.09 | 71.57 | 2.49 | 256.53 | 55.15 | 77.06 |
| 16:0 | 651.20 | 51.20 | 2878.25 | 480.58 | 73.80 | 639.85 | 64.20 | 2420.91 | 442.30 | 69.13 |
| 16:0 ald | 23.42 | 3.91 | 43.46 | 6.42 | 27.41 | 24.00 | 4.65 | 40.99 | 7.27 | 30.29 |
| 16:1 | 92.50 | 5.55 | 414.79 | 73.77 | 79.75 | 89.04 | 6.17 | 266.67 | 64.18 | 72.08 |
| 18:0 | 401.08 | 50.04 | 1741.09 | 254.19 | 63.38 | 398.22 | 69.77 | 1497.58 | 237.68 | 59.69 |
| 18:0 ald | 15.87 | 3.47 | 26.64 | 4.48 | 28.23 | 16.64 | 3.36 | 31.87 | 5.47 | 32.87 |
| 18:1 t9 | 77.48 | 3.47 | 625.86 | 76.14 | 98.27 | 75.20 | 6.95 | 363.93 | 68.72 | 91.38 |
| 18:1 c9 | 854.17 | 31.86 | 4125.90 | 658.56 | 77.10 | 831.04 | 53.77 | 2866.55 | 573.11 | 68.96 |
| 18:1 c11 | 49.02 | 11.24 | 191.83 | 29.18 | 59.53 | 47.77 | 11.29 | 119.64 | 25.02 | 52.38 |
| 18:2 n-6 | 183.30 | 83.15 | 500.18 | 62.86 | 34.29 | 183.30 | 67.43 | 314.36 | 54.76 | 29.87 |
| 20:1 | 4.03 | 0.27 | 22.16 | 3.28 | 81.39 | 3.77 | 0.30 | 13.58 | 2.58 | 68.44 |
| 18:3 n-3 | 15.16 | 2.70 | 69.20 | 12.27 | 80.94 | 14.99 | 3.58 | 48.81 | 11.81 | 78.79 |
| 18:2 9c11t CLA | 8.14 | 0.45 | 43.18 | 6.39 | 78.50 | 7.84 | 0.70 | 27.41 | 5.26 | 67.09 |
| 20:3 n-6 | 9.14 | 5.15 | 16.12 | 2.48 | 27.13 | 9.11 | 3.60 | 16.29 | 2.67 | 29.31 |
| 20:4 n-6 | 38.56 | 20.29 | 71.23 | 9.60 | 24.90 | 39.32 | 16.27 | 70.47 | 10.01 | 25.46 |
| 20:5 n-3 | 4.18 | 1.00 | 15.56 | 2.18 | 52.15 | 4.35 | 1.23 | 11.41 | 2.37 | 54.48 |
| 22:4 n-6 | 4.91 | 1.34 | 11.33 | 2.15 | 43.79 | 4.96 | 1.10 | 11.70 | 2.26 | 45.56 |
| 22:5 n-3 | 9.61 | 4.26 | 21.85 | 3.11 | 32.36 | 9.82 | 3.43 | 20.65 | 3.47 | 35.34 |
| 22:6 n-3 | 0.91 | 0.00 | 4.95 | 0.61 | 67.03 | 0.89 | 0.00 | 5.56 | 0.60 | 67.42 |
| Total FA | 2701.26 | 452.75 | 10922.01 | 1780.47 | 65.91 | 2652.12 | 467.25 | 8701.06 | 1596.84 | 60.21 |
| SFA | 1167.30 | 133.90 | 4981.92 | 790.24 | 67.70 | 1152.34 | 157.41 | 4182.02 | 734.39 | 63.73 |
| MUFA | 1077.19 | 54.47 | 4916.56 | 818.18 | 75.96 | 1046.83 | 78.48 | 3570.11 | 713.46 | 68.15 |
| PUFA | 265.76 | 139.73 | 607.29 | 79.13 | 29.77 | 266.73 | 114.32 | 439.52 | 72.54 | 27.20 |
| Fatty Acid | Baseline Correction | Spectra Normalization | Scatter Correction a | Smooth | Mathematical Treatment b | F c |
|---|---|---|---|---|---|---|
| 12:0 | Offset | None | EMSC | None | None | 6 |
| 14:0 | Offset | None | EMSC | None | SG-1-2-5 | 5 |
| 16:0 | Offset | Area | SNV+D | None | SG-1-2-3 | 4 |
| 16:0 ald | None | None | None | None | SG-1-2-3 | 3 |
| 16:1 | Offset | None | None | None | None | 4 |
| 18:0 | Offset | Area | EMSC | None | None | 4 |
| 18:0 ald | Offset | Area | SNV+D | None | None | 6 |
| 18:1 t9 | None | None | EMSC | None | None | 3 |
| 18:1 c9 | None | None | None | None | SG-1-2-5 | 2 |
| 18:1 c11 | Offset | Area | SNV+D | None | None | 3 |
| 18:2 n-6 | None | None | None | None | None | 8 |
| 20:1 | Offset | Area | SNV | None | None | 6 |
| 18:3 n-3 | Offset | None | None | None | None | 10 |
| 18:2 9c11t CLA | Offset | Area | SNV+D | None | None | 5 |
| 20:3 n-6 | None | None | EMSC | None | None | 3 |
| 20:4 n-6 | None | Area | SNV | None | None | 12 |
| 20:5 n-3 | Offset | Area | EMSC+D | None | None | 8 |
| 22:4 n-6 | None | None | None | None | SG-1-2-3 | 5 |
| 22:5 n-3 | Offset | Area | None | None | None | 10 |
| 22:6 n-3 | None | Area | None | None | None | 1 |
| Total FA | Offset | Area | None | None | SG-1-2-5 | 5 |
| SFA | Offset | None | SNV | None | None | 6 |
| MUFA | None | None | SNV | None | None | 5 |
| PUFA | Offset | Area | None | None | SG-1-2-3 | 5 |
| Fatty Acid | Baseline Correction | Spectra Normalization | Scatter Correction a | Smooth | Mathematical Treatment b | F c |
|---|---|---|---|---|---|---|
| 12:0 | None | None | SNV+D | None | SG-1-2-3 | 4 |
| 14:0 | None | Area | SNV+D | None | SG-1-2-3 | 3 |
| 16:0 | None | Area | SNV+D | None | SG-1-2-3 | 3 |
| 16ald | None | None | None | None | None | 2 |
| 16:1 | None | None | None | SG1-1-1 | None | 8 |
| 18:0 | None | None | None | None | None | 5 |
| 18ald | None | None | SNV+D | None | None | 8 |
| 18:1t9 | None | None | SNV+D | None | None | 2 |
| 9c18:1 | None | None | None | None | NG-1-13 | 7 |
| 11c18:1 | None | Area | SNV+D | None | None | 11 |
| 18:2n-6 | None | None | None | SG1-2-2 | SG-1-2-3 | 5 |
| 20:1 | None | None | None | None | SG-1-2-3 | 4 |
| 18:3n-3 | Offset | None | None | None | None | 9 |
| 9c11tCLA | None | None | MSC | None | SG-1-2-3 | 4 |
| 20:3n-6 | None | None | None | None | NG-1-7 | 7 |
| 20:4n-6 | None | None | None | None | SG-1-2-3 | 7 |
| 20:5n-3 | None | None | None | None | NG-1-15 | 7 |
| 22:4n-6 | None | None | None | None | SG-1-2-3 | 6 |
| 22:5n-3 | None | None | SNV | None | NG-1-7 | 5 |
| 22:6n-3 | None | None | None | None | None | 1 |
| TotalFA | Offset | None | None | None | None | 9 |
| SFA | None | None | None | None | None | 9 |
| MUFA | None | None | None | None | NG-1-27 | 7 |
| PUFA | None | None | None | None | NG-1-11 | 6 |
| Fatty Acid | n | SEC | R2c | SEP | R2P | RPD | Consistency |
|---|---|---|---|---|---|---|---|
| 12:0 | 206 | 0.04 | 0.48 | 0.15 | 0.07 | 1.06 | 26.67 |
| 14:0 | 215 | 0.46 | 0.77 | 0.73 | 0.52 | 1.44 | 63.01 |
| 16:0 | 210 | 7.52 | 0.67 | 10.45 | 0.48 | 1.43 | 71.96 |
| 16:0ald | 210 | 5.31 | 0.24 | 6.70 | 0.13 | 1.08 | 79.25 |
| 16:1 | 205 | 1.35 | 0.44 | 1.85 | 0.32 | 1.24 | 72.97 |
| 18:0 | 211 | 5.72 | 0.50 | 6.92 | 0.36 | 1.27 | 82.66 |
| 18:0ald | 210 | 3.10 | 0.40 | 5.17 | 0.10 | 1.06 | 59.96 |
| t918:1 | 200 | 1.56 | 0.19 | 2.89 | 0.03 | 1.01 | 53.98 |
| 9c18:1 | 205 | 14.91 | 0.50 | 18.81 | 0.37 | 1.29 | 79.27 |
| 11c18:1 | 212 | 2.66 | 0.20 | 3.51 | 0.09 | 1.05 | 75.78 |
| 18:2n-6 | 200 | 18.81 | 0.42 | 33.94 | 0.04 | 0.87 | 55.42 |
| 20:1 | 215 | 0.15 | 0.49 | 0.20 | 0.27 | 1.16 | 75.00 |
| 18:3n-3 | 207 | 2.26 | 0.69 | 3.11 | 0.53 | 1.46 | 72.67 |
| 9c11tCLA | 200 | 0.25 | 0.36 | 0.43 | 0.06 | 1.04 | 58.14 |
| 20:3n-6 | 201 | 1.56 | 0.26 | 2.08 | 0.11 | 1.07 | 75.00 |
| 20:4n-6 | 201 | 5.88 | 0.55 | 7.59 | 0.29 | 1.28 | 77.47 |
| 20:5n-3 | 202 | 1.34 | 0.56 | 1.74 | 0.41 | 1.30 | 77.01 |
| 22:4n-6 | 207 | 1.10 | 0.59 | 1.58 | 0.29 | 1.23 | 69.62 |
| 22:5n-3 | 200 | 1.73 | 0.58 | 2.47 | 0.41 | 1.33 | 70.04 |
| 22:6n-3 | 198 | 0.28 | 0.12 | 0.38 | 0.05 | 1.07 | 73.68 |
| Total FA | 199 | 39.14 | 0.67 | 63.88 | 0.44 | 1.40 | 61.27 |
| SFA | 202 | 14.80 | 0.65 | 20.68 | 0.57 | 1.50 | 71.57 |
| MUFA | 210 | 17.46 | 0.53 | 18.85 | 0.50 | 1.50 | 92.63 |
| PUFA | 198 | 19.77 | 0.65 | 31.84 | 0.14 | 1.24 | 62.09 |
| Fatty Acid | n | SEC | R2c | SEP | R2p | RPD | Consistency |
|---|---|---|---|---|---|---|---|
| 12:0 | 222 | 1.02 | 0.70 | 0.97 | 0.72 | 1.9 | 105.15 |
| 14:0 | 219 | 26.05 | 0.77 | 27.97 | 0.74 | 2.0 | 93.14 |
| 16:0 | 222 | 233.56 | 0.71 | 234.99 | 0.72 | 1.9 | 99.39 |
| 16:0ald | 222 | 5.98 | 0.13 | 6.66 | 0.16 | 1.0 | 89.79 |
| 16:1 | 218 | 32.17 | 0.76 | 30.31 | 0.78 | 2.1 | 106.14 |
| 18:0 | 222 | 158.17 | 0.61 | 129.39 | 0.70 | 1.8 | 122.24 |
| 18:0ald | 222 | 3.79 | 0.53 | 4.85 | 0.21 | 1.1 | 78.14 |
| t918:1 | 219 | 41.01 | 0.47 | 50.16 | 0.47 | 1.4 | 81.76 |
| 9c18:1 | 217 | 244.72 | 0.80 | 274.92 | 0.77 | 2.1 | 88.59 |
| 11c18:1 | 218 | 12.14 | 0.77 | 12.69 | 0.74 | 2.0 | 95.67 |
| 18:2n-6 | 222 | 41.63 | 0.56 | 41.32 | 0.43 | 1.3 | 100.75 |
| 20:1 | 220 | 1.40 | 0.80 | 1.10 | 0.71 | 1.8 | 127.27 |
| 18:3n-3 | 222 | 7.73 | 0.60 | 7.07 | 0.65 | 1.7 | 109.34 |
| 9c11t CLA | 222 | 4.00 | 0.61 | 3.25 | 0.62 | 1.6 | 123.08 |
| 20:3n-6 | 217 | 1.45 | 0.64 | 2.09 | 0.39 | 1.3 | 69.38 |
| 20:4n-6 | 222 | 4.89 | 0.74 | 8.60 | 0.26 | 1.2 | 56.86 |
| 20:5n-3 | 210 | 1.71 | 0.39 | 1.90 | 0.38 | 1.3 | 90.00 |
| 22:4n-6 | 217 | 1.00 | 0.78 | 1.74 | 0.39 | 1.3 | 57.47 |
| 22:5n-3 | 211 | 2.47 | 0.37 | 2.79 | 0.36 | 1.2 | 88.53 |
| 22:6n-3 | 222 | 0.61 | 0.01 | 0.60 | 0.01 | 1.0 | 101.67 |
| Total FA | 222 | 908.22 | 0.74 | 730.79 | 0.79 | 2.2 | 124.28 |
| SFA | 222 | 412.56 | 0.73 | 355.68 | 0.77 | 2.1 | 115.99 |
| MUFA | 222 | 393.64 | 0.77 | 340.36 | 0.77 | 2.1 | 115.65 |
| PUFA | 222 | 53.35 | 0.54 | 53.81 | 0.45 | 1.3 | 99.15 |
Publisher’s Note: MDPI stays neutral with regard to jurisdictional claims in published maps and institutional affiliations. |
© 2021 by the authors. Licensee MDPI, Basel, Switzerland. This article is an open access article distributed under the terms and conditions of the Creative Commons Attribution (CC BY) license (https://creativecommons.org/licenses/by/4.0/).
Share and Cite
Ripoll, G.; Failla, S.; Panea, B.; Hocquette, J.-F.; Dunner, S.; Olleta, J.L.; Christensen, M.; Ertbjerg, P.; Richardson, I.; Contò, M.; et al. Near-Infrared Reflectance Spectroscopy for Predicting the Phospholipid Fraction and the Total Fatty Acid Composition of Freeze-Dried Beef. Sensors 2021, 21, 4230. https://doi.org/10.3390/s21124230
Ripoll G, Failla S, Panea B, Hocquette J-F, Dunner S, Olleta JL, Christensen M, Ertbjerg P, Richardson I, Contò M, et al. Near-Infrared Reflectance Spectroscopy for Predicting the Phospholipid Fraction and the Total Fatty Acid Composition of Freeze-Dried Beef. Sensors. 2021; 21(12):4230. https://doi.org/10.3390/s21124230
Chicago/Turabian StyleRipoll, Guillermo, Sebastiana Failla, Begoña Panea, Jean-François Hocquette, Susana Dunner, Jose Luis Olleta, Mette Christensen, Per Ertbjerg, Ian Richardson, Michela Contò, and et al. 2021. "Near-Infrared Reflectance Spectroscopy for Predicting the Phospholipid Fraction and the Total Fatty Acid Composition of Freeze-Dried Beef" Sensors 21, no. 12: 4230. https://doi.org/10.3390/s21124230
APA StyleRipoll, G., Failla, S., Panea, B., Hocquette, J.-F., Dunner, S., Olleta, J. L., Christensen, M., Ertbjerg, P., Richardson, I., Contò, M., Albertí, P., Sañudo, C., & Williams, J. L. (2021). Near-Infrared Reflectance Spectroscopy for Predicting the Phospholipid Fraction and the Total Fatty Acid Composition of Freeze-Dried Beef. Sensors, 21(12), 4230. https://doi.org/10.3390/s21124230