1. Introduction
Human monitoring has always drawn attention in many applications, including smart building. Determining the number of people inside each room in a building is a very important task for controlling that the safety norms imposed by laws are properly followed and that health system recommendations are fulfilled. This becomes more important in the context of the coronavirus pandemic, wherein it is essential to monitor people’s occupancy, especially in an indoor environment. In this context, designing a low-cost architecture for monitoring the number of people occupying rooms is a challenging task.
A building’s related information is often managed with so-called Building Information Modeling (BIM), a standard procedure employed for optimizing the planning and implementation of a system with the help of a software platform [
1]. It requires the fulfilment of some key parameters that include building elements and equipment to be modelled, high-quality documentation, and necessary attributes for monitoring and interpreting available information [
2].
The management of the public building, from the energy point of view, implies the knowledge of how and when the internal workspaces are used, and therefore by the instantaneous measurement of the number of people inside it. Thus, suitably training a neural network or using appropriate machine learning algorithms [
3] to update a behavioural model of the building can allow rationalizing both the use of spaces and consequently the use of the electrical/thermal energy necessary for their lighting and air conditioning. In this scenario, sensor technology manifests as a powerful tool for acquiring data from a building that forms an important basis for BIM application.
Sensor technology started from the simple thermistor to advanced differential pyroelectric devices. Based on their operating principle, sensors are classified as mechanical and electronic, while in terms of communication and storage, they are classified as wired, wireless, and portable. In building applications, sensor technologies are used to monitor parameters such as temperature, humidity, CO
2, lighting, and occupancy. Implementation challenges of sensors network can vary notably for different building applications and depends on factors such as building size, location, number of devices, and preferred technologies [
4].
A huge range of communication and wireless networking methods, such as Zigbee, Bluetooth Wi-Fi, Z-Wave, etc., are available in the market to complement the proper functioning of a sensor system inside a building. Hayat et al. in [
4] have provided a detailed overview of prominent wireless technologies employed in buildings. Kim et al. in [
5] used the Zigbee protocol to implement a hybrid wireless sensor network in the building set-up. In a recent study [
6], the authors investigated the application of a smart sensing network embedded with passive infrared (PIR) CO
2 sensors using BACnet communication protocol and noted a reduction of building-operational cost and energy. Yassein et al. in [
7] utilised the Z-Wave protocol and discussed its application in smart homes.
Numerous technologies are proposed in the literature for human presence detection [
6] that exhibit different features such as costs, resolution, privacy, etc. For instance, conventional video camera systems used for surveillance are accurate but expensive and require significant infrastructure to process pieces of information to extract relevant features and are intrusive. Several low-cost sensor systems have been utilised to preserve privacy but with a low-resolution sensing feature. In literature, several studies have proposed a combination of different sensing modalities and machine learning approaches for counting and identifying people inside buildings, utilising a low-cost sensor set-up.
Moreover, recent research has shown that surveillance video camera data can be analysed in order to extract information relating to suspicious human behaviour and identity [
8,
9]. In particular, gait recognition is an emerging biometric technology that identifies people through the analysis of the way they walk [
10].
Sun et al. in [
11] used a low-cost pyroelectric sensing system for human-monitoring applications, and the sensor array was built using single PIR sensors. Yang et al., in [
12], used a PIR sensor mesh network, and an improved Kalman filter and a particle filter are used for human tracking. Hao et al., in [
13], investigated a low-cost alternative to infrared video sensors, i.e., a PIR sensor system for tracking and identifying people based on their body heat radiation using an Expectation-Maximization-Bayesian tracking scheme. Chowdhury et al. in [
14] investigated a low-cost security system using a small PIR sensor built around a microcontroller by sensing thermal perturbations with the surrounding environment due to the presence of individuals. Caidedo et al., in [
15], proposed an ultrasonic sensor array prototype for reliable indoor human presence detection. Unlike pyroelectric, thermopile sensors can detect both stationary and motion activities without compromising privacy.
In this work, a thermal array (64 thermopile sensing elements, 8 × 8 grid) IR sensor was set-up to count the number of people inside a room using a novel algorithm for automated recognition of patterns in data (pattern recognition). In
Table 1, we confine our attention to research works that have utilised the same (8 × 8 pixels) thermal array IR sensors to monitor human movement/presence but employed different computational approaches to analyse the data.
Basu and Rowe, in [
16], developed a low-cost method to estimate the direction of human motion (with 80% accuracy) using a 64 pixels IR sensor array and using a support vector machine algorithm. Mohammadmoradi et al., in [
17], employed a threshold-based technique (Otsu’s binarization) to estimate the people flow (with an average 93% accuracy) through doorways using a low-resolution IR sensor array.
Trofimova et al., in [
18], utilised the noise removal technique based on the Kalman filter to detect human presence in an indoor environment using 8 × 8 pixels thermal sensor arrays. Jeong and co-workers, in [
19], proposed a probabilistic method with image pre-processing and post-processing techniques for human detection using heat signatures from a low-resolution thermal IR sensor array system.
Qu et al., in [
20], proposed a thermopile sensor array deployed horizontally with a height of 3.5 m for indoor localization and a human tracking system with a Kalman filter. The designed adaptive threshold technique to preserve human targets and remove background by the authors functions well for indoor multiple human targets. Within a smart building set-up, Maaspuro, in [
21], studied an application of IR sensor array as a doorway occupancy counter using Kalman filter tracking algorithm and reported an accuracy between 89–92%.
Doherty et al., in [
22], implemented a novel indoor localization system by combining sensor technology and machine learning methods (logistic regression, K-Nearest neighbours, support vector machine, and a feedforward neural network) to collect and analyze human occupancy data in an indoor toilet. They reported an accuracy value between 98–99%.
For completeness, we also report studies that have employed better resolution IR sensor arrays for indoor human tracking. Spasov et al., in [
23], proposed the use of a 32 × 24 pixels thermal detector with an open-source hardware board for developing a solution with applications for monitoring of the human presence and home appliances. Gu et al., in [
24], proposed a dynamic fuzzy spatiotemporal background removal technique for human activity perception based on a 32 × 24 pixels thermopile sensor array (MLX90640, Melexis Corporation, Belgium).
The goal of our study is to validate the functionality of the proposed pattern recognition algorithm that allows determining the number of people in a room, using a low-cost and easy to install sensor system on top of doorways. The total number of people in the building can be then calculated by adding up this information. To do so, we designed and developed a low-cost smart IR sensor system to track the number of people entering and exiting the environment, which required constant monitoring. In detail, we present the design, construction, and programming of a Z-Wave-based sensors. The development board used is called Z-Uno. It is a board for developers that allows creating a customized Z-Wave device, which then implements the Z-Wave protocol management utilising the pre-installed software. Further, we studied a pattern recognition algorithm for analysing the IR sensor time-series data and identifying events of people crossing the doorway. The main requirements of this algorithm are low computational complexity and low memory footprint. The low memory footprint is achieved by using reference data in the last five sensor readings. The developed algorithm was then implemented into the microcontroller present in the sensor device. Finally, the algorithm’s accuracy to detect different human walking speeds at temperature ranges typical of the residential environment was investigated by performing various stress tests on synthetic data sets simulating temperature ranges typical of a residential environment, different human walking speed (normal, brisk, running), and different distances between the person and the sensor (1.5 m, 5 m, 7.5 m).
In summary, the main contributions of this work are:
- (1)
Study and development of a low-computational complexity and low memory footprint pattern recognition algorithm.
- (2)
Development of a low-cost people-counting device with a microcontroller implementing the proposed algorithm.
The paper is organized as follows. In
Section 2, we describe the proposed architecture. In
Section 3, we present the proposed pattern recognition algorithm. In
Section 4, we present the experimental analysis scheme. In
Section 5, we discuss the three phases: data acquisition and calibration of algorithm, validation, and simulation of the real-time human-passage experiment. Finally, the conclusions and future work are described in
Section 6.
2. Proposed Architecture
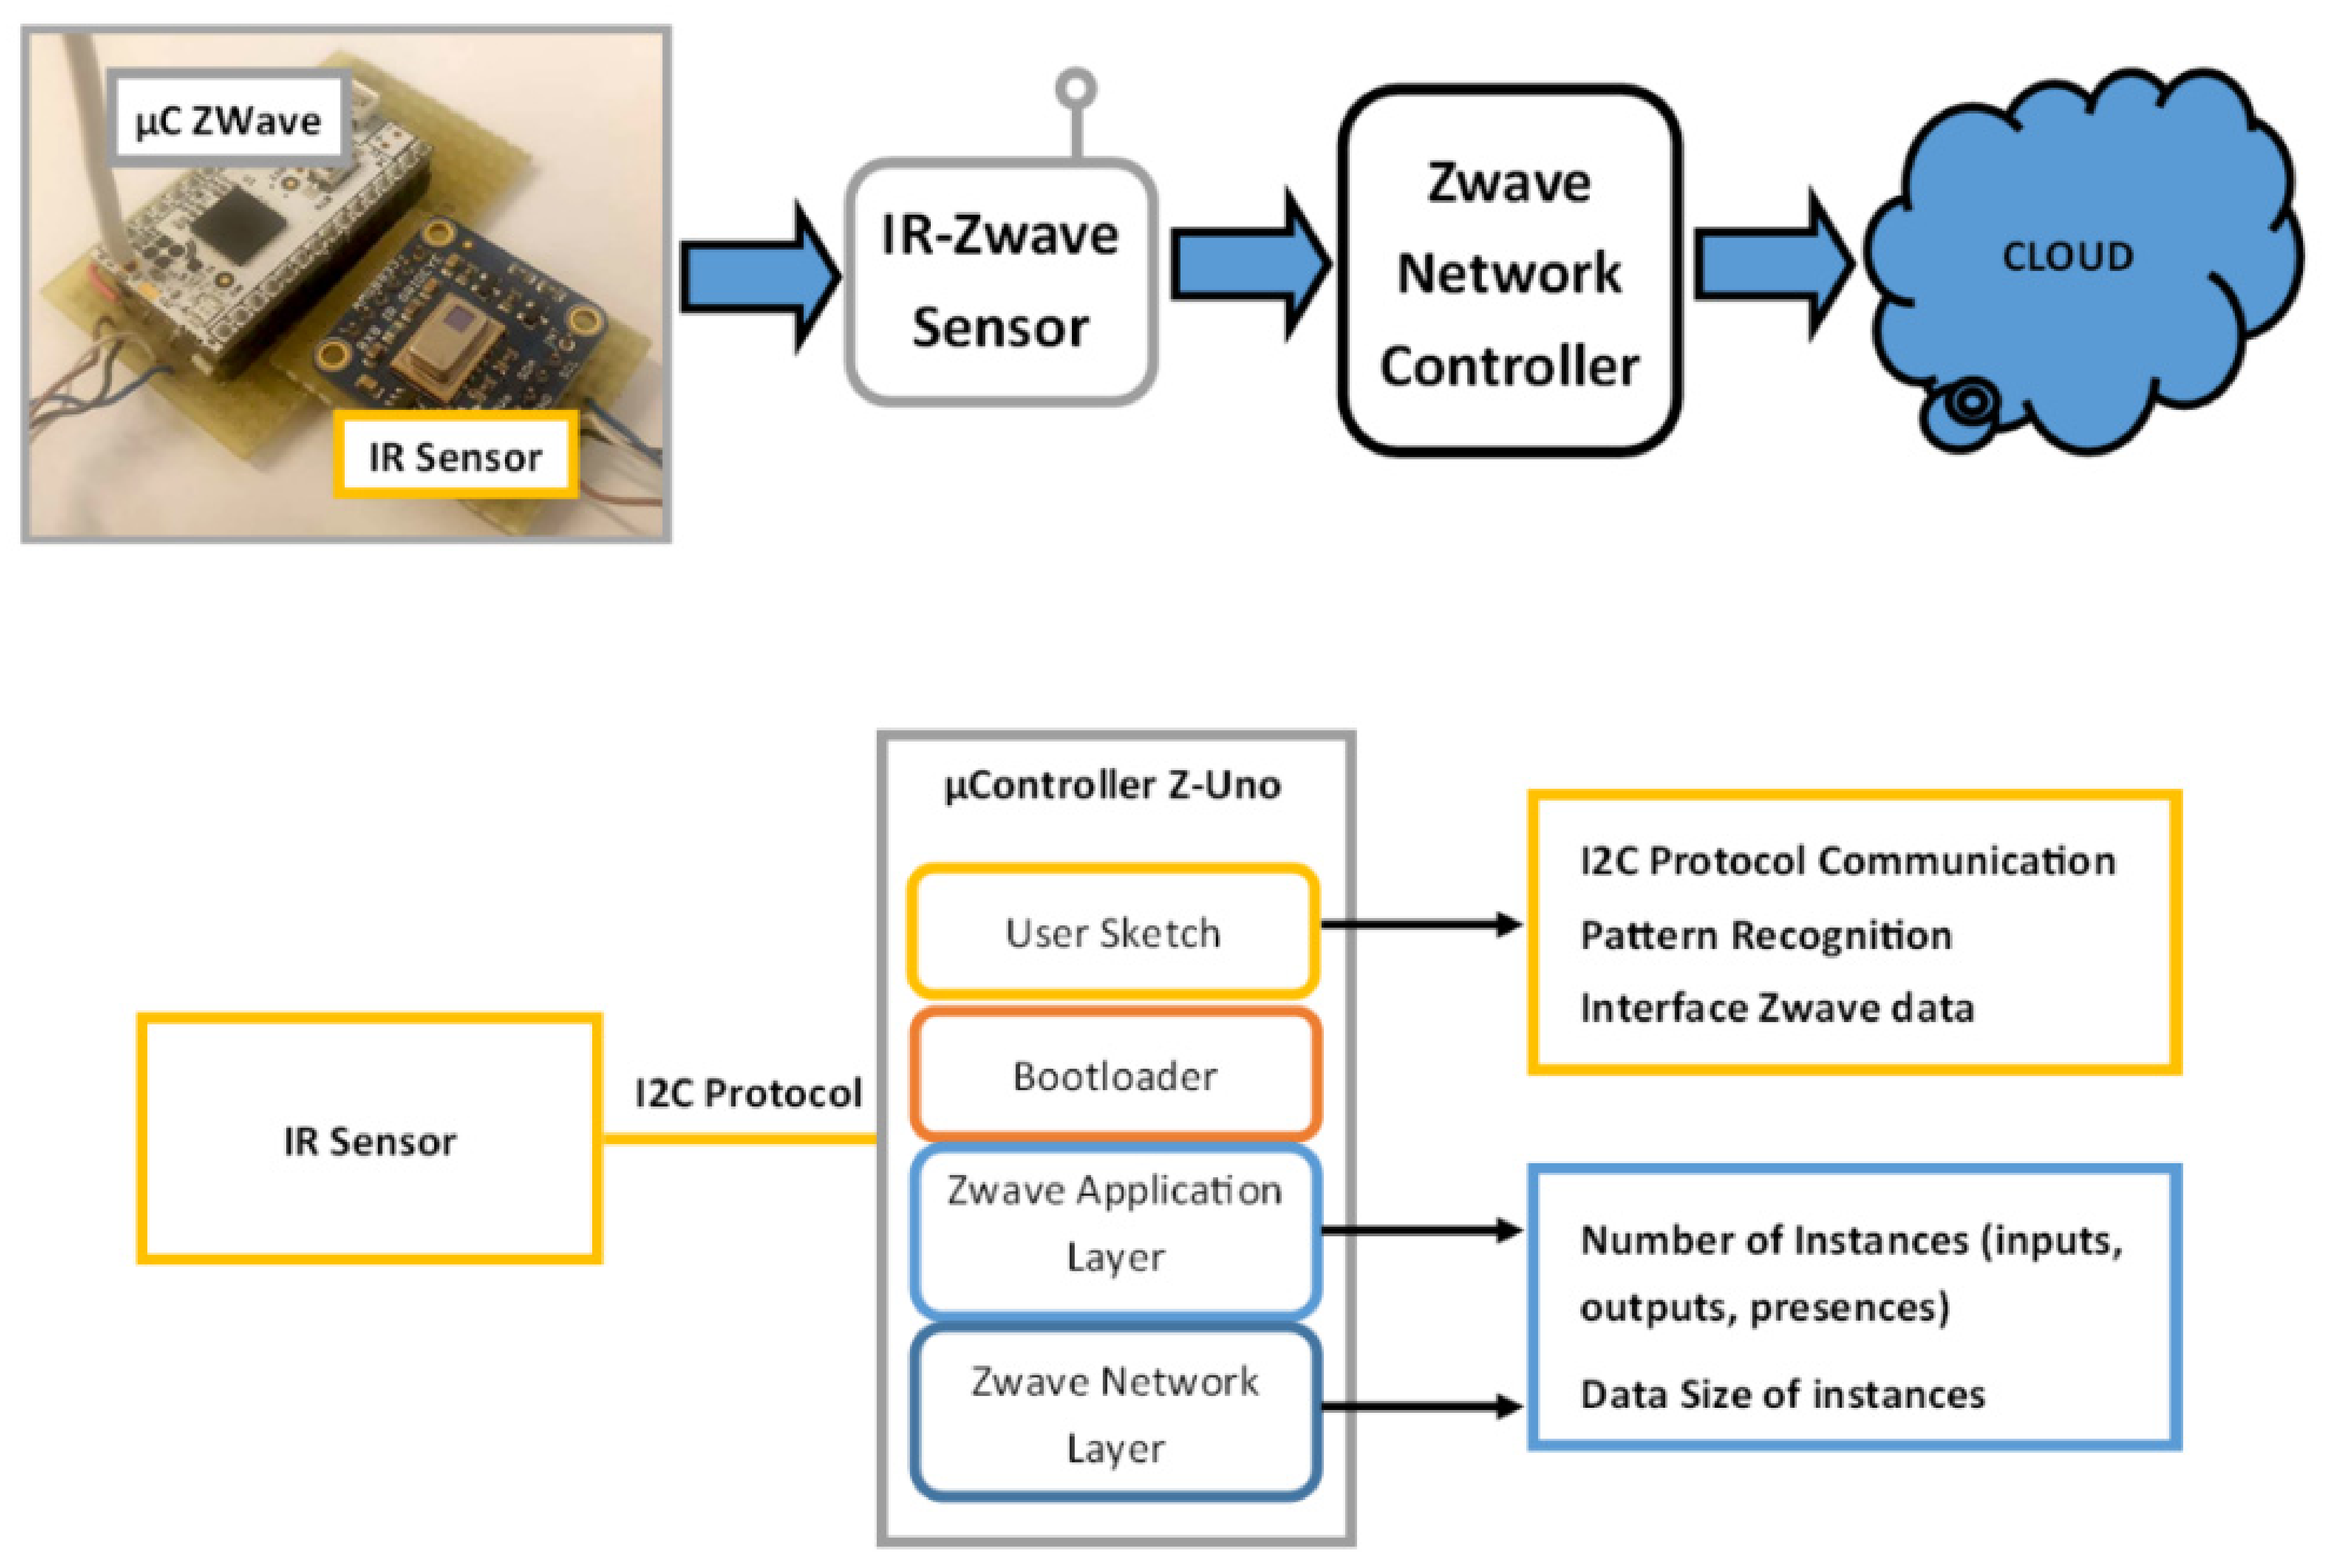
The proposed architecture is composed of three main components: a Panasonic Grid-EYE 64 pixel IR sensor array, a Z-Wave network, and a signal-processing module [
25]. The infrared sensor captures the thermal image of the user’s passage, the I2C protocol passes the signal to the processing module, which implements the proposed pattern recognition algorithm, and after that, the data are sent via Z-Wave protocol to the network. These components are discussed in the following section.
A schematic representation of the proposed architecture is shown in
Figure 1.
2.1. Infrared Sensor
A GridEye sensor was used for the development and test of the proposed architecture. A GridEye sensor is a thermopile array device consisting of a matrix of 8 × 8 IR sensors, which are connected to the analog-to-digital converter (ADC) and internal memory, all managed by an integrated microcontroller that provides a digital interface via I2C protocol (serial communication protocol). The approximate cost of the sensor used in this paper is ~$50.
When considering the cost-effectiveness of indoor human-counting solutions, it is preferable to use low-resolution (8 × 8 pixels) thermal IR sensors instead of expensive high-end thermal cameras, which could still cost up to thousands of dollars.
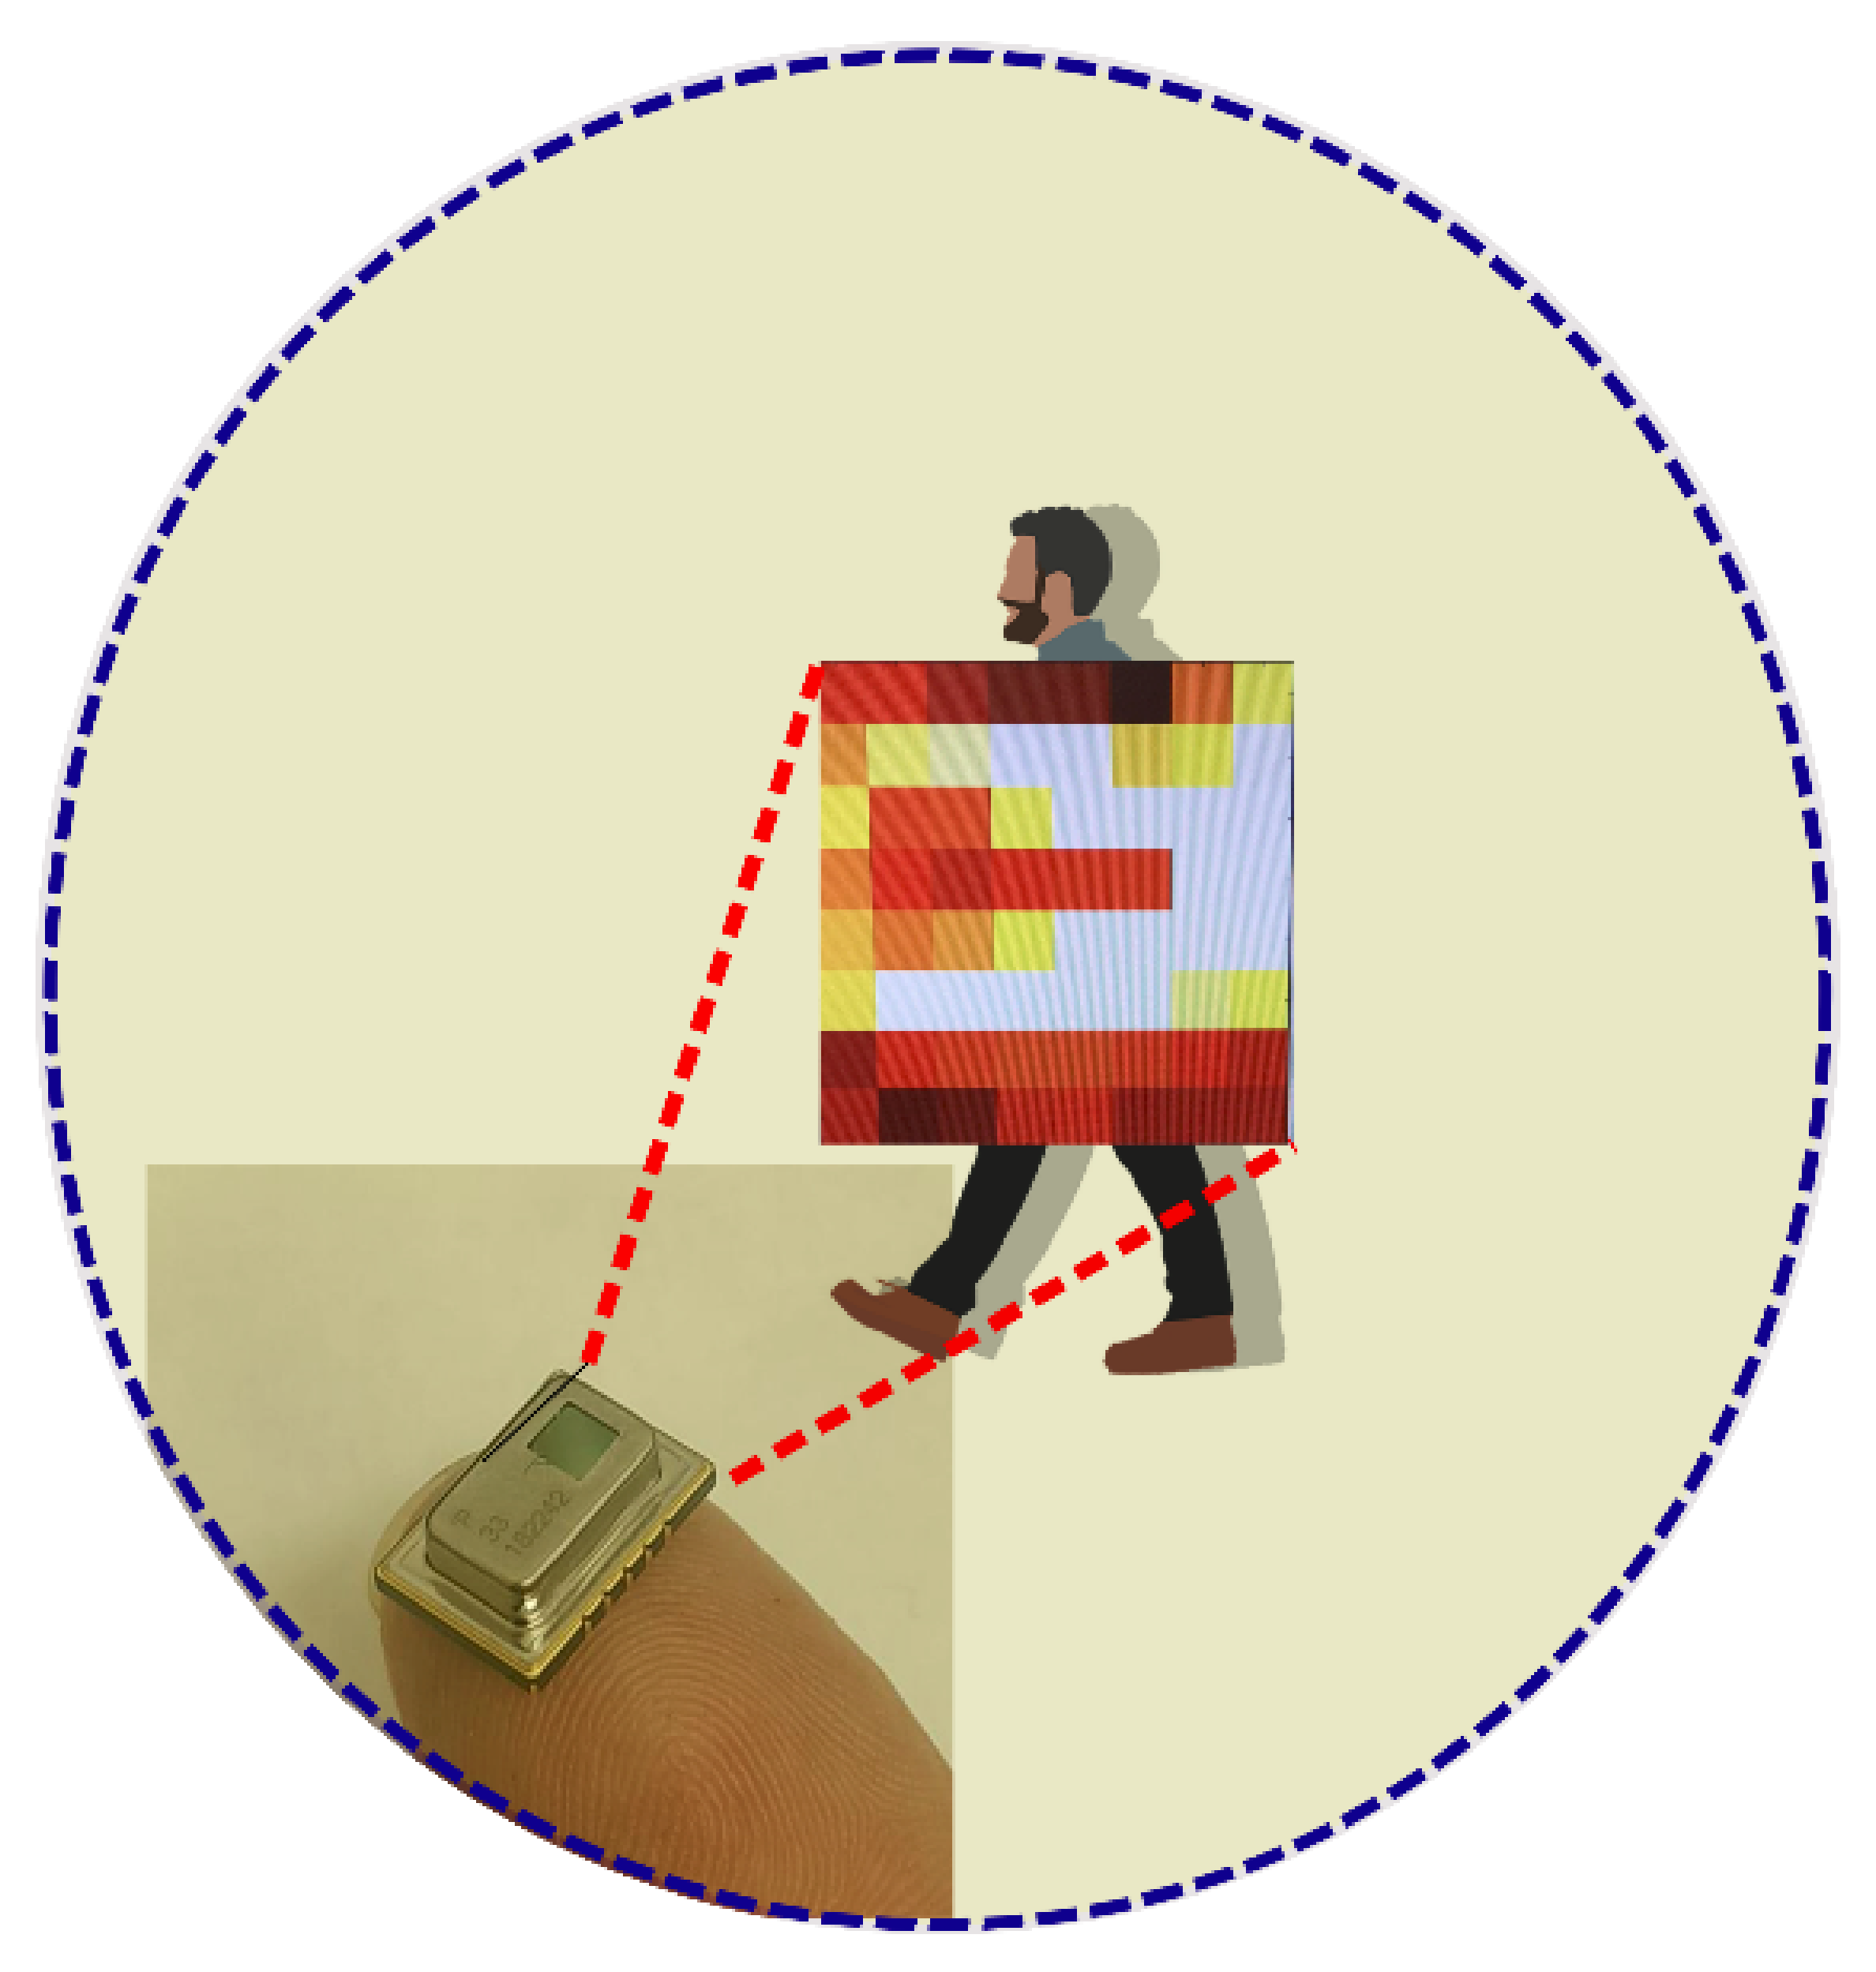
The device is constituted by an 8 × 8 array of IR sensors (64 pixels), which performs the acquisition of comprehensive temperature data, thus obtaining thermal images and temperature gradients. The sensitivity of an IR sensor derives from the photometric sensitivity of each detector at each pixel. An IR sensor has multiple pixels that all work together to create a complete view of the area. By its nature, it protects the host environment’s privacy, contrary to what is possible with conventional cameras.
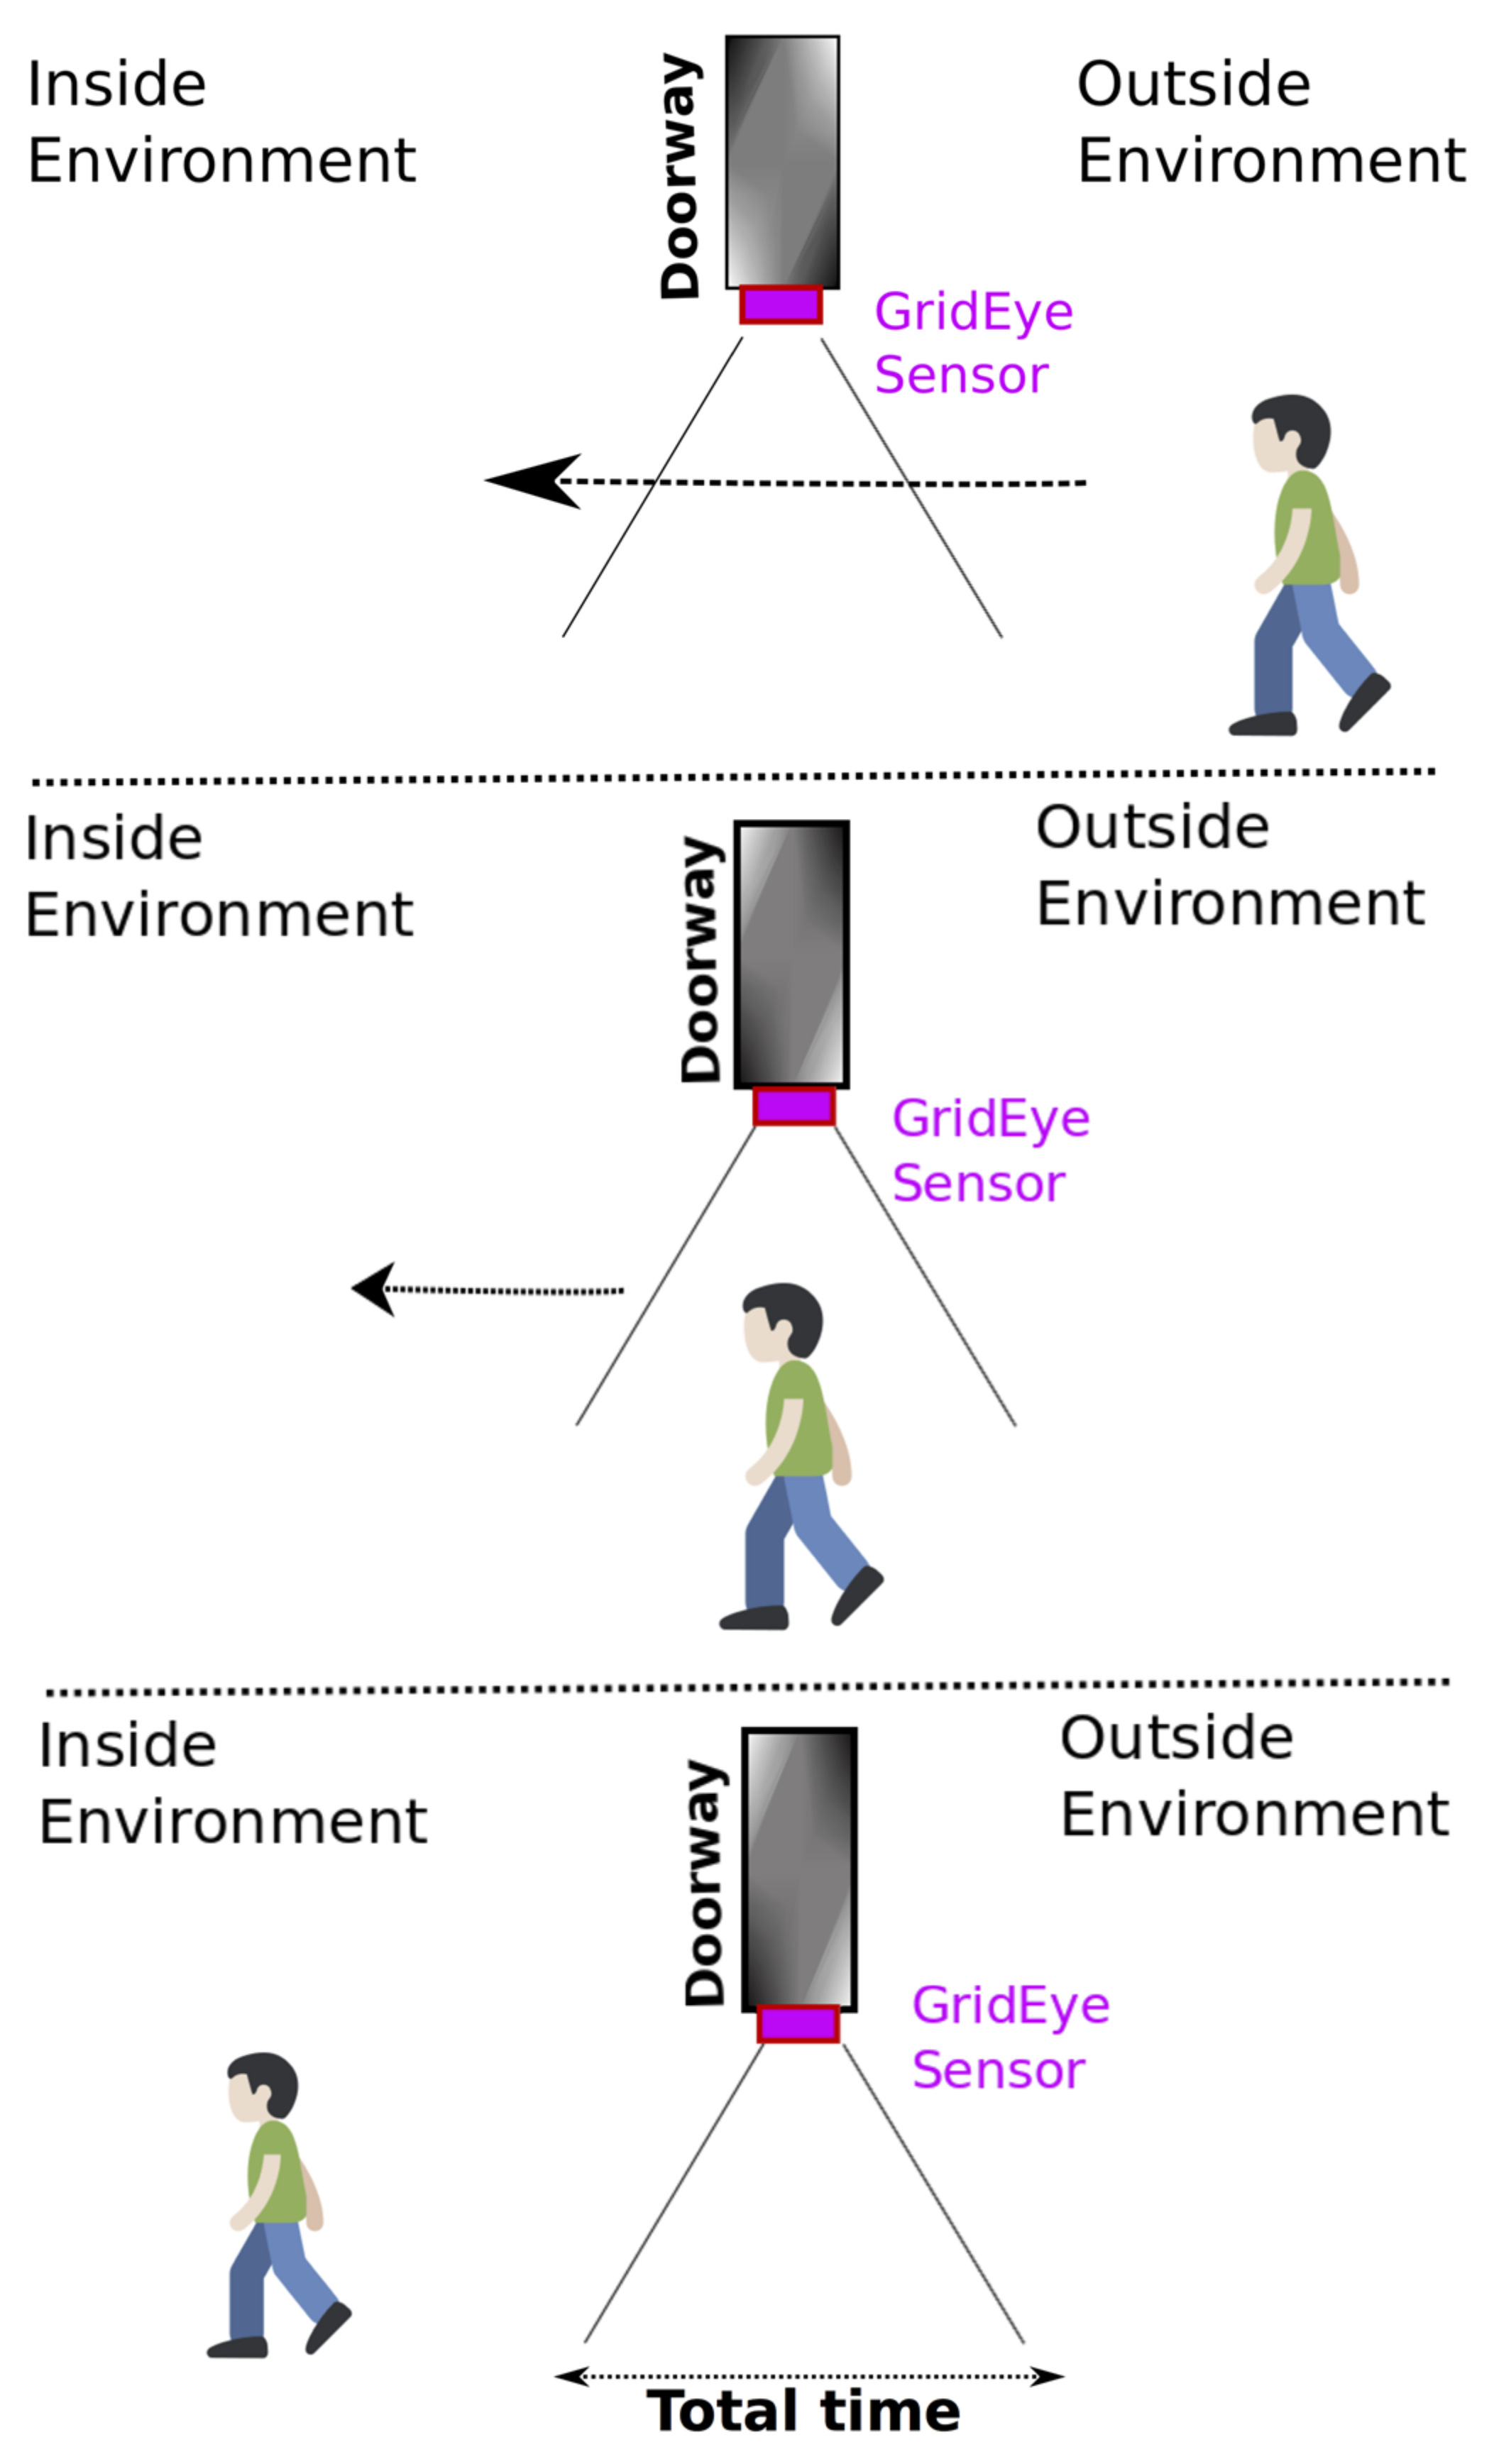
The sensor capturing a normal human passage movement is represented in
Figure 2.
The chip integrates within its interior a lens that supports a viewing angle of 60° and an I2C visual interface that allows obtaining measurements with a frame rate from 1 to 10 frames per second. The device offers an interrupt pin for applications that require event management “critical-time,” a PIN for the selection of 2 I2C addresses. In
Table 2, the essential features of the Grid-Eye sensors set-up are shown.
2.2. Z-Wave Installed IR Sensor
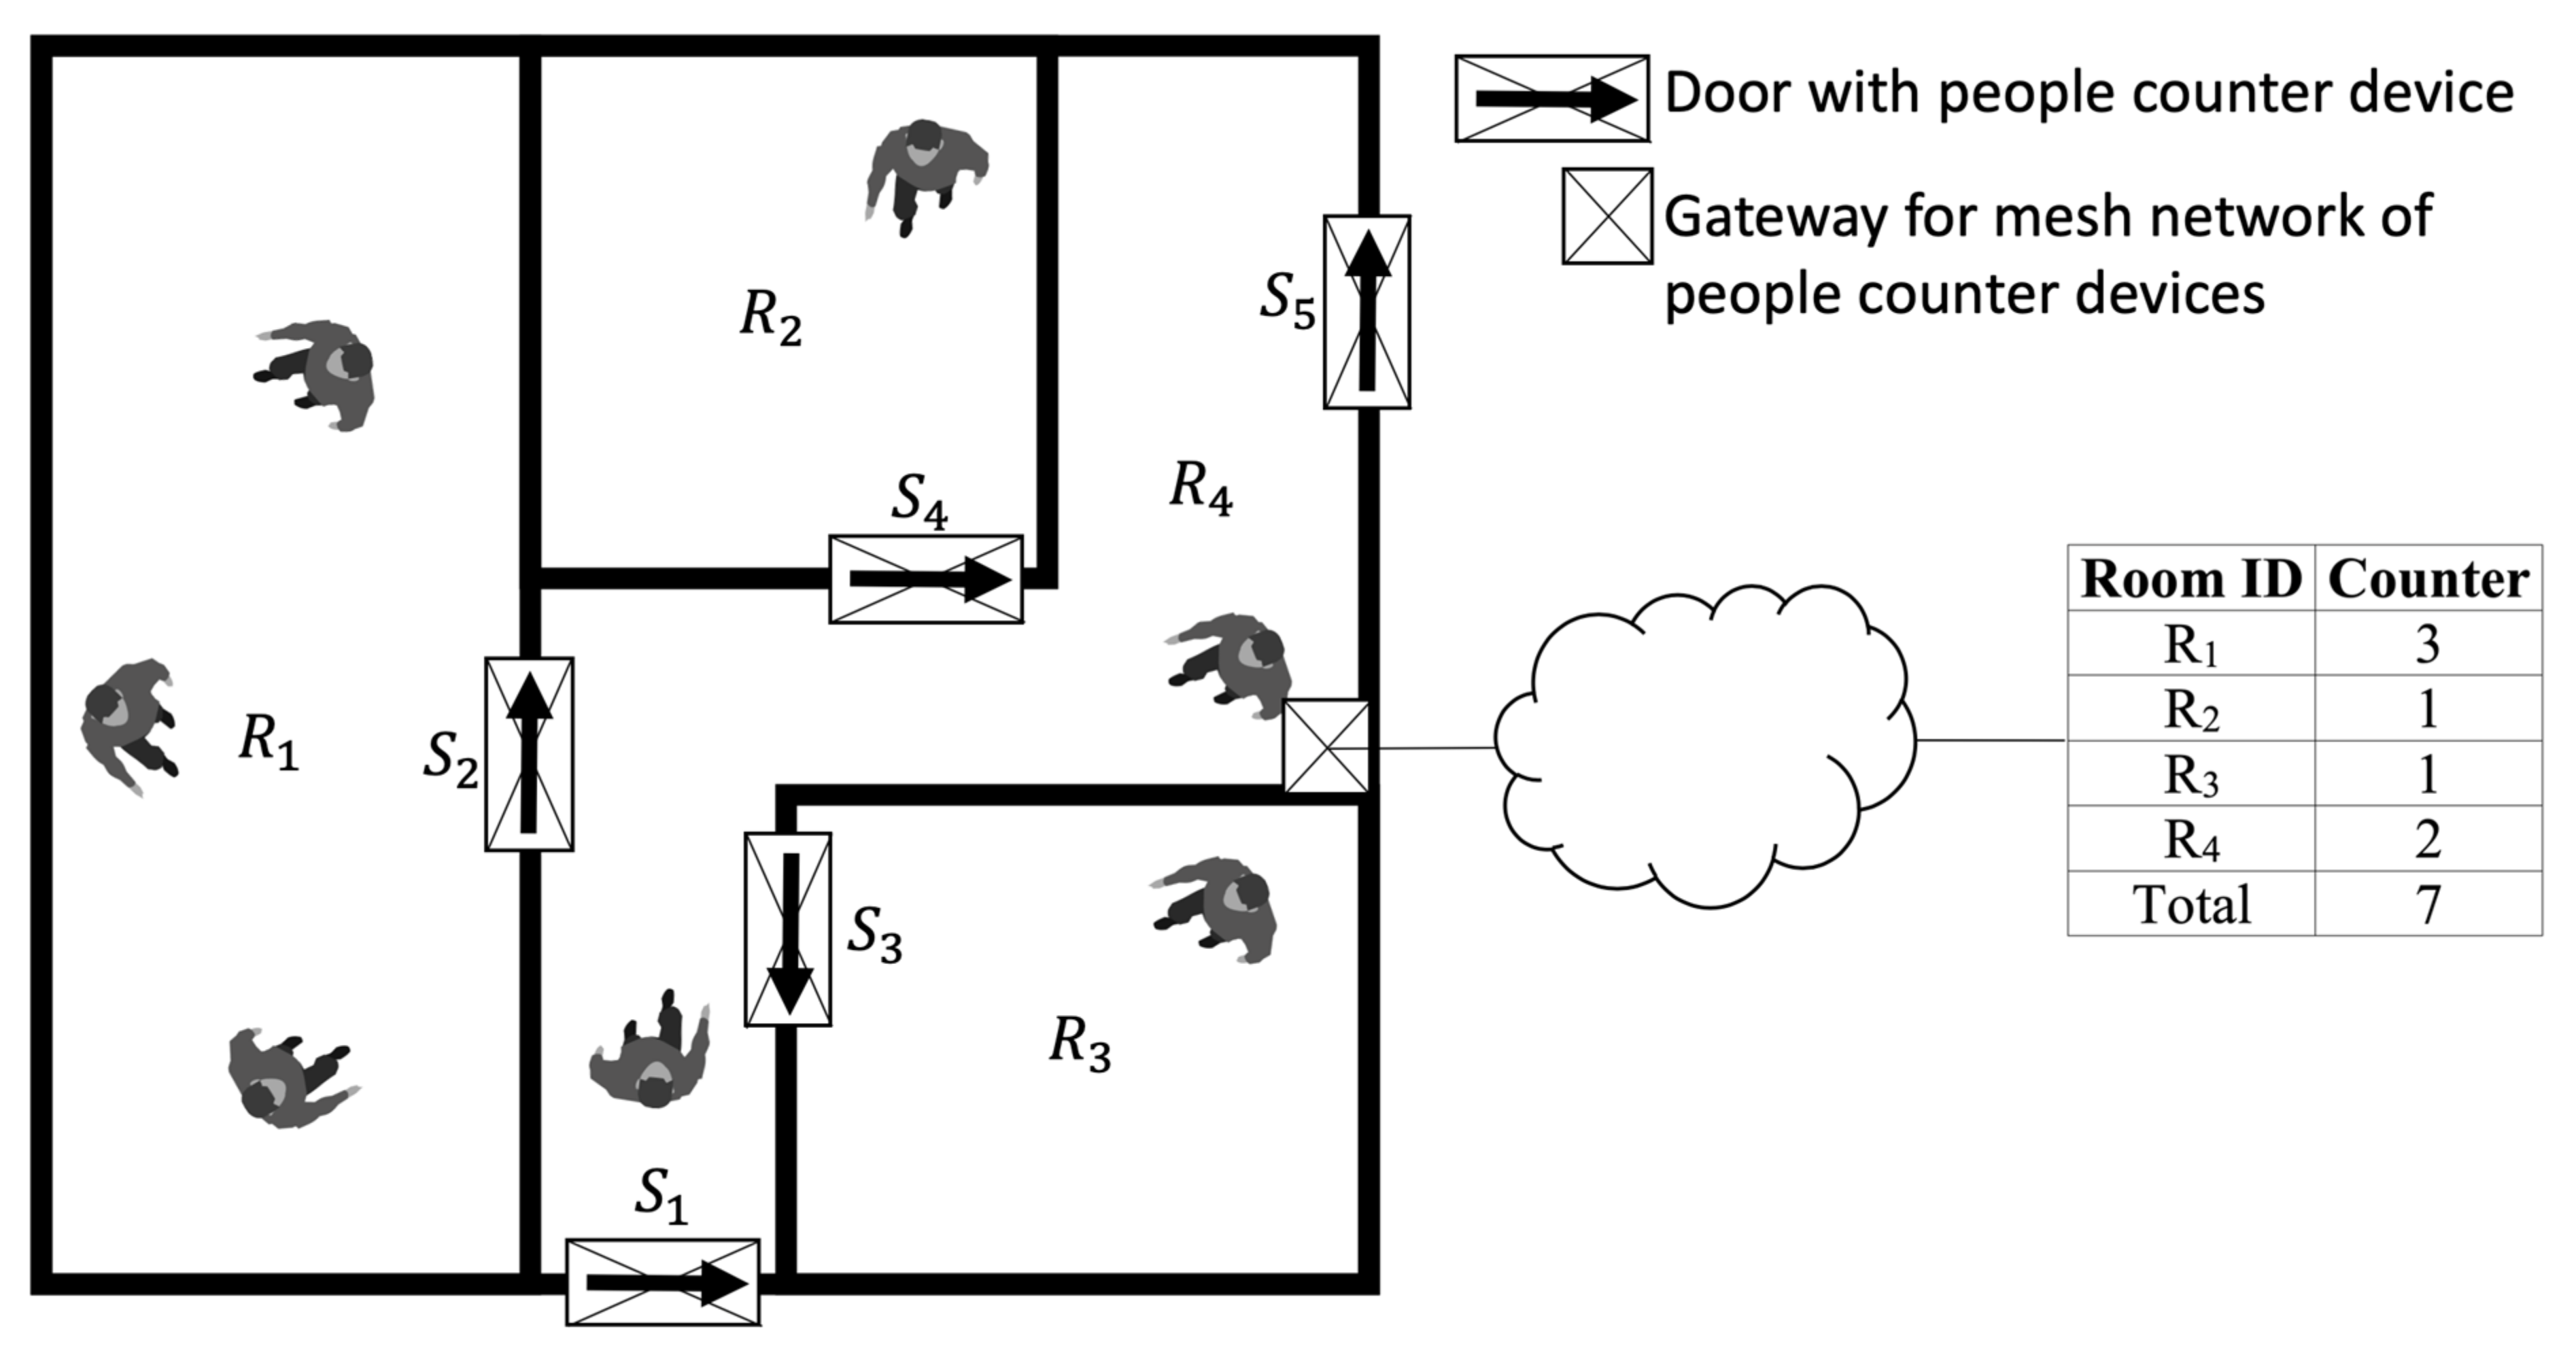
The IR devices were connected using the Z-Wave wireless communication protocol (based on mesh network topology). Z-Wave is a low-power wireless technology, easy to implement inside buildings, and requires low maintenance costs. Through the three values, the Z-Wave sensor network offers the treatment as three distinct Z-Wave channels containing, respectively: (i) the total number of inputs, (ii) the total number of outputs, and (iii) the number of people currently present within the environment. These values can be updated every 60 s, depending on the Z-Wave network configuration or need for ambient monitoring.
The tracking of human passage is performed by acquiring frames from the IR sensor and processing them through a pattern recognition algorithm, implemented in C++ language, that is executed cyclically inside the microcontroller of the Z-Uno board.
Through our developed algorithm, it was possible to perform the count of people entering and exiting the environment by querying the IR sensor device using the I2C protocol and analysing the time evolution of the captured frames.
Different sequence patterns were obtained for the user’s movement in the vicinity of the sensor, for example, “input,” “fake entry,” “output,” and “fake exit,” as defined in
Table 3. In this regard, in the following section, we present a detailed description of the proposed algorithm for people moving through a doorway.
5. Results and Discussion
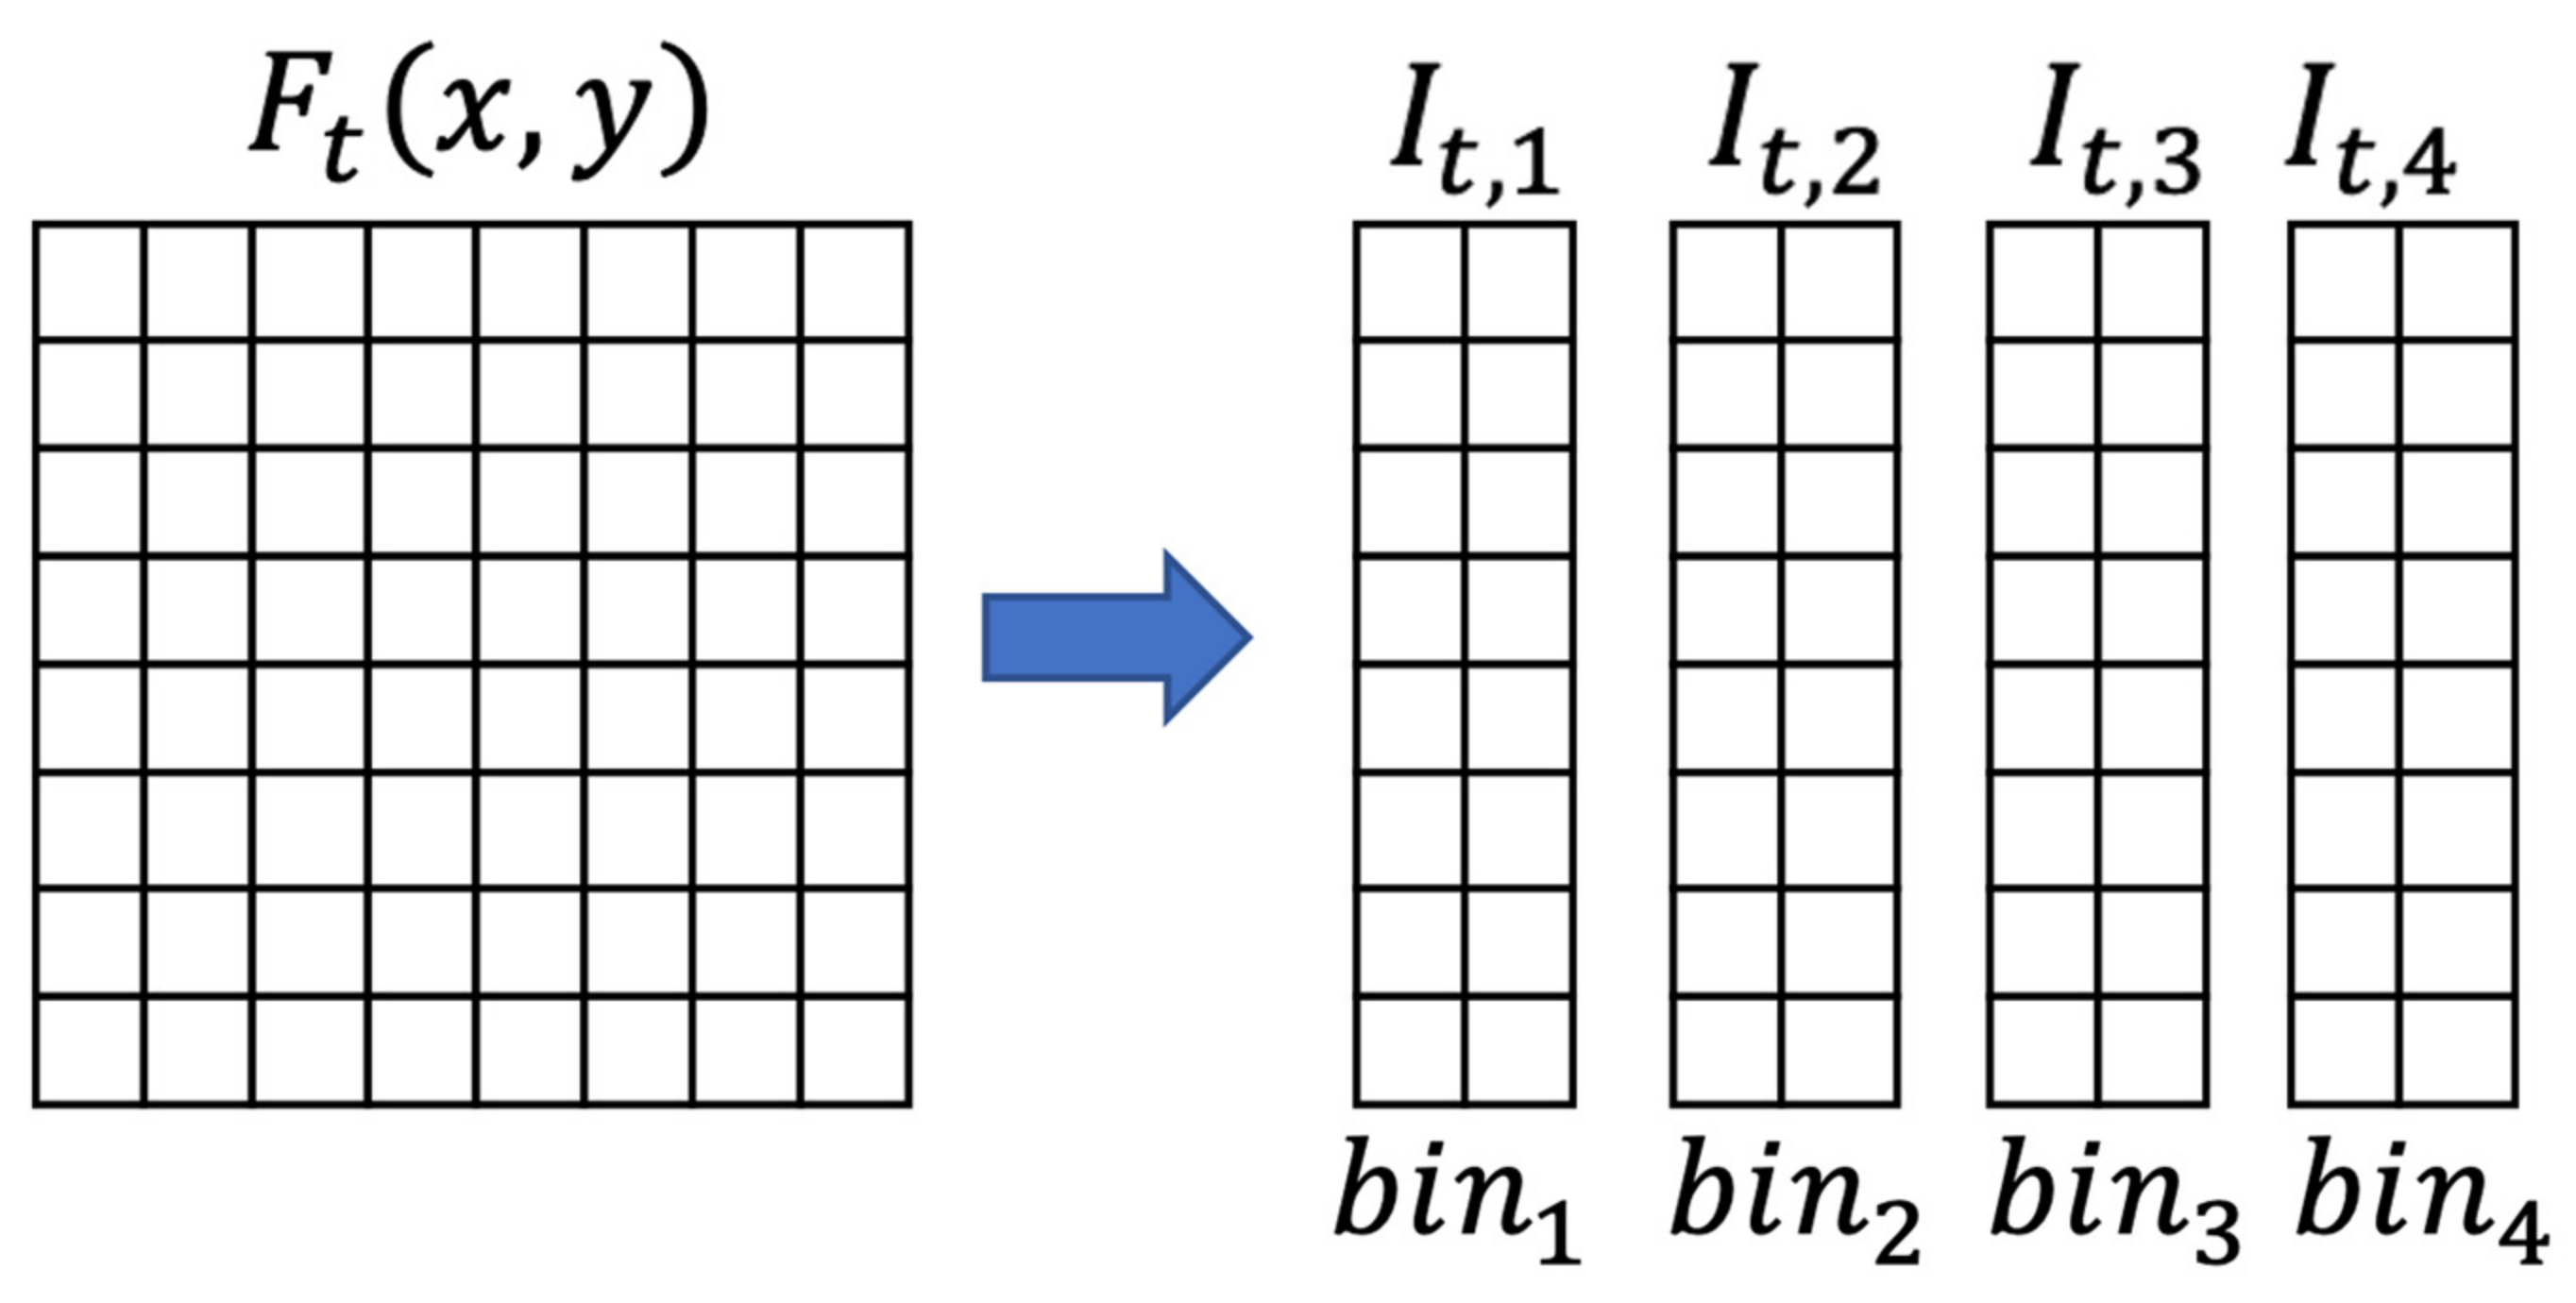
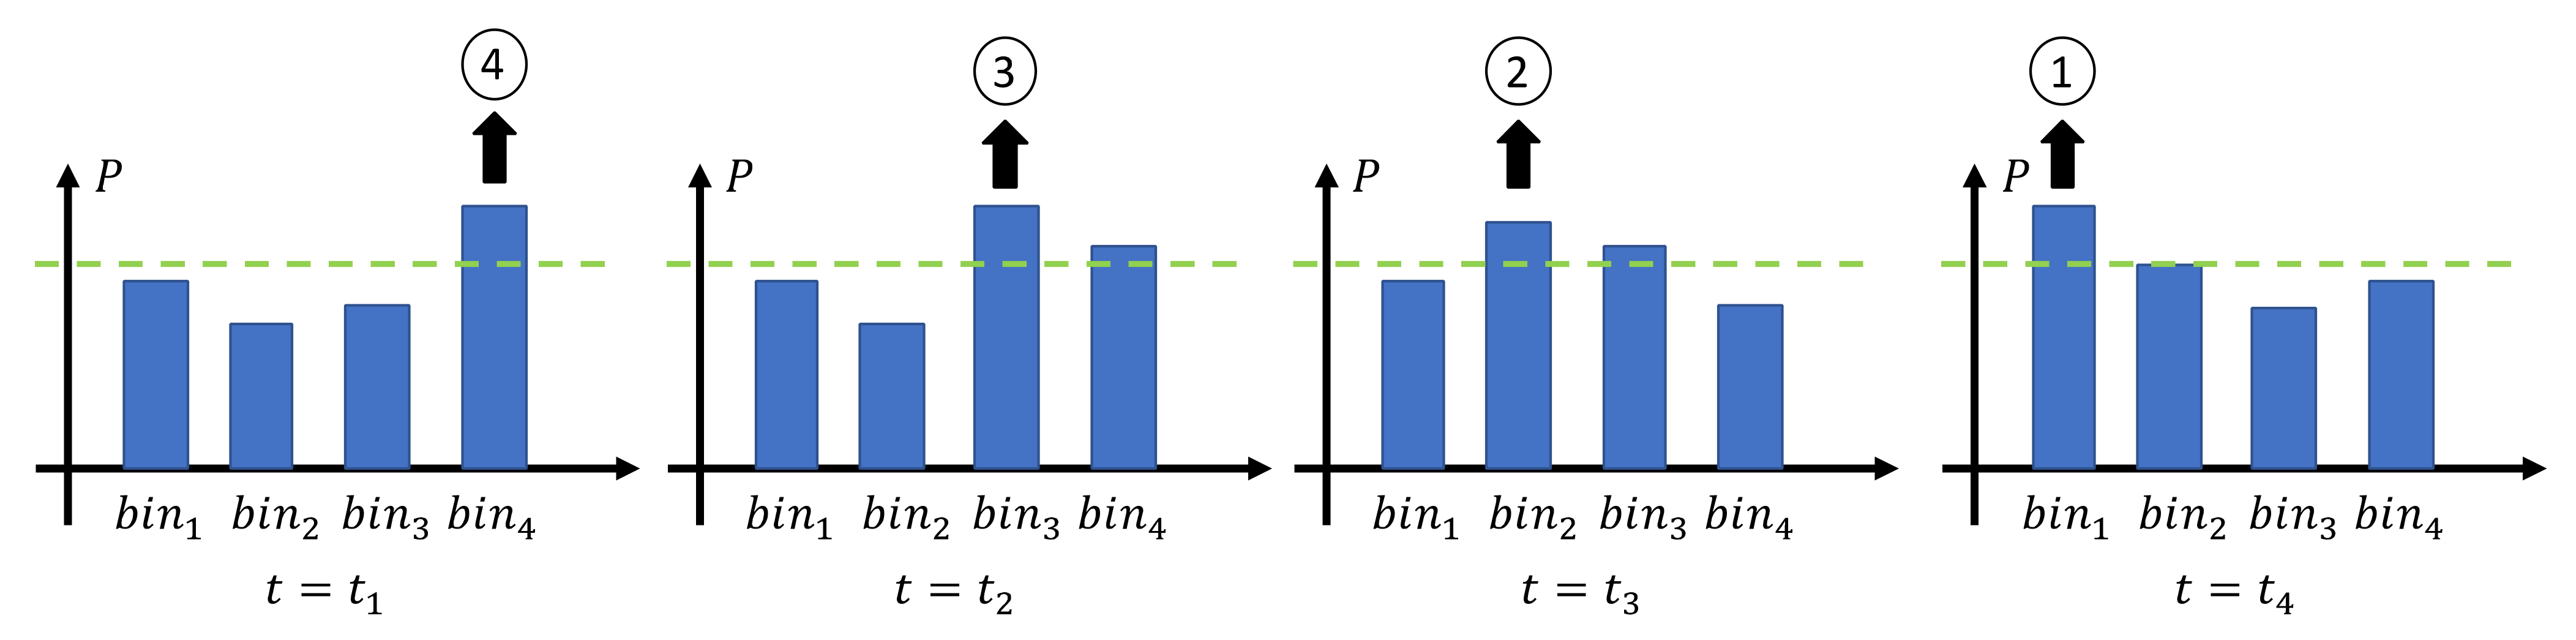
An 8 × 8 IR sensor array has 64 thermopile elements in an 8 × 8 grid format. The developed algorithm detects the passage of a person generating a numeric sequence (pattern) corresponding to the activated energy bins, as described in
Section 3. For example, the complete passage from left to right generates a sequence of 012340.
Depending on the generated numeric pattern, the algorithm transforms the initial value in “I,” “O,” and “H,” which corresponds, respectively, to “Input,” “Output,” and “Hold.” The algorithm performs the counting of the persons present within an environment exploiting the pattern recognition approach.
The experimentation and validation for the IR sensor set-up were carried out in three phases. In the first phase, the acquisition of thermal images for the user’s passage was performed to obtain a set of offline calibration measures of the pattern recognition algorithm. The verification of the functionality of the pattern recognition algorithm in real-time and offline was performed in the second phase. Finally, the third phase concerned simulating a realistic human passage and assessing the algorithm in a normal environment.
5.1. Acquisition of Thermal Images for Algorithm Calibration
In this phase, experimentation involved four individuals who were asked to repeat all the passages (
Table 5) under the doorways to capture thermal images. For each experiment, the total time for all these passages (entering and exiting a room several times) has been recorded (
Table 6). The sensor was installed at 2.30 m (m) in height, with the acquisition window facing downwards, and placed at the entrance of the environment in the crossbeam of the door opening (
Figure 7).
The acquisition of frames was activated by using wireless control, and the measurements were saved to a micro-SD card in the text format file. The actions described in the pattern in
Table 5 were performed by each user. Data processing was conducted on a personal computer to calibrate the offline algorithm parameters of pattern recognition. In
Table 6, we report the height and duration of experimentation for each user. Each test involved the acquisition of the matrices, consisting of 8 × 8 values of temperature (where each matrix corresponds to one frame), with the maximum speed permitted by the microcontroller and saving them to a text file.
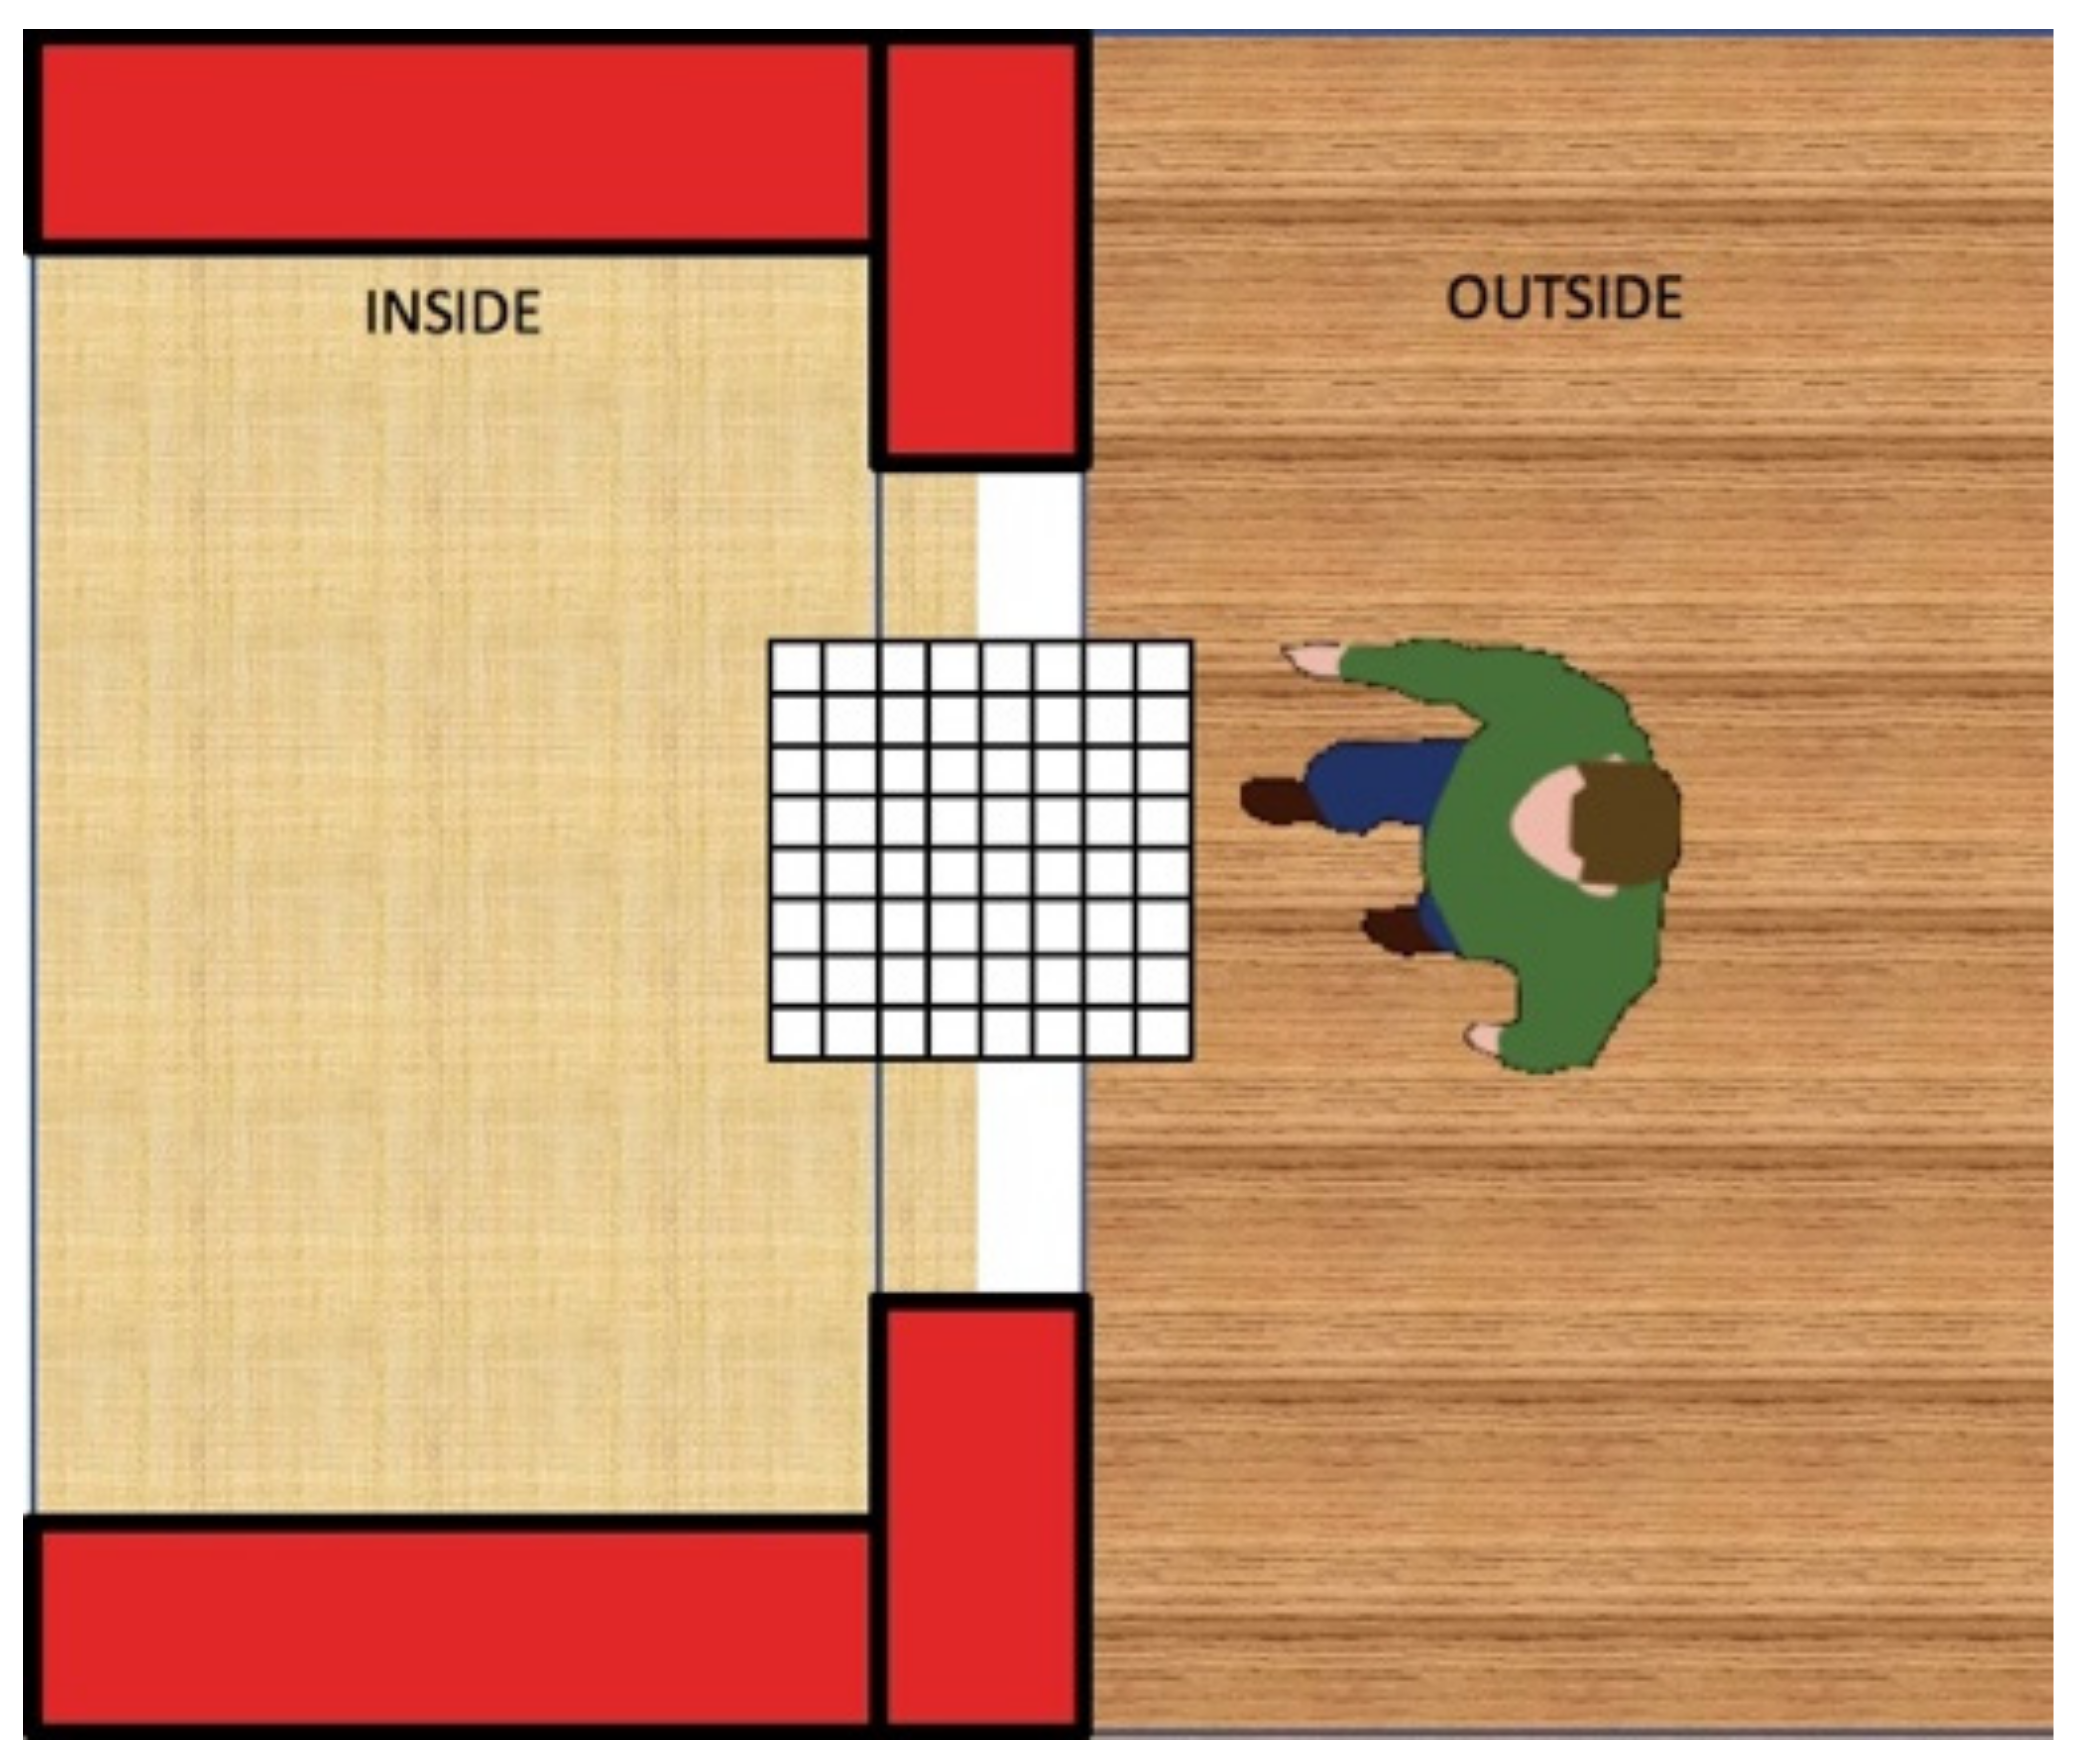
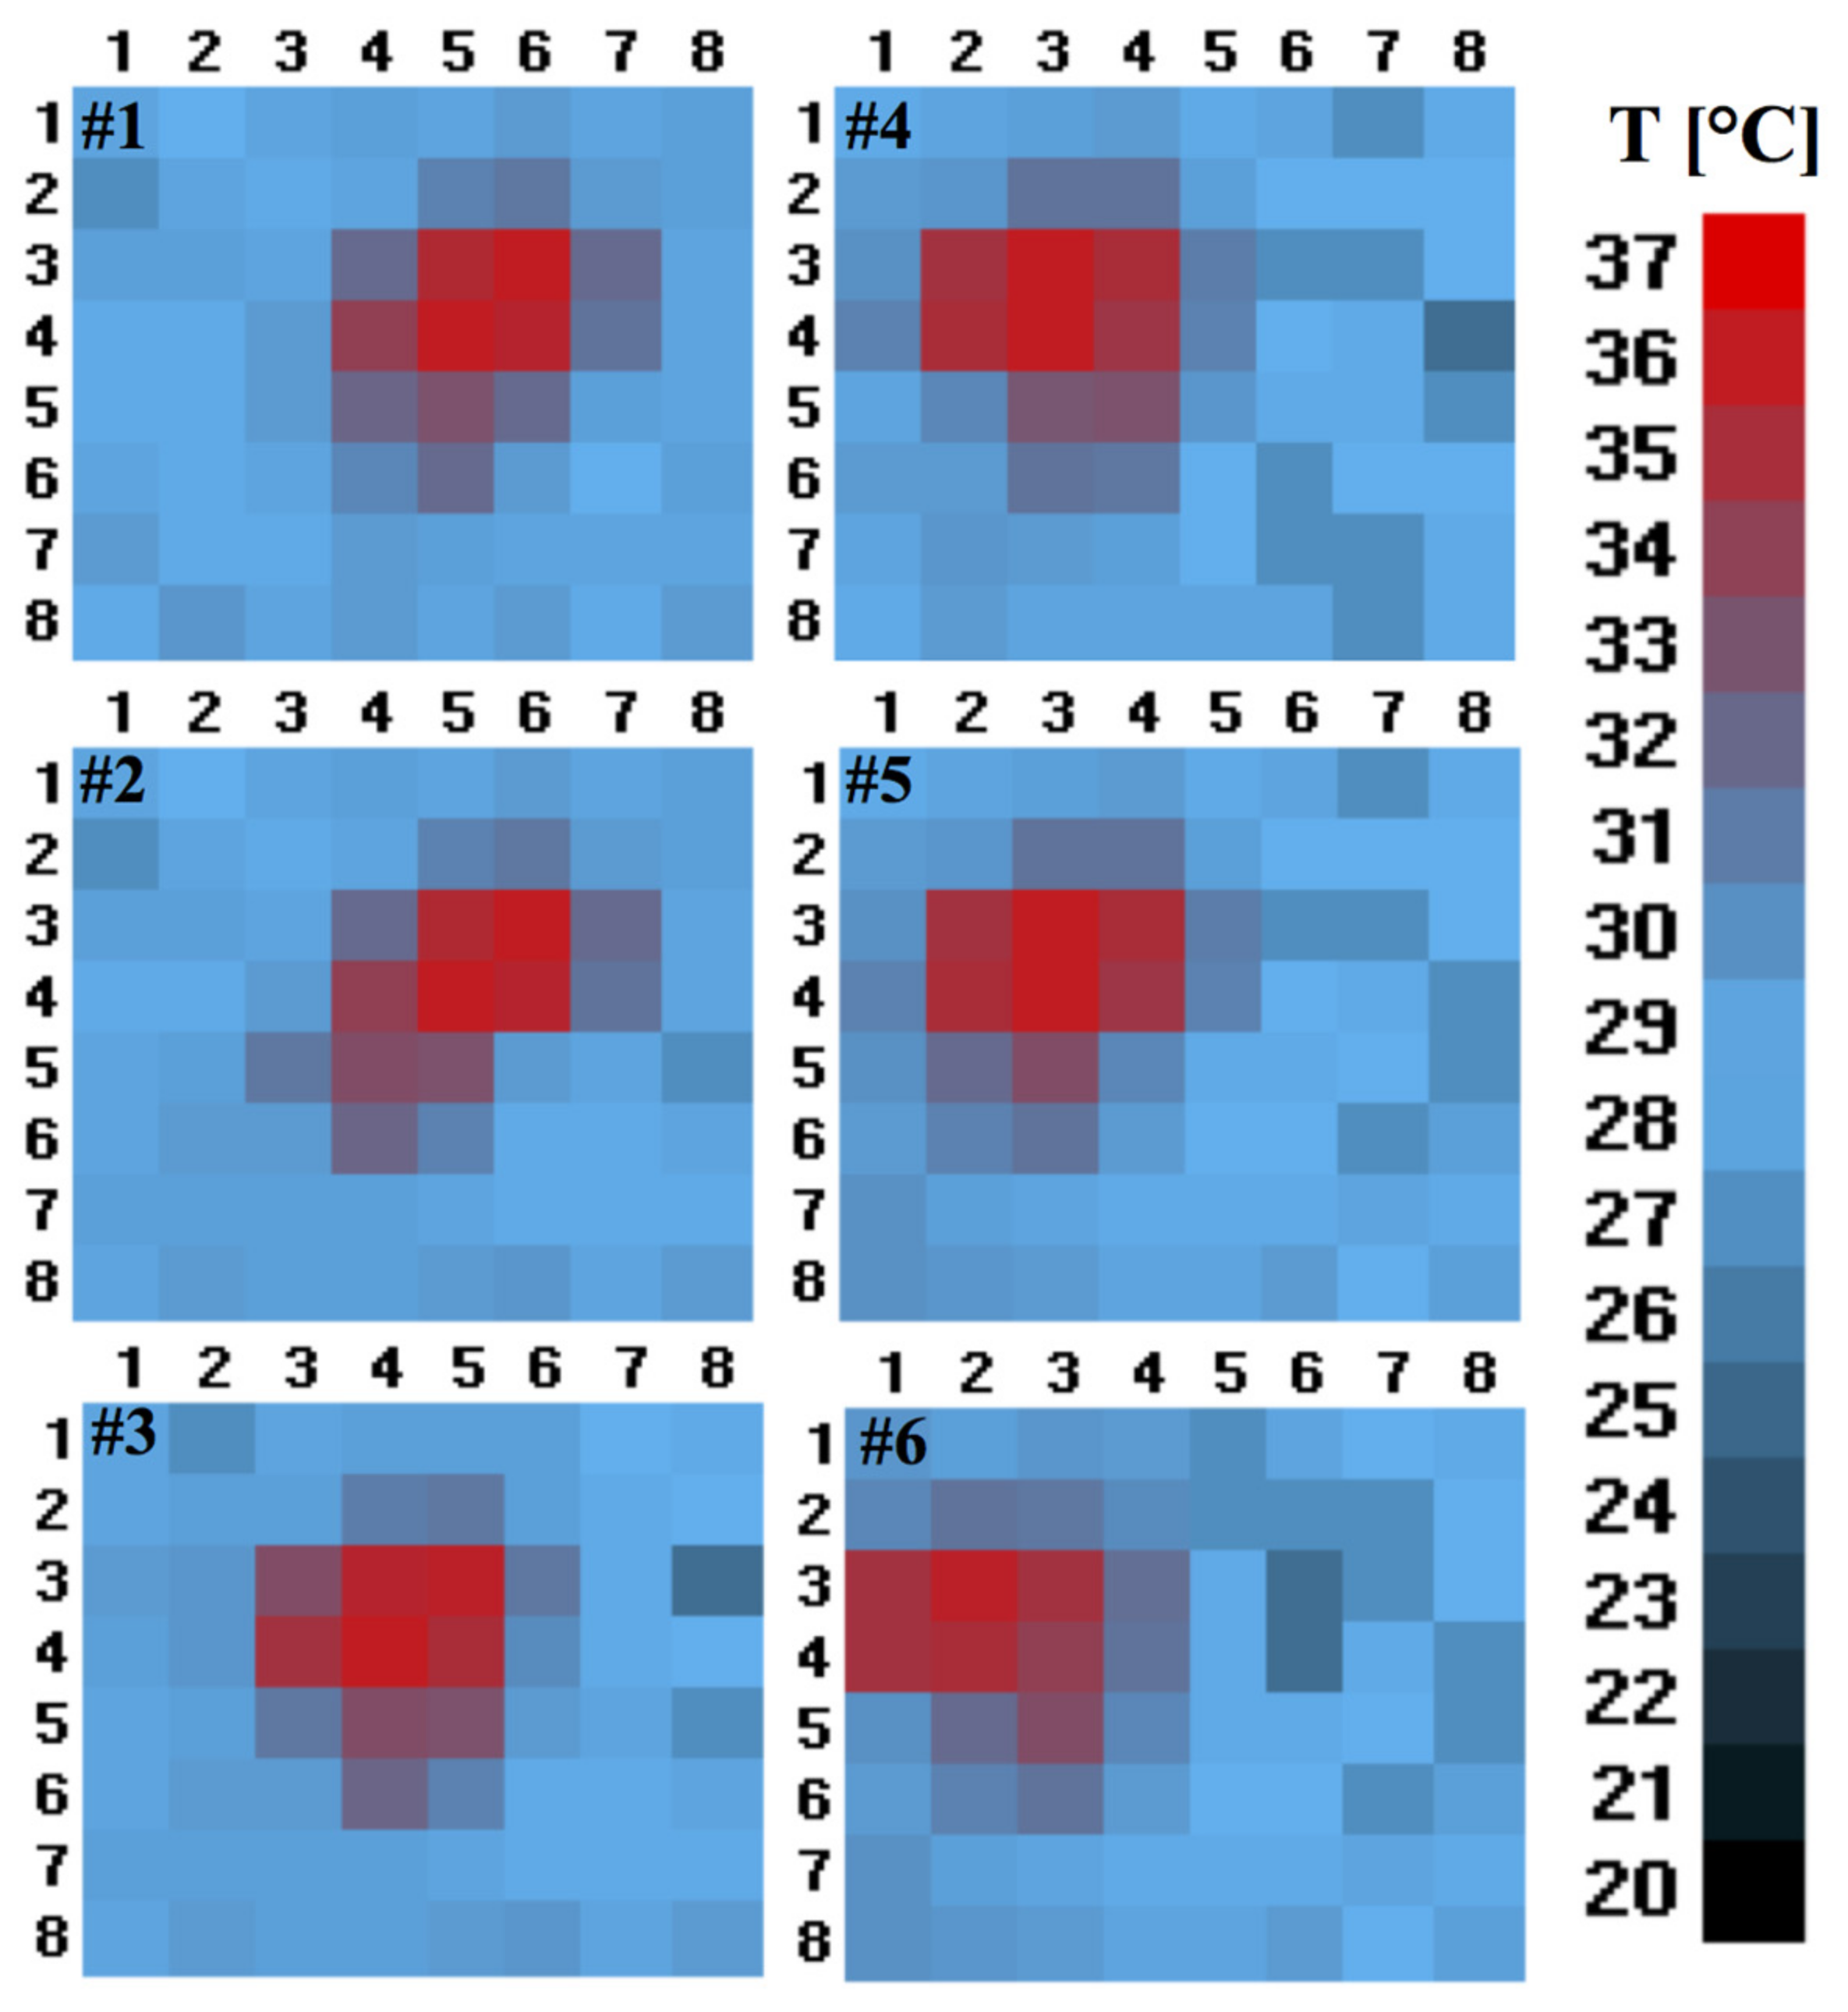
In the detected thermal image shown in
Figure 8, the coloured pattern represents the user’s entry/exit from the outside to inside, or vice versa, captured by the proposed system.
5.2. Validation of Proper Functioning of the Developed Pattern Recognition Algorithm
The second phase involved the analysis of data collected during the measurements using Matlab (2018) and C++ programming codes. These implementations have been written relying on Matlab core functions and standard C++ libraries. The pattern recognition algorithm was developed, and its functionality was tested using the data collected from experiments. Subsequently, optimization of the algorithm parameters was conducted on the set of obtained measurements. The optimization consisted of the identification of minimum values for the size of the FIFO buffer and for the aperture of the timeout window allowing the correct recognition of the patterns. The developed software was then implemented into the microcontroller present in the proposed architecture. The software was compiled and loaded on the device to verify proper operation.
The device was tested for one month in our laboratory with stable environmental conditions (22–26 °C), reaching full accuracy (100%).
In order to further test the performance of the pattern recognition algorithm, synthetic frame sequences have been generated for simulating temperature ranges typical of a residential environment, different human walking speed (normal, brisk, running), and different distances between the person and the sensor (1.5 m, 5 m, and 7.5 m). Two categories of tests were performed: (i) using a step and (ii) using a ramp.
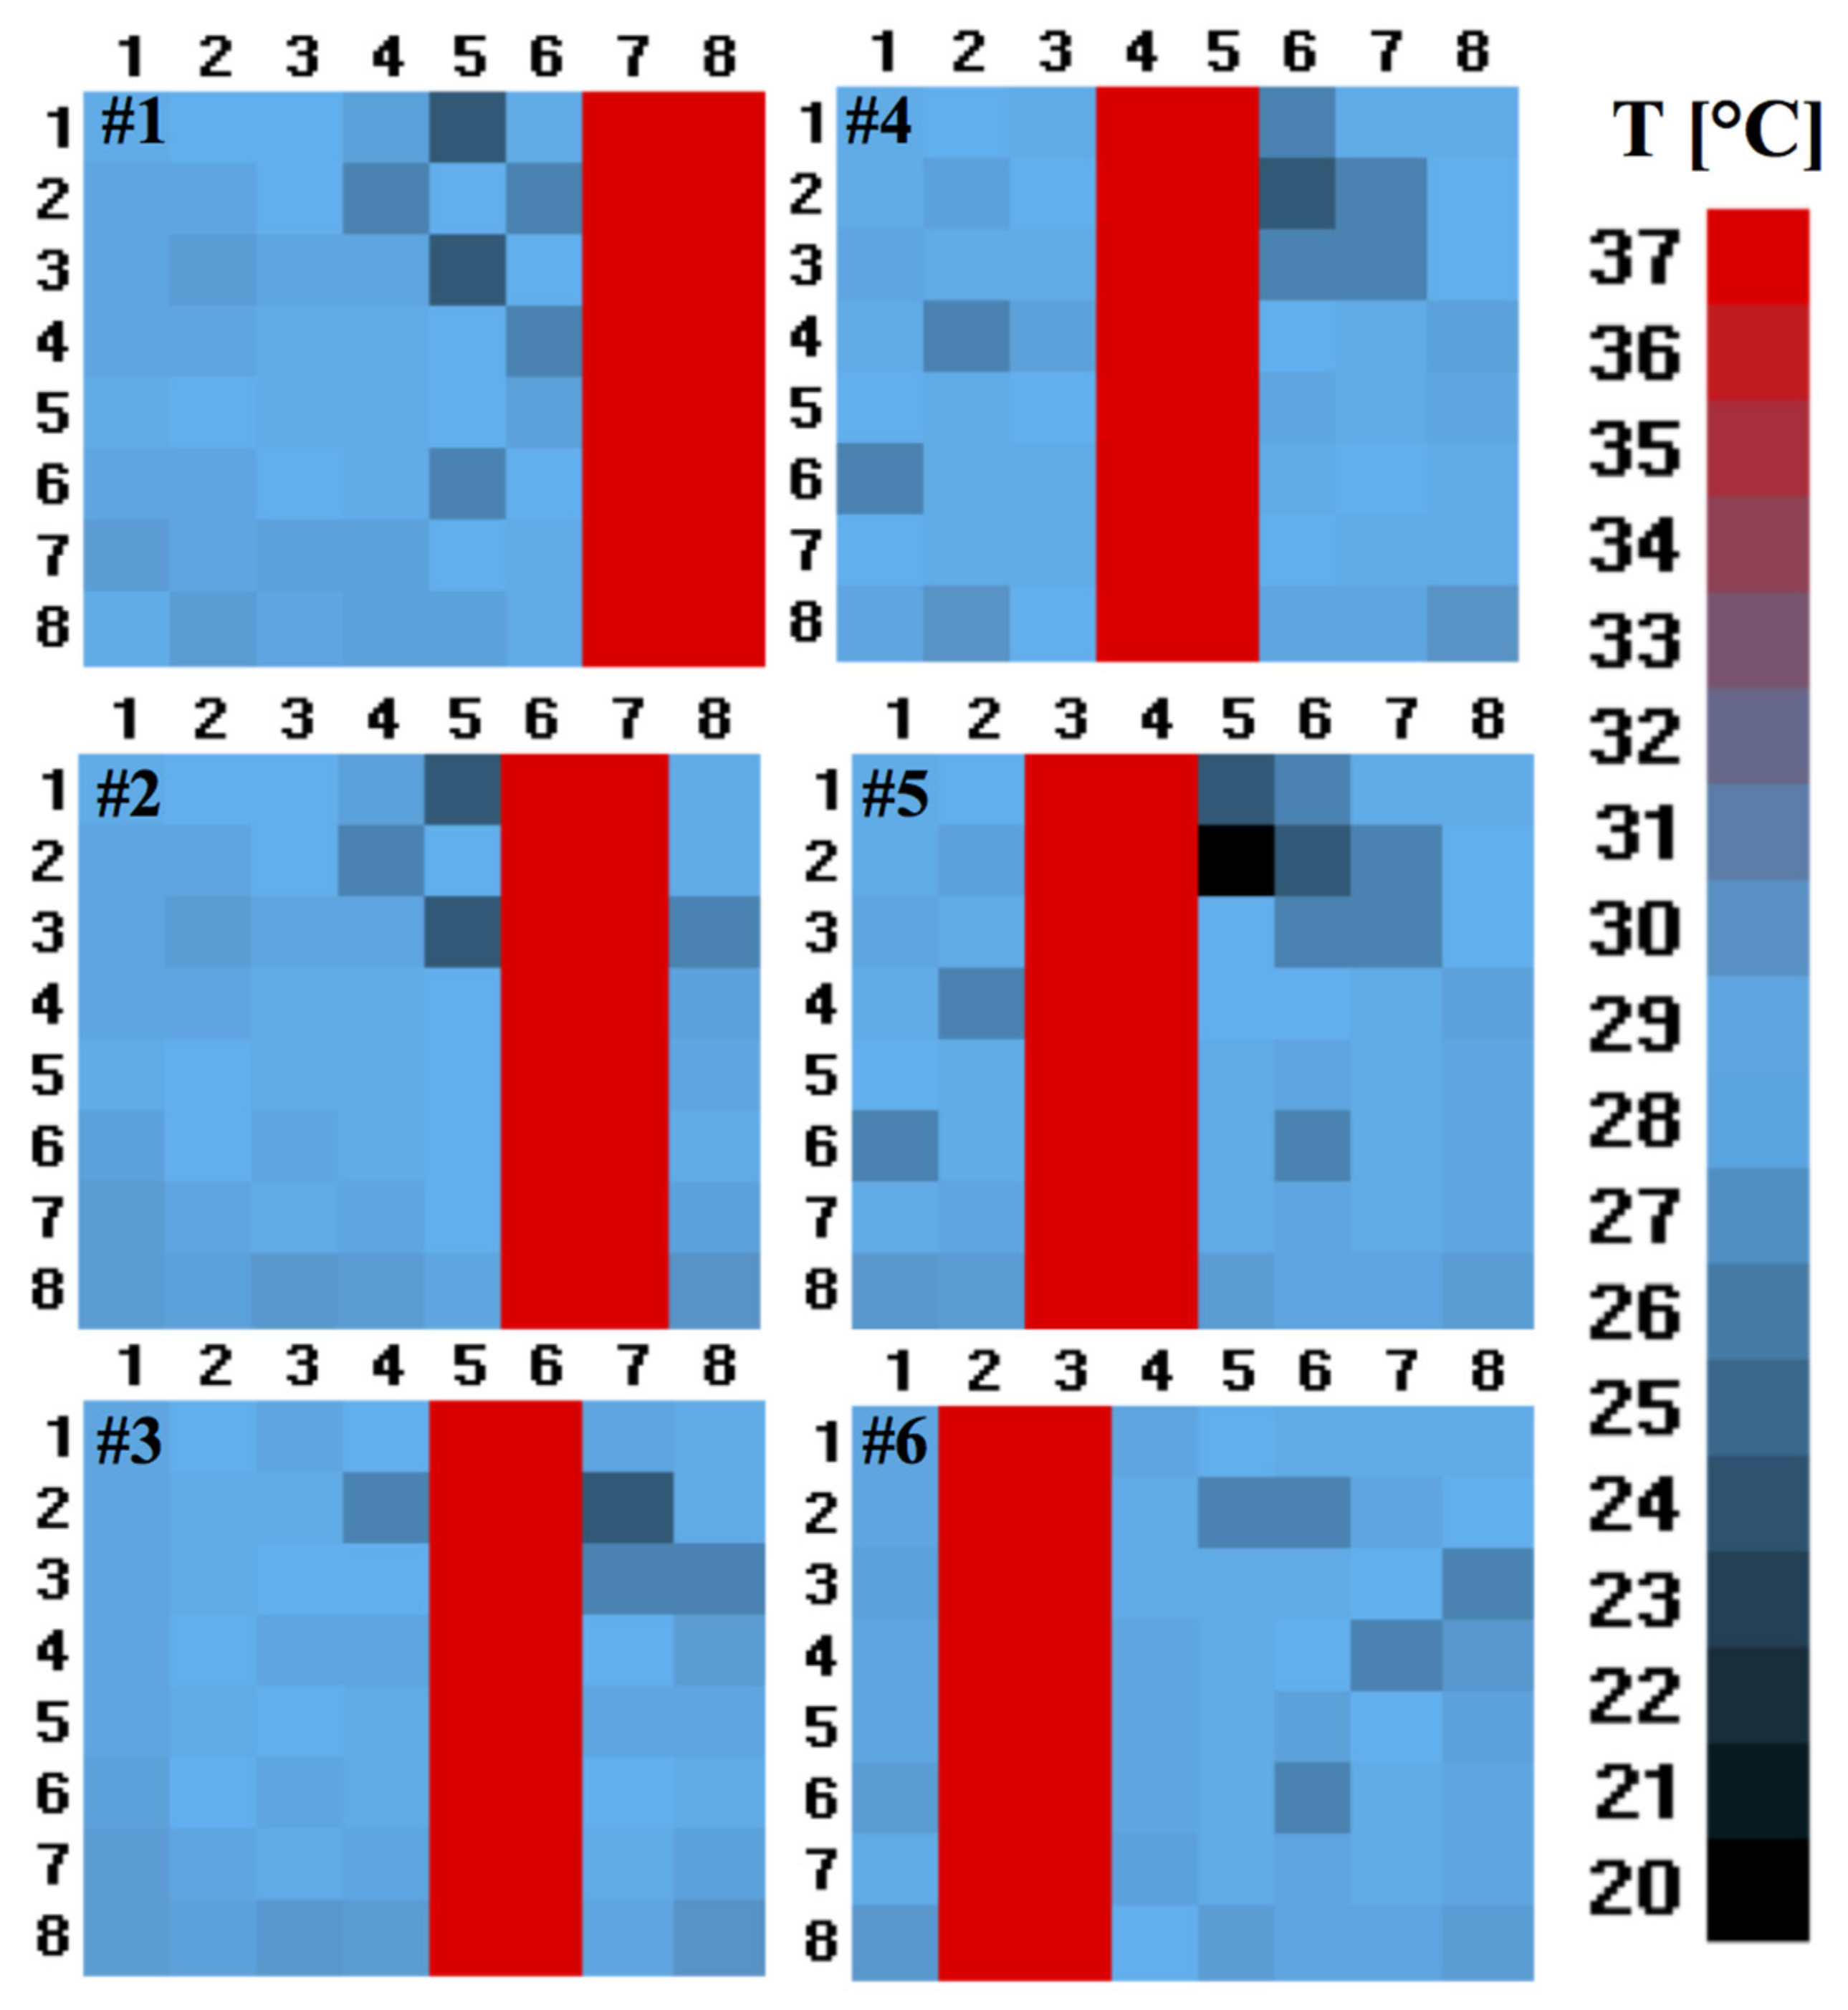
The perturbations with a temperature value of 37 °C were introduced into a part of the matrix elements (from right to left direction) of the 8 × 8 matrix, representing the ambient temperature as a base disturbance distribution. The two tests are described below.
Step test. The data collected in phase one was used to perform this test. The data consisted of a set of frames of 8 × 8 temperature values, representing different passages of a person below the sensor. The sequence of the actions are as follows: I, O, I, O, IHO, I, O, I, O, I, O, I, and OHI (see
Table 3, for description).
The objective of this test was to verify the algorithm’s response to the predetermined inputs set at different levels of ambient conditions and the perturbation of temperature. A step is a temperature perturbation that consists of an 8 × 1 temperature vector that slides in the right to left direction, which was then subsequently replaced by an 8 × 2 temperature matrix. For completeness, an image representing the perturbation movement (constituted by the 8 × 2 matrix) is shown in
Figure 9.
The results obtained from the test highlighted the limits of the algorithm linked to the average values of the ambient temperature and the perturbation value. Precisely, with a temperature perturbation greater than 4 °C, the algorithm detects 100% of the events for ambient temperatures ranging from 21 to 31 °C. In contrast, no passage was detected with a perturbation value of less than 4 °C.
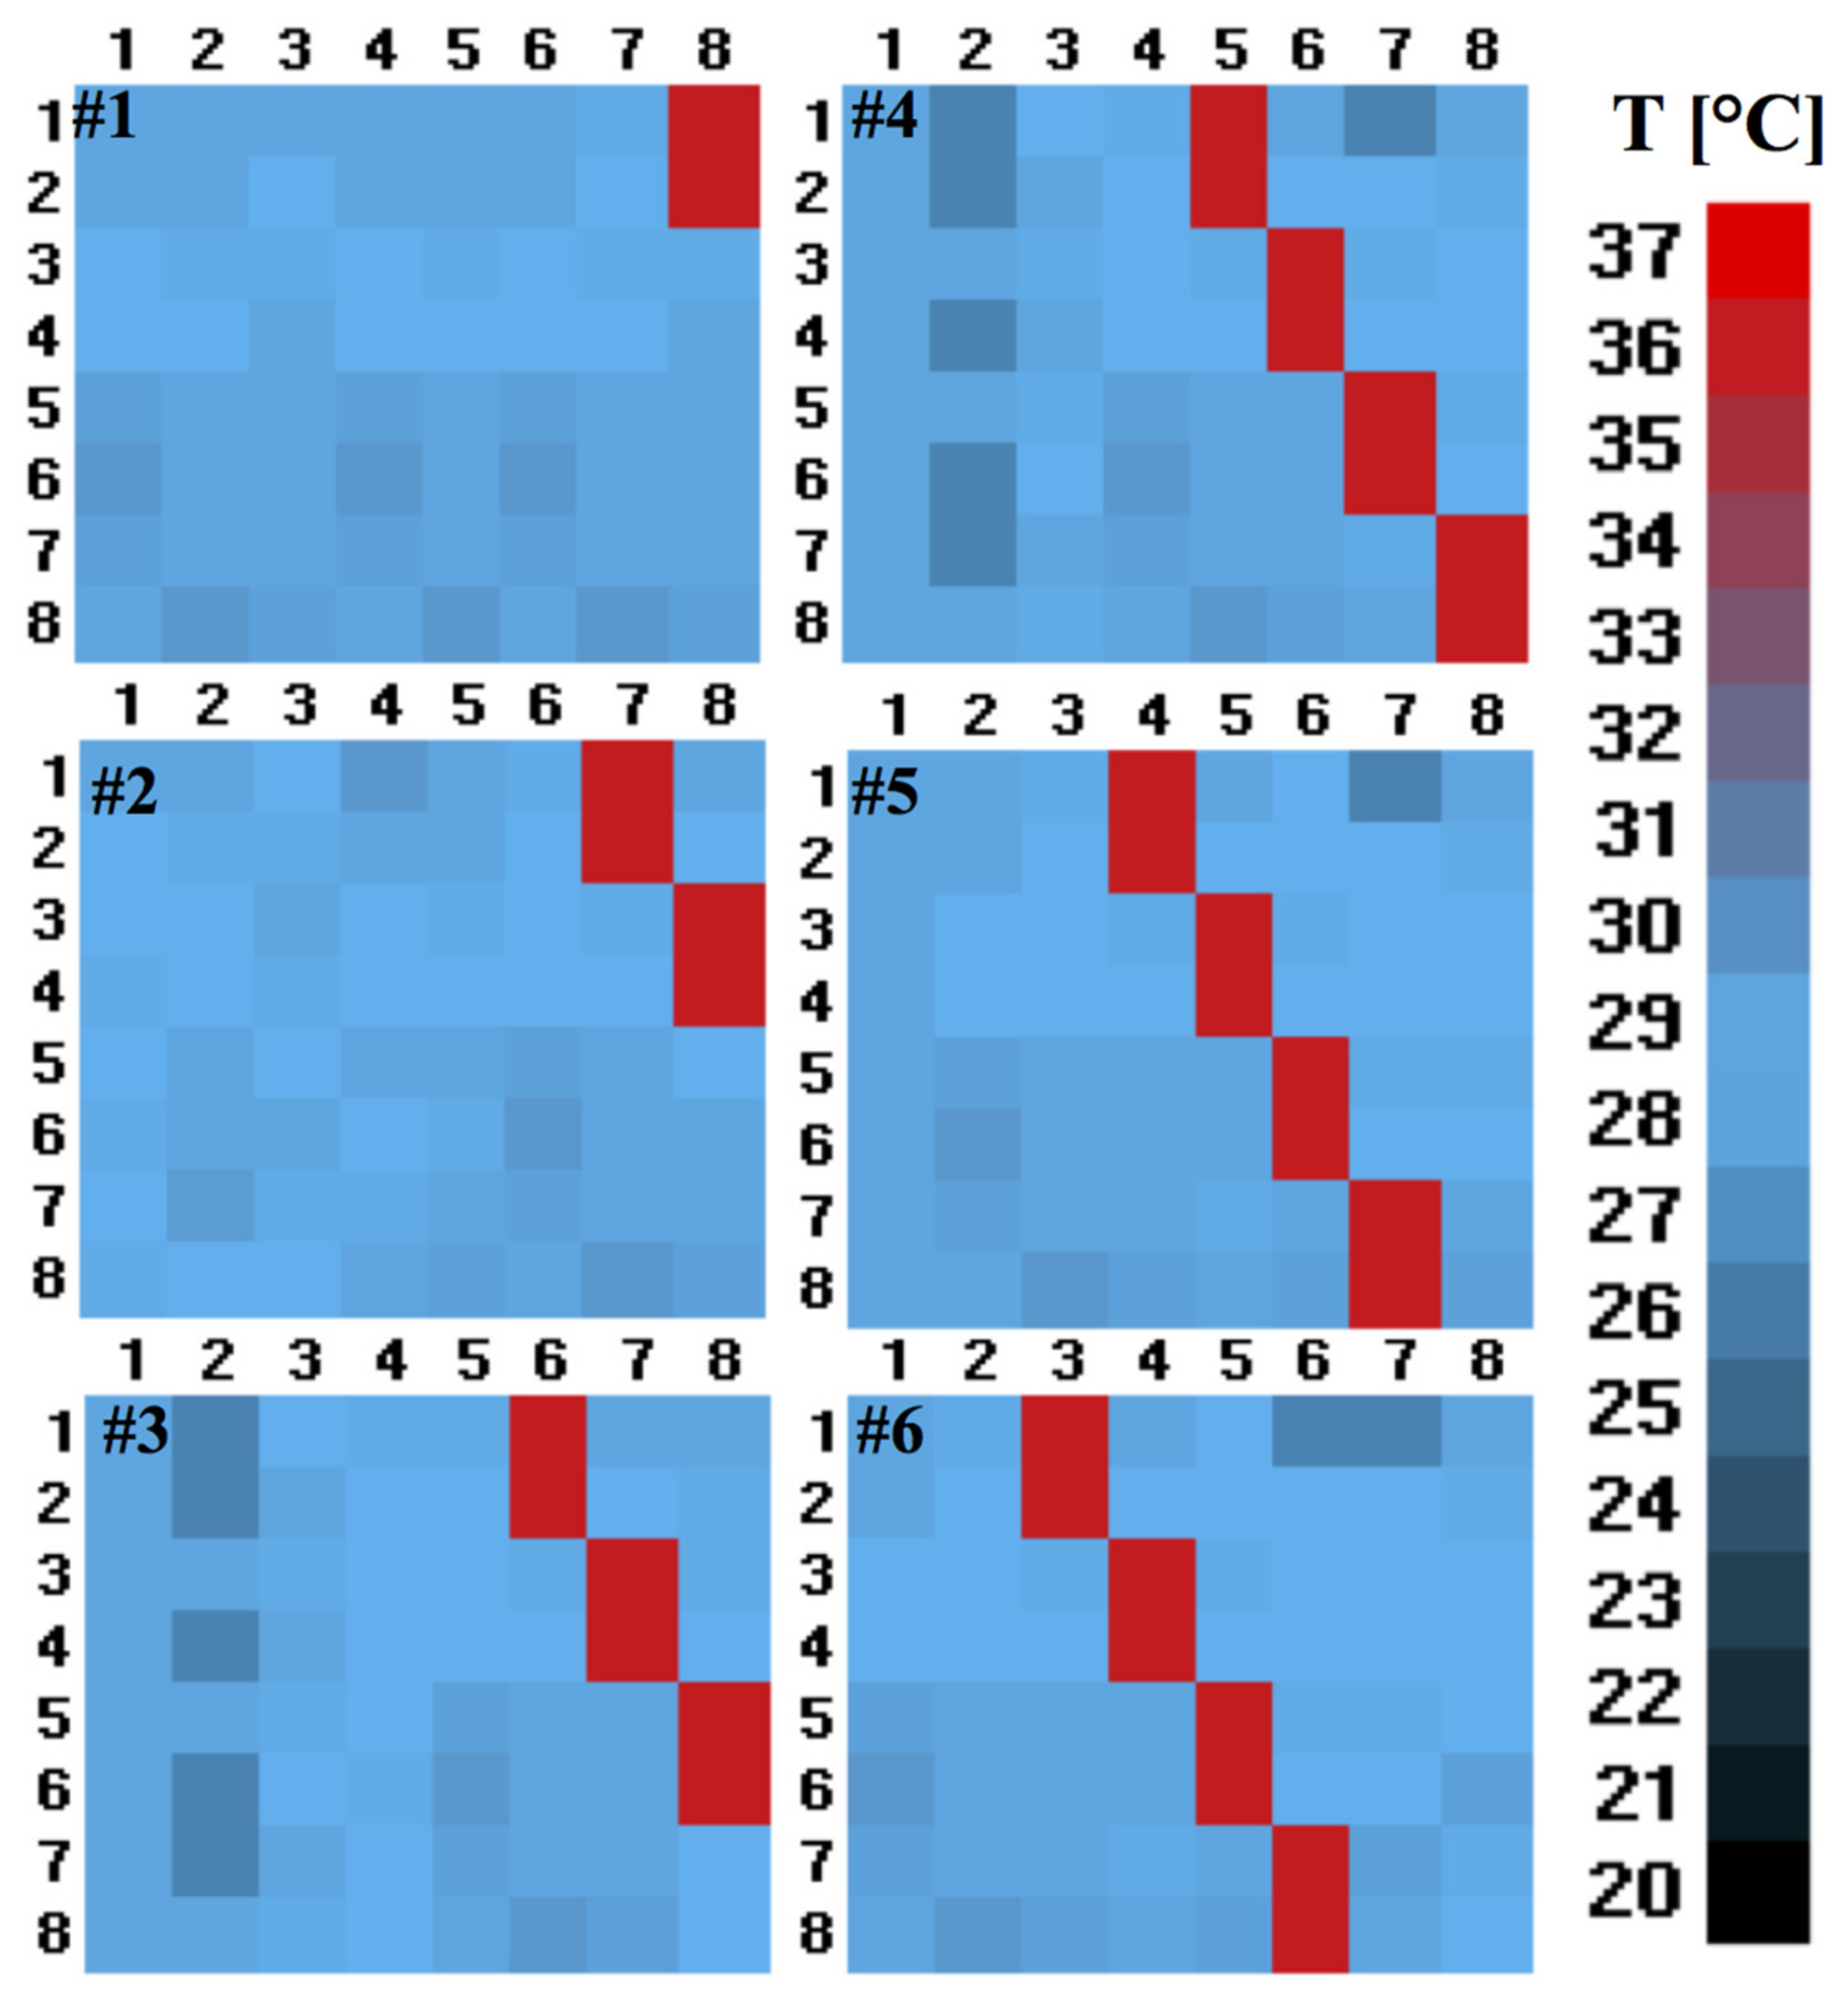
Ramp Test. The data set utilised for the “Ramp test” was similar to the one of the “step test,” but this time changing a single parameter, i.e., the number of frames. The test was conducted with 44, 31, and 21 frames, representing normal, brisk, and running human speeds. A ramp is a temperature perturbation that consists of a diagonal vector. A representative illustration of the “Ramp test” with six frames, and the ramp (shown in red) moving inside the 8 × 8 array from right to left direction, is shown in
Figure 10.
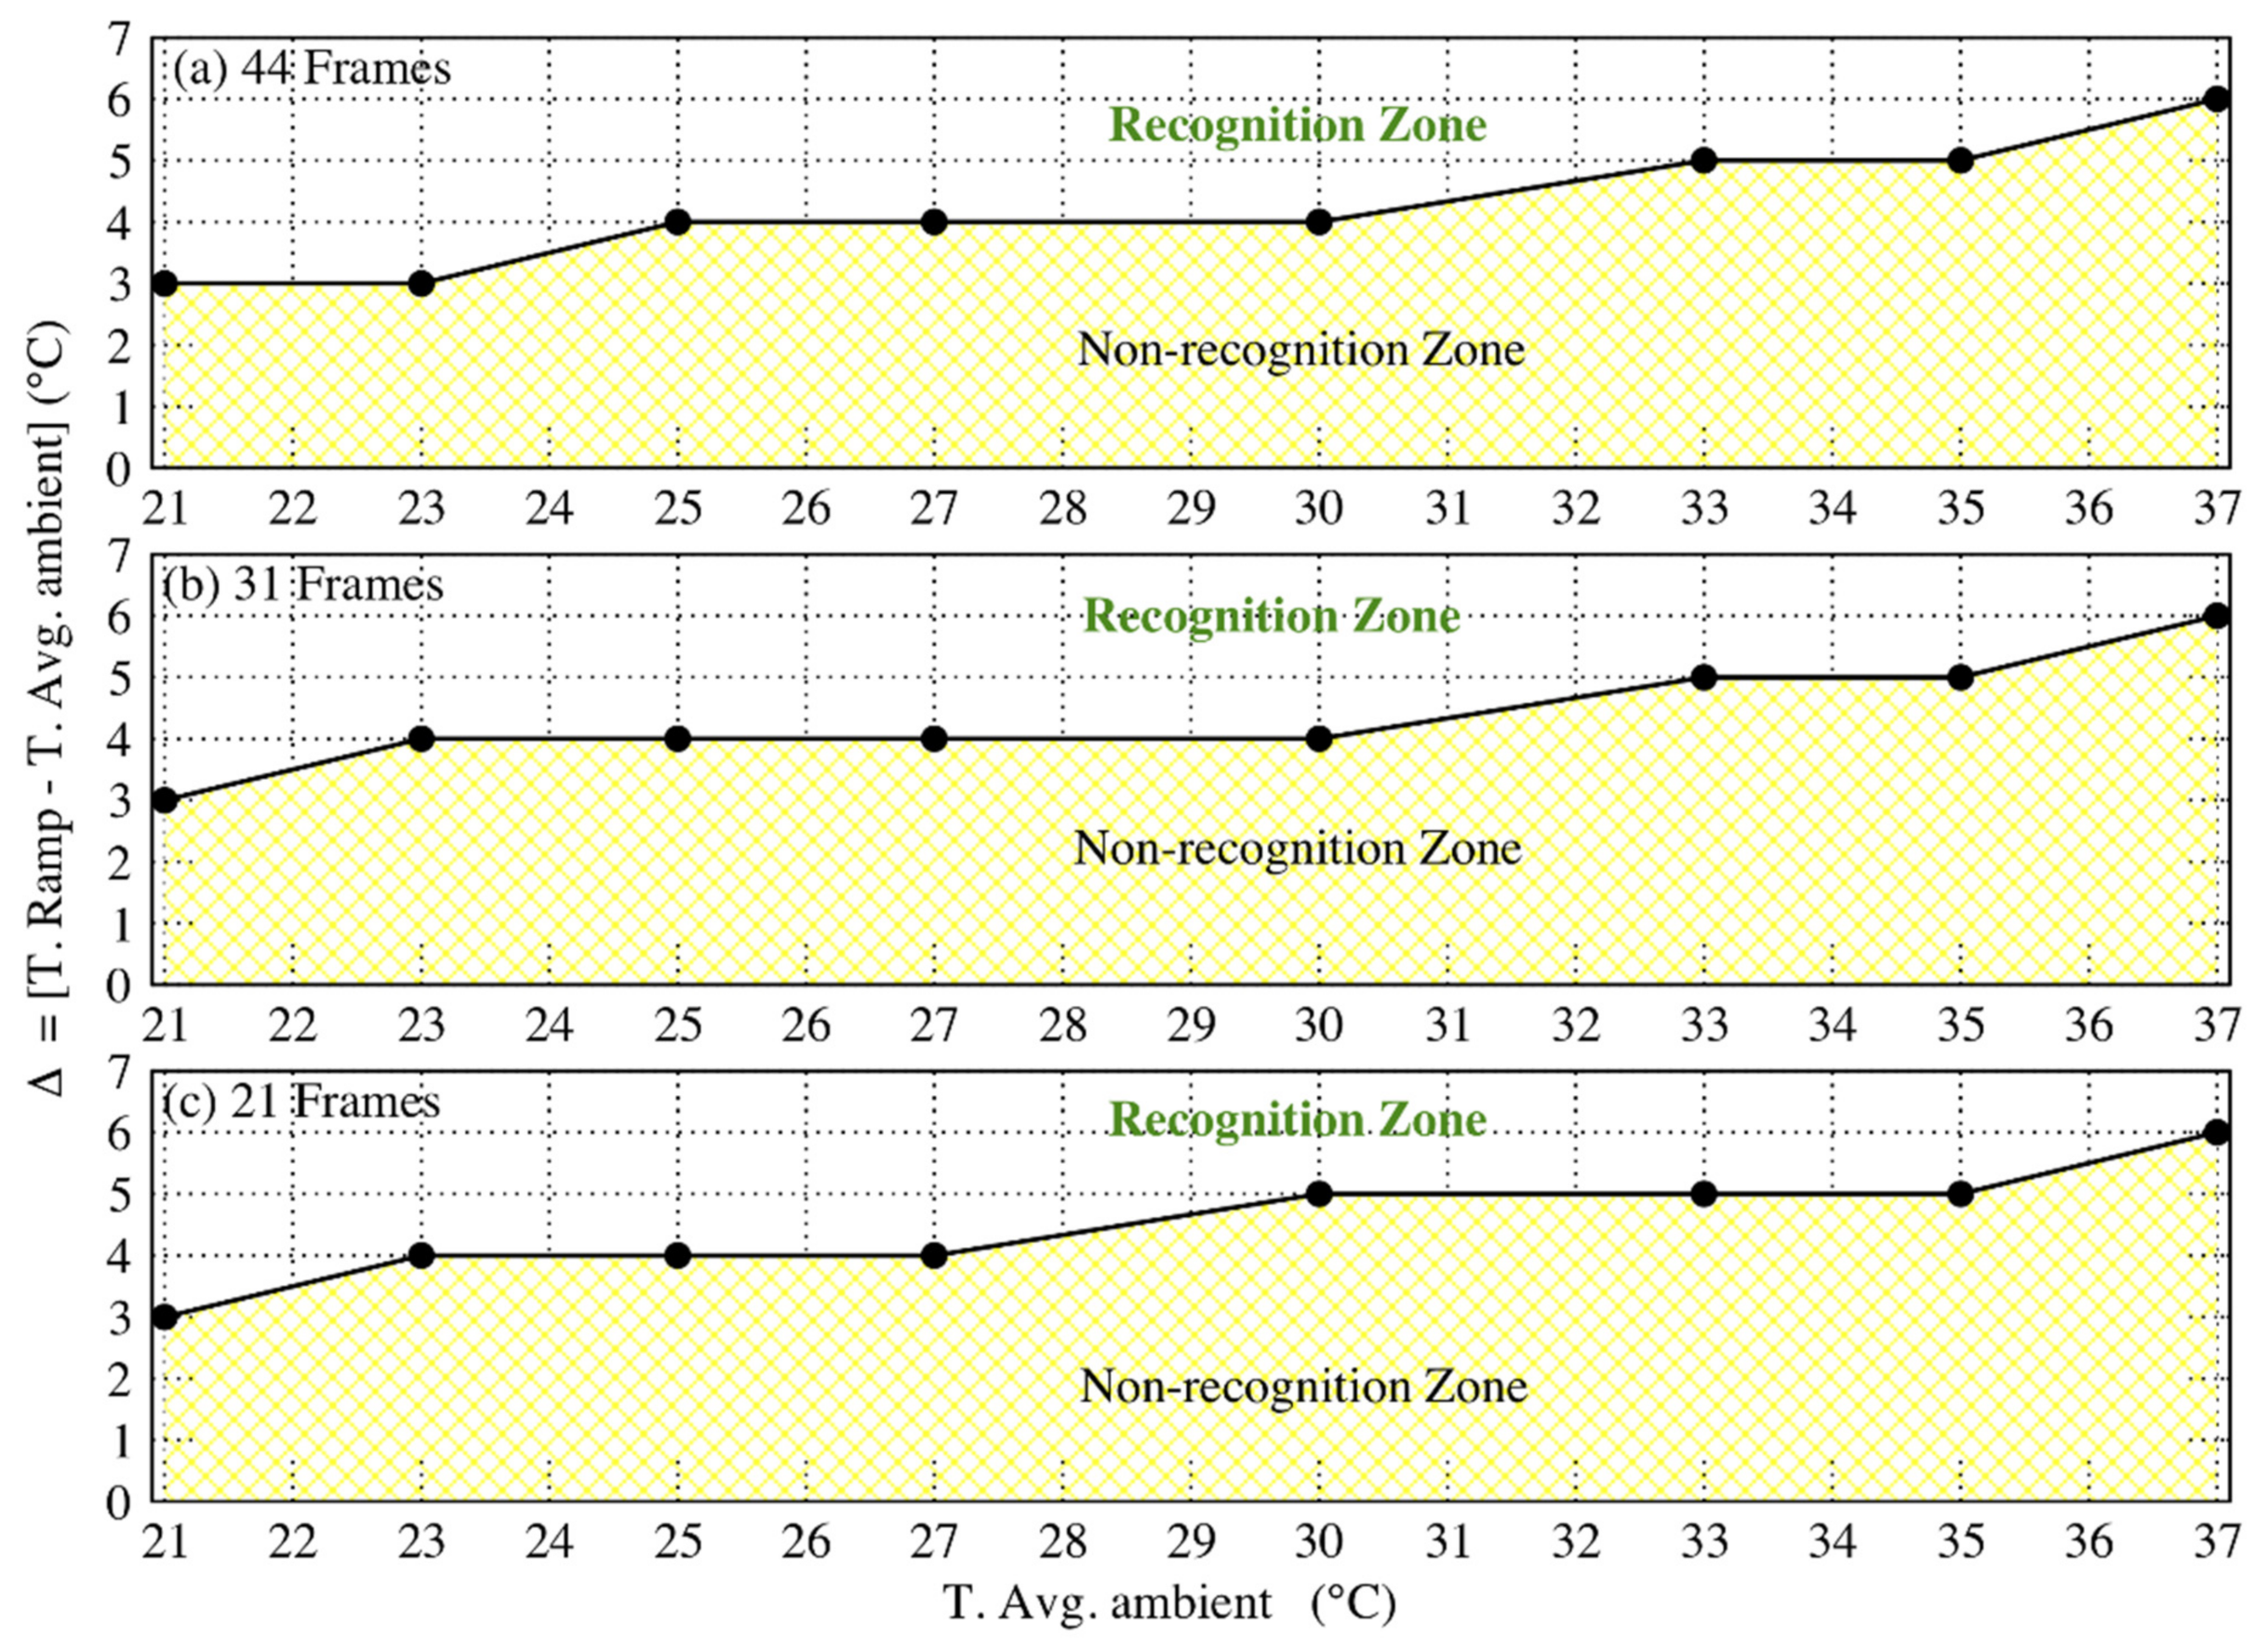
From the obtained results, we could establish that the limitations of the algorithm are strongly related to the average values of the ambient temperature and to the perturbation values. More precisely, we calculated delta (Δ) that represents the difference in temperature between the ramp and the average ambient condition. In
Figure 11, we present the graph describing the variation of Δ as a function of the average ambient temperature for three different frame numbers. It is evident from
Figure 11 that the algorithm can detect an event only for values greater than the minimum Δ value, specific to the average ambient temperature value. For instance, considering the event with 44 frames (
Figure 11a), an average ambient temperature of 27 °C, and a ramp value of 34 °C, the value of Δ is then 6 °C, which is greater than the minimum Δ value (4 °C) required for recognition. Hence, this event is detected by the algorithm.
5.3. The Random Test
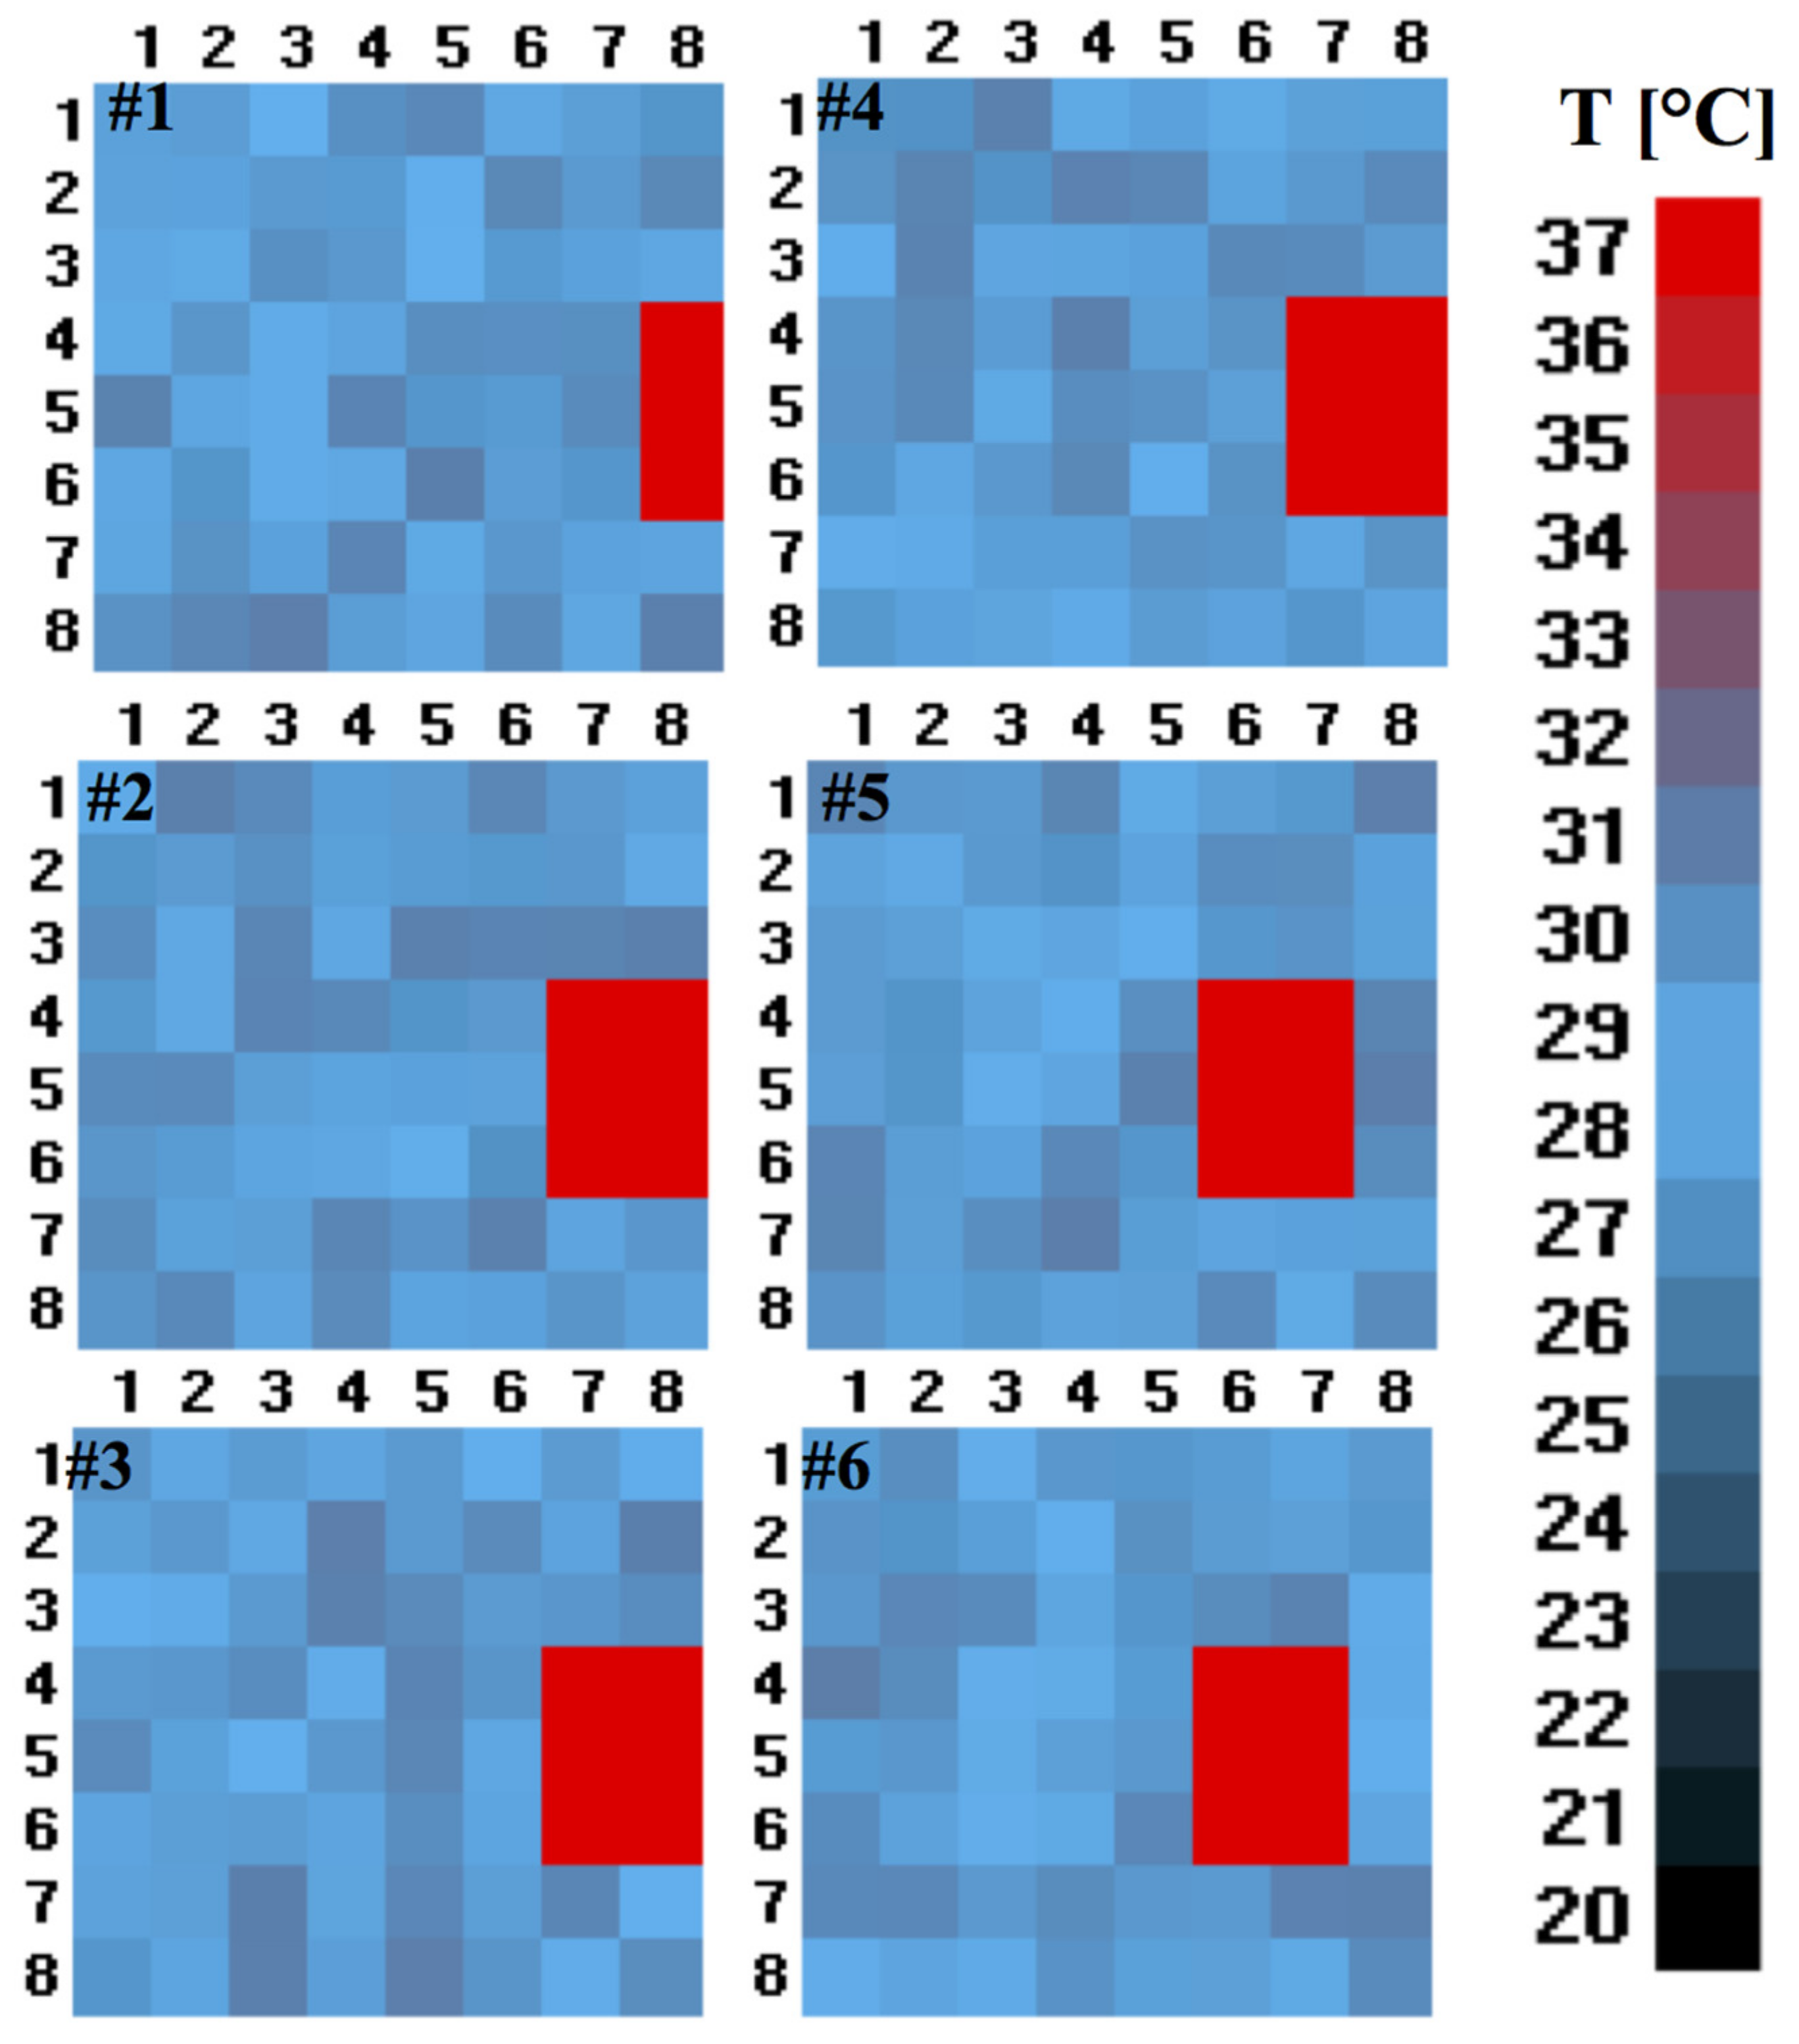
Our objective here was to simulate a realistic human passage and finally to assess the algorithm in a natural environment. To do so, we performed a random uniform distribution test by choosing the number of frames representing the normal (44 frames), brisk (31 frames), and running (21 frames) pace of a person. In detail, simulating the normal walking speed consisted of 5 empty initial frames (representing no passage), 34 frames with the passage at a set temperature and distance, and empty 5 terminal frames, in total 44 frames (5 + 34 + 5). In a similar way, the frames corresponding to a brisk (31 frames = 3 + 25 + 3) and a running pace (21 frames = 2 + 17 + 2) were chosen. The simulation of human presence consists of an image of 9 pixels (3 × 3), 6 pixels (3 × 2), and 2 pixels (2 × 1) at a temperature of 37 °C (some examples of these images are the red rectangles in
Figure 12), representing, respectively, a distance of approximately 1.5 m (9 pixels, 9P), 5 m (6 pixels, 6P), and 7.5 m (2 pixels, 2P) between the sensor and the person crossing the passage.
The peculiarity of this type of test is that the frames were created using synthetic images, and the temperature values followed a uniform distribution within a precise temperature range. The selected ranges were: 18–22 °C, 22–26 °C, 26–30 °C, 30–34 °C, and 30–38 °C, typical temperatures present inside residential buildings with and without air conditioning systems. All these tests were repeated ten times and with four different user movement patterns: Input (I), Output (O), Input-Hold-Output (IHO), and Output-Hold-Input (OHI). In
Figure 12, an illustration of a person at 5 m from the sensor (represented with 6 pixels) is shown. The different colour shades of pixels correspond to different temperature values.
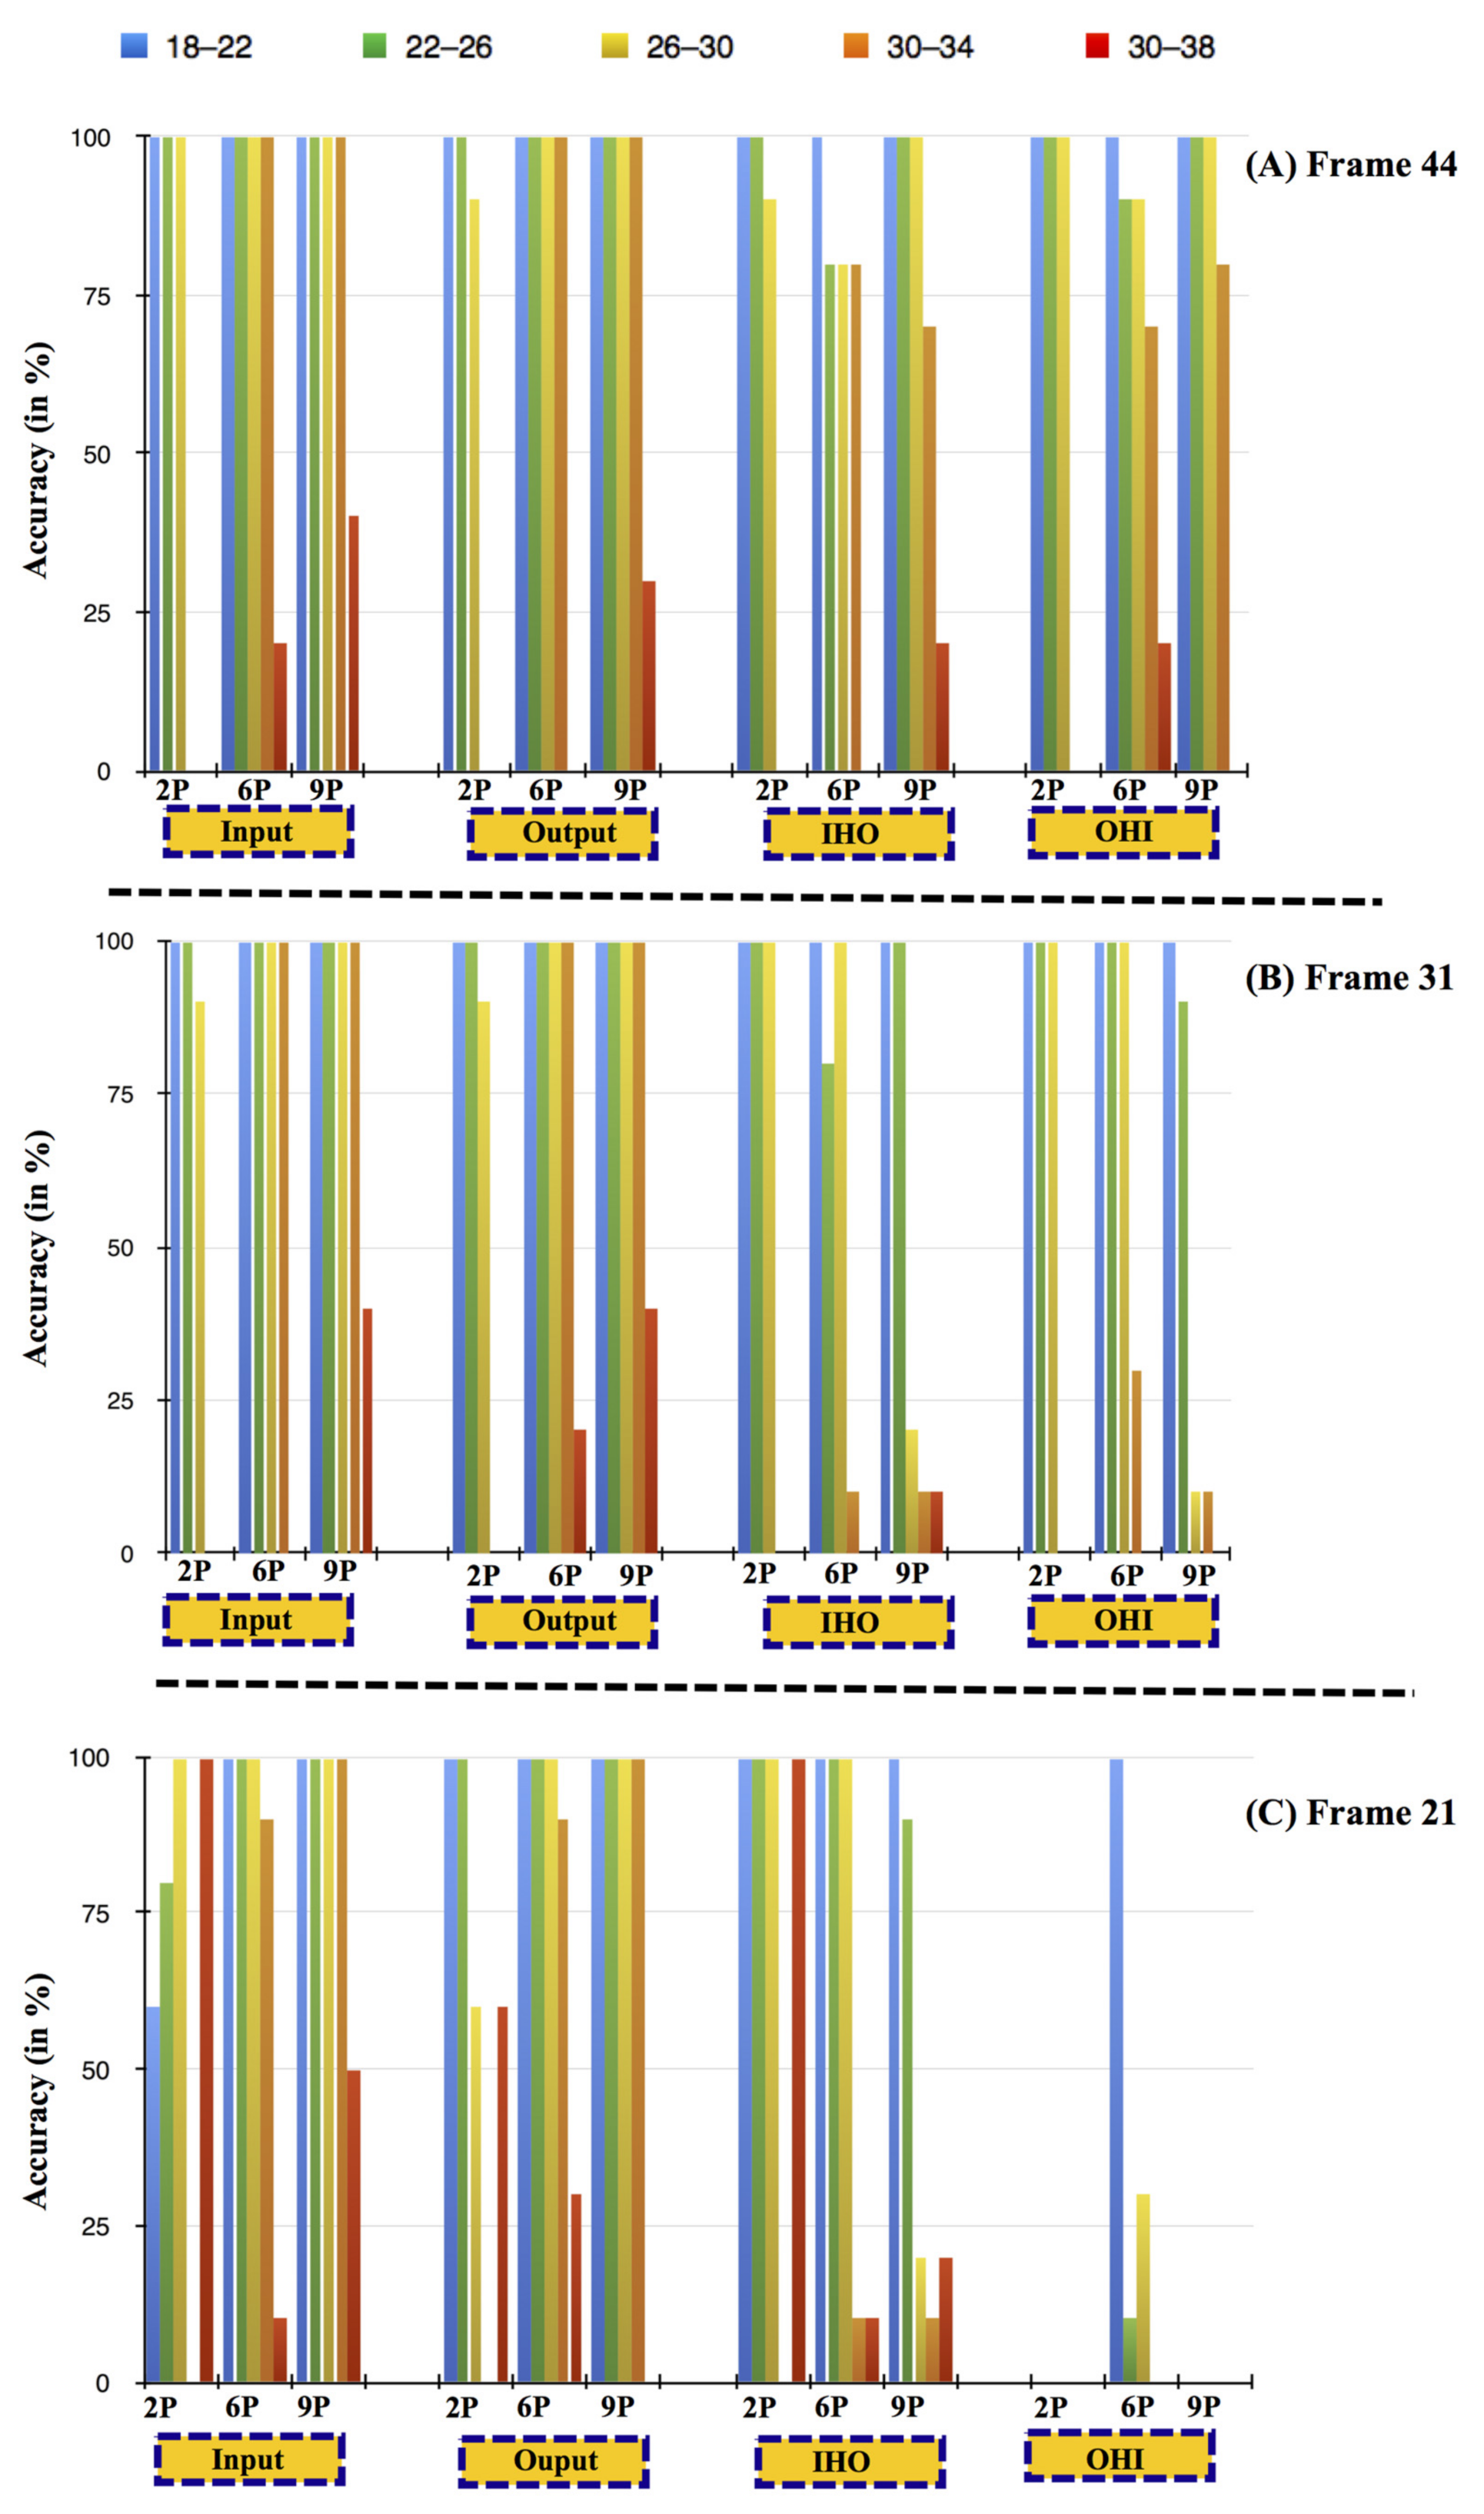
Figure 13 shows the algorithm’s accuracy considering four distinct human passage movement for the selected temperature ranges.
For an average walking speed (44 Frames,
Figure 13a), independent of the distance from the sensor, the average detection accuracy of the algorithm is 95% (considering all four movements and for the ambient temperature ranges up to 30 °C). However, at higher temperature ranges (30–34 and 30–38 °C), the accuracy of the algorithm gradually decreases with the human distance from the sensor.
For brisk walking speed (31 Frames,
Figure 13b), the algorithm’s accuracy is 90% or more for the ambient temperature up to 26 °C, independent of the number of pixels. If we consider only two main movements (Input, Output), the accuracy is 90% or more up to 30 °C ambient conditions. Moreover, for high-temperature ranges (30–34 and 30–38 °C), no detection (0% algorithm accuracy) of movements at approximate distances of 7.5 m from the sensor was observed, similar to the case of 44 Frames (average walking speed).
For running pace (21 Frames,
Figure 13c), considering only the two main movements (Input, Output), the accuracy of the algorithm is 60% or more up to an ambient temperature range of 30 °C. The performance of the algorithm accuracy decreases as the human distance from the sensor increases. At a ~7.5 m distance from the sensor and at 30–34 °C, the algorithm was insensitive to any movement.
In summary, the accuracy of the algorithm was found to decrease in the three cases:
- -
With an increase in walking speed. Given the fixed and small number of samples per second captured by the sensor, high walking speed will reduce the number of sensor elements activated and from the algorithmic point of view, the information available for discriminating between variations due to the passage under the gate or variations due to environmental thermal noise.
- -
With an increase in the user’s distance from the sensor. Given the fixed resolution of the sensor, if the subject is in the proximity of the sensor, more sensor elements will be activated in comparison with a subject far from the sensor that will have an impact on fewer sensor elements. Hence, if the user is far from the sensor, then the algorithm has less information for discriminating between variations due to the presence of a user under the gate or variations due to environmental thermal noise.
- -
At temperature ranges above 30 °C. As the ambient temperature increases becoming comparable with user temperature, the algorithm has less information for discriminating between variations due to the presence of a user under the gate or variations due to environmental thermal noise. However, considering that the application targets indoor monitoring, a normal thermal condition should satisfy thermal people’s comfort, i.e., indoor temperature lower than body temperature.


 ,
, 


