Article

SafeDrive: Hybrid Recommendation System Architecture for Early Safety Predication Using Internet of Vehicles

1
Institute of Consulting and Research Studies, Umm Al-Qura University, Mecca 18135, Saudi Arabia
2
Endicott College of International Studies, Woosong University, Daejeon 300718, Korea
3
Department of Electronics Engineering, Hankuk University of Foreign Studies, Yongin 17035, Korea
*
Author to whom correspondence should be addressed.
Sensors 2021, 21(11), 3893; https://doi.org/10.3390/s21113893
Submission received: 26 February 2021 / Revised: 25 May 2021 / Accepted: 27 May 2021 / Published: 4 June 2021
(This article belongs to the Special Issue Internet of Things for Smart Community Solutions)

Abstract

:
The Internet of vehicles (IoV) is a rapidly emerging technological evolution of Intelligent Transportation System (ITS). This paper proposes SafeDrive, a dynamic driver profile (DDP) using a hybrid recommendation system. DDP is a set of functional modules, to analyses individual driver’s behaviors, using prior violation and accident records, to identify driving risk patterns. In this paper, we have considered three synthetic data-sets for 1500 drivers based on their profile information, risk parameters information, and risk likelihood. In addition, we have also considered the driver’s historical violation/accident data-set records based on four risk-score levels such as high-risk, medium-risk, low-risk, and no-risk to predict current and future driver risk scores. Several error calculation methods have been applied in this study to analyze our proposed hybrid recommendation systems’ performance to classify the driver’s data with higher accuracy based on various criteria. The evaluated results help to improve the driving behavior and broadcast early warning alarm to the other vehicles in IoV environment for the overall road safety. Moreover, the propoed model helps to provide a safe and predicted environment for vehicles, pedestrians, and road objects, with the help of regular monitoring of vehicle motion, driver behavior, and road conditions. It also enables accurate prediction of accidents beforehand, and also minimizes the complexity of on-road vehicles and latency due to fog/cloud computing servers.

1. Introduction

The Internet of vehicles (IoVs) and the recent technologies fused with the intelligent vehicles, ensure road safety by preventing and detecting road accidents accurately. Recent technologies fused with intelligent vehicles ensure road safety by preventing and detecting road accidents accurately [1]. A dynamic personalized analysis of driving behavior is possible when traffic data is processed with advanced AI technology. According to WHO, 1.35 million people die each year as a consequence of road accidents and a large quantity of the population suffer from road accident injuries, which affect economic and human losses. Approximately 85% of the road traffic accidents happen due to human error [2]. A recent study shows that around 50 million people suffer from non-fatal injuries, with a large number of them experience a disability as a consequence of their injury. Therefore, driver behavior is the major contributing factor in road crashes in the world. In the broad domain of accident prevention and road safety, driver behavior analysis is a main focus since a large number of accidents are due to drowsiness of the drivers [3]. The current smart transportation system uses an alert generation module to send immediate alerts to the corresponding vehicles in the monitoring system. The personalized recommendation system is one of the methods to provide a safe transportation system based on road traffic crashes and violations on the record of the driver, giving recommendations along with increased personal awareness to enhance the driving behavior. In behavior detection, steering position, vehicle position, driver’s eye/face, and physiological measurement play pivotal roles. The recommendations of driver feedback are based on driver historical violations and accident records to predict current and future driver risk scores using the Saudi Traffic Points System Regulation (STPSR) system [4]. In the analysis of driver behavior, it is also necessary to consider the traffic characteristics and junction characteristics to achieve better accuracy. It has been observed that numerous researchers are working on road safety solutions which aim to ensure a safe transport system. The majority of the research in ITS has been in exploiting advances in the fields of electronic systems to estimate the various responsible parameters for causing on-road accidents and traffic congestion. The primary shortcoming of the electronic system is that it has to analyses the results from the physical factors such as limitations in communication infrastructure, environmental, and surrounding conditions. Currently, machine learning is gaining attention to play a significant role in the management of numerous tasks such as in traffic data study, analysis, and classifications, which helps to personalize recommendations of various contents that can become adding value assets for most of the ITS by analyzing the historical driving behavior records.
In this study, we developed a hybrid recommendation system for DDP data management architecture to predict the future driving risk of crash-involved drivers shown in Figure 1. For this study, we have considered the STPSR dataset to predict the driving behavior based on the driving risk, and identify risky driving factors. With the help of a reliable and explicable machine learning method, we have predicted the high-risk (HR), medium-risk (MR), low-risk (LR), and no-risk drivers for further driving. The number of points calculated for every violation/accident of traffic regulation risk likelihood based on the risk matrix classifies the parameter using the STPSR datasets. Moreover, the paper describes the potential of the risk modeling of the drivers, provides feedback to them, monitors behavior, and focuses on the driver risk behavior based on accident severity and traffic violations using rule-based classification.
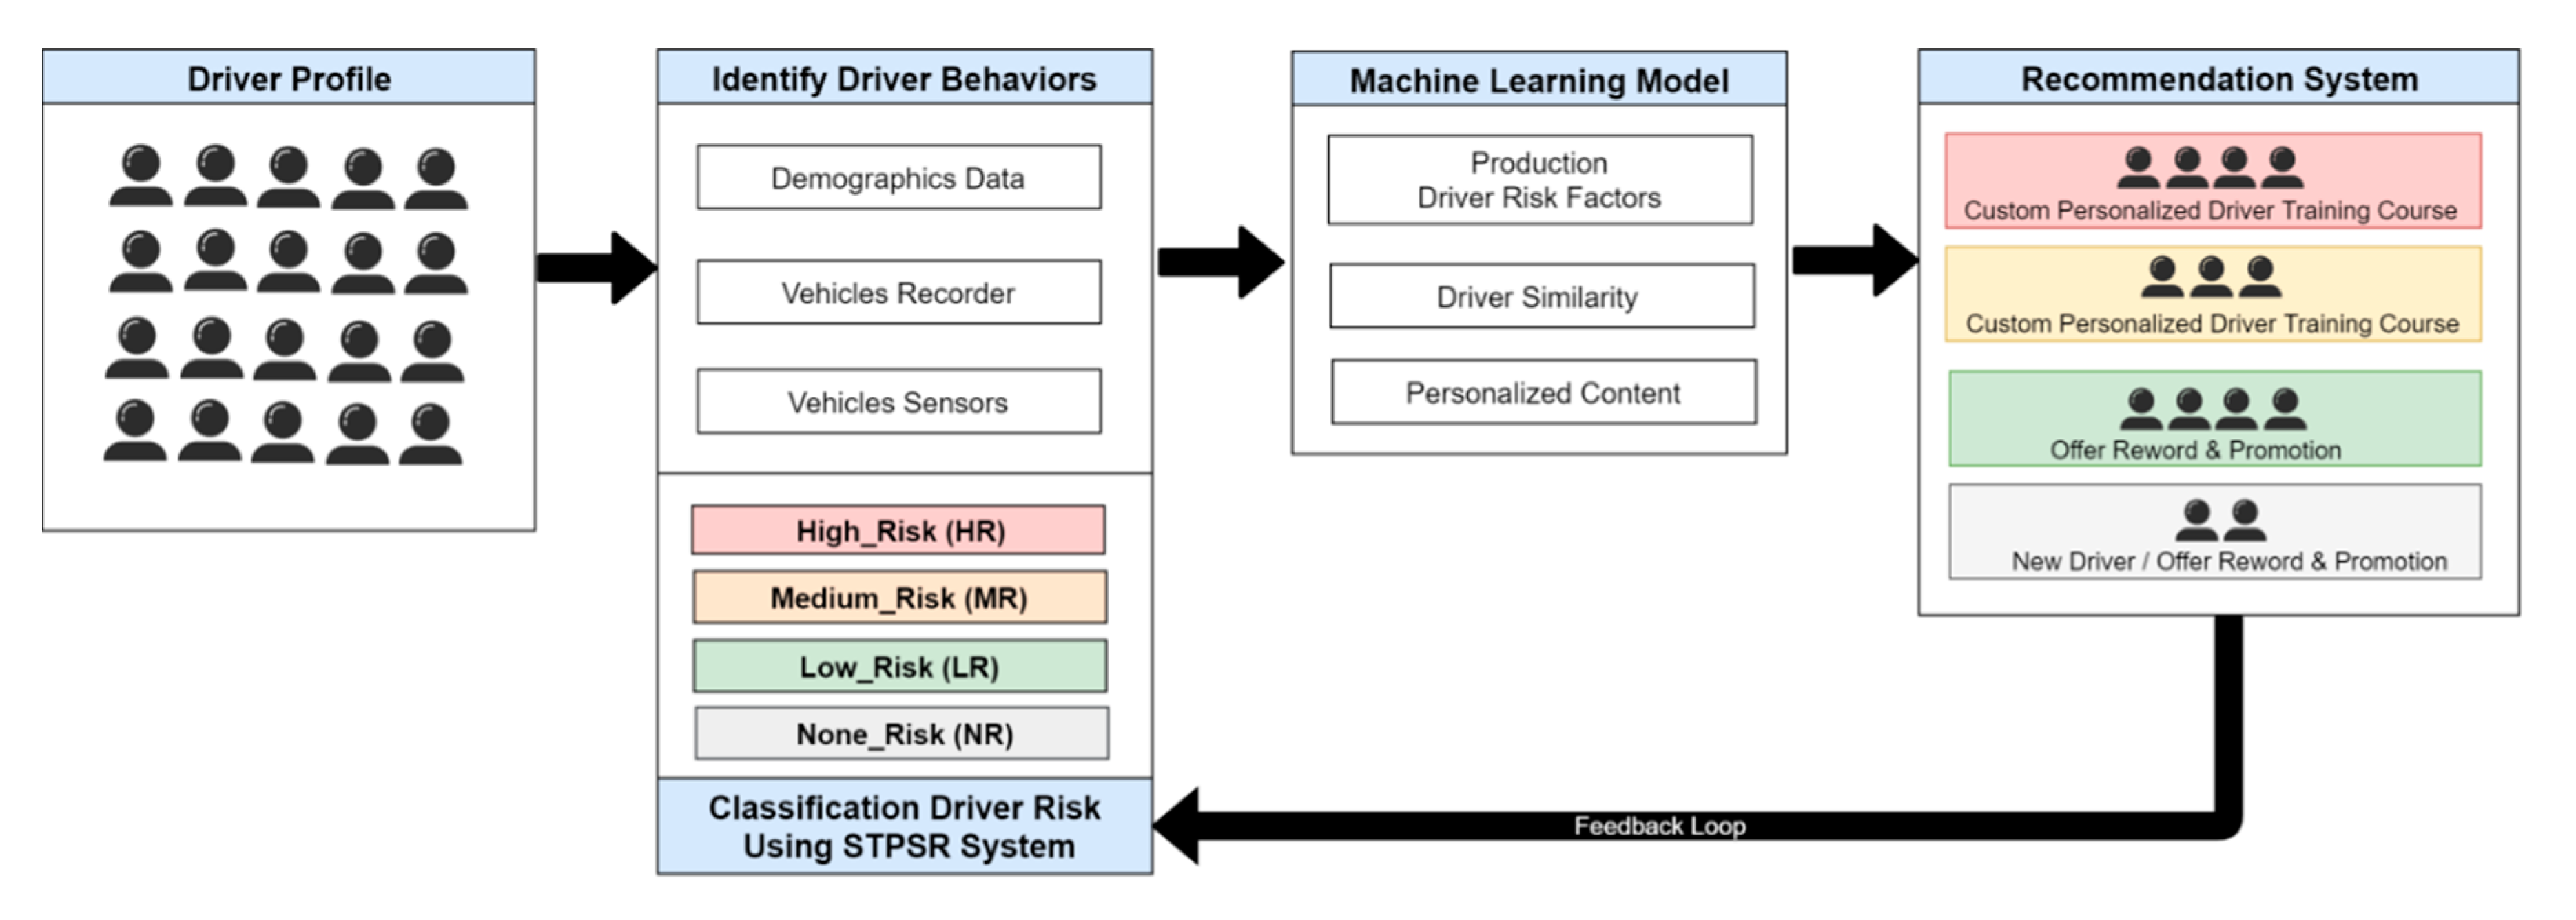
  • We developed a SmartDrive recommendation system for drivers’ driving skill management and prediction using the concept of the machine learning model.
  • We propose a dynamic driver profile (DDP) approach to analyse individual drivers’ behaviors to identify a driver’s risk pattern based on four risk-score levels such as high-risk, medium-risk, low-risk, and no-risk.
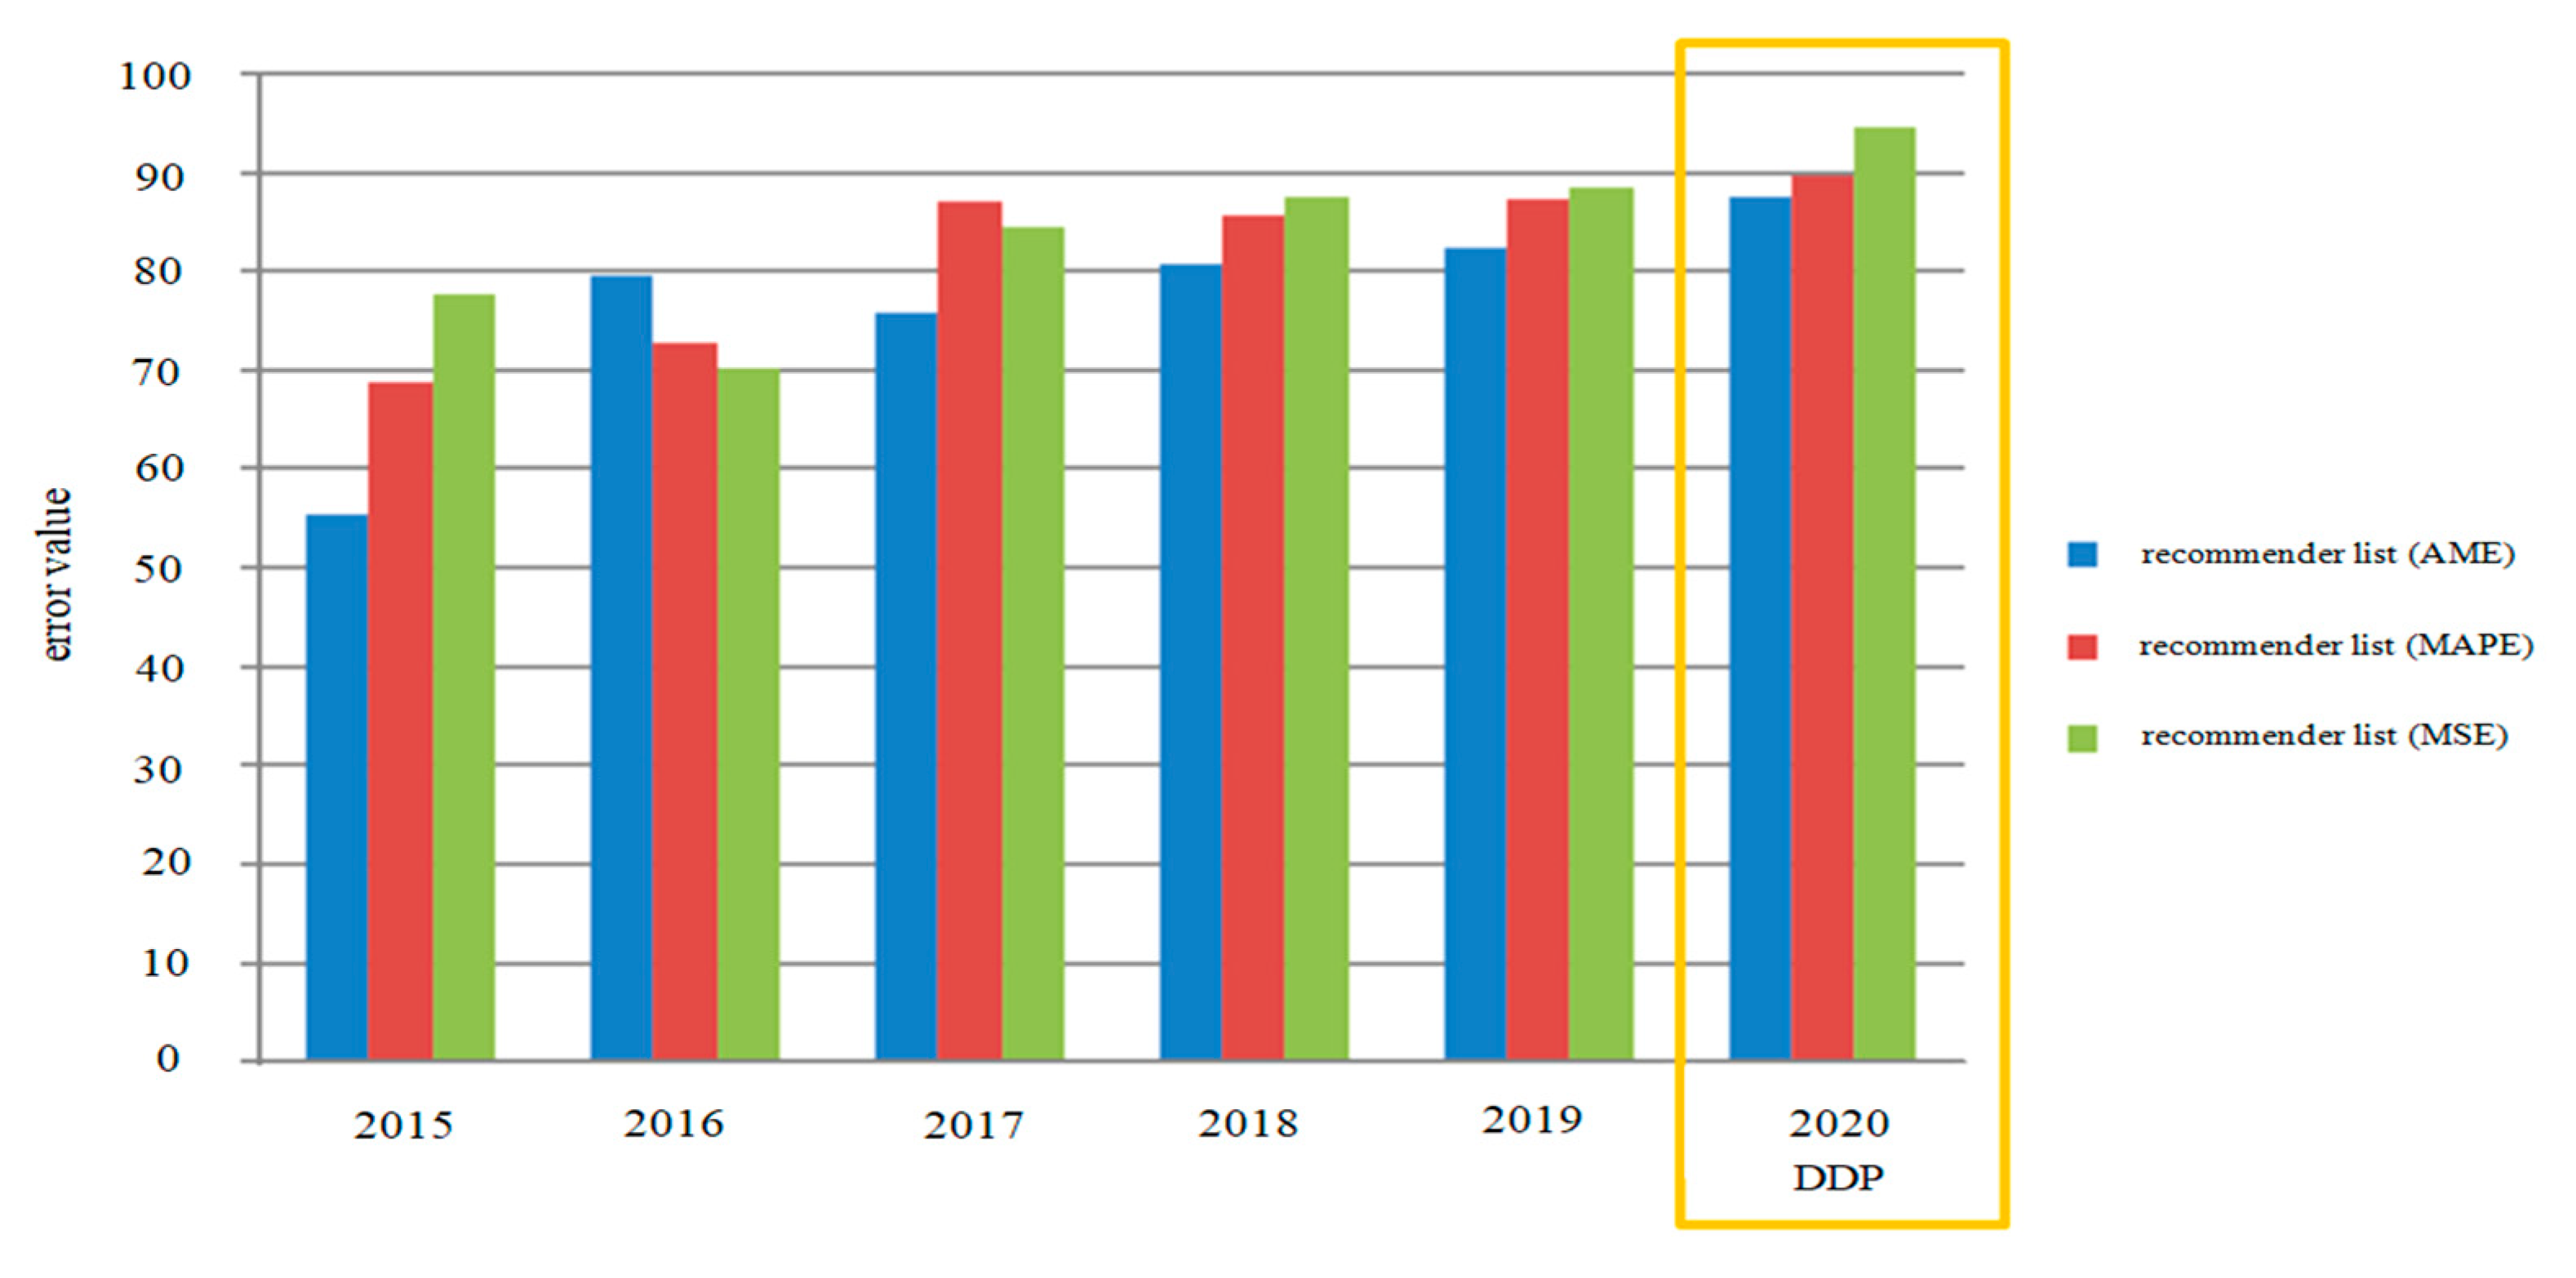
  • We show improvements in the prediction accuracy of the recommendations are evaluated on the three performance errors: mean squared error (MSE), mean absolute percentage error (MAPE), and mean absolute error (MAE) for the Saudi Arabian traffic accident and violation data to identify trends, recognize underlying factors influencing traffic accidents, and provide recommendations and key findings and insights.
The rest of the paper is organized as follows. In Section 2, we have summarized the related work and our contribution. In Section 3, we provide an overview of the proposed hybrid recommendation system architecture in detail. Section 4 presents the deep learning modeling and data classification algorithms for DDP. Section 5 provides the performance analysis and use case implementation of the proposed method with the real-world application in the Saudi Arabian transportation system, and finally we have concluded our work in Section 6.

2. Related Work

In order to improve ITS and future driving risk indexes, many researchers have presented a wide range of solutions, in which car crashes, head-on accidents, fires, and roll-on events can be accurately detected with the assist of on-board sensors that are deployed in the intelligent vehicles [5]. In the broad field of accident prevention and road safety, driver behavior analysis takes most of the focus since a large number of accidents are due to drowsiness of the drivers [6]. In the analysis of driver behavior, it is also necessary to consider the traffic characteristics and junction characteristics to achieve better accuracy [7]. Additionally, the current smart systems use alert generation modules in the monitoring systems to send immediate alerts the corresponding vehicles. In behavior detection, steering position, vehicle position, driver’s eye/face, and physiological measurement play pivotal roles [8]. On the other hand, trajectory prediction through the past sequences and current behavior of the vehicle and driver correspondingly pull much attention [9]. The multi-modal Kalman filter is used for trajectory prediction that works upon the extended Kalman filter. The proposed Kalman filter model mainly uses three different parameters, vehicle velocity, position, and distance of the vehicle from the intersection, to construct the state vector matrix [10]. In the case of road safety, the trajectory must be predicted as early as possible to avoid collisions and accidents, thus long-short-term-memory (LSTM) based trajectory prediction is ineffectual. The convolutional neural network (CNN) for motion detection and the recurrent neural networks (RNN) for movement planning have been utilized for vehicle surrounding and movement prediction for autonomous vehicles during the multi-lane turn crossings. The autonomous vehicle updates its motion based on the trajectories of the surrounding vehicles to prevent accidents and to improve road safety [11]. Also, the lane-change intention, which is an important aspect of multi-lane roads, was not considered. This degrades the prediction accuracy. The surrounded vehicle trajectory is only predicted to avoid accidents and collisions, but surrounding vehicles’ behavior and maneuvers are the major factors for road safety. The safety is assured only for subject vehicle and the other vehicles and pedestrians are still in unsafe condition. Specifically, LSTM-RNN are useful in prediction of the trajectory, and the future trajectory of the vehicle is predicted from this value. The trichotomyAdaboost (AdaBoost-SO) approach was used for accident risk prediction [12]. The data considered in this work are related to the vehicle and its direction on the road. An accident detection-based IoT system is proposed to report the accidents earlier in smart city environments where the vehicle sensors collect and process the data with the help of on-board units (OBUs). For each sensor reading, a threshold value is pre-defined to detect the abnormalities in the system [13]. DeepCrash is the deep learning-based accident detection and alert generation system that uses a densely connected convolutional neural network (DenseNet) for processing the vehicle data in the cloud environment. Based on the classification report, the alert is generated and sent to the vehicles [14]. An intelligent and smart IoV system demands early prediction and warning of accidents to improve road safety. Firstly, challenging the methods of processing huge data in OBUs degrades the accuracy and increases complexity; secondly, cloud-based data management and detection increases latency for alert generation; thirdly, involvement of a high false alarm rate increases collisions; and finally, some early warning systems have poor accuracy [15]. A fuzzy inference system-ased driver monitoring system (FDMS) has considered two individual fuzzy models for decision making in safe driving. The first fuzzy model takes the vehicles’ environment temperature, noise level, and driver’s heart rate as inputs. The second fuzzy model takes respiratory rate of the driver to compute the driver’s situational awareness (DSA). With the help of these two FDMS, the final decision on the driver’s behavior is made based on whether it is a normal situation, bad situation, or worst situation [16]. An automated accident detection and classification system has been focused on the emergency medical service (EMSs) like ambulances, provisioning rescue operations by improving the prediction of road conditions. Where the smartphone-assisted sensors are used to collect data from the vehicles and environment. The system was tested using naïve Bayes, Gaussian mixture model (GMM) and decision tree (DT) algorithms [17]. Artificial intelligence-based vehicle behavior anticipation mechanisms have been discussed in [18] where a hybrid vehicle trajectory prediction methodology has been developed using a long short term memory (LSTM)-based trajectory prediction model which has demonstrated the use of maneuver-based attributes such as lane changing for trajectory prediction.
This paper proposes a LSTM-based motion detection method. Towards that aim, a motion planner-based model predictive control (MPC) was designed to support multi-lane environments. Here, the autonomous vehicle updates its motion based on the trajectories of the surrounding vehicles to prevent accidents and to improve road safety. The dataset considered is related to the multi-lane turn intersections data. This data is classified by LSTM-RNN into left-lane, right-lane, and lane-keeping. Considering the predicted trajectory, travel time and motion of the autonomous vehicle is planned. Therefore, the LSTM is generally a complex network that consumes a large amount of time. In the case of road safety, the trajectory must be predicted as early as possible to avoid collisions and accidents. Thus, LSTM-based trajectory prediction is ineffectual. Here, lane-change intention, which is an important aspect of multi-lane roads, is not considered. This degrades the prediction accuracy. The surrounded vehicle trajectory is only predicted to avoid accidents and collisions, but the surrounding vehicles’ behavior and maneuvers are the major factors for road safety.

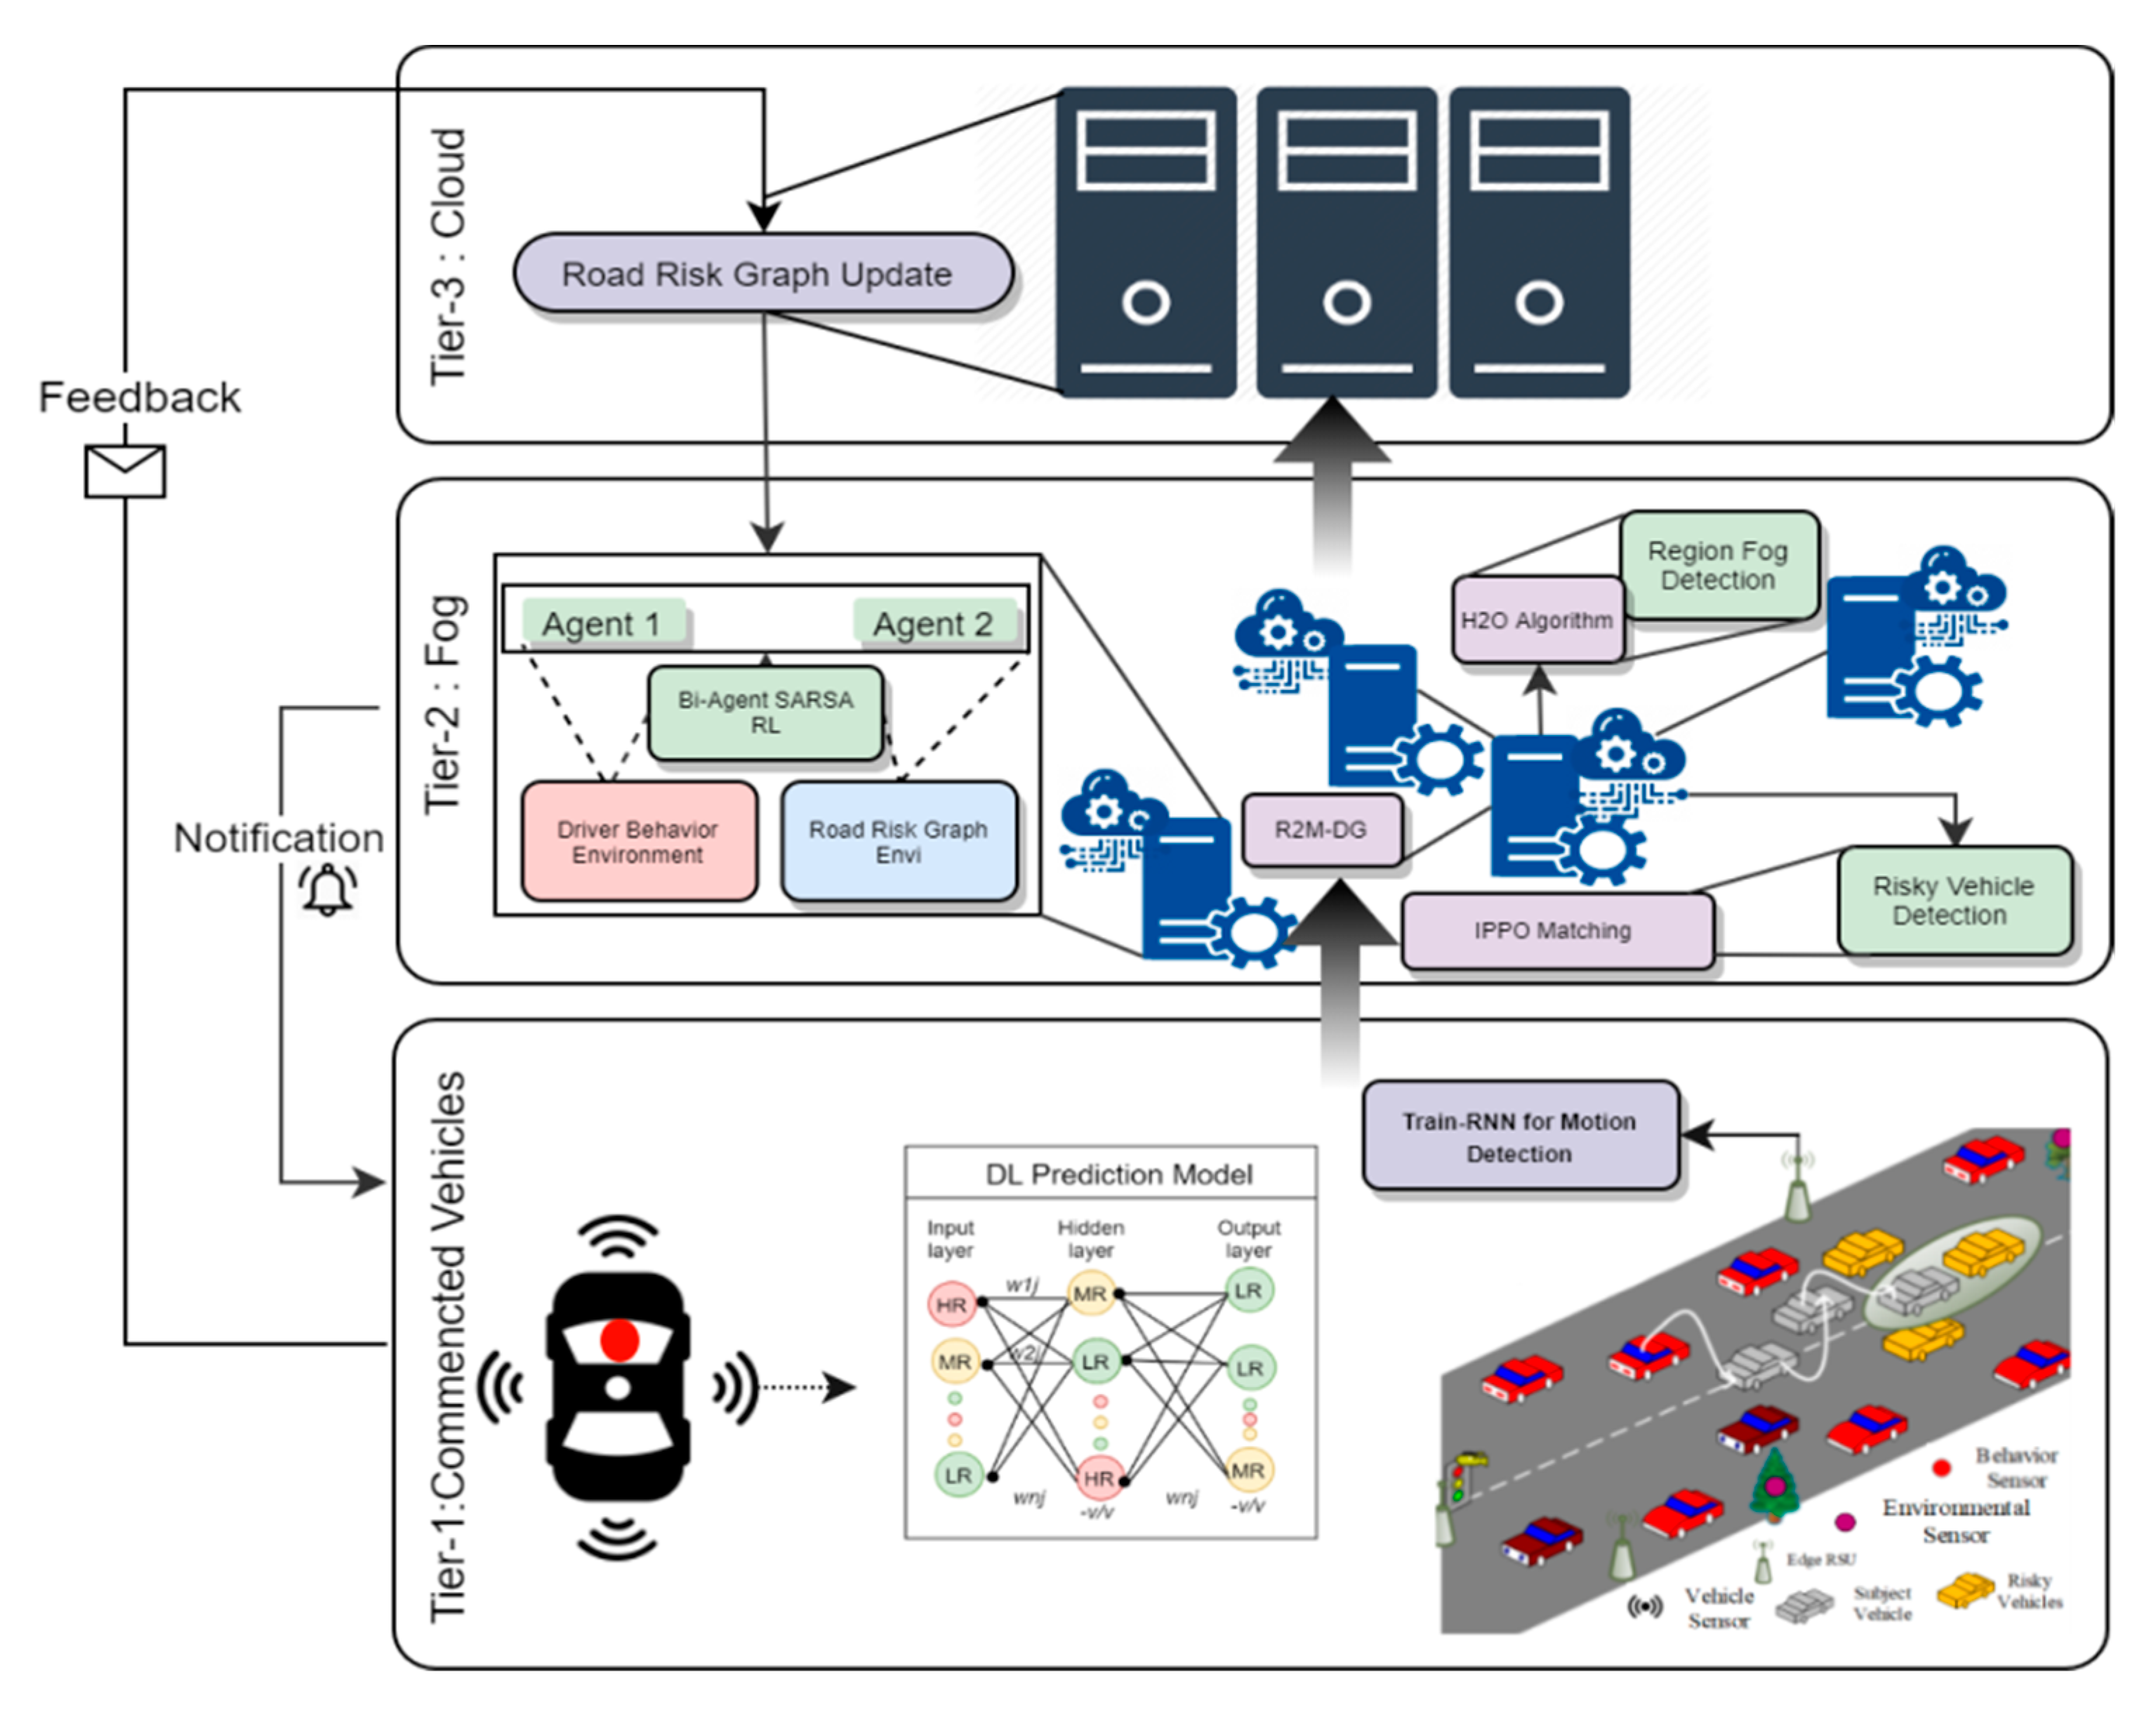
3. Hybrid Recommendation System Architecture

A recommendation system gives us opportunities to provide a set of services and systems. The proposed hybrid recommendation system architecture aims to tackle the challenges in preventing road accidents and generating early warning alerts as a part of road safety in the connected vehicles environment. The proposed SafeDrive architecture platform equipped with behavioral sensors for the driver’s driving prediction mechanism process are shown in Figure 2, where the collected data from sensors is transferred to the upper layers through communication technologies. It is divided in three tiers:
  • Tier 1 (Connected Vehicles): This tier includes the intelligent connected vehicles which have in-built sensors such as speed, acceleration etc. It includes the on board unit (OBU) and edge road side units (E-RSUs) to enhance the processing speed.
  • Tier 2 (Fog Computing): This tier includes distributed fog nodes, each responsible for monitoring and handling separate regions in Tier 1. The fog nodes have processing abilities higher than E-RSUs.
  • Tier 3 (Cloud Computing): This is the uppermost tier and includes a centralized cloud server which maintains the continuous monitoring information generated from the Tier 1 and Tier 2 devices.
All three tiers work together to prevent accidents and generate the early warning alerts to the vehicles for providing safety services. For that, the Safe-Drive model requires multiple contributions, such as: deep vehicle motion prediction, dependency graph–road risk map construction, reinforced driver behavior analysis, and optimal alert generation for road safety. Deep vehicle motion prediction analysis depends upon three main attribute sets: lane change information (maneuver based), nearby vehicle report (interactive aware), and past instances of the vehicle. All three sets are learned individually by the tri-set independent recurrent neural network (TriIn-RNN) model. The dependency graph–road risk map construction process is based on road conditions and the structure, where each fog node constructs a road risk map (R2M) as the dependency graph (DG) for its underlying region, which is determined by Bayesian probability. Reinforced driver behavior analysis is analyzed as the function of respiratory rate, heart rate, eye closure rate, EEG factor, etc. From these features, the first agent learns the driver behavior. Another agent learns road conditions from R2R-DG, which are constructed and updated effectually as normal, bad, or worst conditions. The optimal alert generation for road safety process is based on the current state, which is determined as bad or worse, and then the fog node triggers the alert module to send alerts to the vehicles.

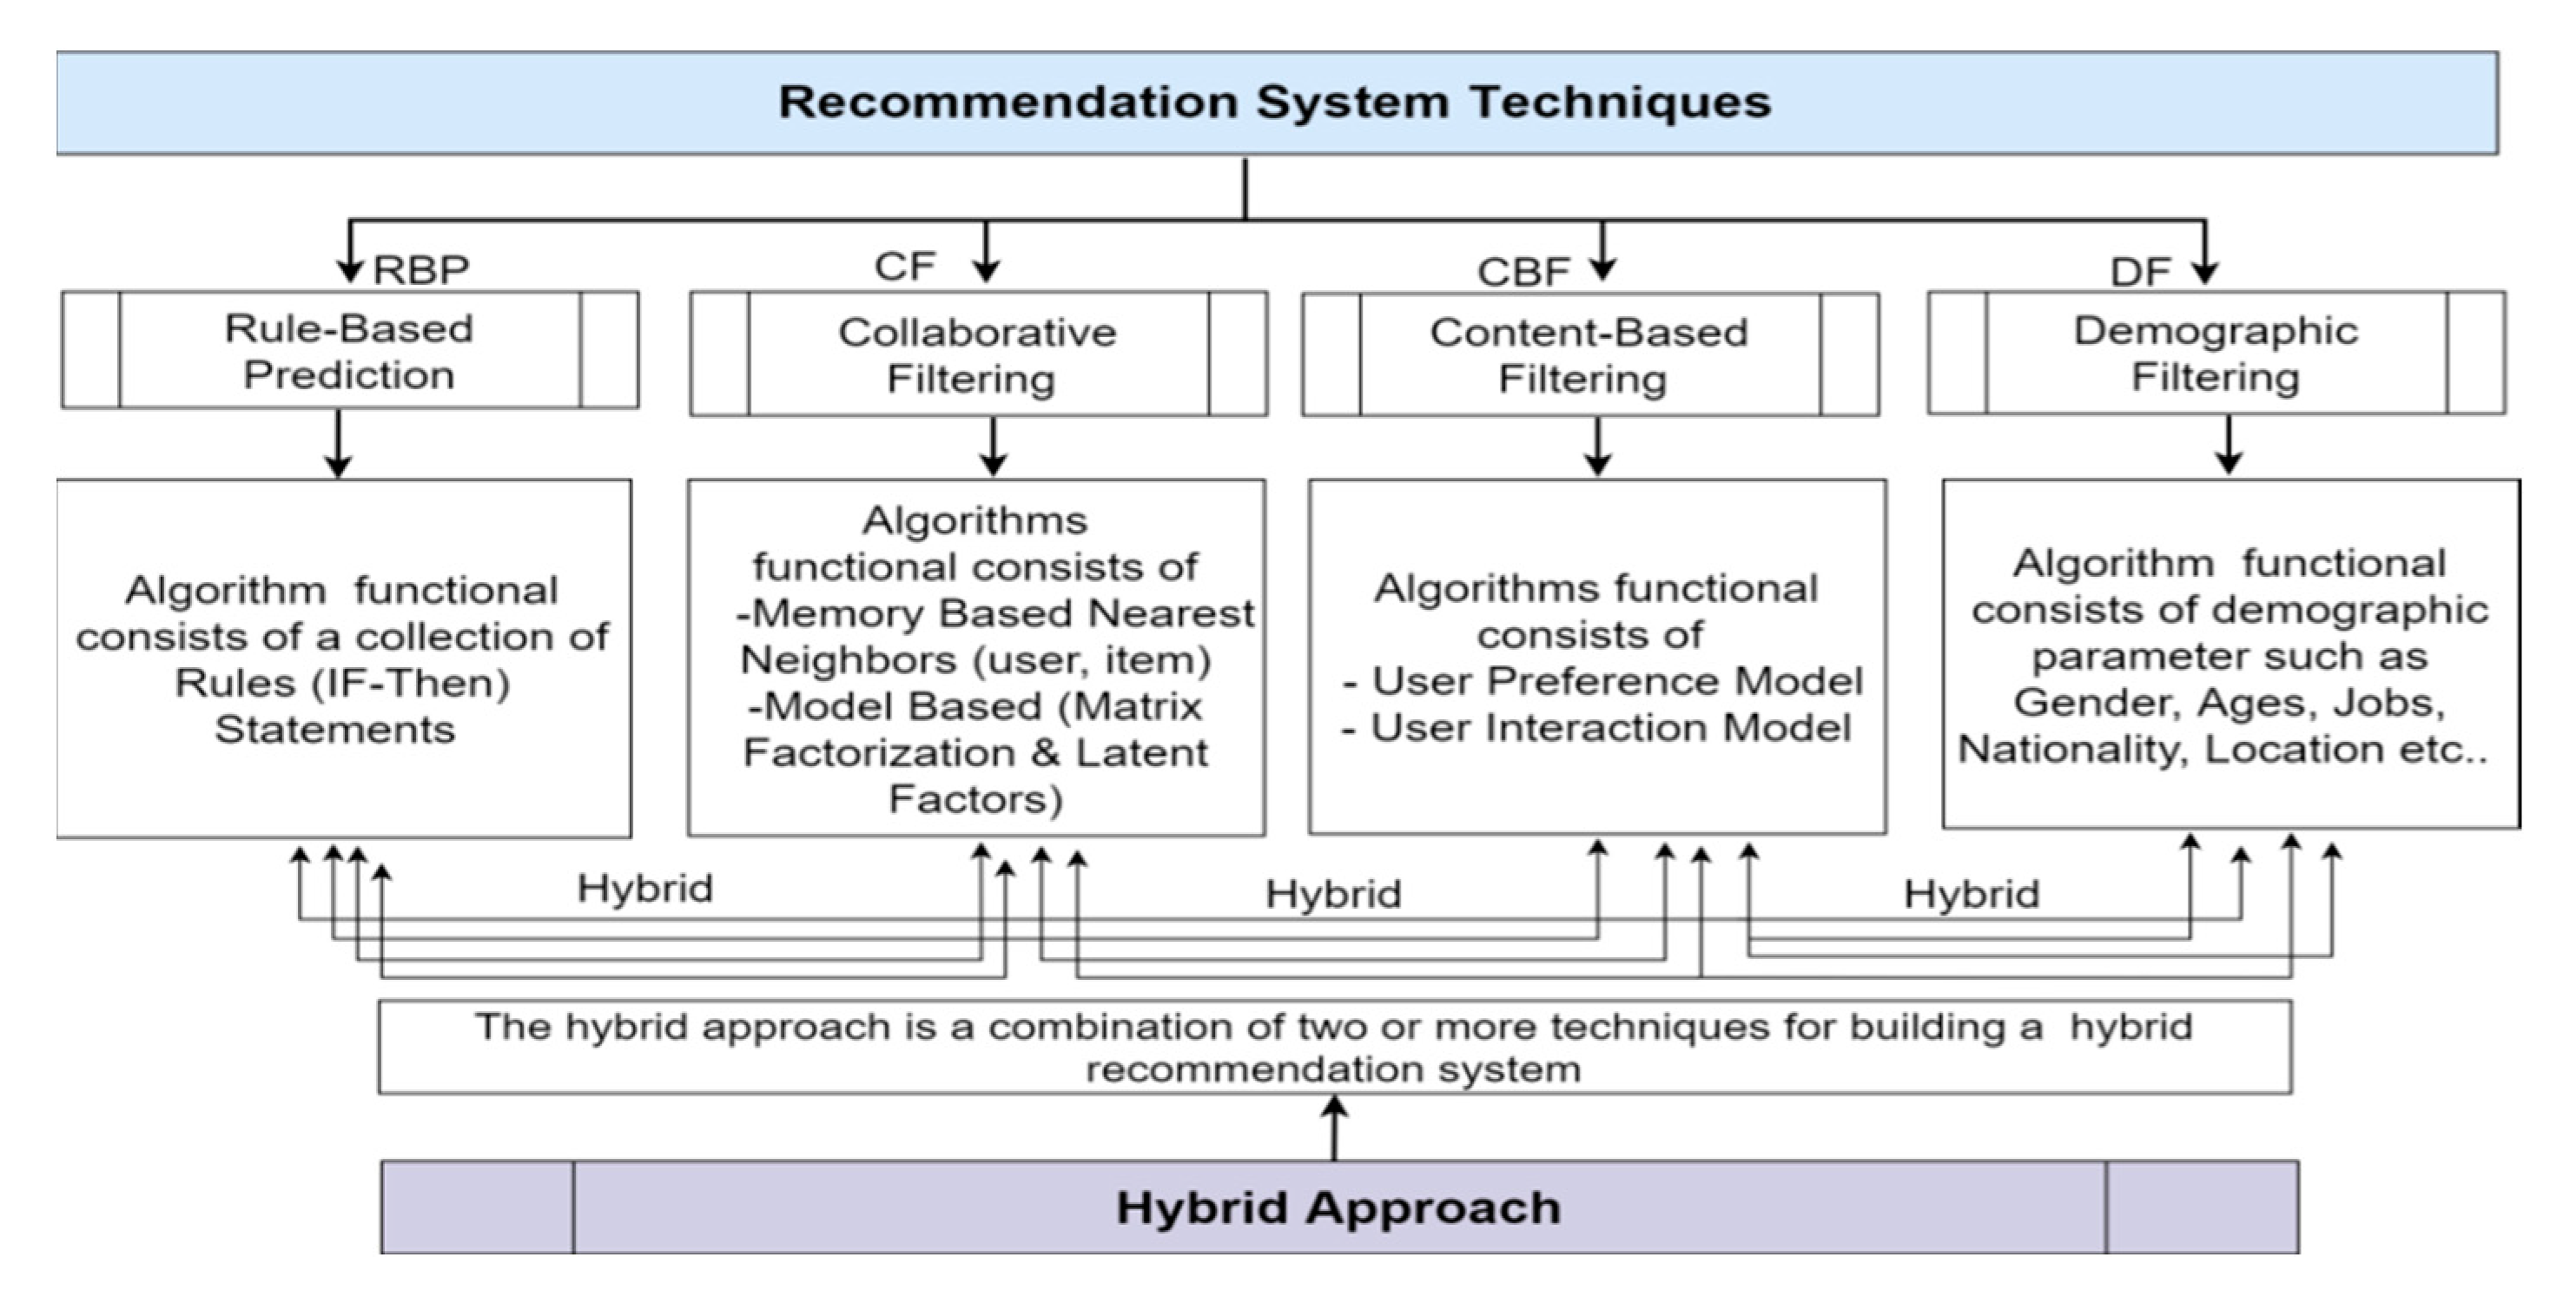
3.1. Hybrid Recommendation System

The safety is assured only for the subject vehicle and the other vehicles and pedestrians are still in an unsafe condition. Therefore, we have tried to overcome the current research limitations, such as to provide the correct information needed by a particular user so that the same user can choose the best driver or in specific fields. A dynamic driver provided recommendation system allows the user to choose the best vehicle trajectory based on the user’s required information. Based on the background studies, we have conceptualized a standard recommendation techniques in Figure 3, which is important to incorporate the information related to the user in the recommendation system. The method used is most relevant information per user, ignoring other information related to the user such as the weather, time, location, etc.
The dynamic information of user contacts has been used in previous research in relation to recommendation systems. These studies show that to provide recommendations, it is important to incorporate the information related to the user in the RS. A model of contextual filtering also has some limitations related to its application in a single dimension, as in the case of a user’s neighbor [19]. To overcome these deficiencies, we propose a personalized recommendation system that learns from driver behavior contents and identified risk factors using practical machine learning approaches.

3.2. Dynamic Driver Profile (DDP)
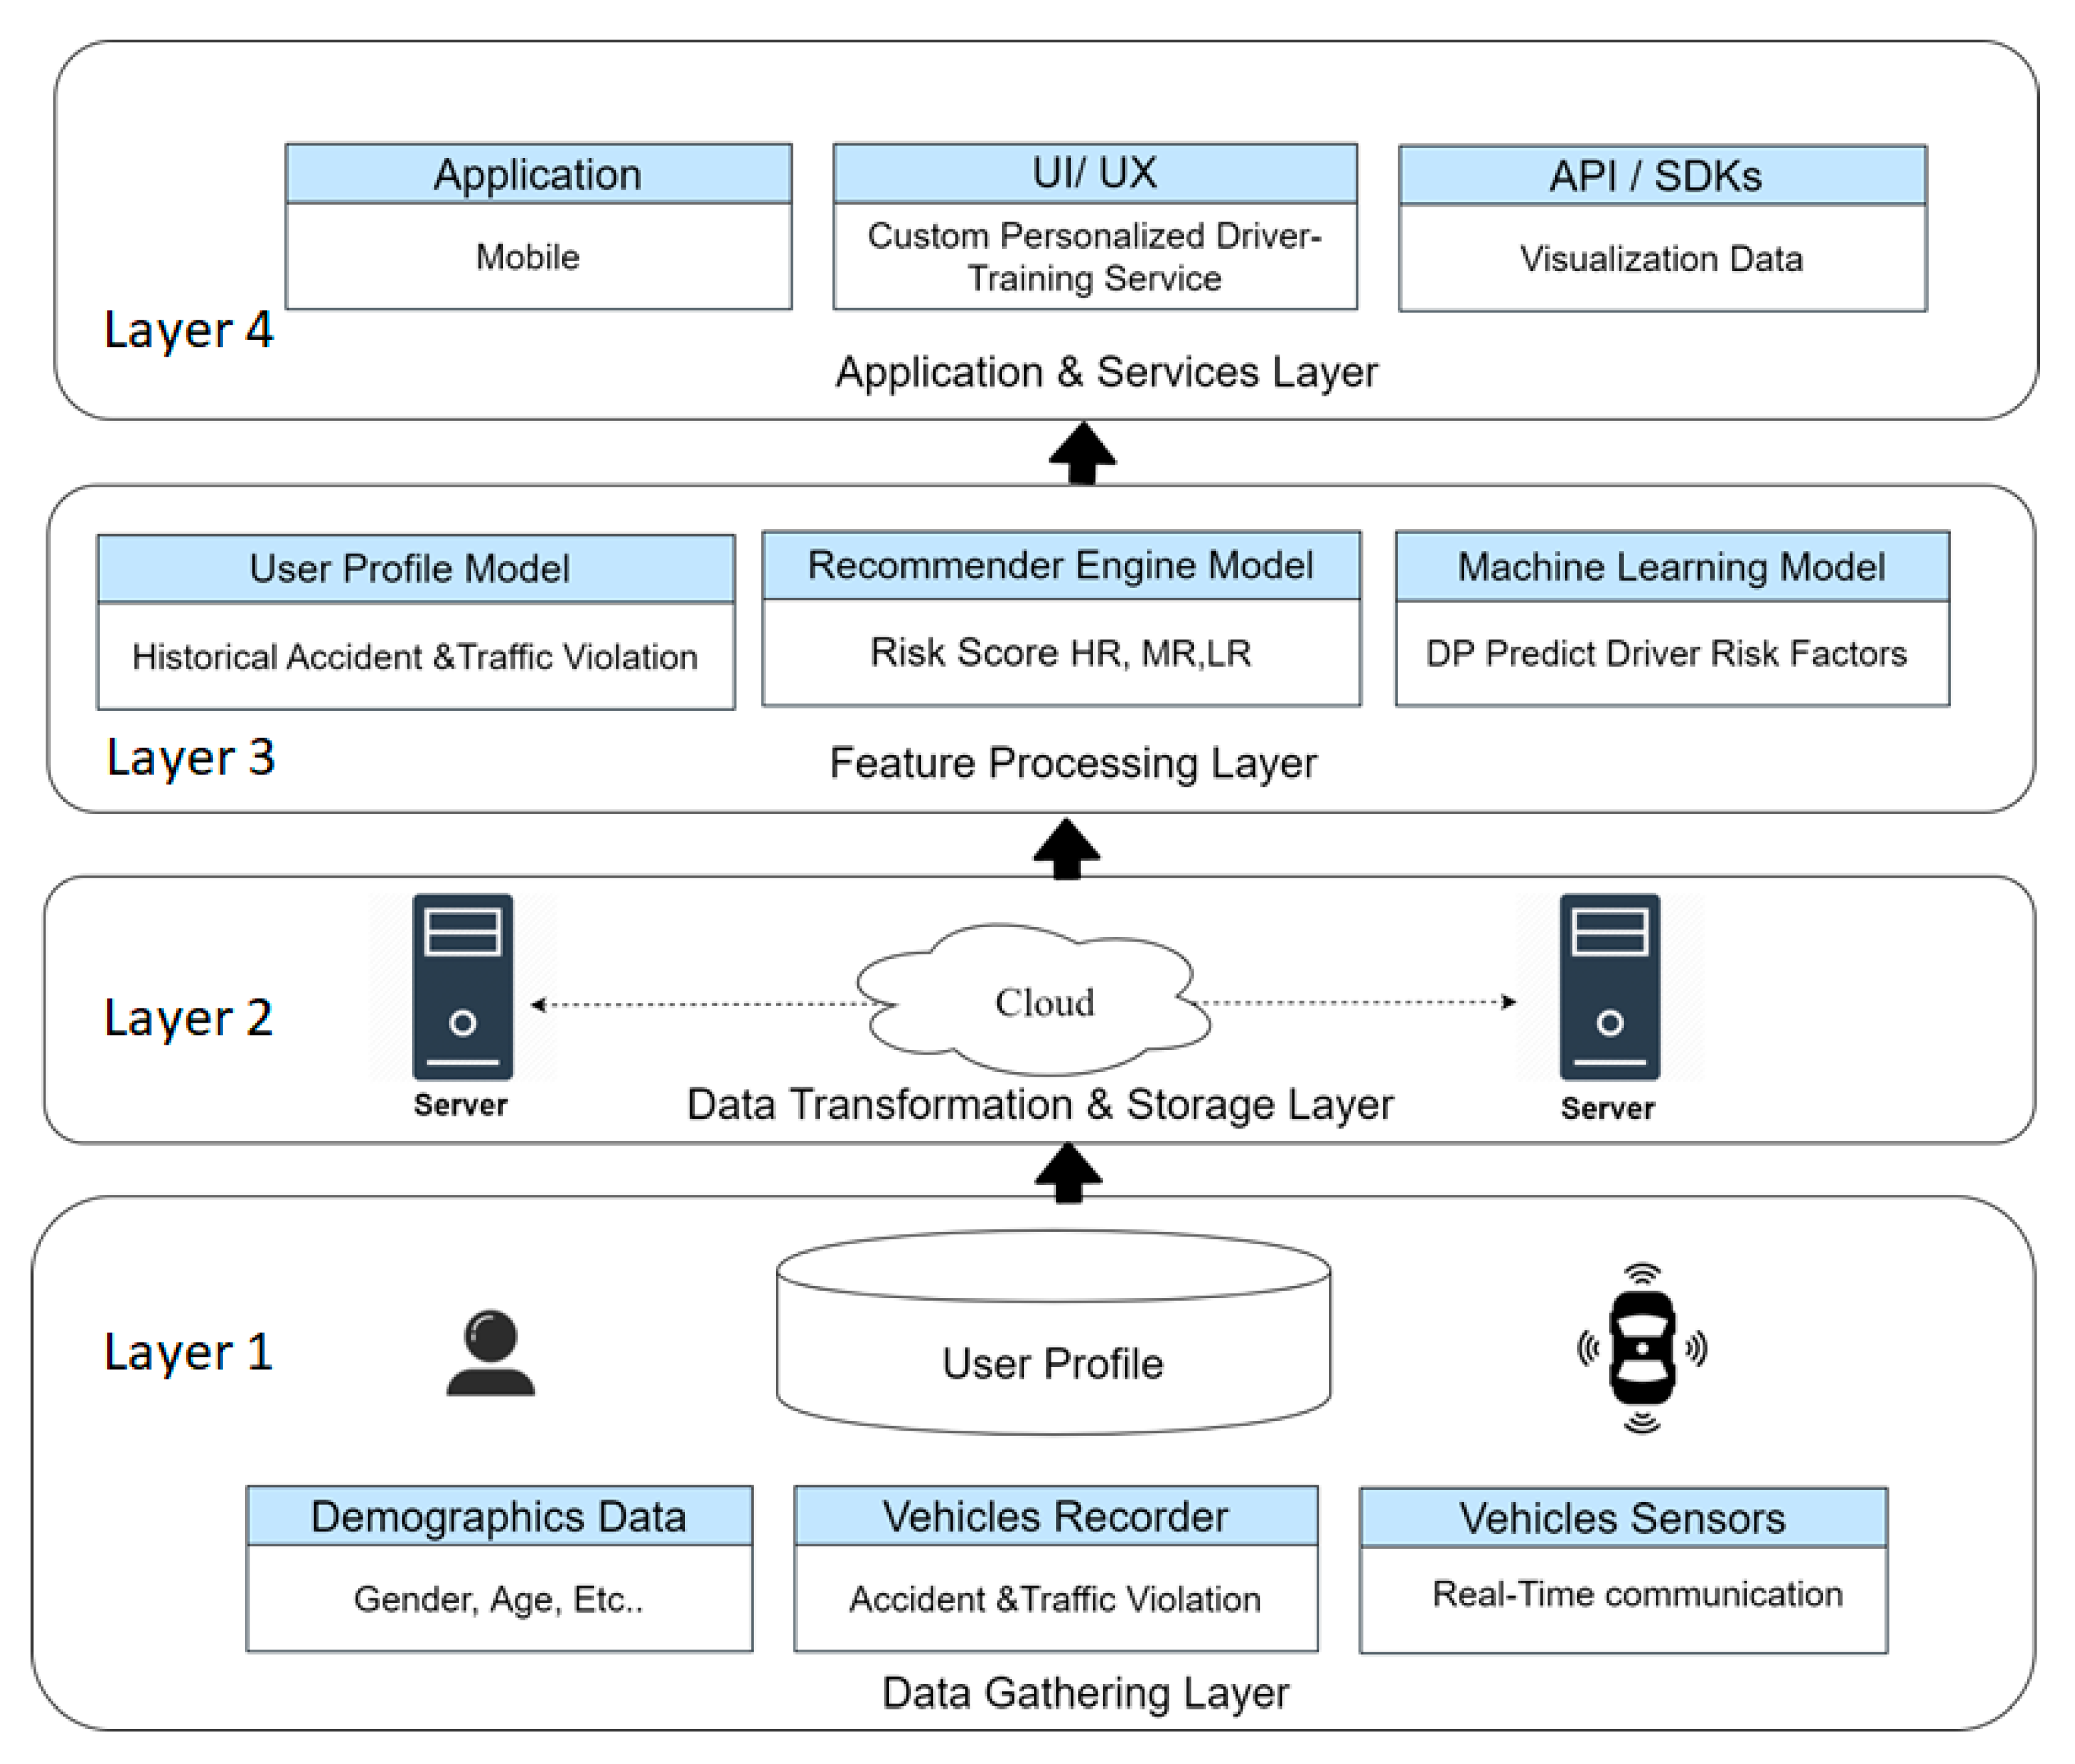
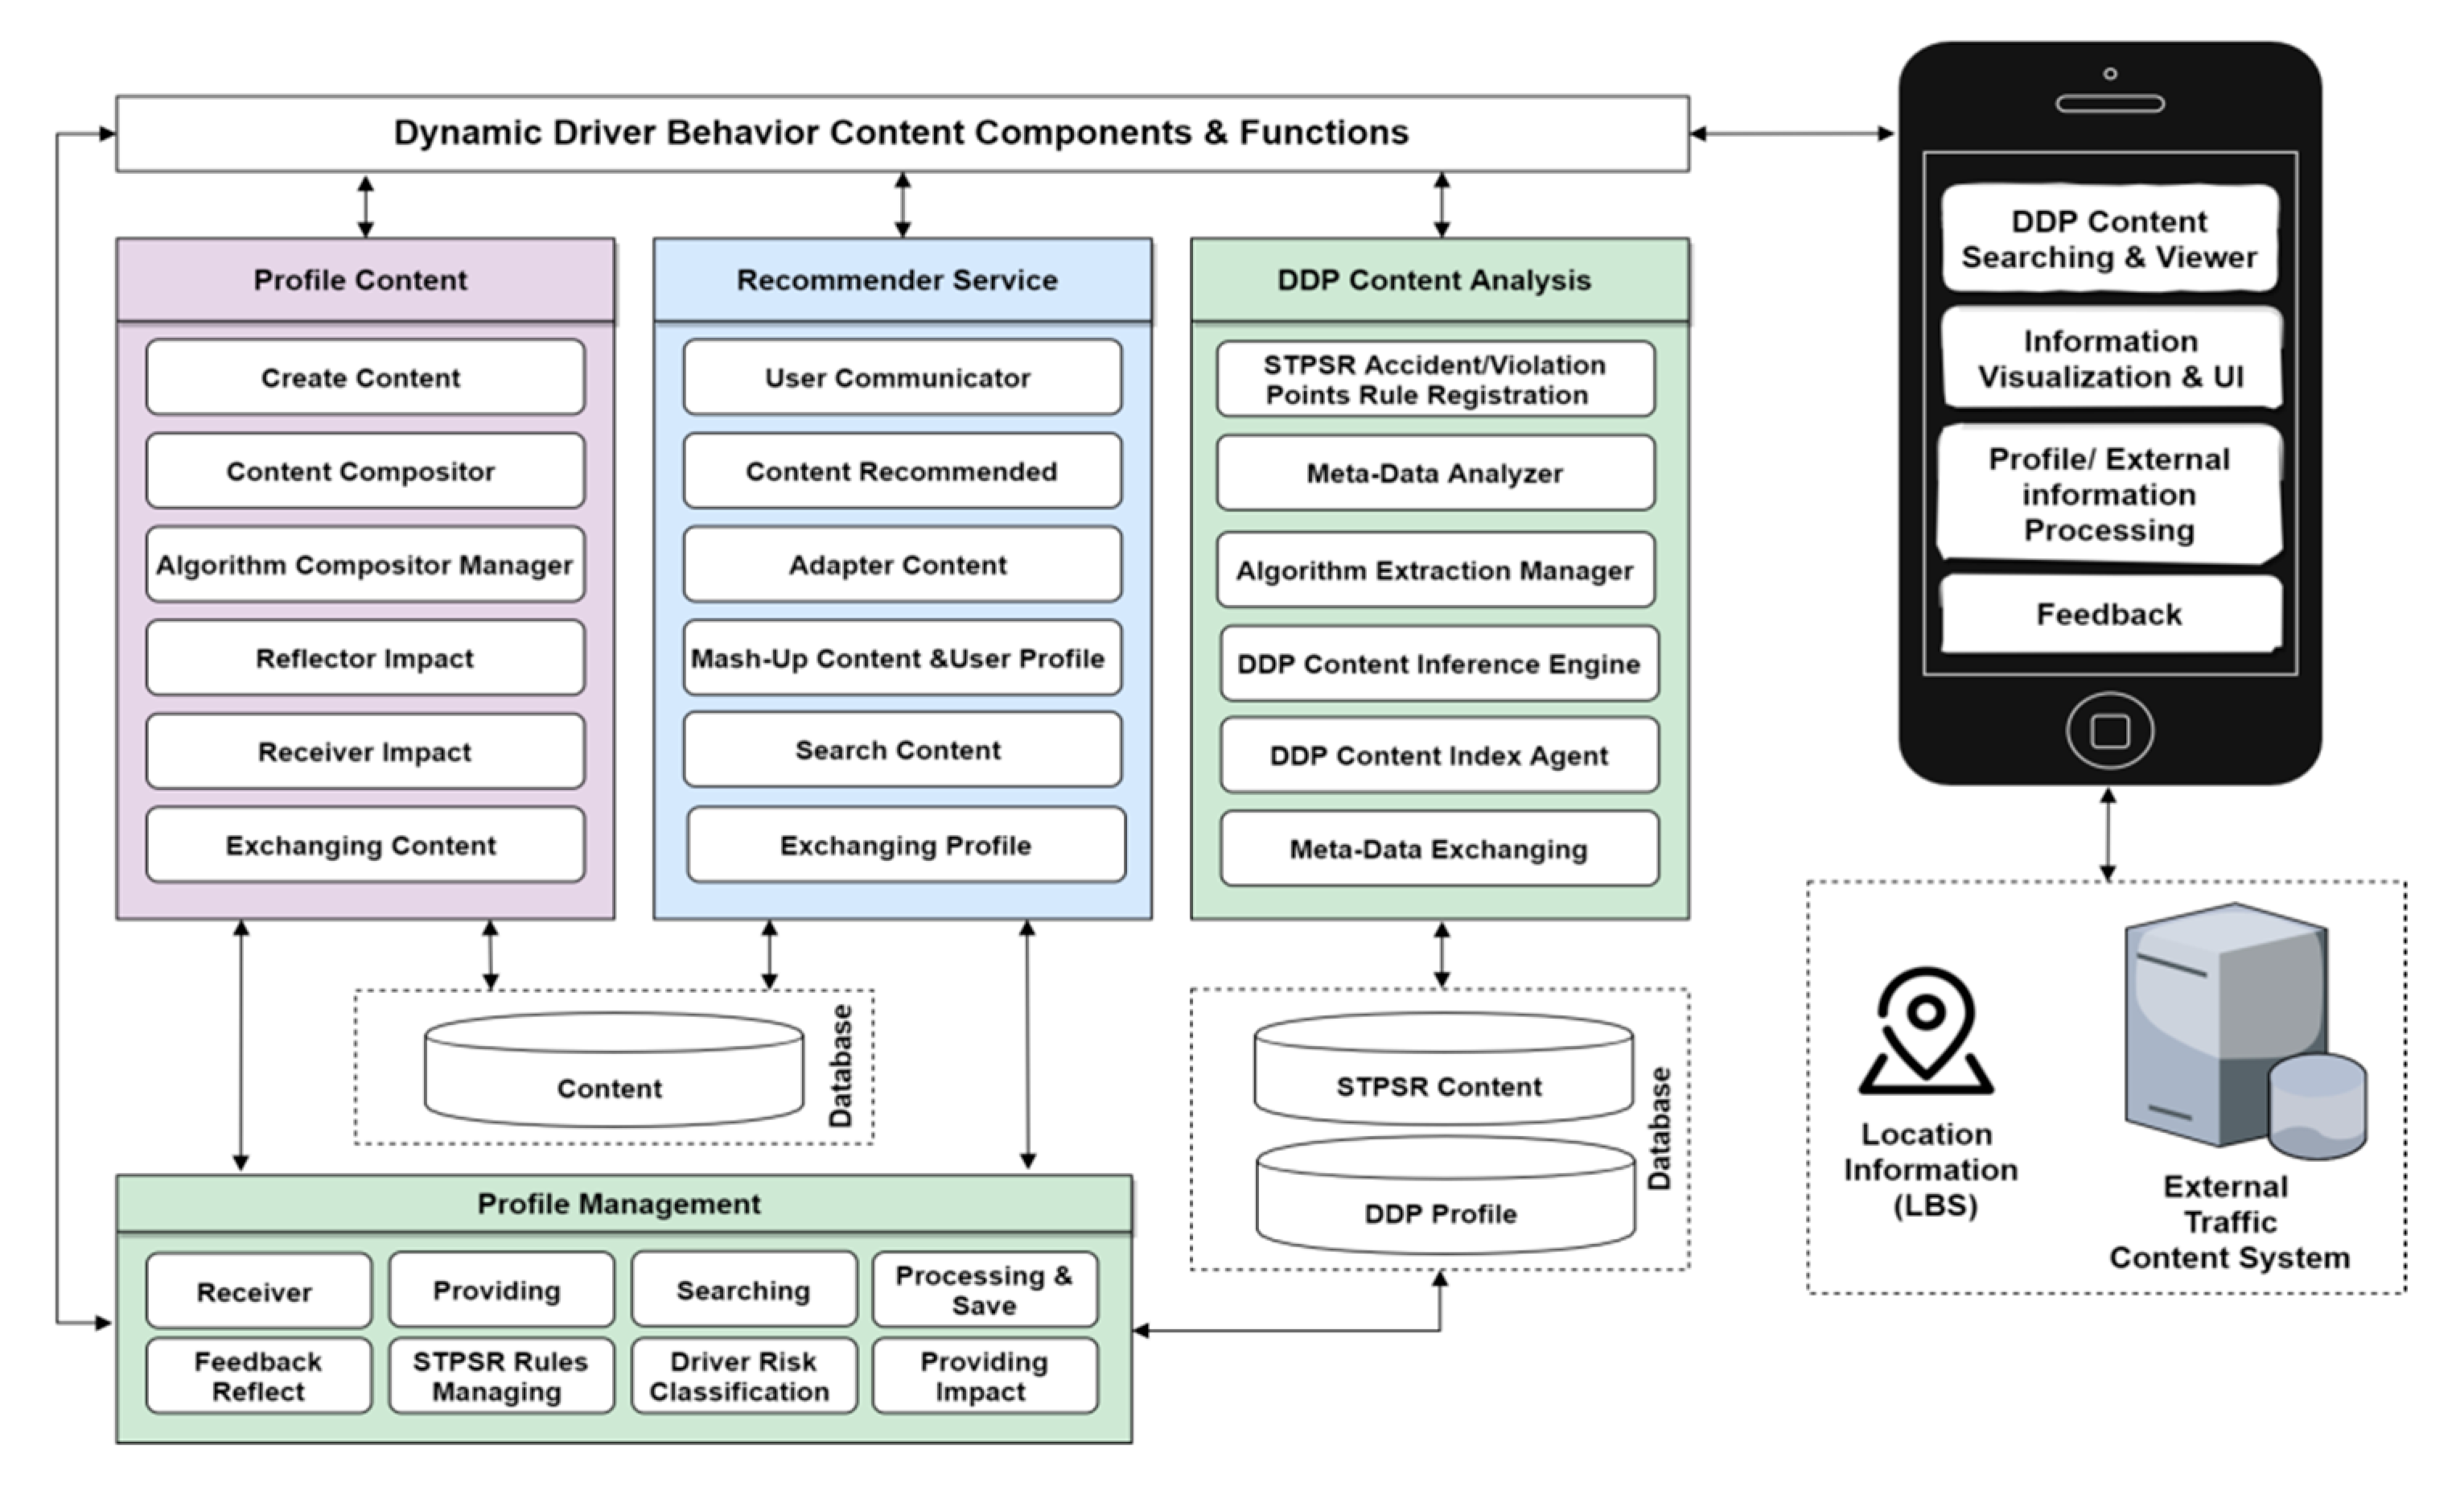
The hybrid recommendation system is based on the concept of dynamic driver profile (DDP), which is an umbrella framework that provides a set of services and systems. We focused on preventing road accidents and generating early warning alerts as a part of road safety in connected vehicles. Towards this aim a novel four-tier alert DDP platform architecture was designed as shown in Figure 4, where the first layer (Layer 1) data gathering includes demographics, vehicle, accident, and violation records data. The second layer (Layer 2) cloud computing server includes transformation and integrated data multiple dataset sources. The third layer (Layer 3) data processing stage includes the three modules of user profile, recommender system, and machine learning techniques. Finally the fourth layer (Layer 4), the application and services layer, includes the API to custom personalized content, visualization data, and generate driver report to different stockholders such as government-to-consumer (G2C) individual and report, government-to-business (G2B) enterprise report, and government-to-government (G2G) report. In the DDP scenario, we can send routine safety messages to risky drivers with potentially high-risk driver behavior, which can be recommended learning content based on their risk driver’s behavior and request to attend driving lecture or pass exams and drivers can get usage/based insurance pay as you drive for the safety messages.
The transformation of the physical driver behaviors into a digital service offers possibilities for delivering benefits to users and increases the value for them in using the service. Therefore, these services provide benefits to all different stakeholders, such as citizens, businesses, and government. In the G2C, individual DDPs can issue a violations and accidents history record in addition to the driver record to give wider background about the car’s record in term of usage before the purchasing decision. For G2G/G2B, business government DDPs can issue a vehicle history record which gives the decision makers a solid background about their car’s condition, thus they can easily decide which car can stay with the fleet and which car must be replaced [20]. G2B for insurance companies through the vehicle history report DDP can provide a clear insight about each car to help the insurance companies to review their pricing list and distinguish between a car in good condition and one in bad condition. After one year of collecting the driver’s data we can offer a forecast report about the probability of violation or accident occurrence for each insure.

3.3. DDP Components

The DDP components and functions are described in Figure 5, which provides an overview of the key part of a DDP that provide personalized content to enhance the driver behavior and rode safety. The design of a major intelligent recommendation platform has to provide a set of services and identifies the major functional components, while the relationships between these components were organized into the following four-fold system DDP content components and functions:
  • User profile contents processing and management;
  • Recommendation processing and services;
  • Driver behaviors analysis processing; and
  • Profile management and processing.
These four systems represent the core functionality of the platform, and the integration of data across the functional components to manage and store dynamic user profile processing is described as a separate functionality. This will enable the mass production of user-driven driver behavior-related decisions and provide a basis for creating the next-generation of driver behavior risk prediction. The DDP components and functions describe the recommender system processing functionality using user profile content processing and management, and are integrated into driver behavior analysis in hybrid learning recommendation processing using machine learning techniques. The DDP intends to use the user context in recommendations and provides adaptive contents that are reorganized according to the recommendation platform environments. This primarily comprises driver behaviors based on historical accident and violation record standard options, which include functional and nonfunctional requirements, further divided into an automatic configuration of behavior risk assessment and extraction of detailed dynamic profile elements.
Therefore, all four systems work together to prevent accidents and generate early warning alerts to the vehicles to provide safety services. Towards this aim, this work presents multiple contributions which are explained as follows:
  • The user profile contents processing and management system includes functions that allow the user to register and create a new profile, search and manage profile information, and process feedback into a system database. The user profile includes basic user information and external situational information such as location, time, etc. In the profile analysis, there is a process for storing profiles for users and providing patterns to each module which is linked with the profile module’s interface, shown in Figure 5.
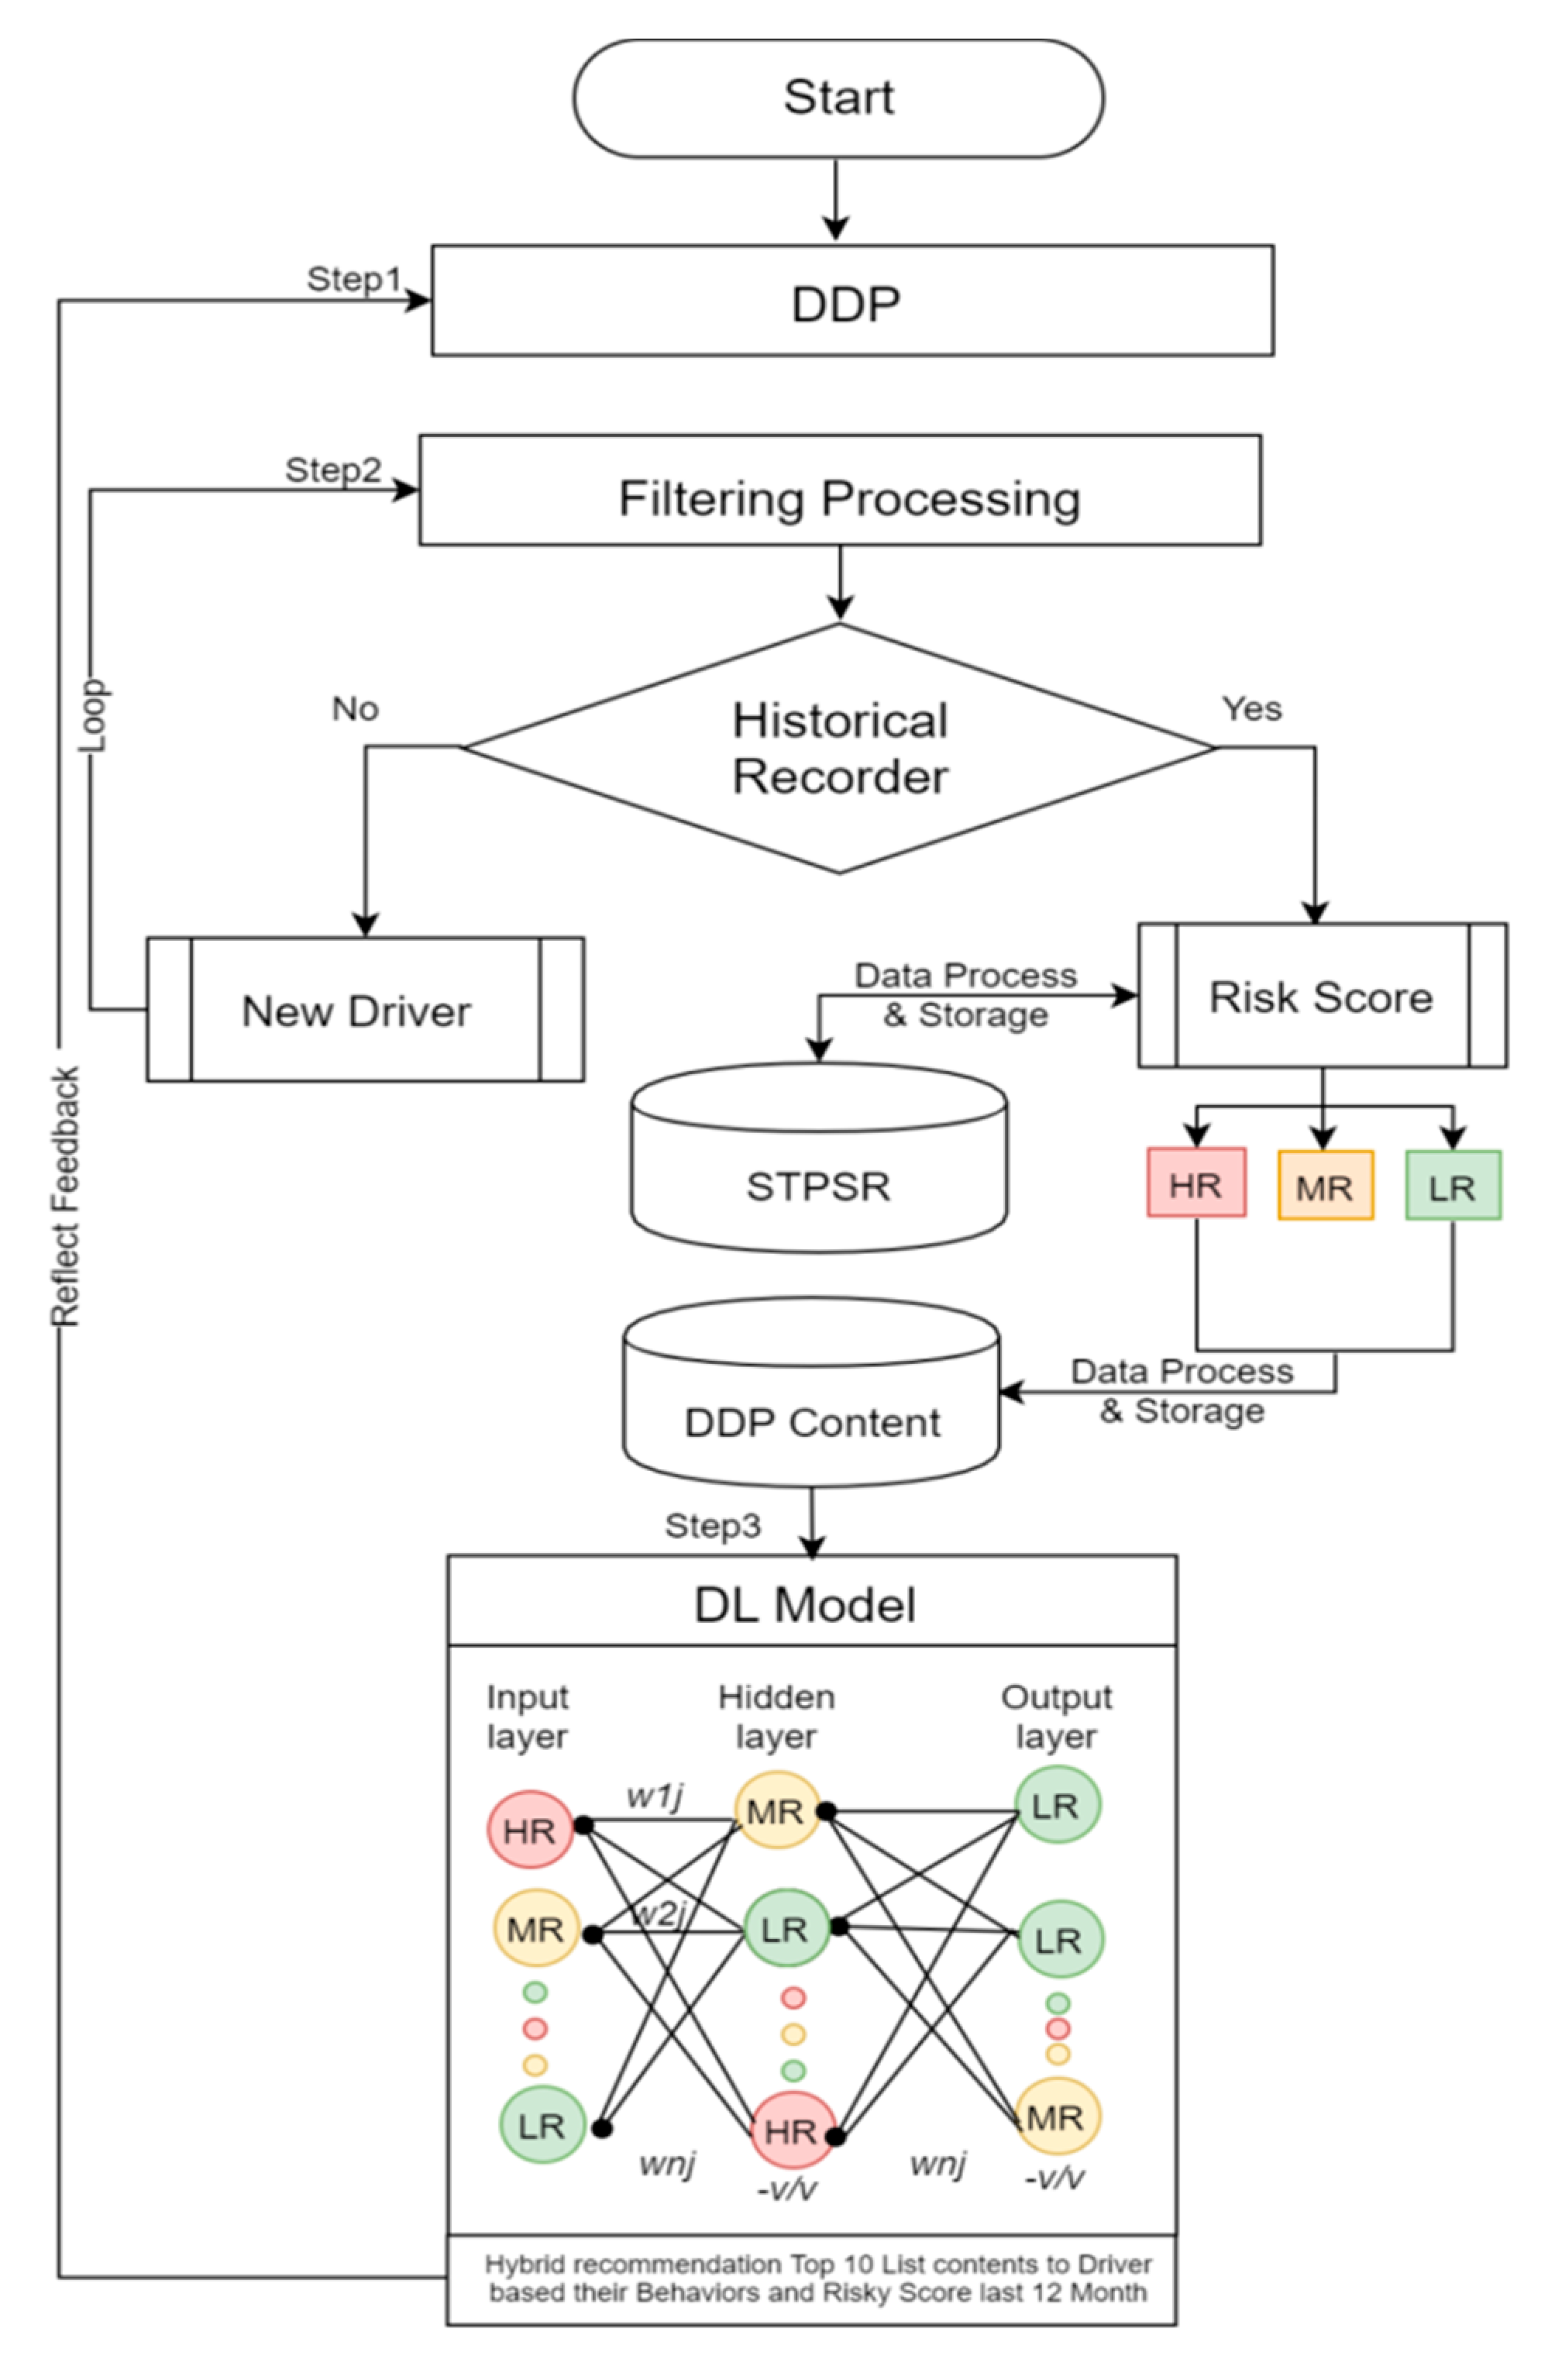
  • The recommendation processing and services model consists of three main functions, which are user and contents profile filtering, hybrid recommendations, and machine learning processing to provide content to users through integration of driver behaviors and the dynamic user’s profile contextual information. When a recommended list of contents is provided to users, prioritization of contents is made considering the user’s feedback as reflected and provided in the contents, and then the contents can be served according to the determined contents. The mobile application is an application that shows the contents to users, and it is also a module that transmits user profile information onto the platform.
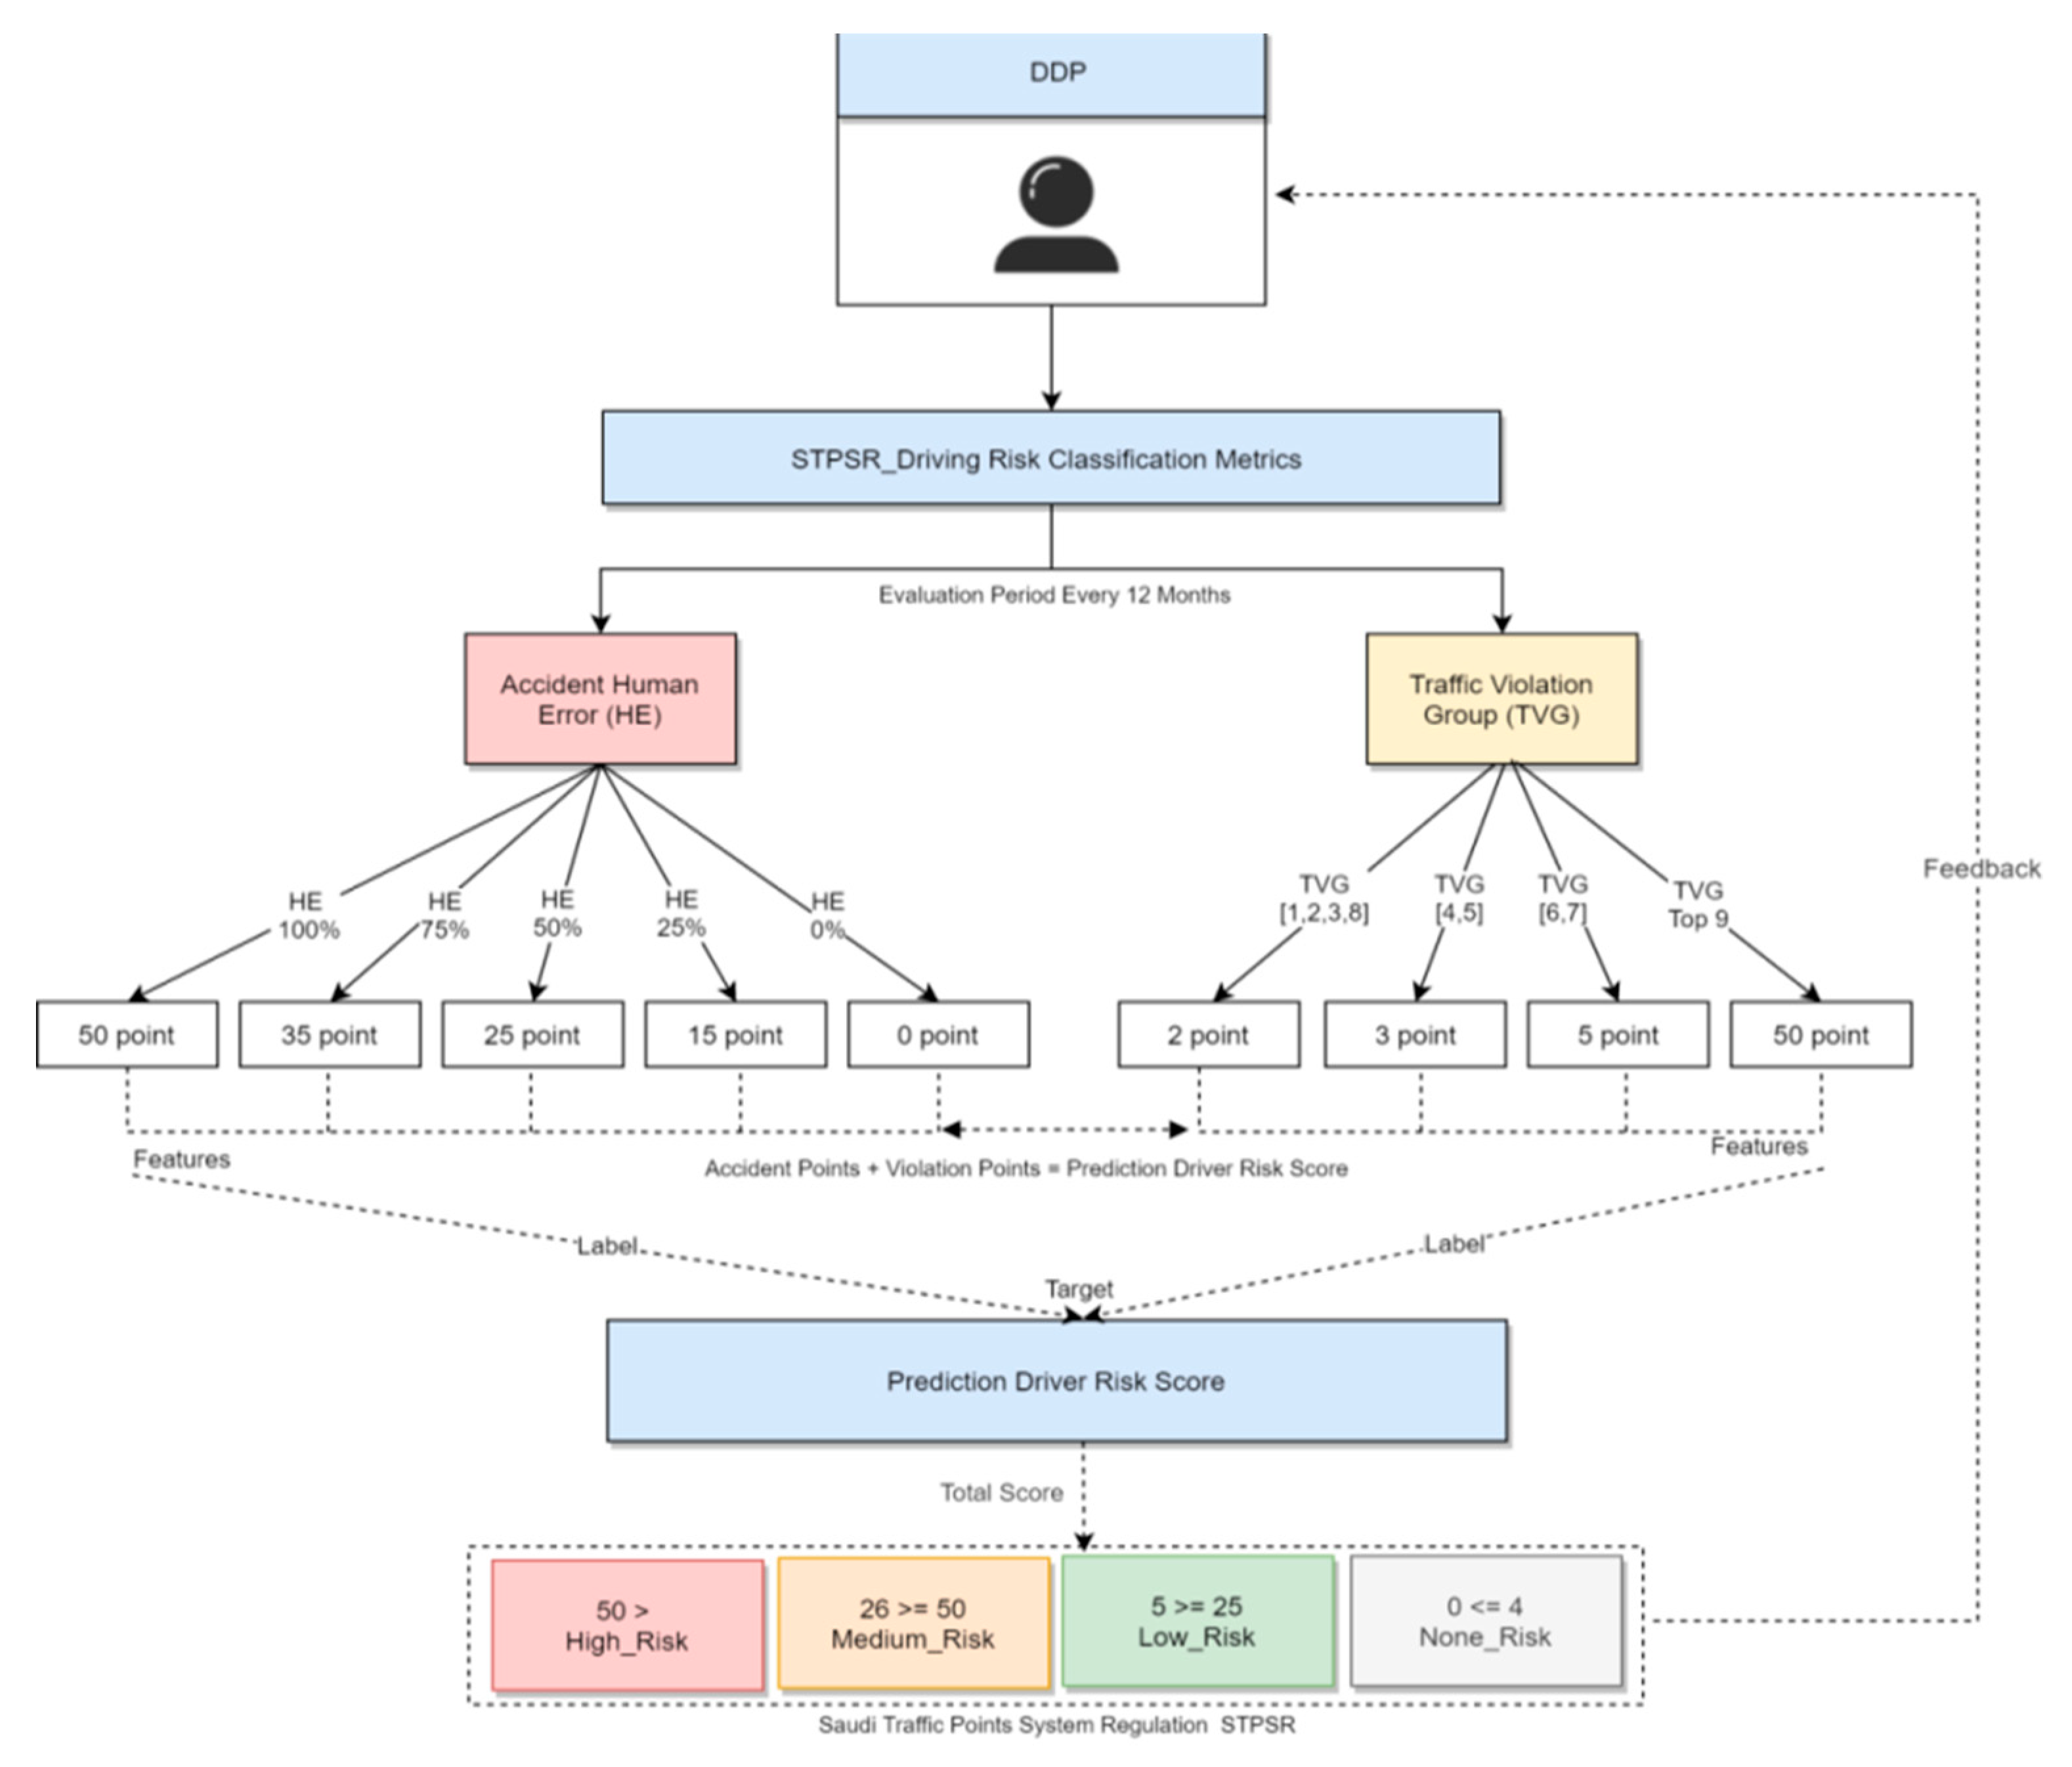
  • The driver behaviors risk analysis process uses rule-based classification, the risk matrix classifies the parameters using the Saudi Traffic Points System Regulation (STPSR). The rules for deciding the number of points calculated for every violation/accident of traffic regulation risk likelihood are divided into 4 risk score levels, which are high, medium, low risk, and no risk drivers, determined based on driver historical violation/accident records to predict current and future driver risk scores using the STPSR system. To predict the driver’s risk score we used this equation: human errors (HE) + violation group (VG) = prediction driver risk score (PDRS) during a 12 month period, as shown in Table 1.
  • Maintaining a single profile for the user preserves a consistent experience by giving the user an intuitive management system which is allowed by the profile management and feedback processing. Exchanging and managing refer to extracting driver risk behavior and user profile elements by analyzing profile contents, and then linking them with data storage. The content manager also automatically constructs contents generated by the STPSR index violation/accident, the DDP element analysis management, and the general effect/efficacy information of the driver risk behavior, and then stores them in the database. The effect of the information is generated from the feedback of the user and the profile information reflecting information stored in the profile databased. However, the first priority of this paper is to enhance the quality of road safety for the individual in the field of intelligent traffic recommendation services, which can be done by integrating the user and vehicle information, violation and accident records, and driver habits into integrated customized contents, which in turn requires hybrid learning recommendation processing [21].

4. Deep Learning Modeling and Data Classification for DDP

The core idea behind DDP processing is to apply deep learning processing by computing the similarity index as pre-processing between dynamic users’ profile and driver risk score content shown in Figure 6. Normalization of the input values is often performed to improve the training process speed. Typically the values are normalized between −1.0 and 1.0 and are encoded in such a manner so that each domain value is evaluated to one input unit.
Repetitive training of the network is a typical scenario in machine learning-based systems as this helps in achieving the best possible accuracy of a given model, and this can be done by choosing different network architectures and/or modifying the initial weights. Algorithm 1 presents the pseudo code for the proposed DDP hybrid learning recommendation processing. This was used in calculation for a comparison of the recommendation list (rec_ score_list) with the proposed, hybrid recommendation system based on DDP model algorithm.
Algorithm 1 Driver Accident/Violation Classification System
1: X ← User List
2: Y ← List of Varying User Lists
3: neuralnet.Create()
4: neuralnet.addLayer1
5: neuralnet.addLayer2
6: neuralnet.addLayer3
7: lossmsc.Compute()
8: epoch = 1000
9: for i in epoch do
10:     neuralnet.fit(X, Y)
11: return neuralnet.predictedval()
12: function SHOW ACCIDENT(ID, year)
13:     if numaccidents > 0 then
14:         print(ID, date, Vehicle No., Penalty Pts, Mistake)
15: function SHOW VIOLATIONS(ID, year)
16:     if numviolations > 0 then
17:         print(ID, date of stop, Vehicle No., Penalty Pts)
18: function SHOW DRIVER(ID)
19:     print(ID, Age, Gender, Nationality)
20: function EVALUATE DRIVER(ID, year, accidentdata, violationdata, driverdata)
21:     if totalpoints <= 4 then
22:         print(No Risk)
23:     else if totalpoints <= 25 then
24:         print(Low Risk)
25:     else if totalpoints <= 50 then
26:         print(Medium Risk)
27:     else if totalpoints > 50 then
28:         print(High Risk)
29: print(Total Penalty Points)
The proposed method has been implemented in a use case in the Saudi Arabian transportation system on three helper functions, to find the best drivers based on accident patterns and frequency, and the similarity function to calculate and return the similarity matrix in Table 2, to explain the python library’s function description, which uses the python environment and hybrid recommendation methods to enable an automatic intervention based on driver risk level. It also helps to solve the challenges in the recommender system, such as cold-starts for new users and low-accuracy in the data, to some extent, which are inherent in current recommendation engines.

4.1. Generating and Preprocessing DDP Dataset

In this section we explain the data-generating and preprocessing function that adapts dataset preparation to the process of transforming raw data so that the dataset can be analyzed and run by machine learning algorithms to uncover insights into predictions. This function is also used to create a model in machine learning by acquiring input datasets, preparing the data, defining the features, training and testing the model, and predicting new data output.
To generating the DDP dataset to implantation and evolution, the results in the dataset include driver’s information, registration of the vehicle, and violations and accident records; the purpose of this data is to identify driver risk behaviors. In addition, we used a dataset that includes accidents in Saudi Arabia from 2015 to 2018. Then, we created a dynamic driver profile that includes GPS trajectories for multiple driver trips in Saudi Arabia and their events, which are identified using INS navigation devices. We will depend on the count of risky actions performed by drivers, such harsh acceleration, harsh turns, and harsh brakes. The more of these risky events that occurred, the riskier the driver was determined to be. Table 2 shows the four generated driver dataset records containing user (driver) information, vehicle information, and functional or behavioral events recorded in the event column in the Table 3, in addition to the metadata as recorded in the Table 4.

4.2. Analysis of Accidents in Saudi Arabia

According to a recent estimate, there are more than 6 million cars on the road in KSA. Road traffic injuries (RTIs) are a leading cause of mortality and negatively affect the quality of life in Saudi Arabia, as shown in Figure 7. The high number of casualties due to RTIs in Saudi Arabia is the highest among high-income countries and is also considered the primary reason behind the deaths for males in the age range of 16–30 years old. Therefore, a major goal towards reaching the top 5 most livable countries is to decrease traffic deaths. A research study and analysis indicates that accident/injury in Mecca city is very high in comparison to other cities in Saudi Arabia, which needs to be studied to provide a solution to the factors that contribute to Mecca having the highest number of accidents [4].

4.3. Predicting Driver Risk Classification

The basic idea of the model fitting process is to use drivers’ two year prior violation and accidents records (using prior features to predict their future driving risk based on two years). Table 5 shows the driving behavior evolution parameters based on record violation and accidents, then the classification of drivers who are sorted into the categories of HR, MR, or LR. The model was established to predict drivers’ risk behaviors based on their record from the previous two years. In measuring driving risk, if the driver varies over time the driver can be defined as HR in one observation period (e.g., 2015–2016) but LR in another period (e.g., 2015–2017) based on their accident records to implement DDP that evaluates drivers and identifies which one is a safe driver and which one is a risky driver. Here we used a dataset that includes accident and violation historical records for multiple drivers in Saudi Arabia and their risk scores that were identified using STPSR Risk Metrics.
We will depend on the count of the risky actions performed by drivers, like the violation/accident records, to predict that the more these risky actions occurred, the riskier the driver. Figure 8 shows the proposed solution to the driver risk criteria that we used in the classification approaches, but it can be modified based on the Saudi traffic regulation system using the driver risk score classification and hybrid recommendation system prediction methods.

4.4. Accident and Violation Classification

The accident and violation classification mechanism is considered to convert human error “driver-mistake” percentages to penalty points. For example, a mistake of 13% will be converted to 0 points since its within scenario 5, Grouping violations based on the Saudi violation lists, based on STPSR category 10, which is a special category which groups the highest penalties (50 pts). The proposed hybrid recommendation system has considered machine learning to analyze the risky driver score model which is shown in Figure 9. The basic idea of the model fitting process is to use drivers’ Q3 prior violation and accidents records each year, as shown in Table 4 and Table 5, using prior features to predict their future driving risk based on the last 5 years. Driving behavior evolution parameters based on record violation and accidents then classify the driver’s risk level. The machine learning model predicts the driver’s risk behaviors based on their behaviors in the previous 5 years.

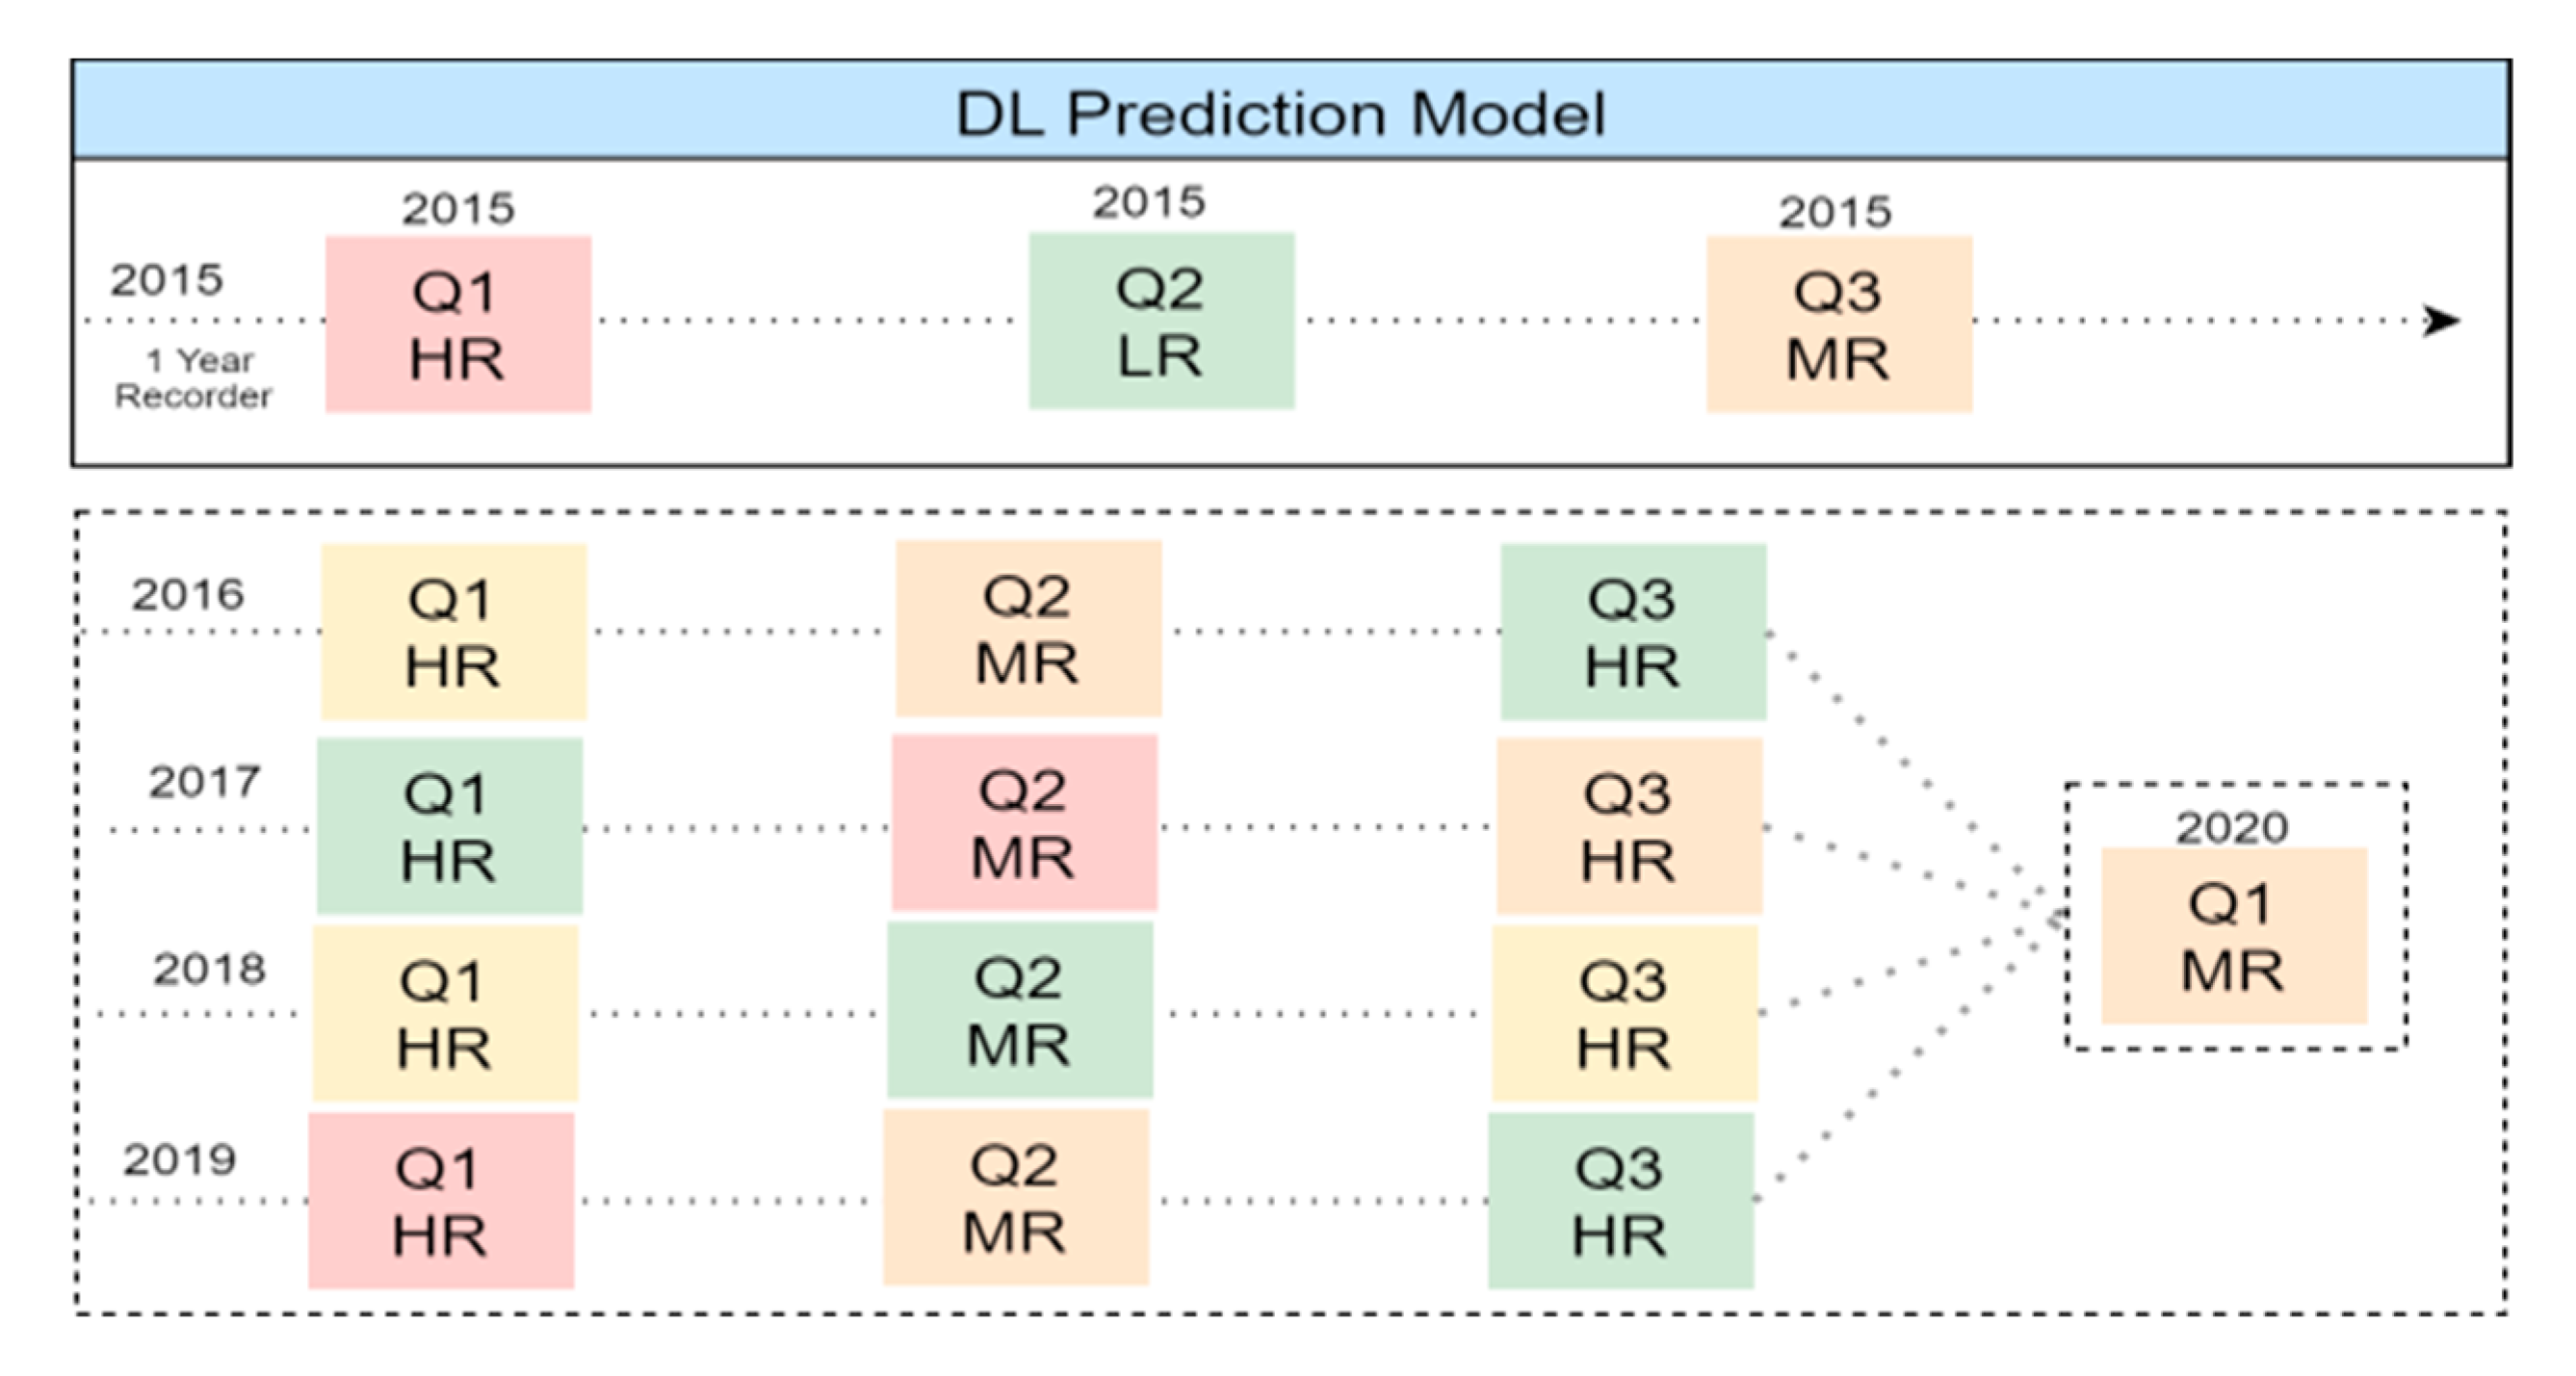
4.5. Measure Driving Risk: Driver Varies over Time

A driver can be defined as HR in one observation period (e.g., 2018–2019) but LR in another period (e.g., 2017–2018) based on their accident records. The driver risk score will take the average of the previous 5 years’ total points to predict driving risk factors based on the Saudi traffic points system using historical violation and accident records shown in Figure 10.
Collaborative filtering (CF) is a recommendation algorithm that can utilize the previous user’s rating to identify the new user’s similarity based on their behavior, and thus predict the new user’s preferences on further items. It works as a one-to-one matching algorithm. In this algorithm, other users’ data can be used to provide an appropriate prediction of the current users’ preferences. The algorithm assumes that the new user does not have any historical actions, besides the rating user-user matrix process on the similarity function sim:(user1 × user2), CF: u/u calculated using the Euclidean distance similarity at Equation (1) and shown in Table 6.
Euclidean   Distance   Similarity = n = 1 n ( x i y i ) 2 .
From these results we can see that driver risk evolution loops the start time every 12 month from 1 January to 31 December for the risk records of either accident or violation. Each driver’s recorded risk score become zero and a new loop starts every year. For calculating the driver risk score we used a parallel recorder for (each 1 year) + (average of 5 years) in the ML model prediction; using the 5 year average, then classifying driver risk score results. This proposed algorithm processing and filtering of dynamic context extraction and context reasoning combine the context information from smartphone sensors and user profile and preferences to improve the efficiency and usability of the recommendation by Equation (2) and Table 7.
similarity ,   sim ( u i d i , tp i ) = i = 1 n ( u i d i tp i ) 2 × u i d i i = 1 n u i d i
where: uidi: user id &   tp i : total points risk score id, calculated using the Cosine.

5. Performance and Evaluation

In this section, the experimenting and evaluation phase steps are presented, which were calculated for a comparison of the recommendation list (rec_ score_list) with the proposed hybrid recommendation system based on the DDP model. The experiments were conducted to verify the performance of the proposed DDP. In this experiment, rec_score_list stored the actual values for each datapoint. The error values were calculated and compared using a variety of minimum error computation functions. A low error value for the predicted value signifies a higher accuracy of being close to the actual correct value. In contrast, a higher error value signifies that the predicted value becomes less important for the recommendation outputs. The experiments proceeded in the following environment, to be explained in the next section.

5.1. Experimental Environment

We used python language to process the data analysis and prediction. These experiments were performed using several python libraries. The algorithm uses three matrix error models, namely MAE, MAPE, and MSE, to evaluate the recommendation results. First, we started with the classification function, which was used to classify a driver, given driver ID. To define the accident/violation classification function based on driver ID we applied the hybrid score risk list. The model used mean squared error as loss function, Adam as optimizer, and accuracy and mean absolute error (MAE) as metrics during training. The model was run for 1000 epochs with 15% data as validation data. Next, there was a function for showing accident data, violation data for a particular year, and a function for printing driver details. Finally, the driver was classified using the penalty points from accident data and violation data.
From the experimental algorithm, we have tried to obtain the top 5 drivers that have the greatest number of violations in our dataset, obtaining the data of the top driver with most violations, driver ID (A53160534/40, A51132989/40, A35359040/40, A30901291/39, A51406120/39) and accidents, total number of violations per year for selected driver, and total number of accidents per year for selected driver. Next we prepared data for the visualization of violations, visualizing the violations and accident data for the top driver, ID: A51132989. Violation records from the years 2015 to 2020 are shown in Figure 11 and Figure 12.
Moreover, we can see in the Figure 11 and Figure 12, where the top driver has recorded 40 violations and 18 accidents in total from 2015 to 2020; however in the last 2 years (2018–2019) there were 19 violations and 6 accidents, the total number of medium risk violations made in the last 2 years was 6 violations, the total number of low risk violations made in the last 2 years was 7 violations, the total number of high risk accidents occurring in the last 2 years was 0 accidents, the total number of medium risk accidents occurring in the last 2 years was 2 accidents, and the total number of low risk accidents occurring in the last 2 years was 5 accidents. Based on the last few calculations we can classify the driver based on the total count of violations and accidents sorted into the categories of of high, medium, and low risk events occurring in the last 2 years. We can see that the driver was involved in 19 violations and 7 accidents in the last 2 years. We can say that the total number of events was 26. There were 6 high risk violations, while there were no high risk accidents, and that means that there were 6 high risk events occurring in the last 2 years. There were 6 medium risk violations, and there were 2 medium risk accidents, and that means that there were 8 medium risk events occurring in the last 2 years. There were 7 low risk violations, while there were 5 low risk accidents, and that means that there were 12 low risk events occurring in the last 2 years. From this we can calculate the percentage of events in each category for the driver as high risk category 6/26 × 100 = 23%, medium risk category 8/26 × 100 = 31%, and low risk category 12/26 × 100 = 46%. From these calculations we can say that because 46% of events were low risk, and because the percentage is lower than half of the total, so we should treat him as medium risk and give him all of the instructions that should follow when a medium risk driver is identified. Also we can make the percentage increase or decrease using the layer recording the previous 2 years; if by this criteria the percentage of low risk events is higher than the current percentage then the driver’s rate will decrease because their behaviors has become more reckless, and also because the driver will be sent warnings and advice based on the kind of violations made or accidents occurring. If the low risk percentage of the previous layer is less than the current layer, that means that the driver’s behaviors are becoming less risky and their rate should be increased and they should be rewarded to encourage the driver to get better.

5.2. Model Performance Evaluation

The models’ performance was evaluated using several error calculation formulae, shown in Table 8.
The error values calculated using MAE were calculated as shown in Table 8. Prediction accuracy was a formal model to compute the aggregated error values using a combination of MAE, MAPE, and MSE error functions over the period of 2015 to 2020. The calculation results of error numbers using MSE, showing the lowest error value that can solve cold-start and scalability issues in MAE by 0.85/0.56 and MSE about 5.23/4.32, are shown in Table 9. Figure 13 provides a way to calculate error values of MAE, MAPE, and MSE over 5 years from 2015 to 2020, comparing the proposed deep learning DDP model to predictions for 2020. Unlike MAE, it squares the values to weigh in on the higher error values. Doing so penalizes the higher error scores compared to the lower error scores; according to the rec_list results, the least error value was generated when good results were shown with MAE.

6. Conclusions

In this paper we have proposed a novel approach for continuous monitoring of driver, motion, and road analysis to prevent accidents, and described a use case of its implementation. We have achieved the motion prediction by using deep learning methods. In this paper, we have introduced a dynamic driver profile (DDP) for behavior risk prediction using recommendation based on deep learning methods to enable automatic interventions for the safety of the driver, which works upon three major sets of attributes that predict the motion accurately. First, we propose the high level architecture for the DDP and components forming the overall architecture. Then, the interactive deep learning process design is illustrated. Training for the prediction models is expected by way of the participant’s driver historical accident and violation records, and deep learning recommendation based on driver feedback and performance. Finally, some preliminary scenarios and experiment results are shown, and a discussion on future directions is presented. We envisage the proposed system to be digitally implemented and behaviorally designed to predict driver risk behavior and minimize the numbers of high-risk drivers. The road analysis was constructed as a Bayesian dependency graph, which is updated frequently to maintain a solid record of road conditions, and early warning alerts are generated for all risky drivers that could improve the overall recommendation performance. A feedback-based update is also presented to improve the accuracy of the prevention platform. For the future development of the recommendation system, the perceptron DDP learning model used for deep learning algorithms and other machine learning techniques such as reinforcement learning can be used to improve the current research and overcome limitations [22]. In addition, experiments on recommendation accuracy and error frequency are required that can improve the scalability and latency performance.

Author Contributions

R.N. conceived and worked on the paper, R.N. and M.S. performed the primary hybrid learning method, works on analyzed the dataset, related work, performance analysis, M.S. and D.S. reviewed and edited the manuscript. All authors have read and agreed to the published version of the manuscript.

Funding

This research received no external funding.

Institutional Review Board Statement

Not applicable.

Informed Consent Statement

Not applicable.

Data Availability Statement

All data and models used during this research are confidencial in nature and may only be provided with restrictions.

Acknowledgments

This work was supported by Deputy for Research and Innovation RDO in the Ministry of Education in Saudi Arabia. We would also like to thank Emad Felemban from the College of Computing and Information System at Umm Al-Qura University (UQU) and ReSENSE Lab at HUFS for their collaboration in this project. In this project, Rayan Nouh was supported by UQU for completed his Postdoctoral Fellow Program in 2020. Dhananjay Singh was supported by Hankuk University of Foreign studies (HUFS) and Madhusudan Singh was supported by Woosong University academic research in 2021.

Conflicts of Interest

The authors declare no conflict of interest.

References

  1. Singh, D.; Singh, M. Internet of Vehicles for Smart and Safe Driving. In Proceedings of the International Conference on Connected Vehicles and Expo (ICCVE), Shenzhen, China, 19–23 October 2015. [Google Scholar]
  2. WHO. Available online: https://www.who.int/news-room/fact-sheets/detail/road-traffic-injuries (accessed on 26 April 2021).
  3. Petraki, V.; Ziakopoulos, A.; Yannis, G. Combined impact of road and traffic characteristic on driver behavior using smartphone sensor data. Accid. Anal. Prev. 2020, 144, 105657. [Google Scholar] [CrossRef] [PubMed]
  4. Absher, M.O.I. STPSR Traffic Violations & Penalties, Category, Violations, Extra Measures That Might Be Taken Thereon, Ministry of Interior, Kingdom of Saudi Arabia, National Information Center. 2017. Available online: www.moi.gov.sa (accessed on 19 August 2020).
  5. Yadav, P.; Jung, S.; Singh, D. Machine Learning-based Real-Time Vehicle Data Analysis for Safe Driving Modeling. In Proceedings of the 34th ACM/SIGAPP Symposium on Applied Computing (SAC), Limassol, Cyprus, 8–12 April 2019; pp. 1355–1358. [Google Scholar]
  6. Minhas, A.A.; Jabbar, S.; Farhan, M.; Islam, M.N.U. Smart methodology for safe life on roads with active drivers based on real-time risk and behavioral monitoring. J. Ambient. Intell. Humaniz. Comput. 2019, 1–13. [Google Scholar] [CrossRef]
  7. Zhao, H.; Yu, H.; Li, D.; Mao, T.; Zhu, H. Vehicle Accident Risk Prediction Based on AdaBoost-SO in VANETs. IEEE Access 2019, 7, 14549–14557. [Google Scholar] [CrossRef]
  8. Benterki, A.; Boukhnifer, M.; Judalet, V.; Maaoui, C. Artificial Intelligence for Vehicle Behavior Anticipation: Hybrid Approach Based on Maneuver Classification and Trajectory Prediction. IEEE Access 2020, 8, 56992–57002. [Google Scholar] [CrossRef]
  9. Xing, Y.; Lv, C.; Cao, D. Personalized Vehicle Trajectory Prediction Based on Joint Time-Series Modeling for Con-nected Vehicles. IEEE Transact. Veh. Technol. 2020, 69, 1341–1352. [Google Scholar] [CrossRef]
  10. Abbas, M.T.; Jibran, M.A.; Afaq, M.; Song, W. An adaptive approach to vehicle trajectory prediction using multimodel Kalman filter. Trans. Emerg. Telecommun. Technol. 2020, 31. [Google Scholar] [CrossRef]
  11. Jeong, Y.; Kim, S.; Yi, K. Surround Vehicle Motion Prediction Using LSTM-RNN for Motion Planning of Autonomous Vehicles at Multi-Lane Turn Intersections. IEEE Open J. Intell. Transp. Syst. 2020, 1, 2–14. [Google Scholar] [CrossRef]
  12. Li, P.; Abdel-Aty, M.; Yuan, J. Real-time crash risk prediction on arterials based on LSTM-CNN. Accid. Anal. Prev. 2020, 135, 105371. [Google Scholar] [CrossRef] [PubMed]
  13. Mallidi, S.K.; Vangipurapu, V.V. IoT Based Smart Vehicle Monitoring System. Int. J. Res. Comput. Sci. 2018, 9, 738–741. [Google Scholar] [CrossRef]
  14. Chang, W.; Chen, L.; Su, K. DeepCrash: A Deep Learning-Based Internet of Vehicles System for Head-On and Sin-gle-Vehicle Accident Detection With Emergency Notification. IEEE Access 2019, 7, 148163–148175. [Google Scholar] [CrossRef]
  15. Rehman, G.-U.; Ghani, A.; Zubair, M.; Naqvi, S.H.A.; Singh, D.; Muhammad, S. IPS: Incentive and Punishment Scheme for Omitting Selfishness in the Internet of Vehicles (Iov). IEEE Access 2019, 7, 109026–109037. [Google Scholar] [CrossRef]
  16. Bylykbashi, K.; Qafzezi, E.; Ikeda, M.; Matsuo, K.; Barolli, L. Fuzzy-based Driver Monitoring System (FDMS): Im-plementation of two intelligent FDMSs and a testbed for safe driving in VANETs. Future Gener. Comput. Syst. 2020, 105, 665–674. [Google Scholar] [CrossRef]
  17. Bhatti, F.; Shah, M.A.; Maple, C.; Islam, S.U. A Novel Internet of Things-Enabled Accident Detection and Reporting System for Smart City Environments. Sensors 2019, 19, 2071. [Google Scholar] [CrossRef] [PubMed] [Green Version]
  18. Kunt, M.M.; Aghayan, I.; Noii, N. Prediction for traffic accident severity: Comparing the artificial neural network, genetic algorithm, combined genetic algorithm and pattern search methods. Transport 2012, 26, 353–366. [Google Scholar] [CrossRef] [Green Version]
  19. Lu, L.; Yuan, Y.; Chen, X.; Li, Z. A Hybrid Recommendation Method Integrating the Social Trust Network and Local Social Influence of Users. Electronics 2020, 9, 1496. [Google Scholar] [CrossRef]
  20. Zambrano-Martinez, J.L.; Calafate, C.T.; Soler, D.; Cano, J.-C.; Manzoni, P. Modeling and Characterization of Traffic Flows in Urban Environments. Sensors 2018, 18, 2020. [Google Scholar] [CrossRef] [PubMed] [Green Version]
  21. Jamal, A.; Rahman, M.T.; Al-Ahmadi, H.M.; Mansoor, U. The Dilemma of Road Safety in the Eastern Province of Saudi Arabia: Consequences and Prevention Strategies. Int. J. Environ. Res. Public Health 2019, 17, 157. [Google Scholar] [CrossRef] [PubMed] [Green Version]
  22. Kasana, R.; Kumar, S.; Kaiwartya, O.; Yan, W.; Cao, Y.; Abdullah, A.H. Location error resilient geographical routing for vehicular ad-hoc networks. IET Intell. Transp. Syst. 2017, 11, 450–458. [Google Scholar] [CrossRef] [Green Version]
Figure 1. DDP based on hybrid recommendation system architecture.
Sensors 21 03893 g001
Figure 2. SafeDrive architecture for three-tier alert system.
Sensors 21 03893 g002
Figure 3. Hybrid approach based recommendation system techniques.
Sensors 21 03893 g003
Figure 4. DDP—dynamic driver profile features.
Sensors 21 03893 g004
Figure 5. DDP components and functions.
Sensors 21 03893 g005
Figure 6. Deep learning prediction model.
Sensors 21 03893 g006
Figure 7. Number of accident and injuries in Saudi Arabia.
Sensors 21 03893 g007
Figure 8. Driver risk classification based on STPSR model risk.
Sensors 21 03893 g008
Figure 9. DL prediction model for driver risk classification.
Sensors 21 03893 g009
Figure 10. The visualization of top driver’s violations records.
Sensors 21 03893 g010
Figure 11. The visualization of top driver’s accident records.
Sensors 21 03893 g011
Figure 12. Performance analysis of predication accuracy.
Sensors 21 03893 g012
Figure 13. Performance analysis of predication accuracy.
Sensors 21 03893 g013
Table 1. Driver risk metrics based on the STPSR system.
Accident Points System Human Errors (HE)Traffic Violation Groups (VG)Predication Driver Risk Score (PDRS) Every 12 Month
  • HE 100% = 50 points
  • HE 75% = 35 points
  • HE 50% = 25 points
  • HE 25% = 15 points
  • HE 0% = 0 points
  • VG1,2,3,8 = 2 points
  • VG4,5 = 3 points
  • VG6,7 = 5 points
  • VG9_Top Risk = 50 points
Total PointsRisk Group
0 ≤ 4None
5 ≥ 25Low
26 ≥ 50Med
50>High
Table 2. Generated driver’s dataset.
National_IDAgeGenderLicenseNationality
09092893843MYesIndian
18354566174FYesPakistani
20731607289MExpiredSAUDI Arabs
30767759034MExpiredPakistani
42258453123FYesIndian
Table 3. Generated drivers and vehicle dataset.
Driver IDVehicleVehicle_NumberVehicle TypeMakeModelYearColor
073702-Automobile-HONDA-ACCORD-1990.0-BLUECXP 1042Autmobile HONDAACCORD1990.0BLUE
177102-Automobile-HONDA-FIT-2010.0-SILVERMNZ 7882Autmobile HONDAFIT2010.0SILVER
2223602-Automobile-BMW-2S-2007.0-SILVEROBV 5462Autmobile BMW2S2007.0SILVER
3404602-Automobile-HONDA-ACCORD-2013.0-BLACKALG 8282Autmobile HONDAACCORD2013.0BLACK
4444502-Automobile-HONDA-ACCORD-1998.0-GREENDDL 0412Autmobile HONDAACCORD1998.0GREEN
Table 4. Event based driver’s dataset.
Driver IDEventLatitudeLongitudeSpeed (km/h)Time Stamp (TS)
0Timed Event34.186631−118.08810264.02020-11-01 00:00:02.430
0Distance Event34.186060−118.08924153.02020-11-01 00:00:05.600
0Distance Event34.186408−118.08956034.02020-11-01 00:00:13.640
0Distance Event34.187479−118.08891533.02020-11-01 00:00:26.070
0Distance Event34.188665−118.08645932.02020-11-01 00:00:35.090
0Distance Event34.188171−118.08727947.02020-11-01 00:00:46.330
0Distance Event34.189409−118.08642024.02020-11-01 00:00:55.320
0Timed Event34.188765−118.08608635.02020-11-01 00:01:02.770
0Distance Event34.189057−118.08511243.02020-11-01 00:01:06.610
0Distance Event34.190146−118.08393548.02020-11-01 00:01:14.530
Table 5. DDP deep learning model parameters.
ParametersExplain
HR, MR.LRDriver ID/risk criteria _initial input unityi
WnjWeight_increased, decreased
v/vBiasValue = (−1.0 and 1.0)
knnk-nearest neighbors learning methods
Table 6. Driver risk score over 5 years processing by CF user/user similarity matrix.
USER/QuartersYear 1Year 2Year 3Year 4Year 5
Q1Q2Q3Q1Q2Q3Q1Q2Q3Q1Q203Q1Q2Q3
U1SP_LR16P_LR13P_LR2P_NR0P_NR4P_NR90P_HR53P_HR79P_HR27P_MR35P_MR50P_MR63P_HR70P_HR83P_HR
U20P_NR0P_NR2P_NRBP_LR12P_LR20P_LR66P_HR83P_HR54P_HR72P_HR55P_HRB0P_HR22P_MR30P_MR48P_MR
U366P_HR52P_HR72P_HR49P_MR36P_MR28P_MR25P_LR13P_LR6P_LRSSP_HR62P_HR52P_HR86P_HR90P_HR95P_HR
U428P_MR40P_MR38P_MRSP_LR12P_LR24P_LR2P_NR2P_NR2P_NR86P_HR60P_HR75P_HR36P_MR48P_MR28P_MR
U570P_HR75P_HRSSP_HR4P_NR4P_NR4P_NR47P_MR28P_MR45P_MRSP_LR24P_LR16P_LR0P_NR2P_NR0P_NR
Table 7. Driver risk score average over 5 years.
USERY1Y2Y3Y4Y5Total Points5 Years AverageRisk Score Results
U124P_LR2P_NR53P_HR50P_MR53P_HR18236.4Medium-Risk
U24P_NR15P_LR75P_HR83P_HR26P_MR20340.6Medium-Risk
U359P_HR50P_MR25P_LR83P_HR53P_HR27054.0High-Risk
U437P_MR6P_LR2P_NR90P_HR32P_MR16733.4Medium-Risk
U565P_H R4P_NR40P_MR10P_LR0P_NR11923.8Low-Risk
Table 8. Formulas of MAE, MAPE, and MSE evaluation criteria.
Evaluation CriteriaFormulaFunctional
MAE 1 n 1 n | d i d ^ i | Mean absolute error is less sensitive to the outlier values and cannot solve the scalability issues.
MAPE 100 n 1 n d i d ^ i d i Mean absolute percentage error works in a similar manner to MAE but is normalized by true observation. It measures the recommendation accuracy in percentage.
MSE 1 n 1 n ( d i d ^ i ) 2 Mean squared error is capable of solving the cold-start and scalability issues as it works by measuring the combination of both bias and variance.
Table 9. Performance analysis of average error value and predication accuracy.
Comparison of the Proposed DPP Predication Model During 5-Years Top Recommendation List of Average Error ResultsDDP
Model201520162017201820192020
Prediction
rec_list
(MAE)
54.78/55.3379.5/79.675.17/75.7280.22/82.7782.379/83.44387.11/88.41
rec_list
(MAPE)
68.12/68.6772.25/72.8186.45/8785.14/86.6987.329/88.38489.16/90.18
rec_list
(MSE)
77.9/77.6469.65/70.284.3/84.5887.6/88.1588.369/89.42494.16/95.12
Publisher’s Note: MDPI stays neutral with regard to jurisdictional claims in published maps and institutional affiliations.

