1. Introduction
Spectral Imaging is a technique in which spectral information is shown as the third dimension of a two-dimensional spatial image (sometimes called a cube image). It was first proposed for remote sensing of Earth in 1985 [
1]. Spectral imaging is popular in many scientific and engineering fields, including satellite-based remote sensing [
2], agriculture [
3], defense [
4], medical diagnostics [
5], food inspection [
6], etc. In the listed applications, the spectrum of light emitted from a light source after having been diffusely reflected in the surface of various materials is analyzed. The illumination can be ambient light from the sun or an active source of illumination such as halogen lamps, xenon lamps, or LEDs. The reflection of light is a process that creates unique spectral signatures depending on the material composition of the reflecting surface [
7]. Consequently, spectral imaging allows for the recording of unique spectral signatures in two dimensions such that the use of a trained classifier can determine the surface material at each individual pixel [
8].
Spectral imaging is further divided into Multi-Spectral Imaging (MSI), Hyper-Spectral Imaging (HSI), and Ultra-Spectral Imaging. These abstractly defined divisions are based on spectral resolution, the number of spectral bands, and the width and gap between the bands. MSI generally collects spectral data in up to 10 different bands, which are generally non-contiguous, while HSI is able to collect data in hundreds of bands. Spectral imaging sensors collect information as a set of ‘images’. Each image represents a narrow wavelength range of the electromagnetic spectrum, also known as a spectral band. These images are combined to form a three-dimensional hyper-spectral data cube I(x, y, λ) for processing and analysis, were I represents intensity (or digital number), x and y represent two spatial dimensions of the scene, and λ represents the spectral dimension (comprising a range of wavelengths). The precision of these sensors is typically measured in spectral resolution, which is the width of each band of the spectrum that is captured.
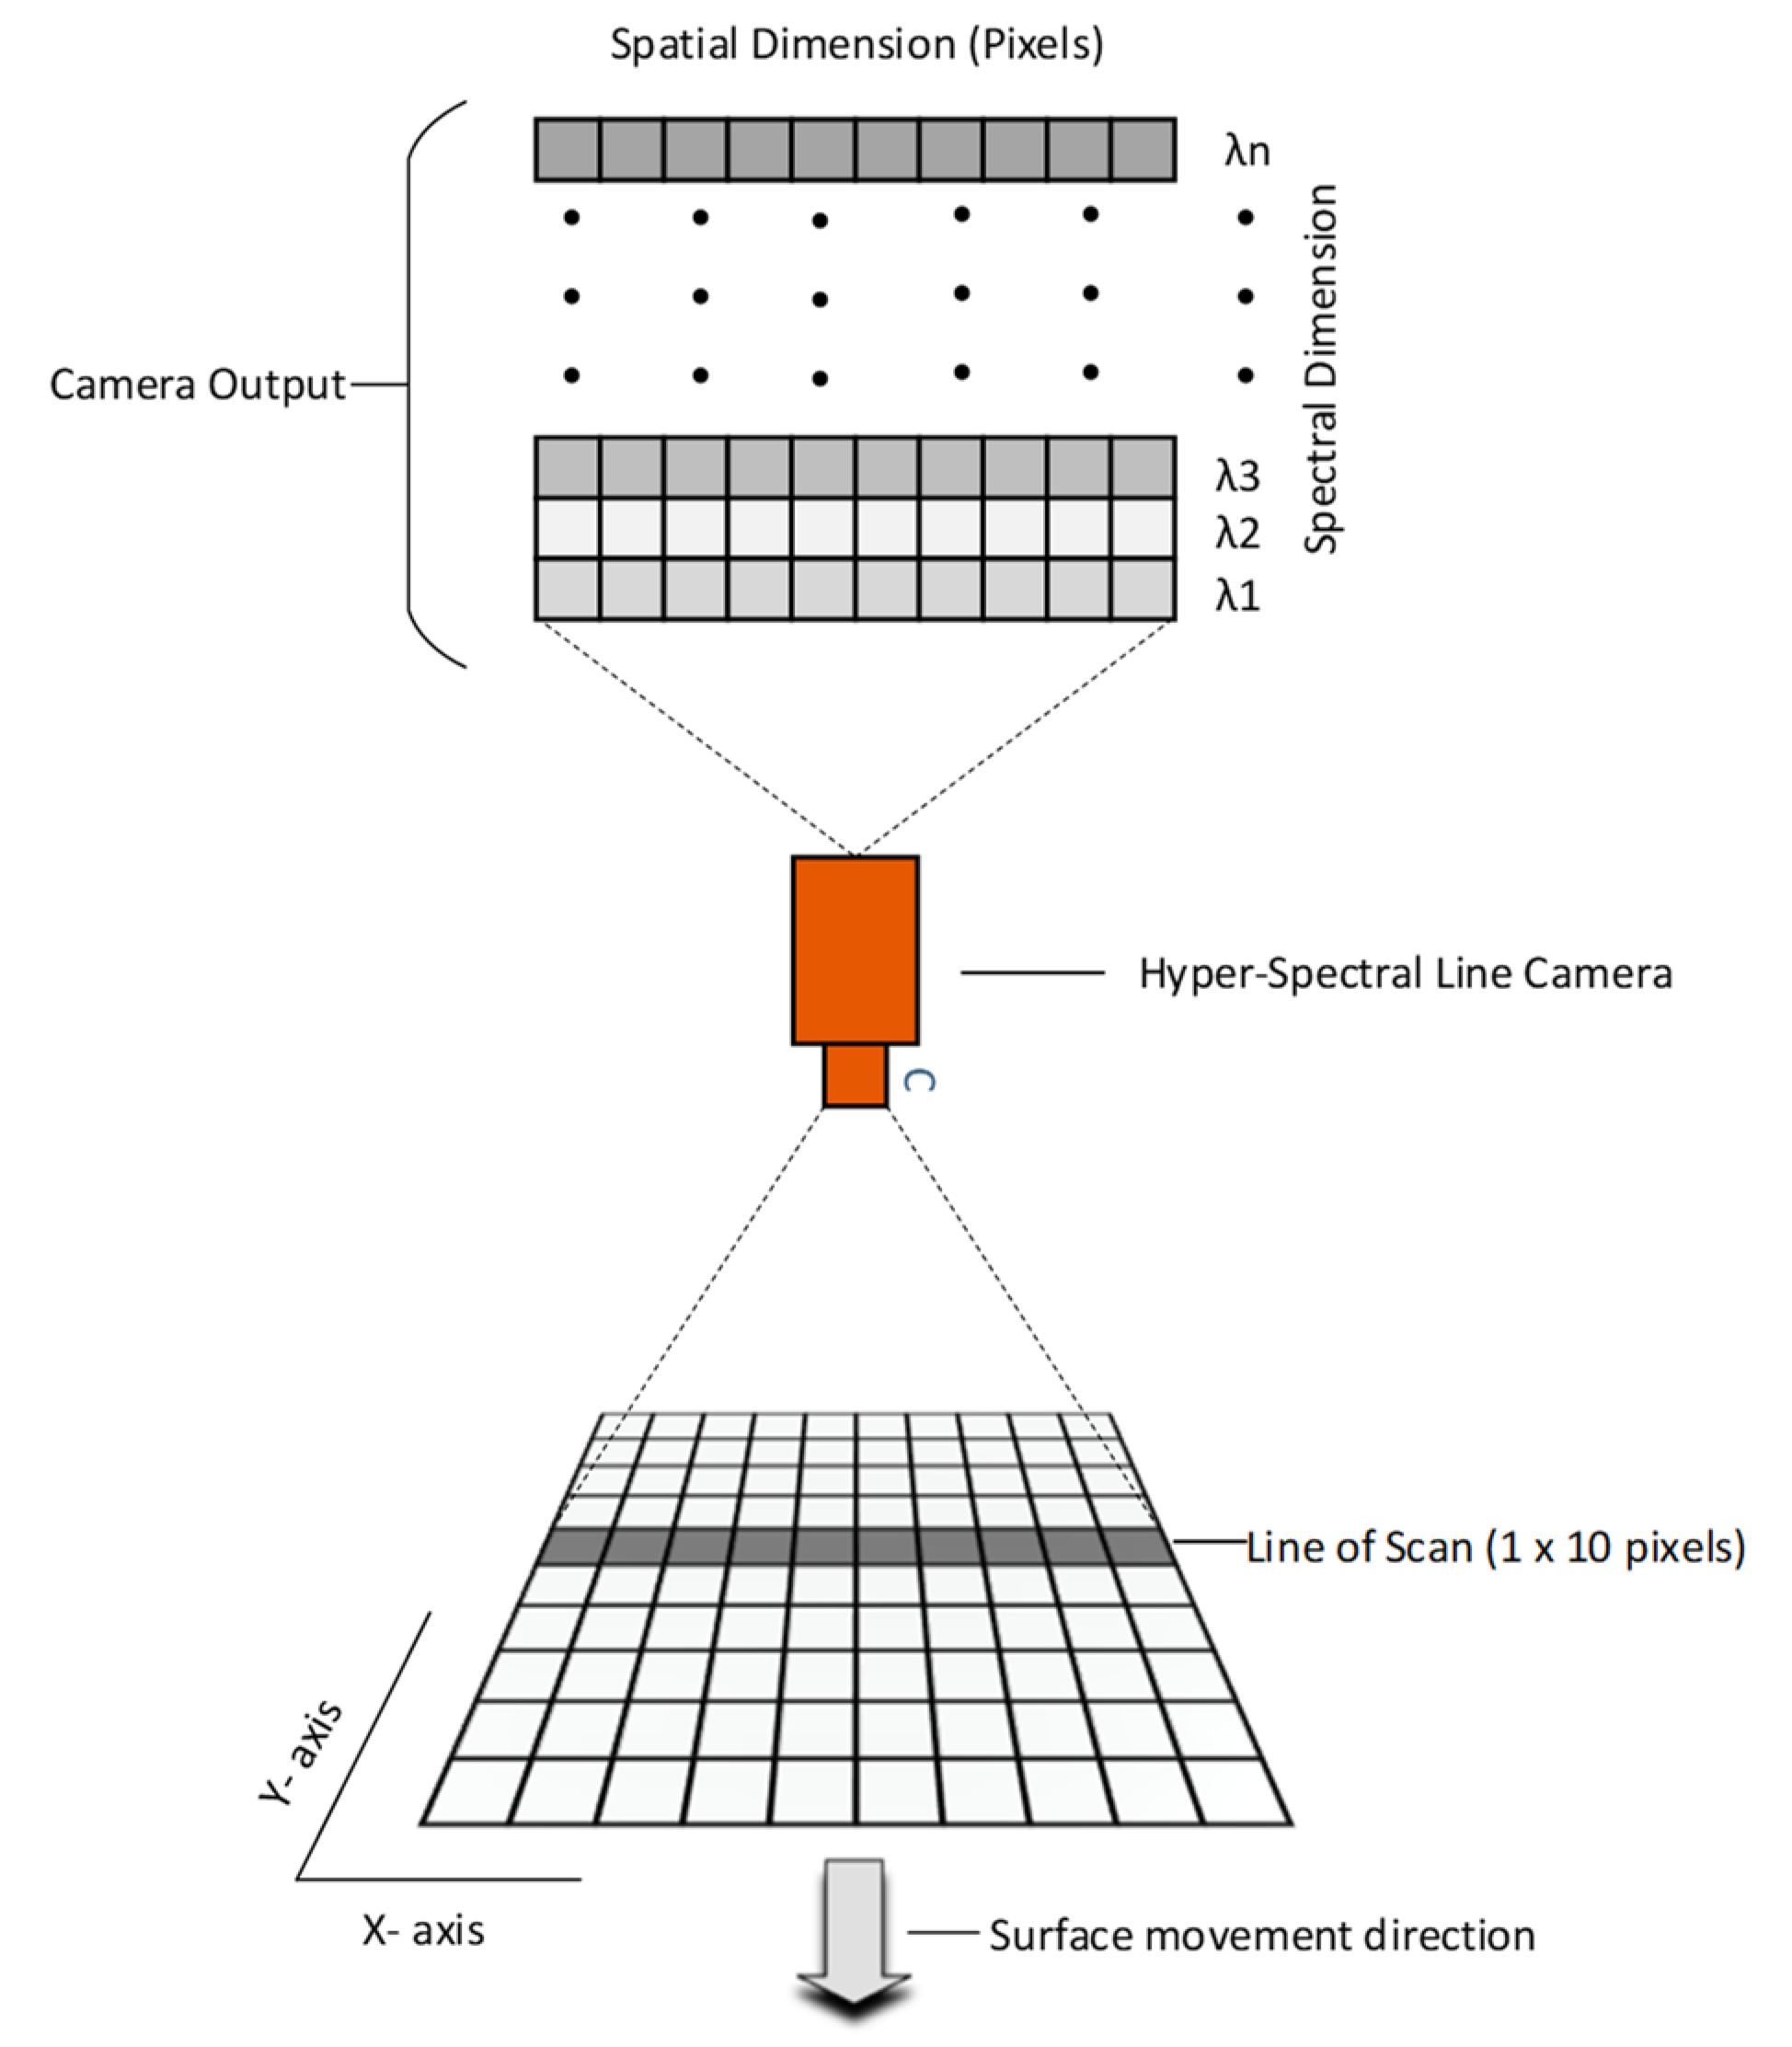
There are several different methods to acquire spectral image data. The most conventional techniques are the whisk-broom, push-broom, staring, and snapshot methods. We used the push-broom method in this research [
9]. A push-broom camera scans a line of pixels on a surface at any given time and produces a two-dimensional output matrix
I(
x,
λ), as depicted in
Figure 1.
The center wavelengths
λ1 to
λn for the spectral signals indexed by 1, …,
n, shown in
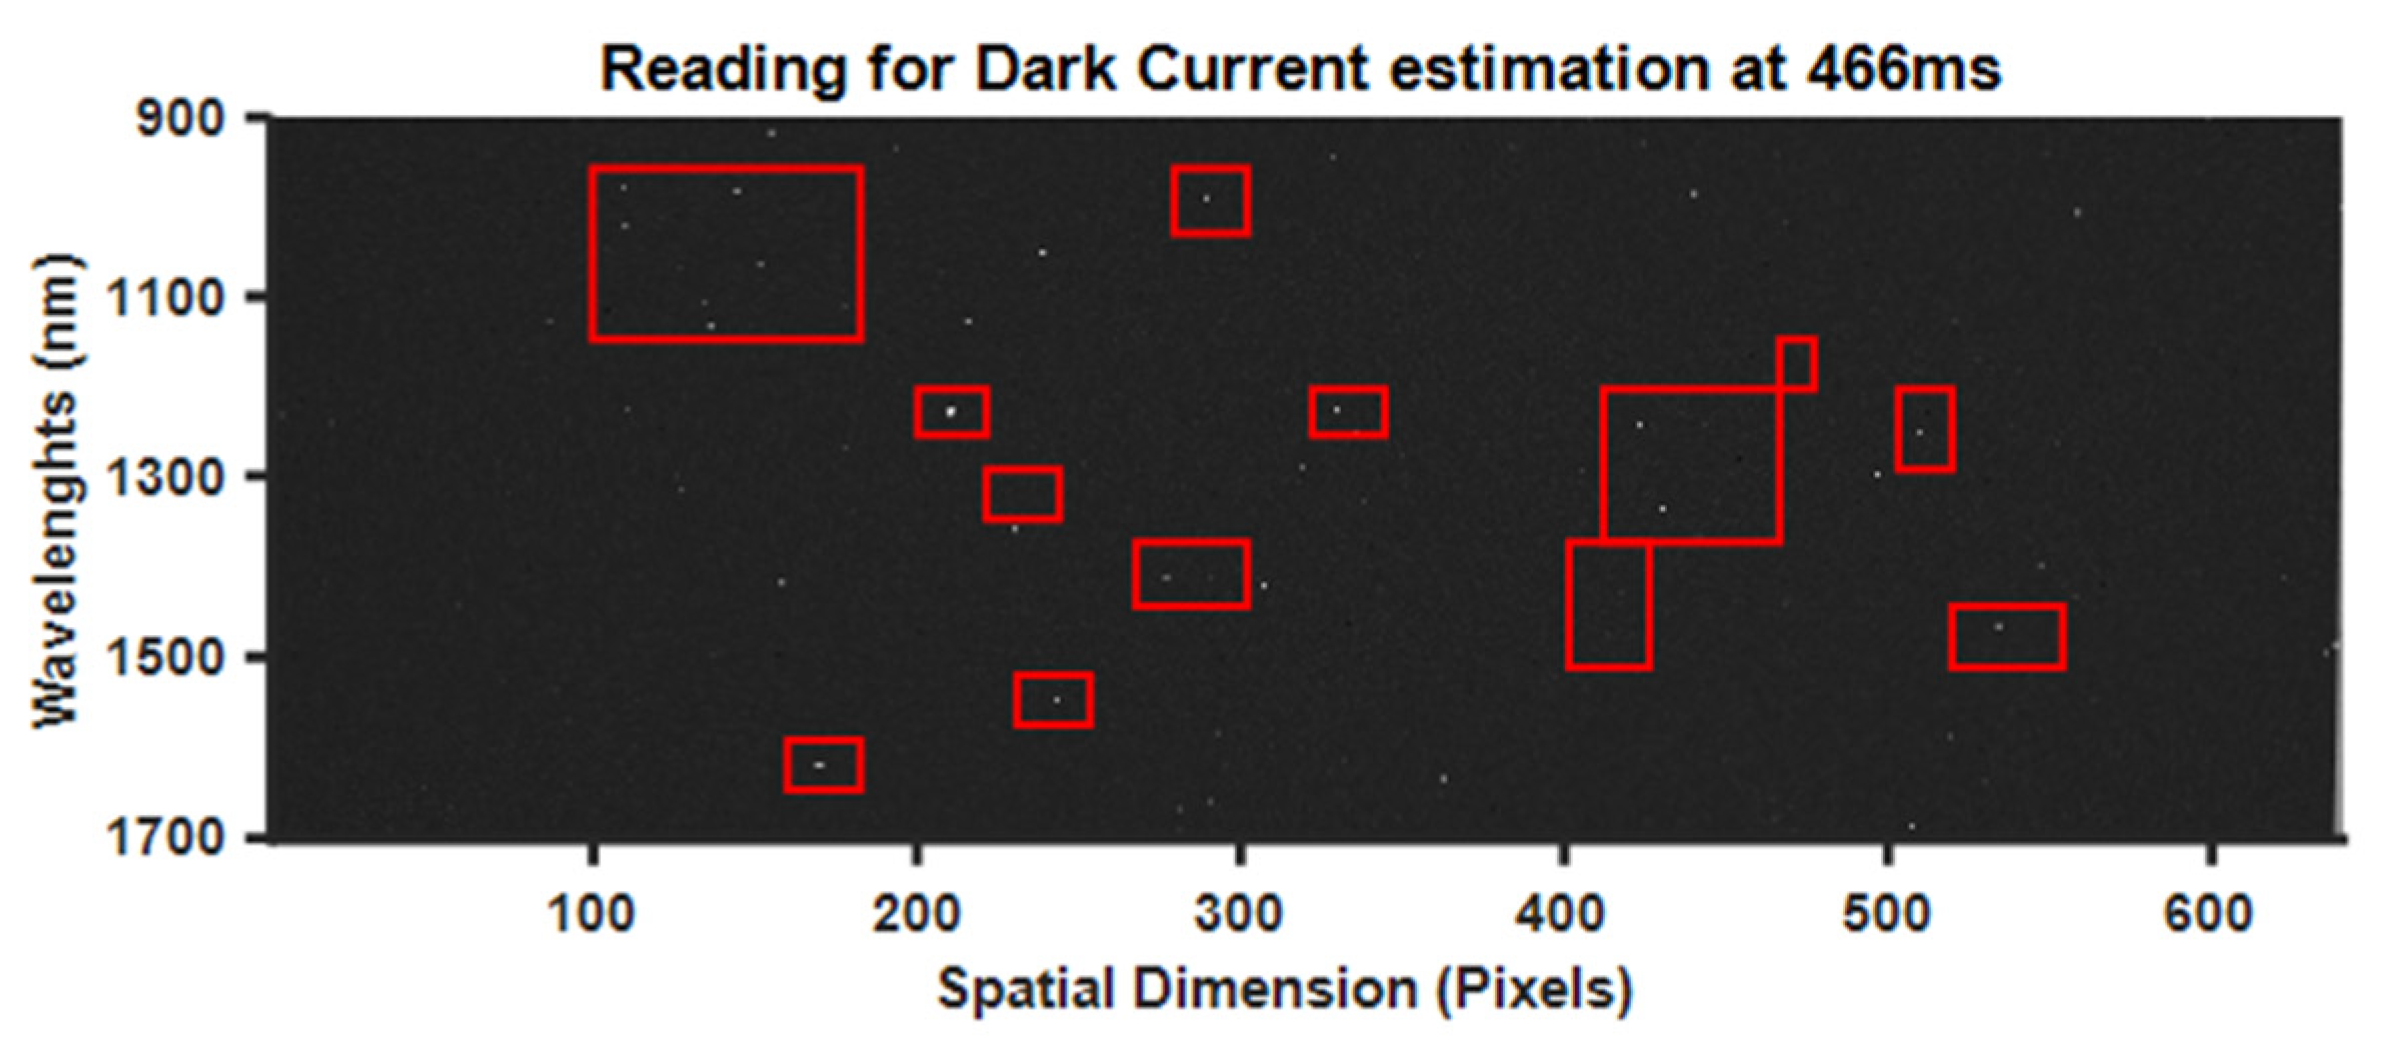
Figure 1, were defined by the camera manufacturer as the coefficients of a first order equation describing a straight line. The bandwidth of the same spectral signals was defined as a 8 nm full width half maximum. However, the sensitivities of those spectral signals were not defined and
I(
x,
λ) is thus a digital number, without a unit, that captures the recorded dose of photons and dark current at a given exposure time. In addition, we need to consider the spectral distribution of the selected light source as unknown. Therefore, a method for calibration of the hyperspectral imaging system that is capable of suppressing variations in spectral distributions of light and sensitivities is needed [
10,
11,
12,
13,
14,
15,
16,
17,
18].
Radiometric calibration of a hyperspectral camera means that the abstract digital numbers
I(
x,
λ) that quantify the recorded outputs from each pixel and each spectral channel are given the concept of true radiation intensity [
10] or true reflectance for a hyperspectral imaging system [
15]. Calibration of true reflectance requires the use of one or more calibrated reflectance standards. Those calibration targets are typically made of a matte Lambertian reflecting surface, such that the reflecting light is of close to equal intensity in all directions. The total reflection integrated in all directions is typically close to 100 percent. Typically, a product called Spectralon
TM is used to manufacture reflectance standards [
11,
19]. Spectralon
TM is produced by pressurizing powder from polytetrafluoroethylene (PTFE) to form a block, followed by sintering it to bind the particles together. This results in an open-cell PTFE random matrix with approximately 40% void volume to enhance the scattering of light [
19]. Teflon
TM is another more common trademark for a less expensive product made of solid PTFE. The price for a Spectralon
TM calibration standard is approximately 2.2 EUR/cm
2 compared to 0.11 EUR/cm
2 for a 10 mm thick board of solid PTFE.
In this paper, we argue that a calibration standard with an accurate reflectance close to 100 percent is not needed if the purpose is to identify materials by their spectral signatures. This is achievable because the spectral signatures can be recognized independently of the true scaling of reflectance 13. Similar arguments have been published by another research group [
13], while other groups simply suggest using a white paper sheet for the calibration [
17,
18]. This paper defines the spectral calibration procedure by mathematical formulas. It is shown experimentally how variations in the spectral distribution of illumination can be efficiently suppressed after calibration using a solid PTFE board.
The basic mathematical formula for computation of calibrated true reflectance is defined in all referenced publications [
11,
12,
13,
14,
16,
17,
18] as,
This formula implies that a measured image, a reference image, and a dark current image must be captured using a hyperspectral camera at the same exposure time. This is a consequence of the fact that the exposure time is simply omitted. Finding a common exposure time that is optimal for both the measured image and the reference can be a challenge. Therefore, it is shown in this paper how the concepts of intensity, dose, and exposure time extends the formulation of Equation (1) to allow different exposure times for reference and measurement.
In the next section, we present the details of the hardware, experimental setup, dark current analysis, data normalization, and the proposed calibration method, followed by the results and discussion. The paper ends with conclusions and references.
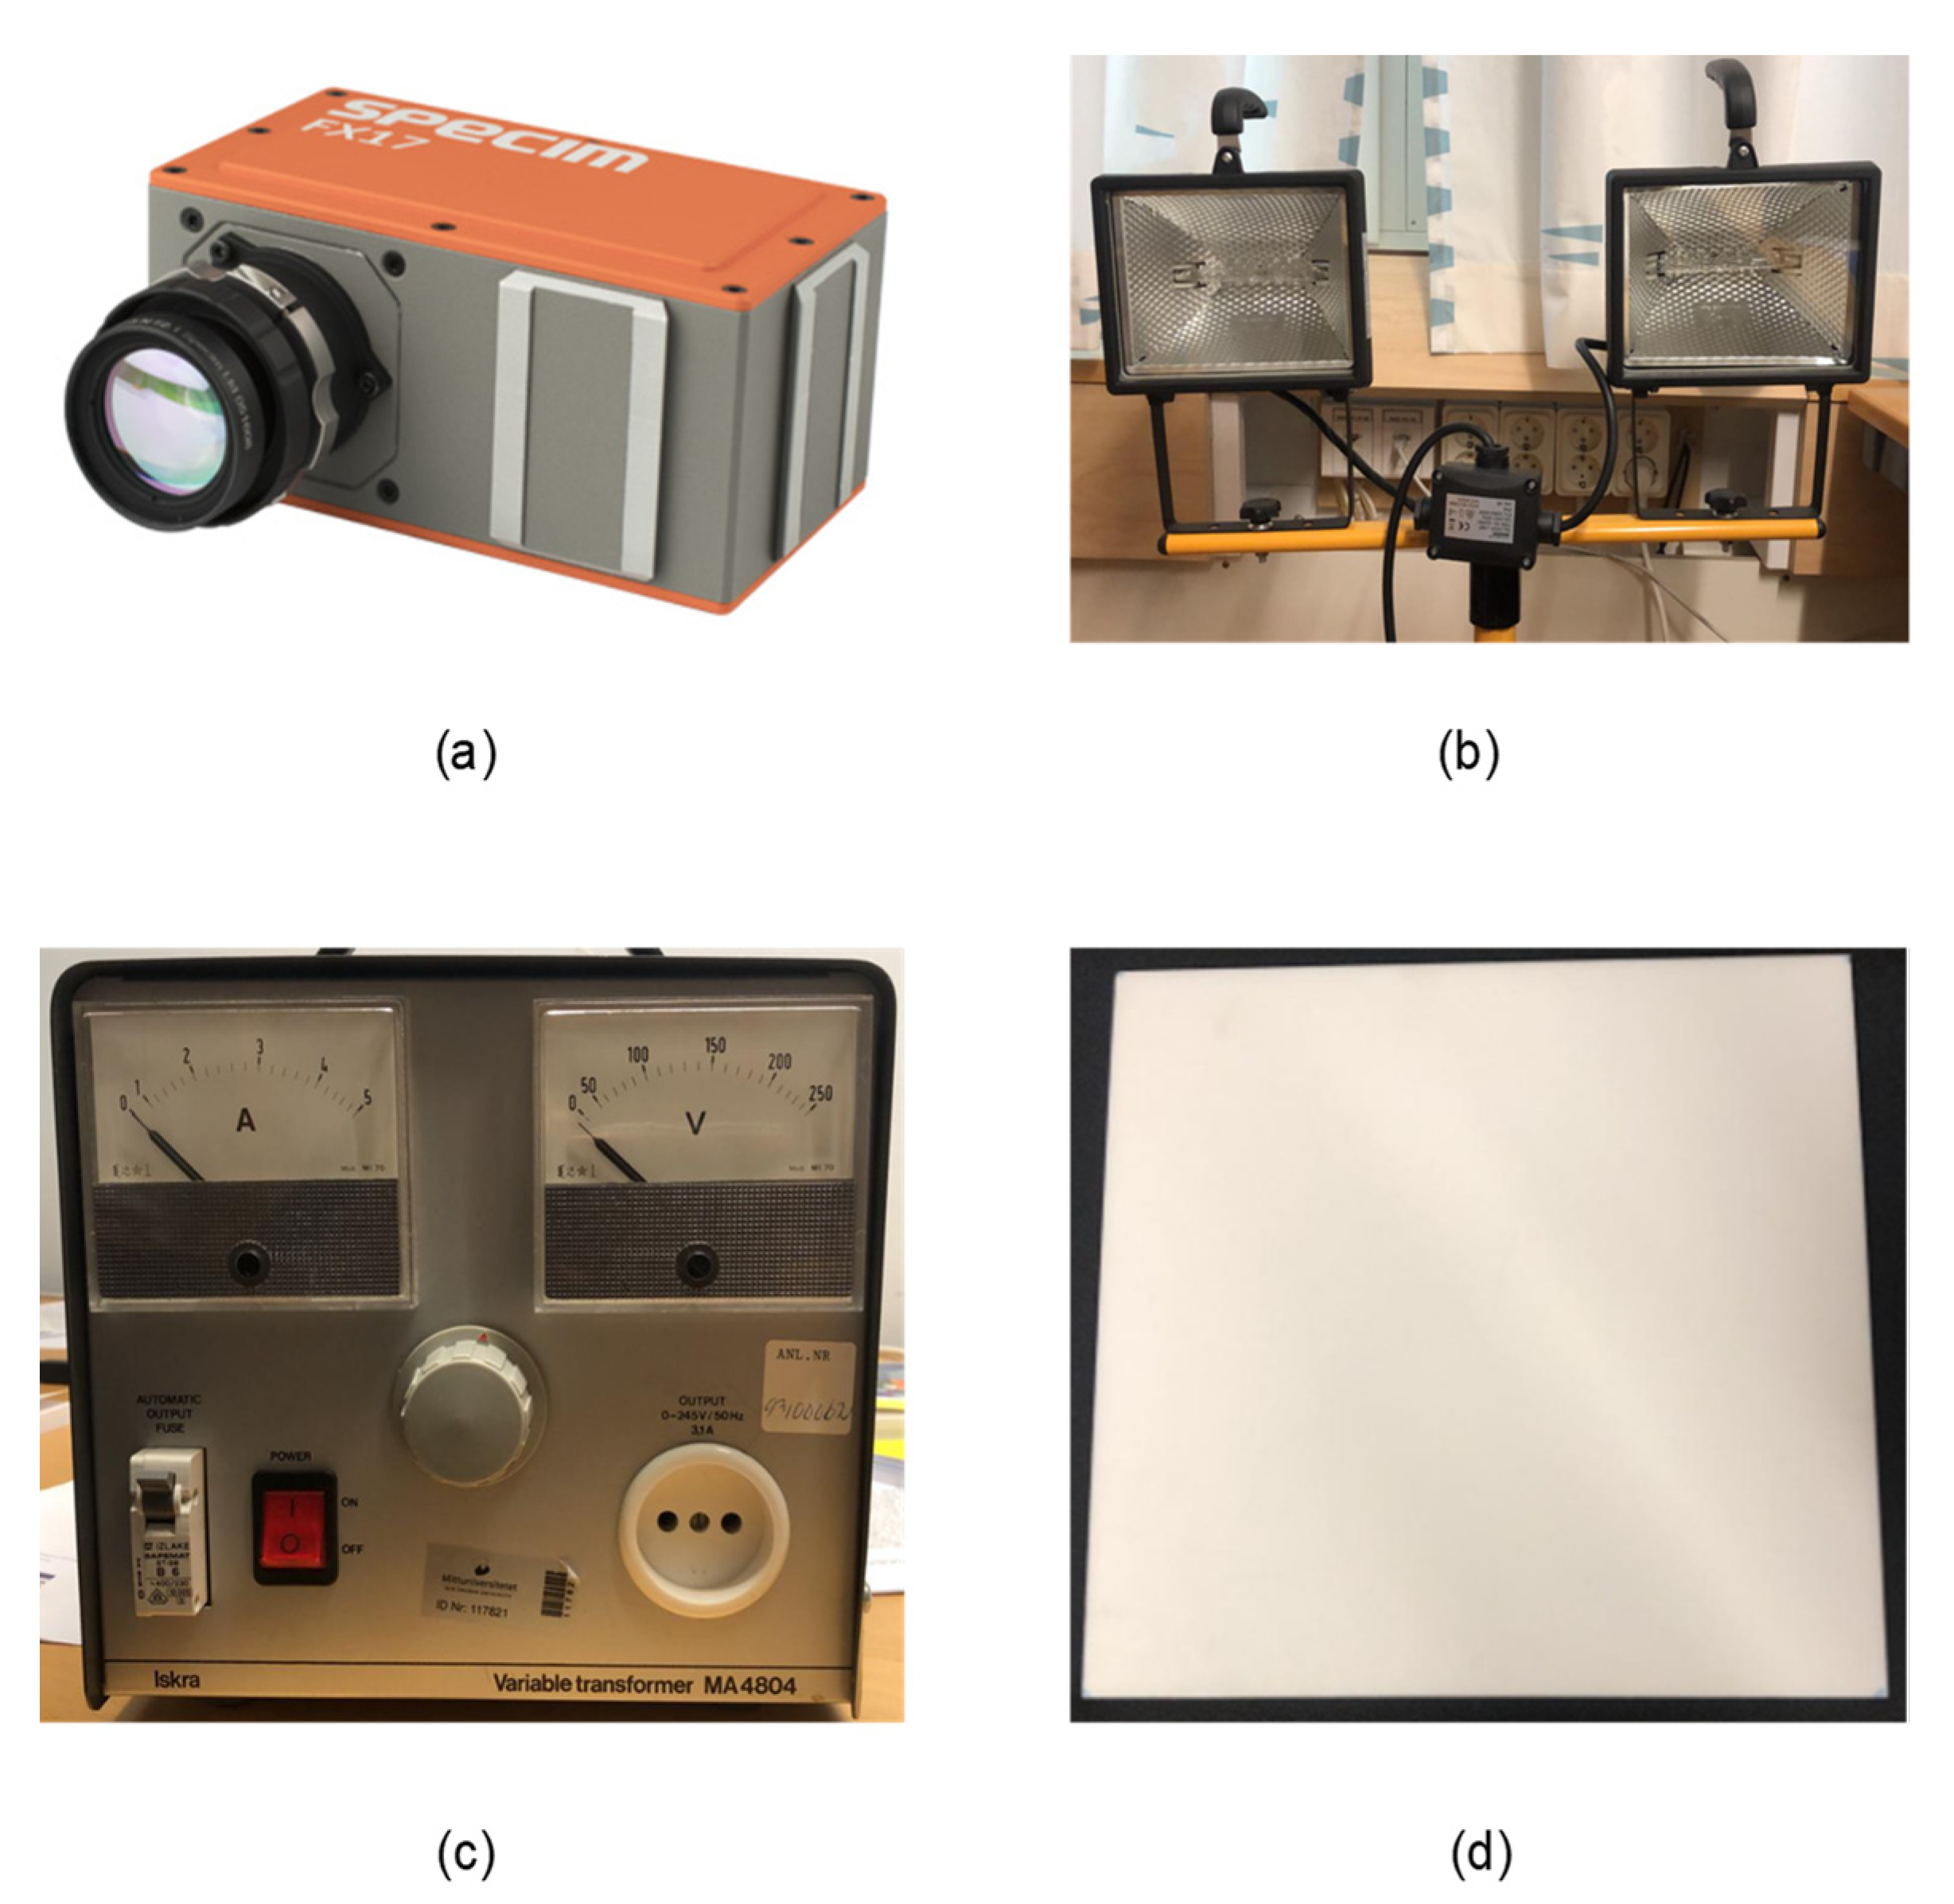
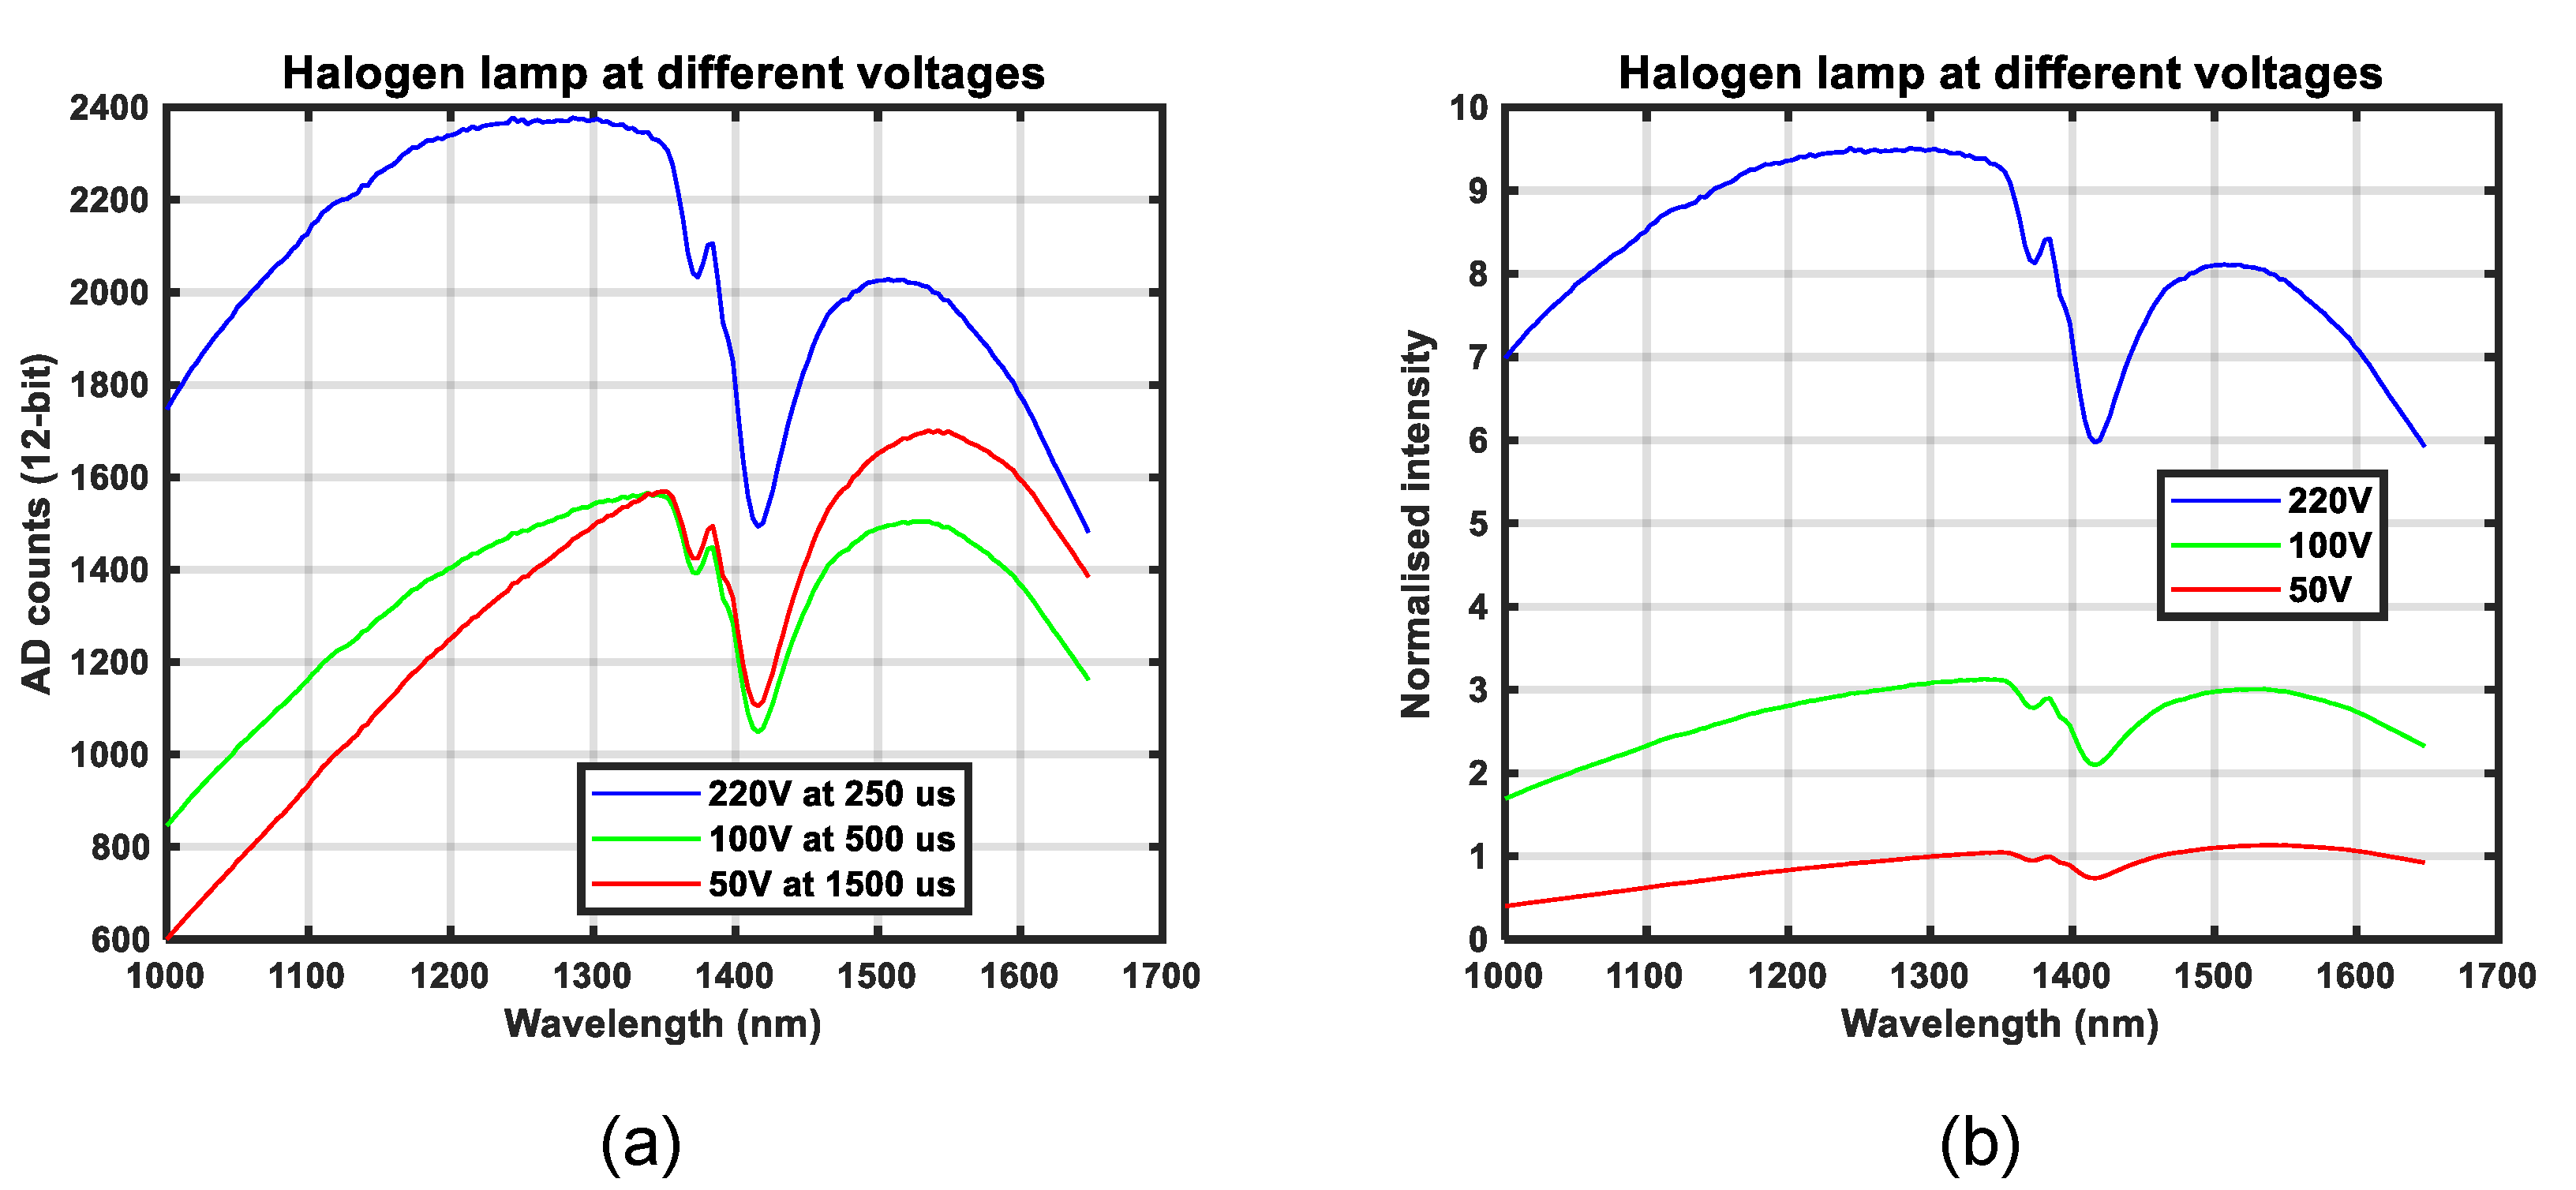
3. Results and Analysis
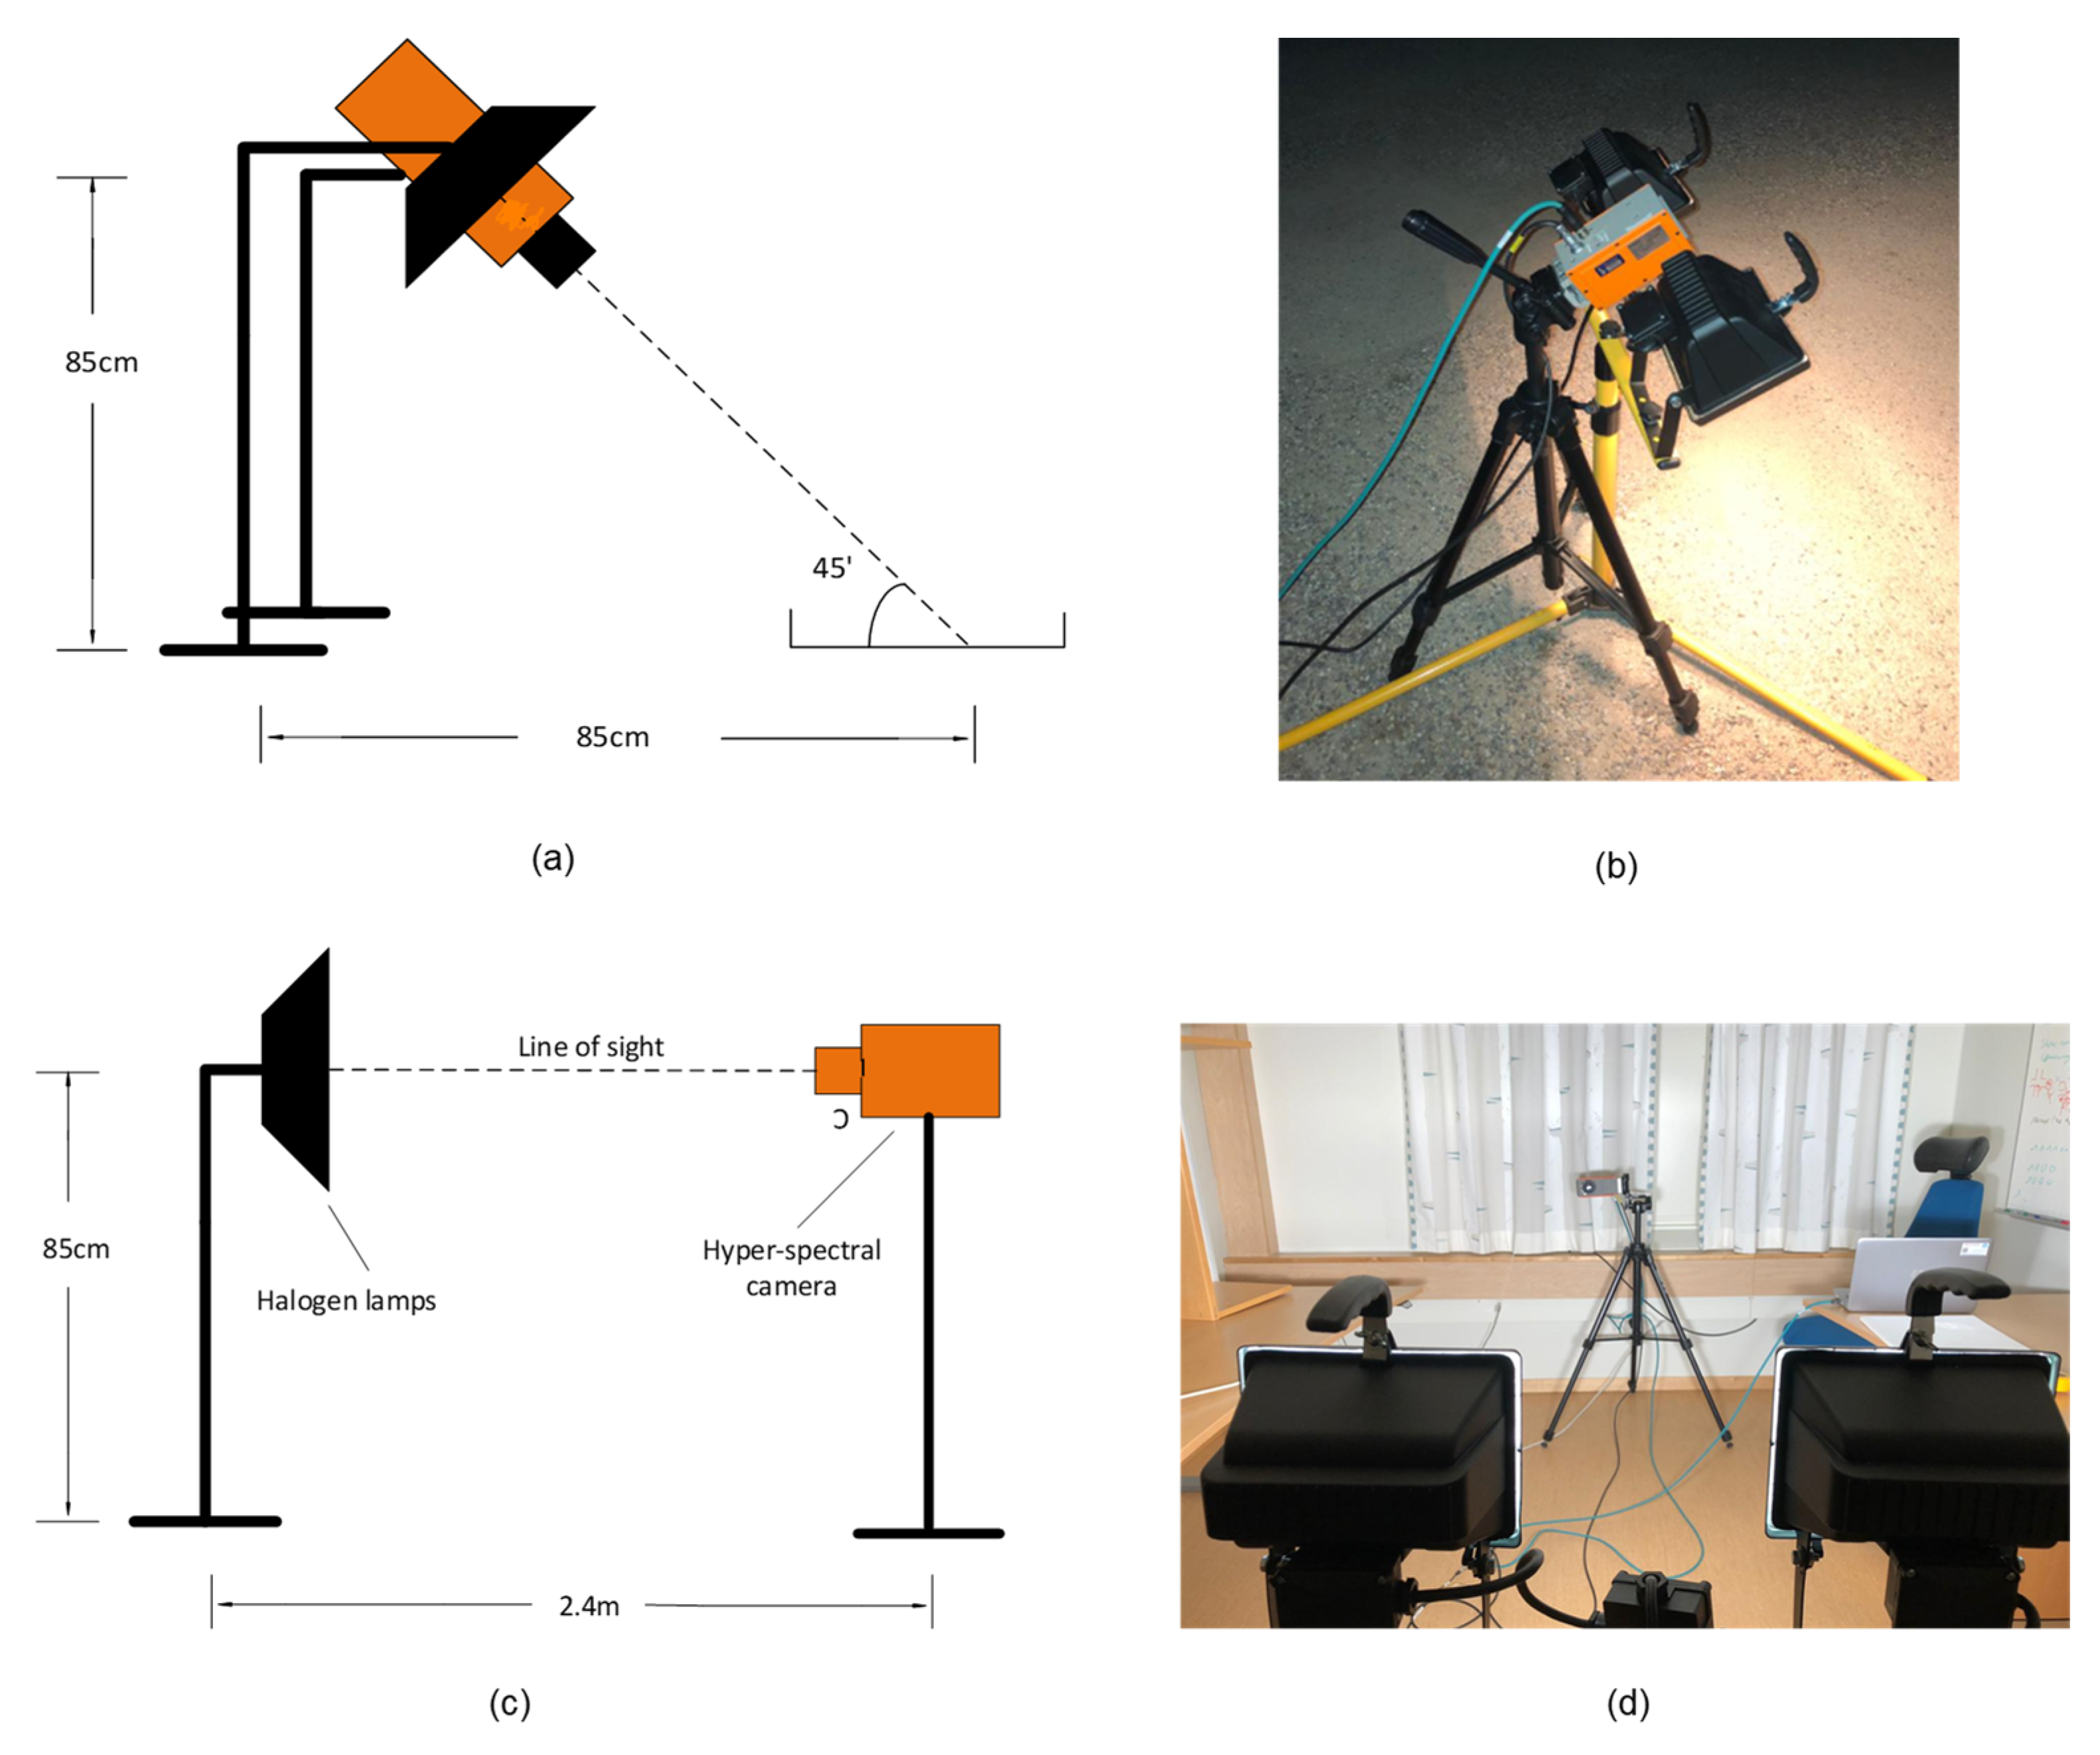
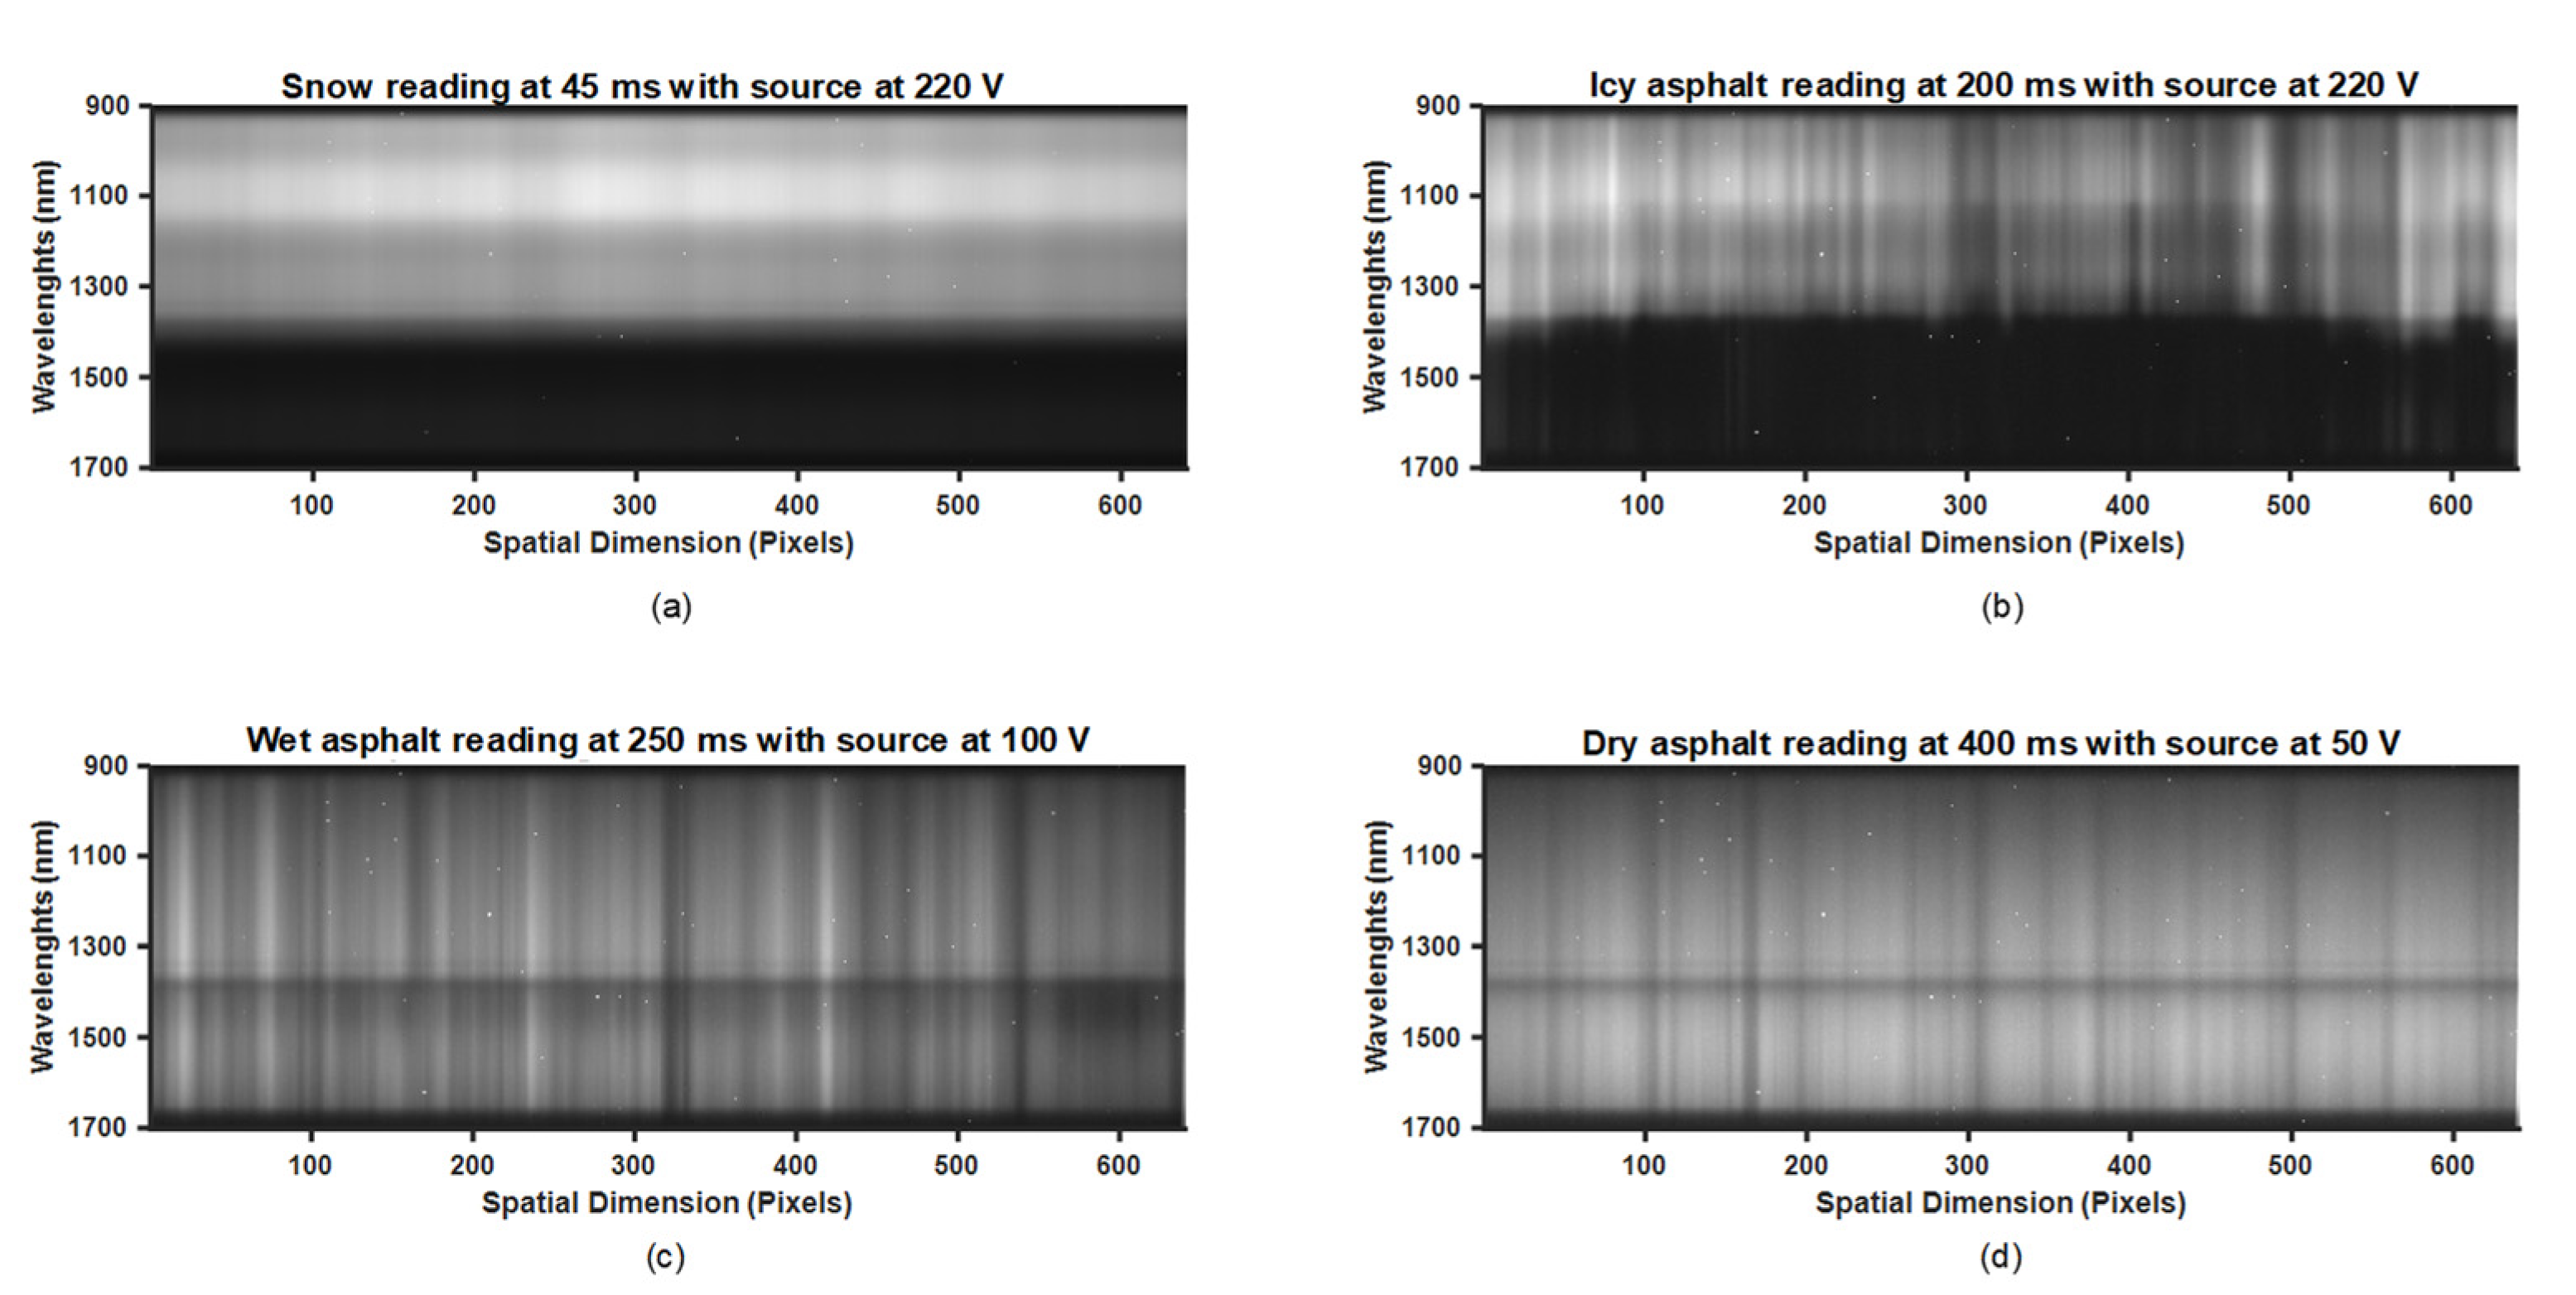
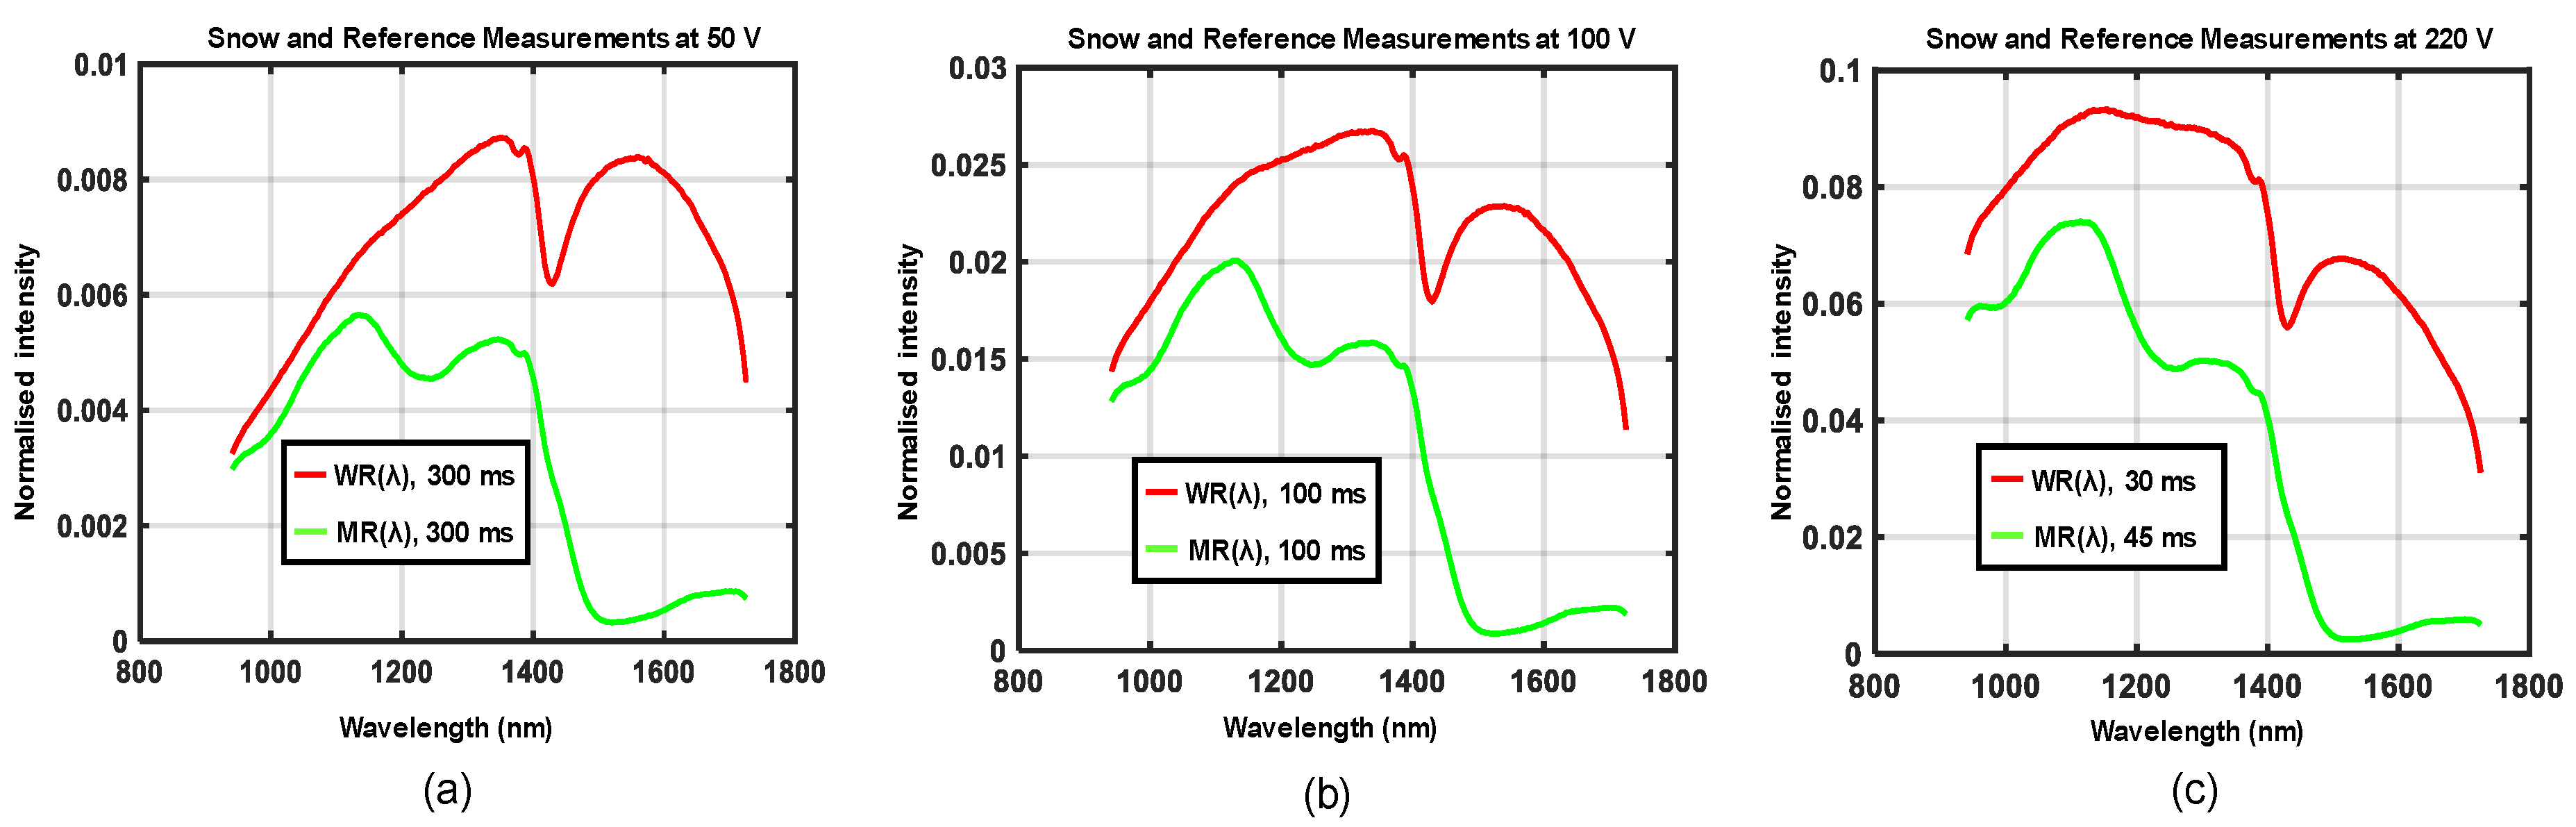
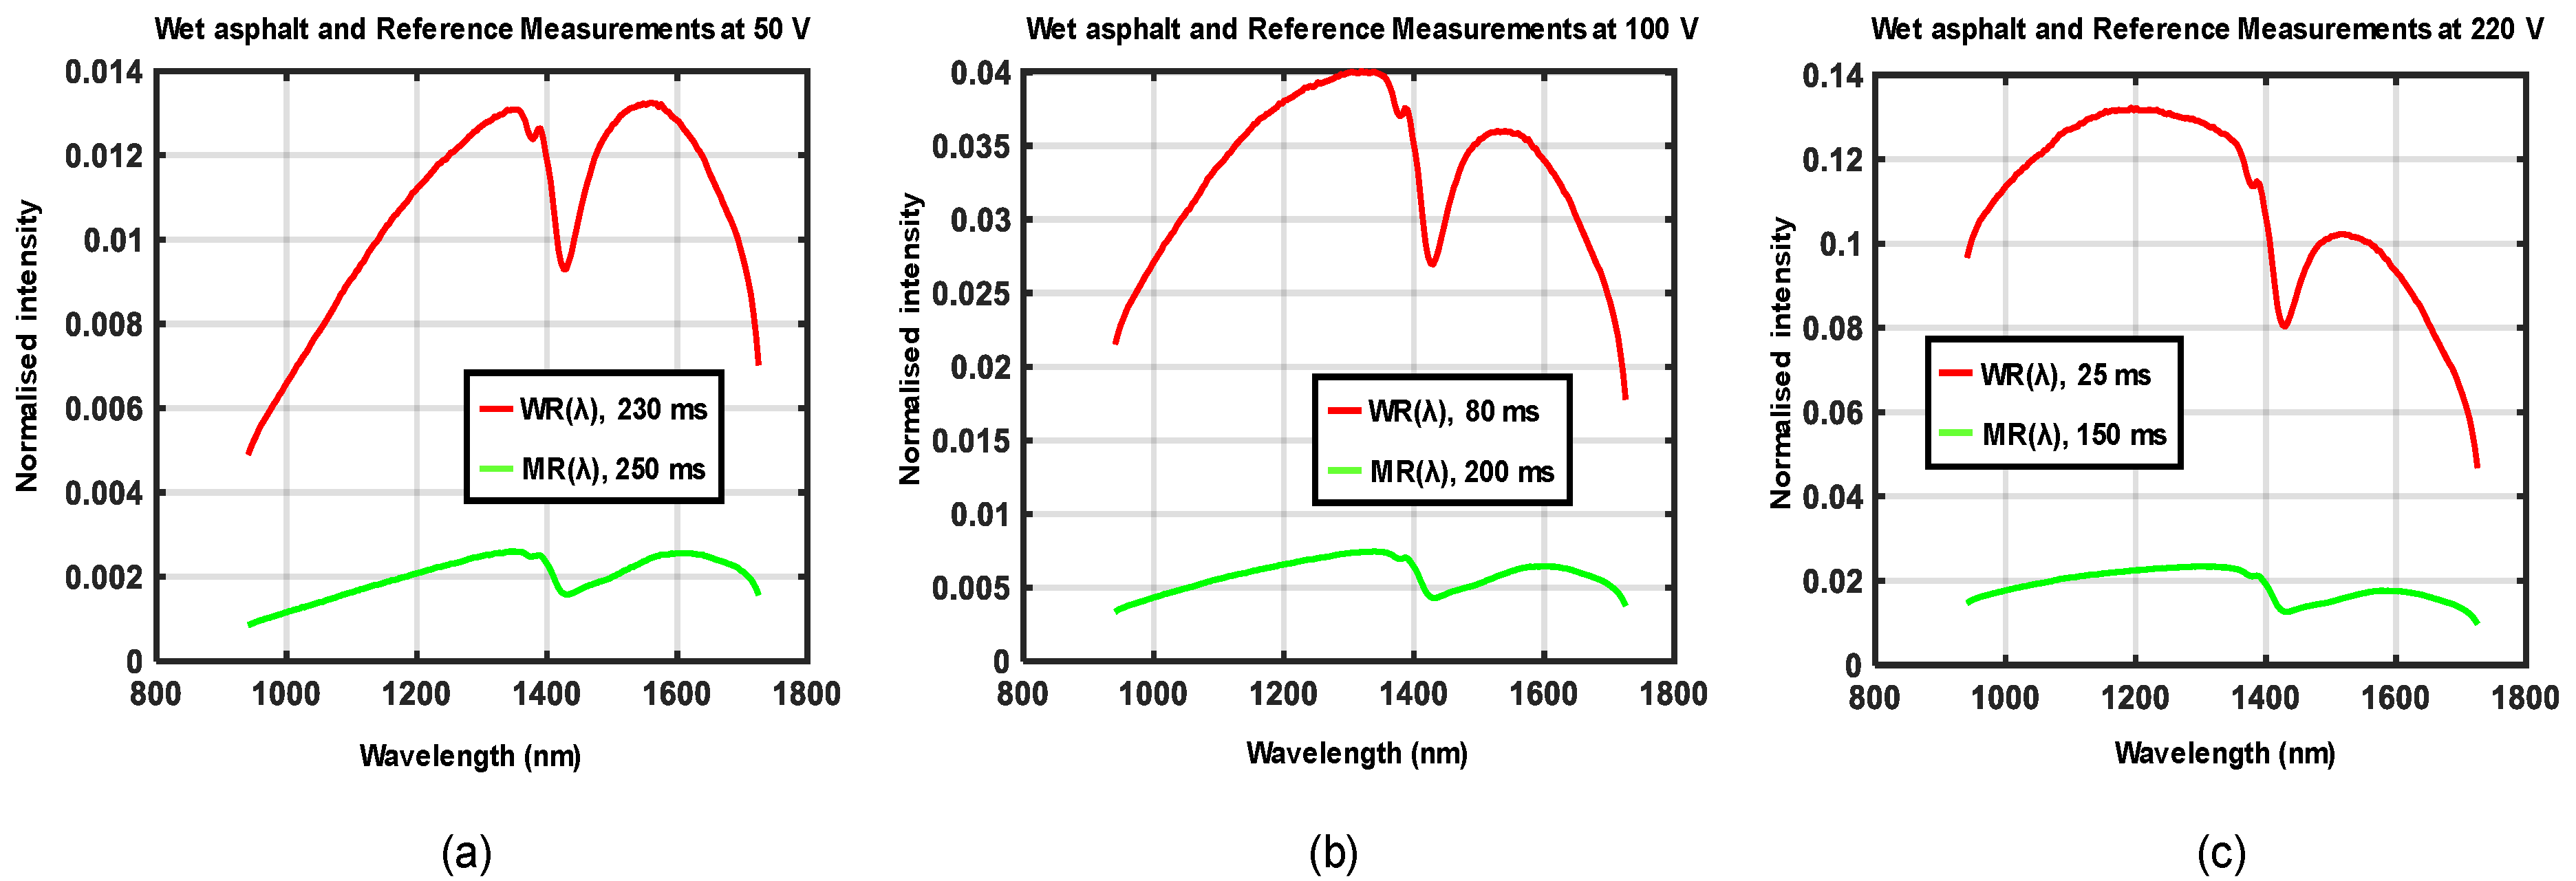
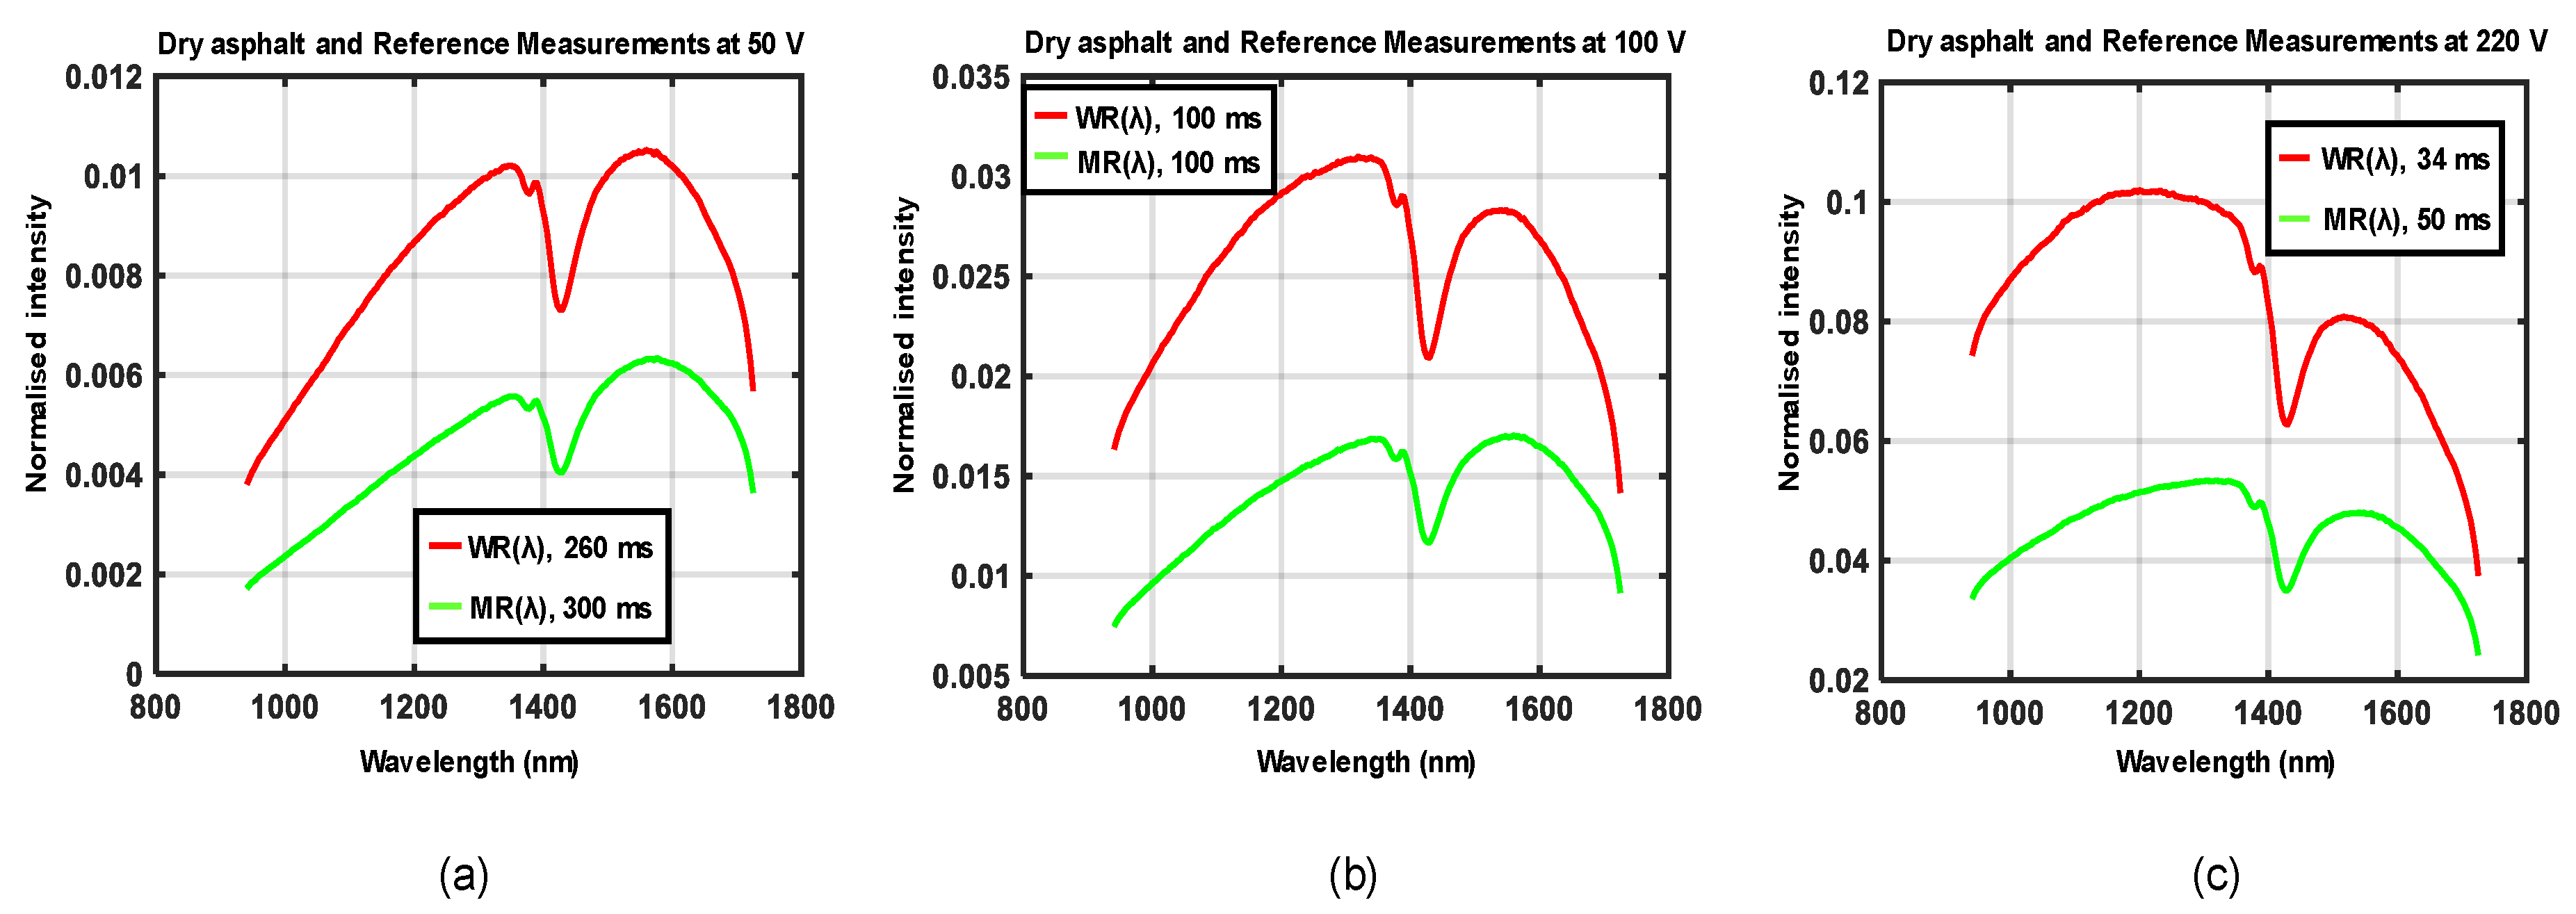
The experimental setup shown in
Figure 5a,b was used to acquire data for four different road conditions, each at three different locations. Three different supply voltages were generated by the variable transformer at each location such that the emitted halogen light showed a variation in spectral distributions. Waveforms in
Figure 10,
Figure 11,
Figure 12 and
Figure 13 show the spectral distributions of reflected light
MR(
λ) for the different road conditions: snow, icy asphalt, dry asphalt and wet asphalt, and three different voltage levels. Spectral distributions of light reflected in the surface of the calibration reference
WR(
λ) were measured at the same location as the corresponding road condition without moving the experimental setup. It is obvious that the higher lamp voltage results in greater illumination intensity for shorter wavelengths. A low lamp voltage gives greater intensity to longer wavelengths. Different exposure times were used for the measurement of analyzed surface
MR(
λ) and for the reference
WR(
λ), as indicated in
Figure 10,
Figure 11,
Figure 12 and
Figure 13. Therefore,
WR(
λ) and
MR(
λ) were normalized as described in
Section 2.6 and the corresponding model is described by Equations (3), (4) and (6).
The measurements of spectral distributions of reflected light,
MR(
λ) and
WR(
λ)
, shown in
Figure 10,
Figure 11,
Figure 12 and
Figure 13, are dependent on both the illumination source and camera sensitivity, as shown by Equations (5) and (6). In order to eliminate these unwanted dependencies, the relative reflectance
RR(
λ) was calculated (as a percentage; see
Figure 14).
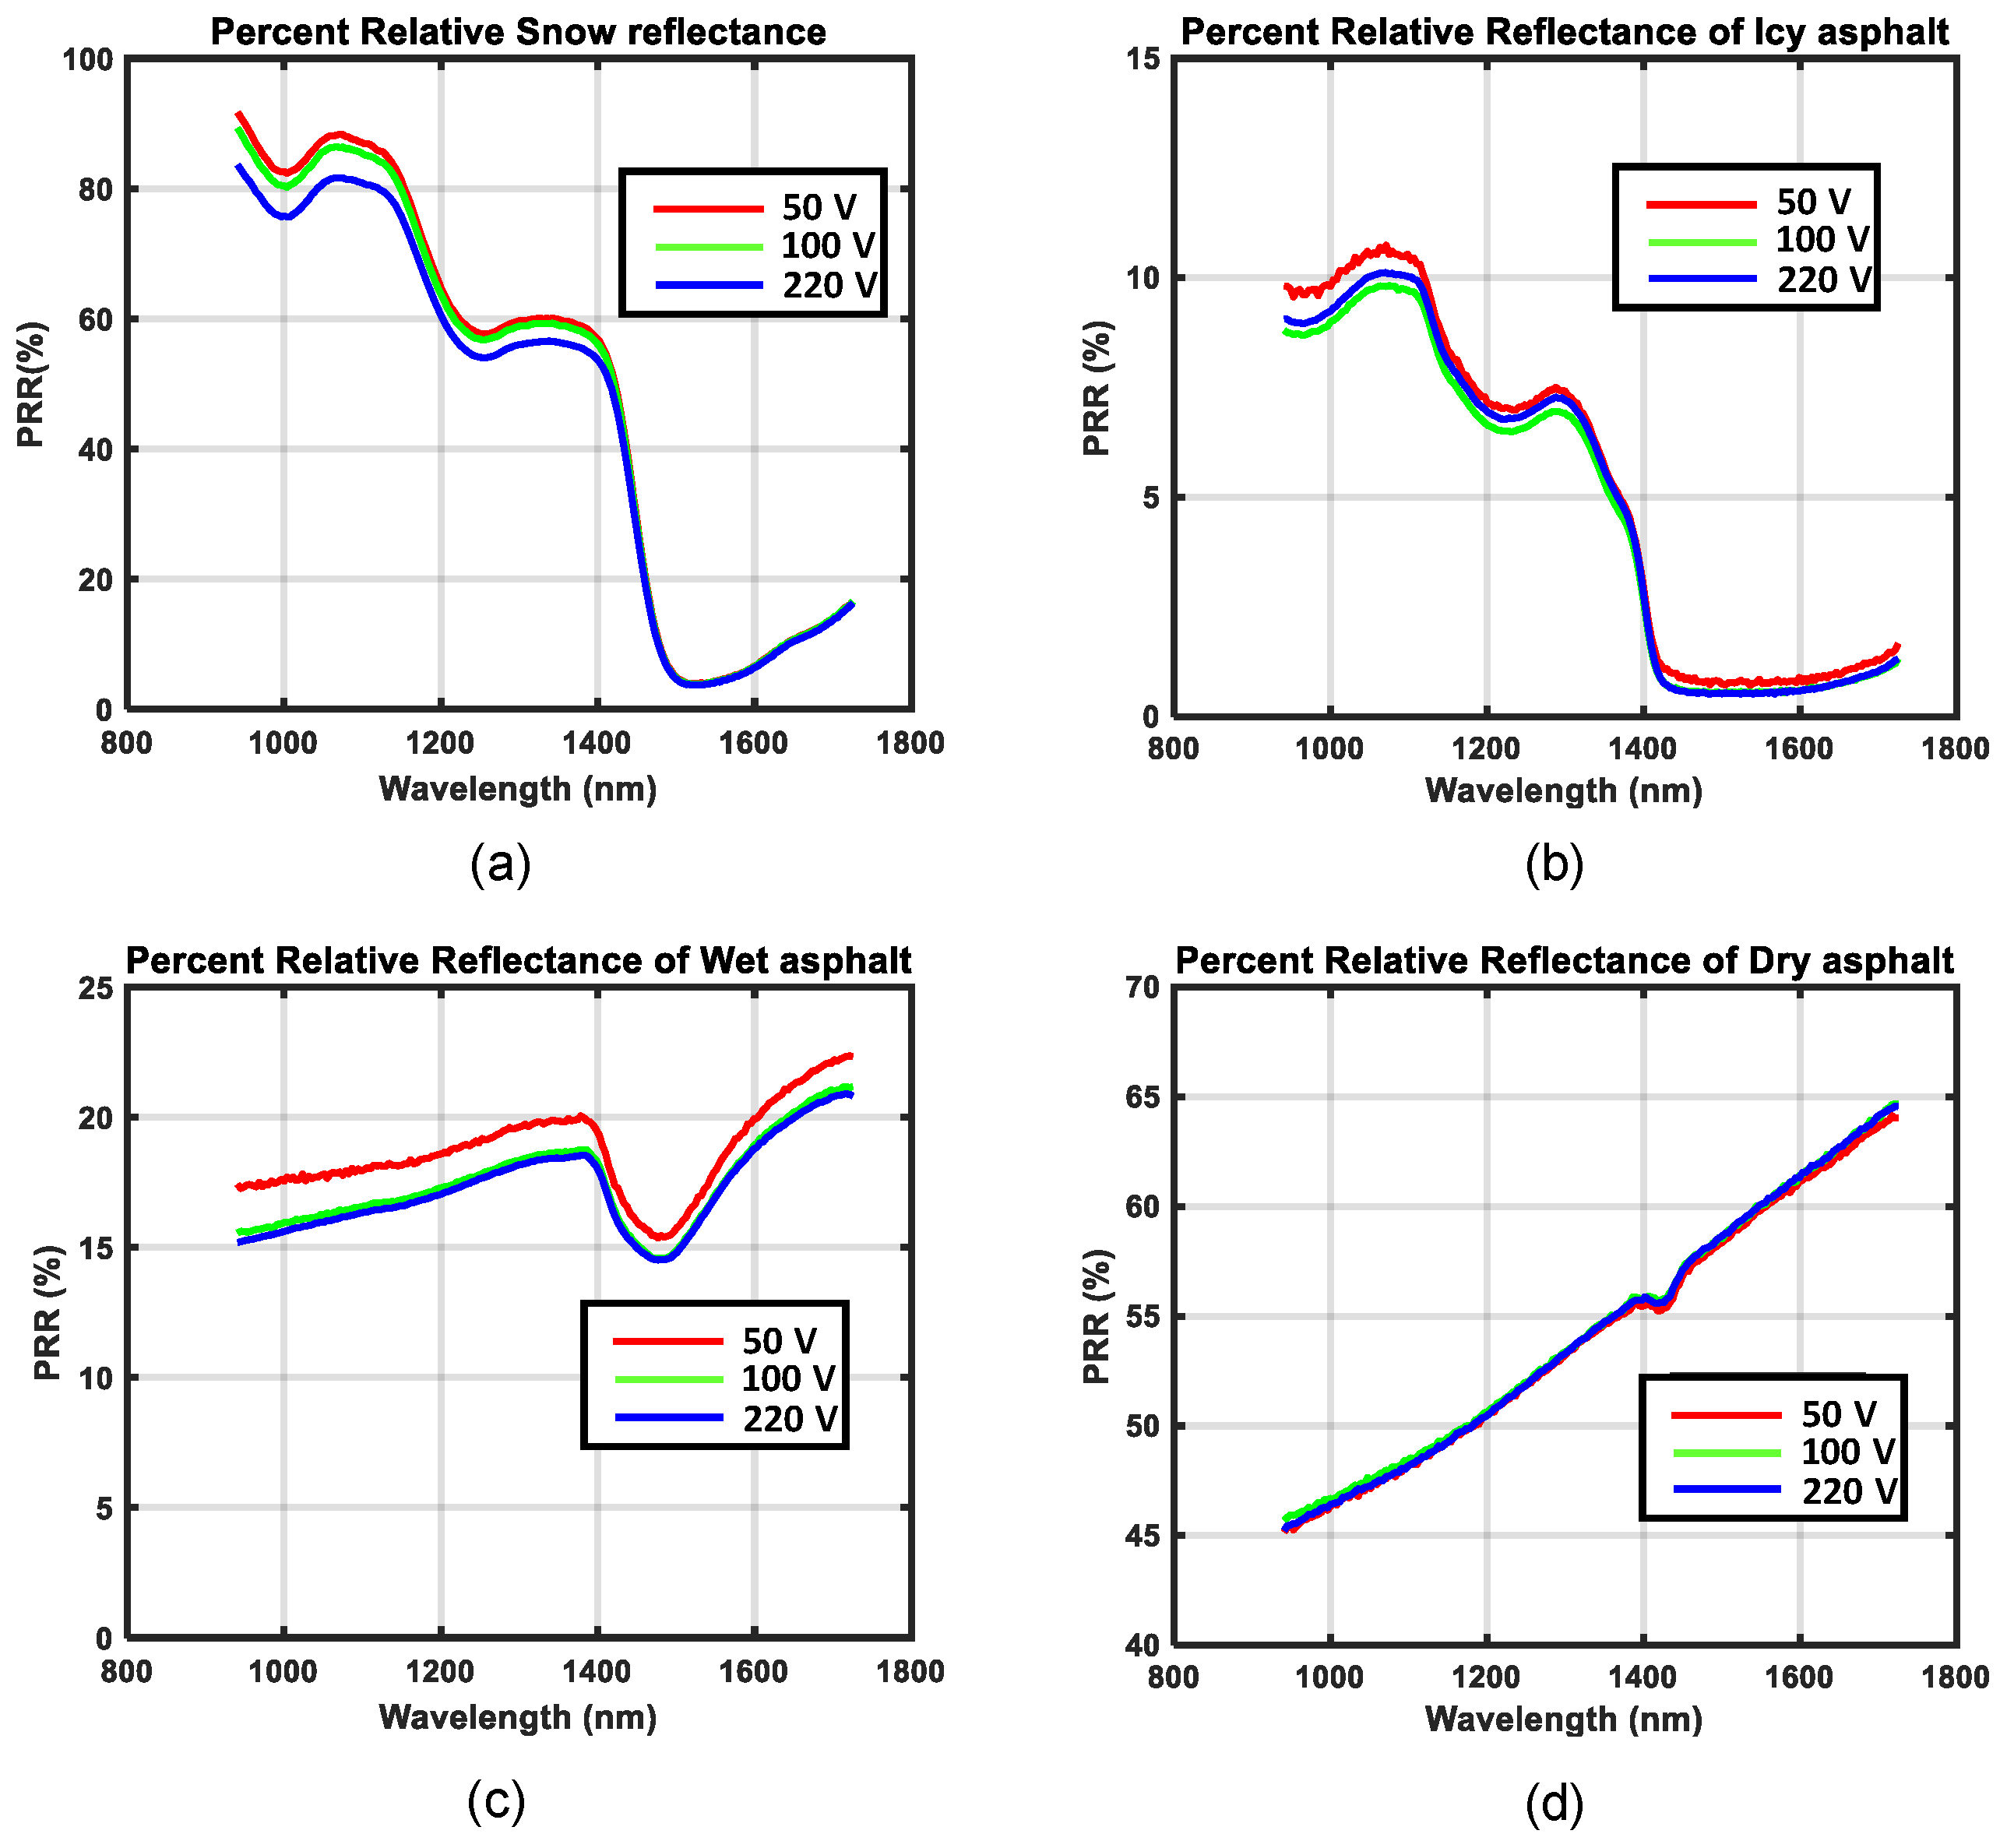
Figure 14 shows separate graphs for the different road conditions: snow, icy asphalt, dry asphalt and wet asphalt. There was a high degree of similarity between the curves corresponding to the three different lamp voltages, which verified the desired independence of illumination. There was also a lot of similarity with published spectral profiles of snow [
26] when compared with
Figure 14a. Similar absorption peaks could be observed at approximately 1.0, 1.2, and 1.5 µm for snowy asphalt and published reflectance for snow. For icy asphalt, we could recognize similar absorption peaks at 0.9 and 1.2 µm. When comparing wet asphalt in
Figure 14c with dry asphalt in
Figure 14d, we noted an absorption peak at approximately 1.5 µm that comes from the water molecule.
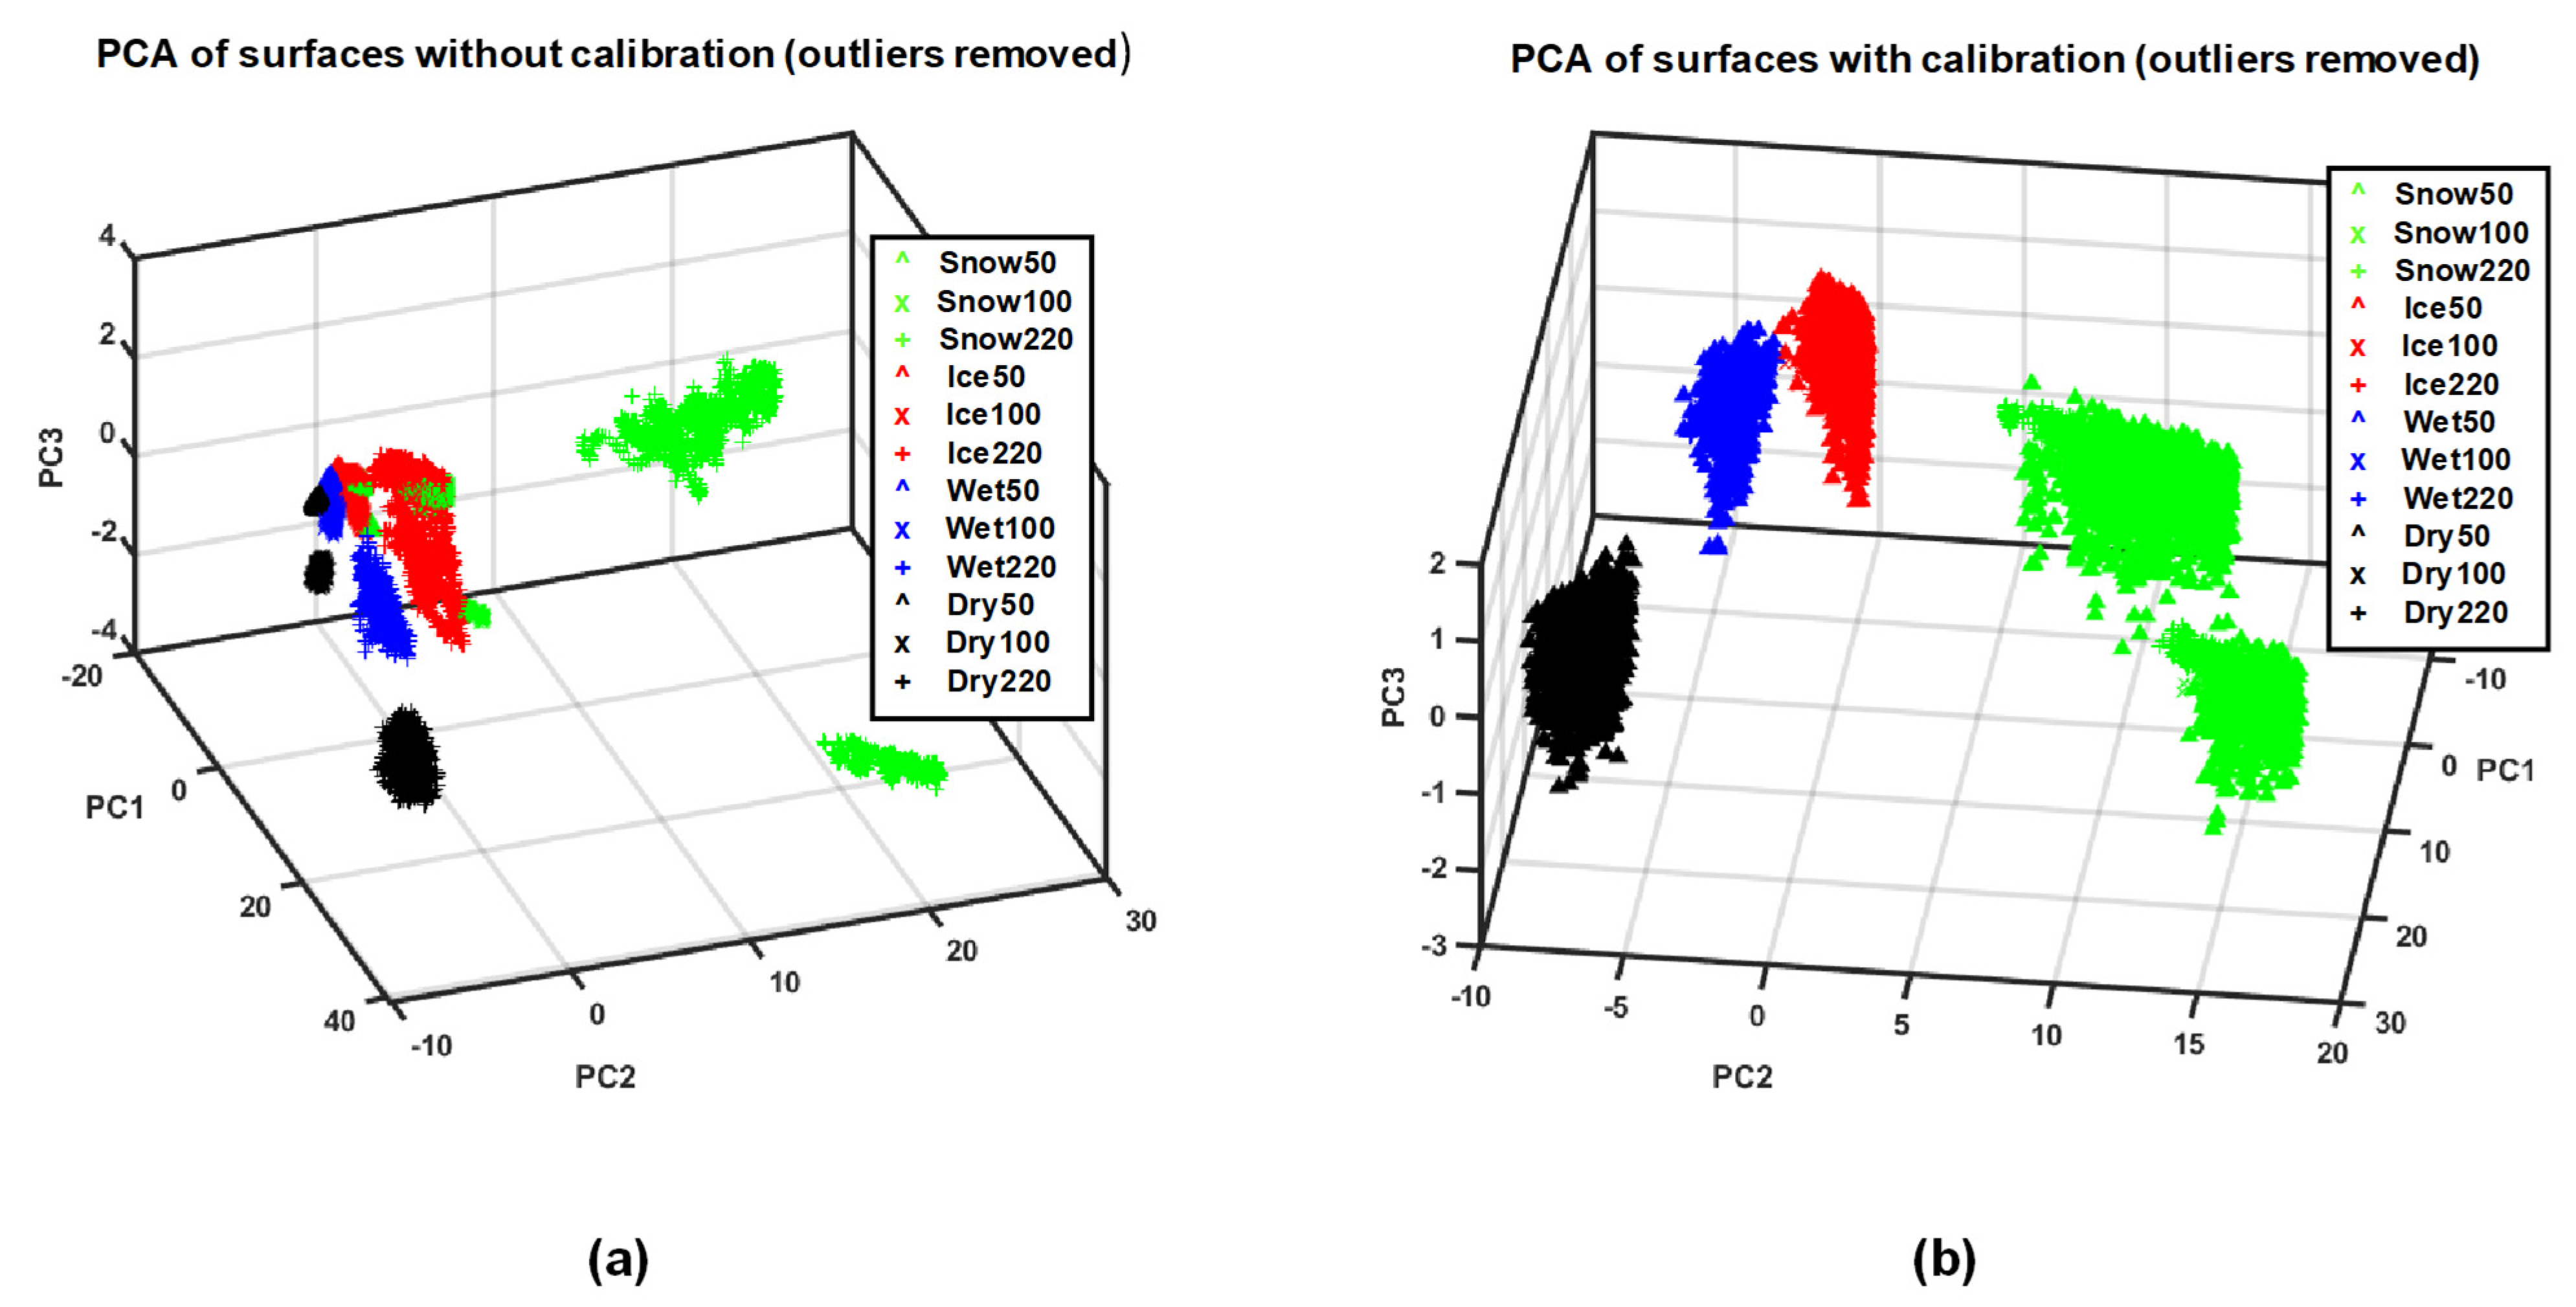
PCA of both calibrated data vectors
RR(
λ) and non-calibrated raw data vectors
MR(
λ) for all of the road conditions were measured. Data vectors recorded at different illumination spectra for all four classes were labeled according to the road conditions: snow, icy asphalt, dry asphalt, and wet asphalt. The score plots of PCAs are presented in
Figure 15. Data vectors of calibrated data
RR(
λ) for the different road conditions are concentrated into well-separated clusters (
Figure 15b), compared to that of non-calibrated data
MR(
λ) (
Figure 15a). Furthermore, our PCA analysis revealed that the three principal components describe more than 98% of the variance of the
RR(
λ) data analyzed for the calibrated data.
Since a hyperspectral reading provides a feature vector equal to the number of bands, PCA can be used to reduce the dimensions. Thus, the dimension of all score vectors was reduced after utilizing the PCA, then score data was used for training two SVM classifiers.
Table 1 shows the miss-classification rate of both classifiers trained with different numbers of PCs.
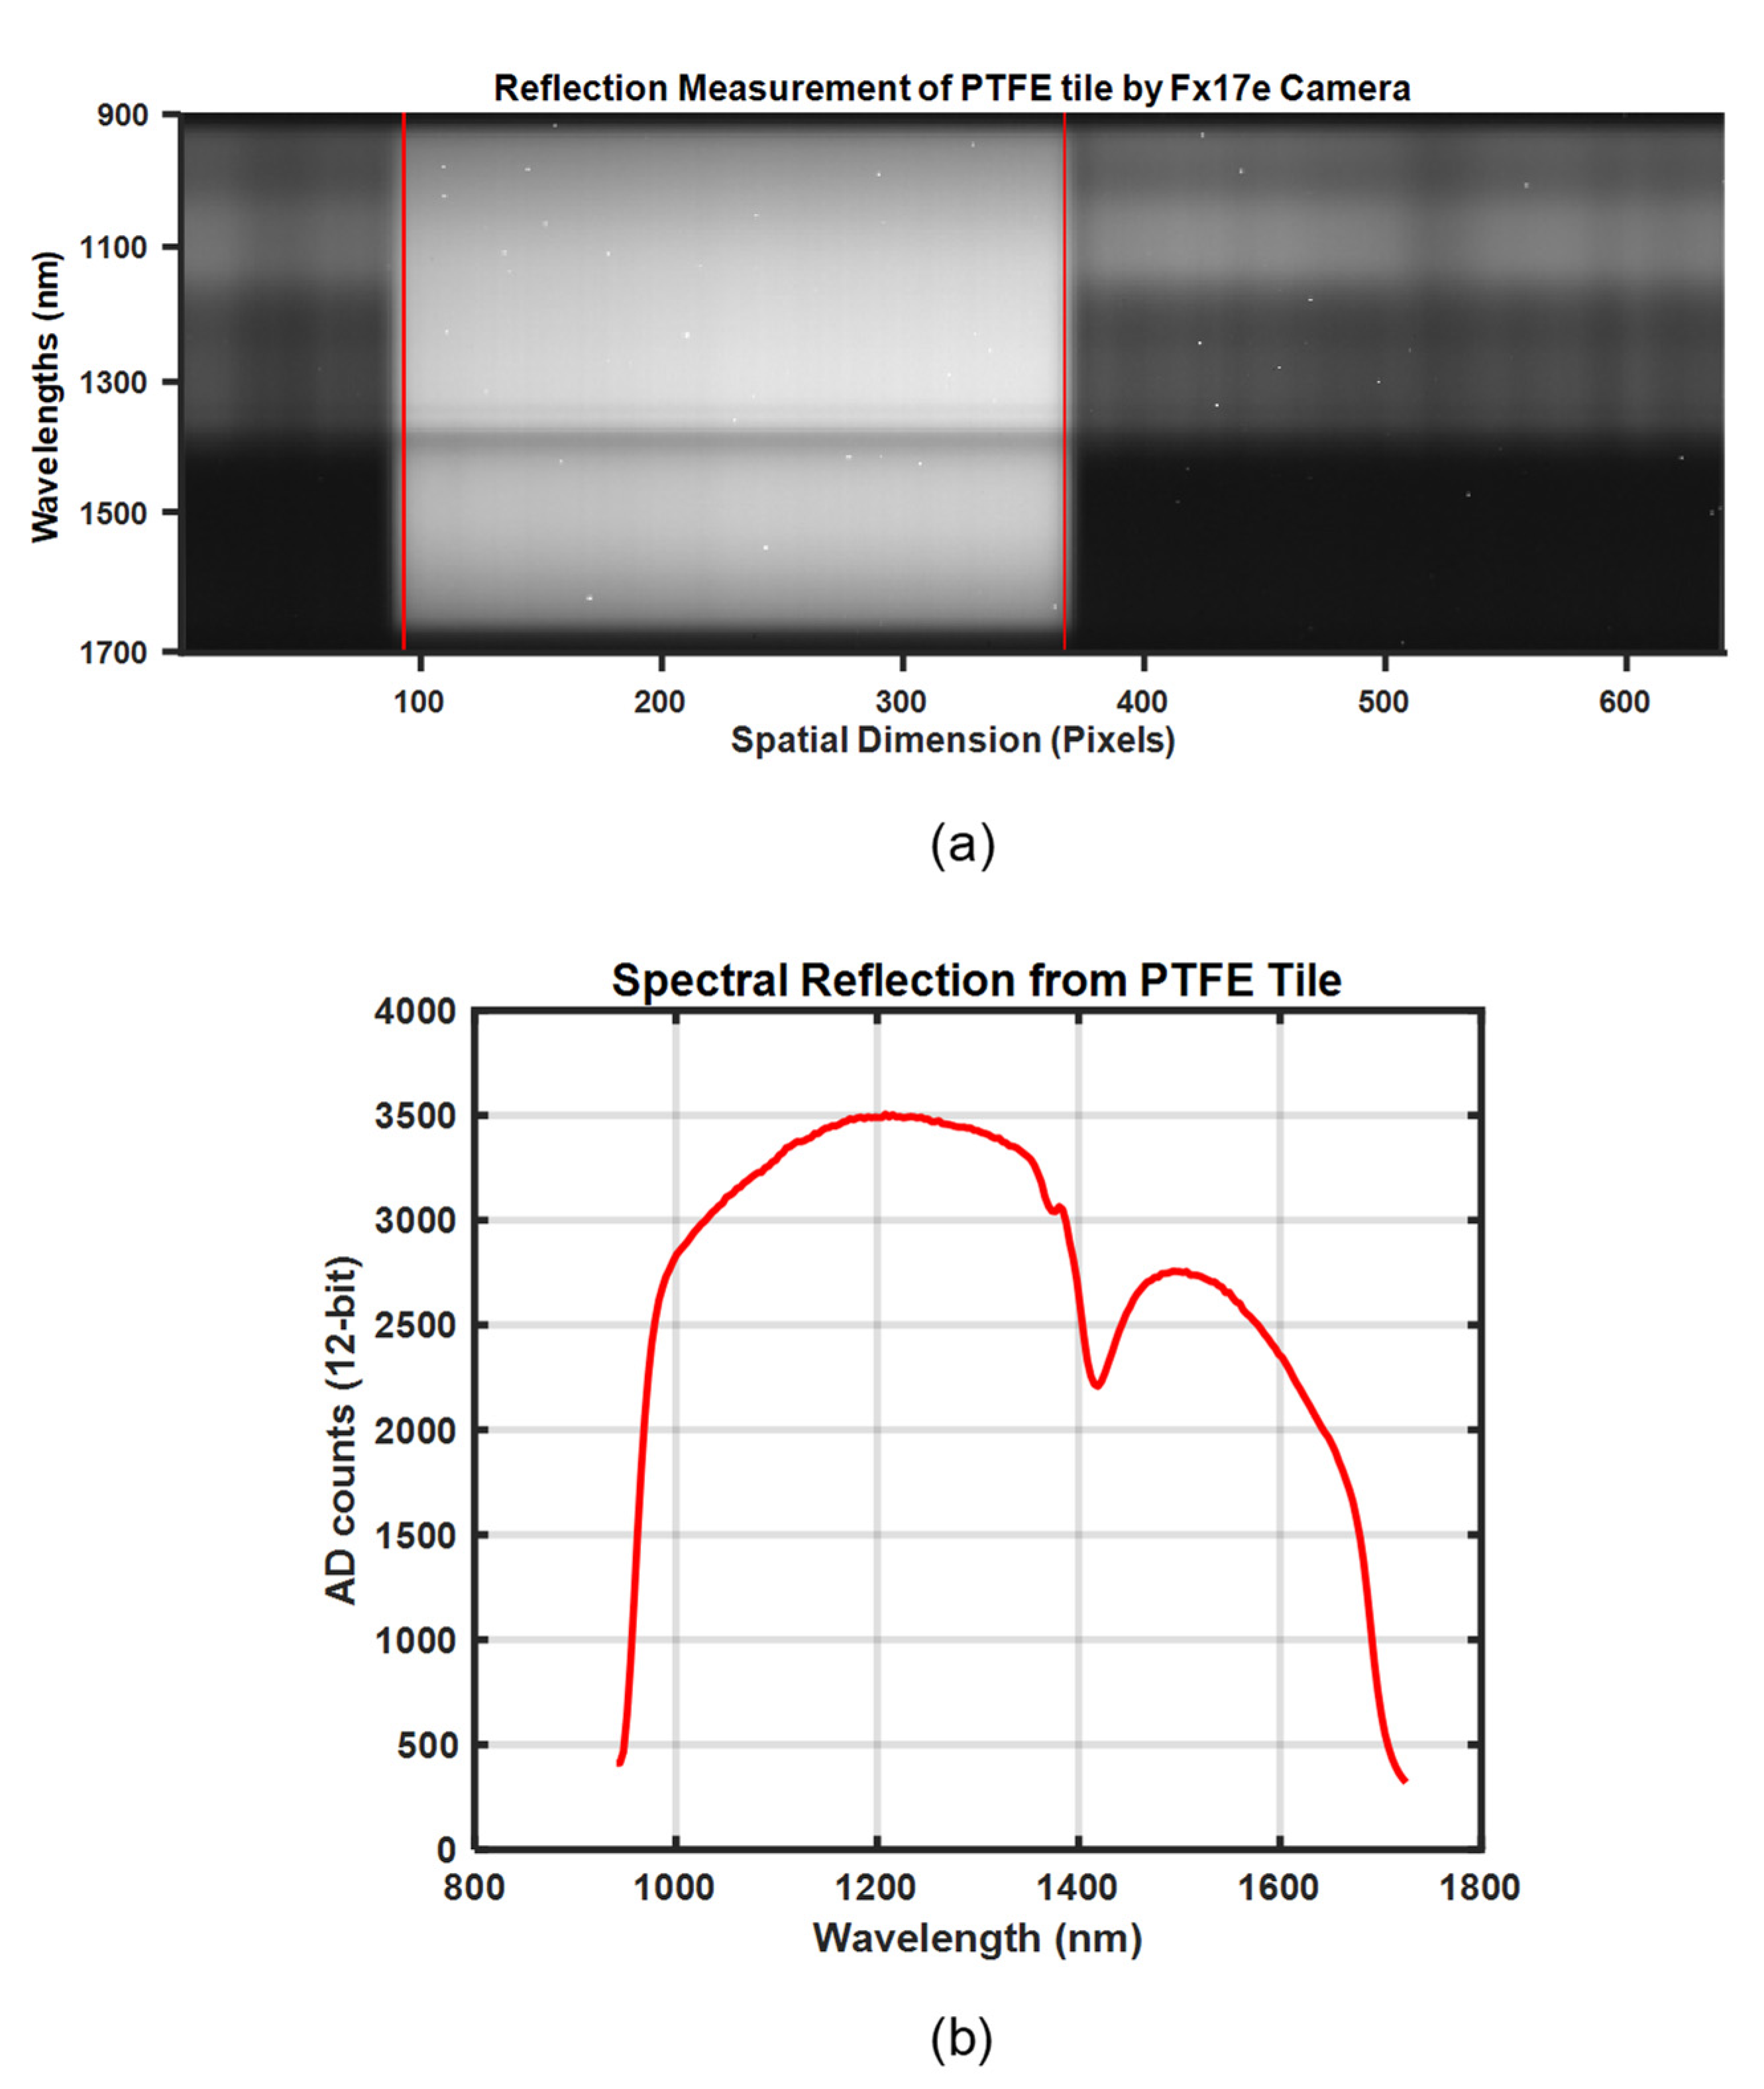
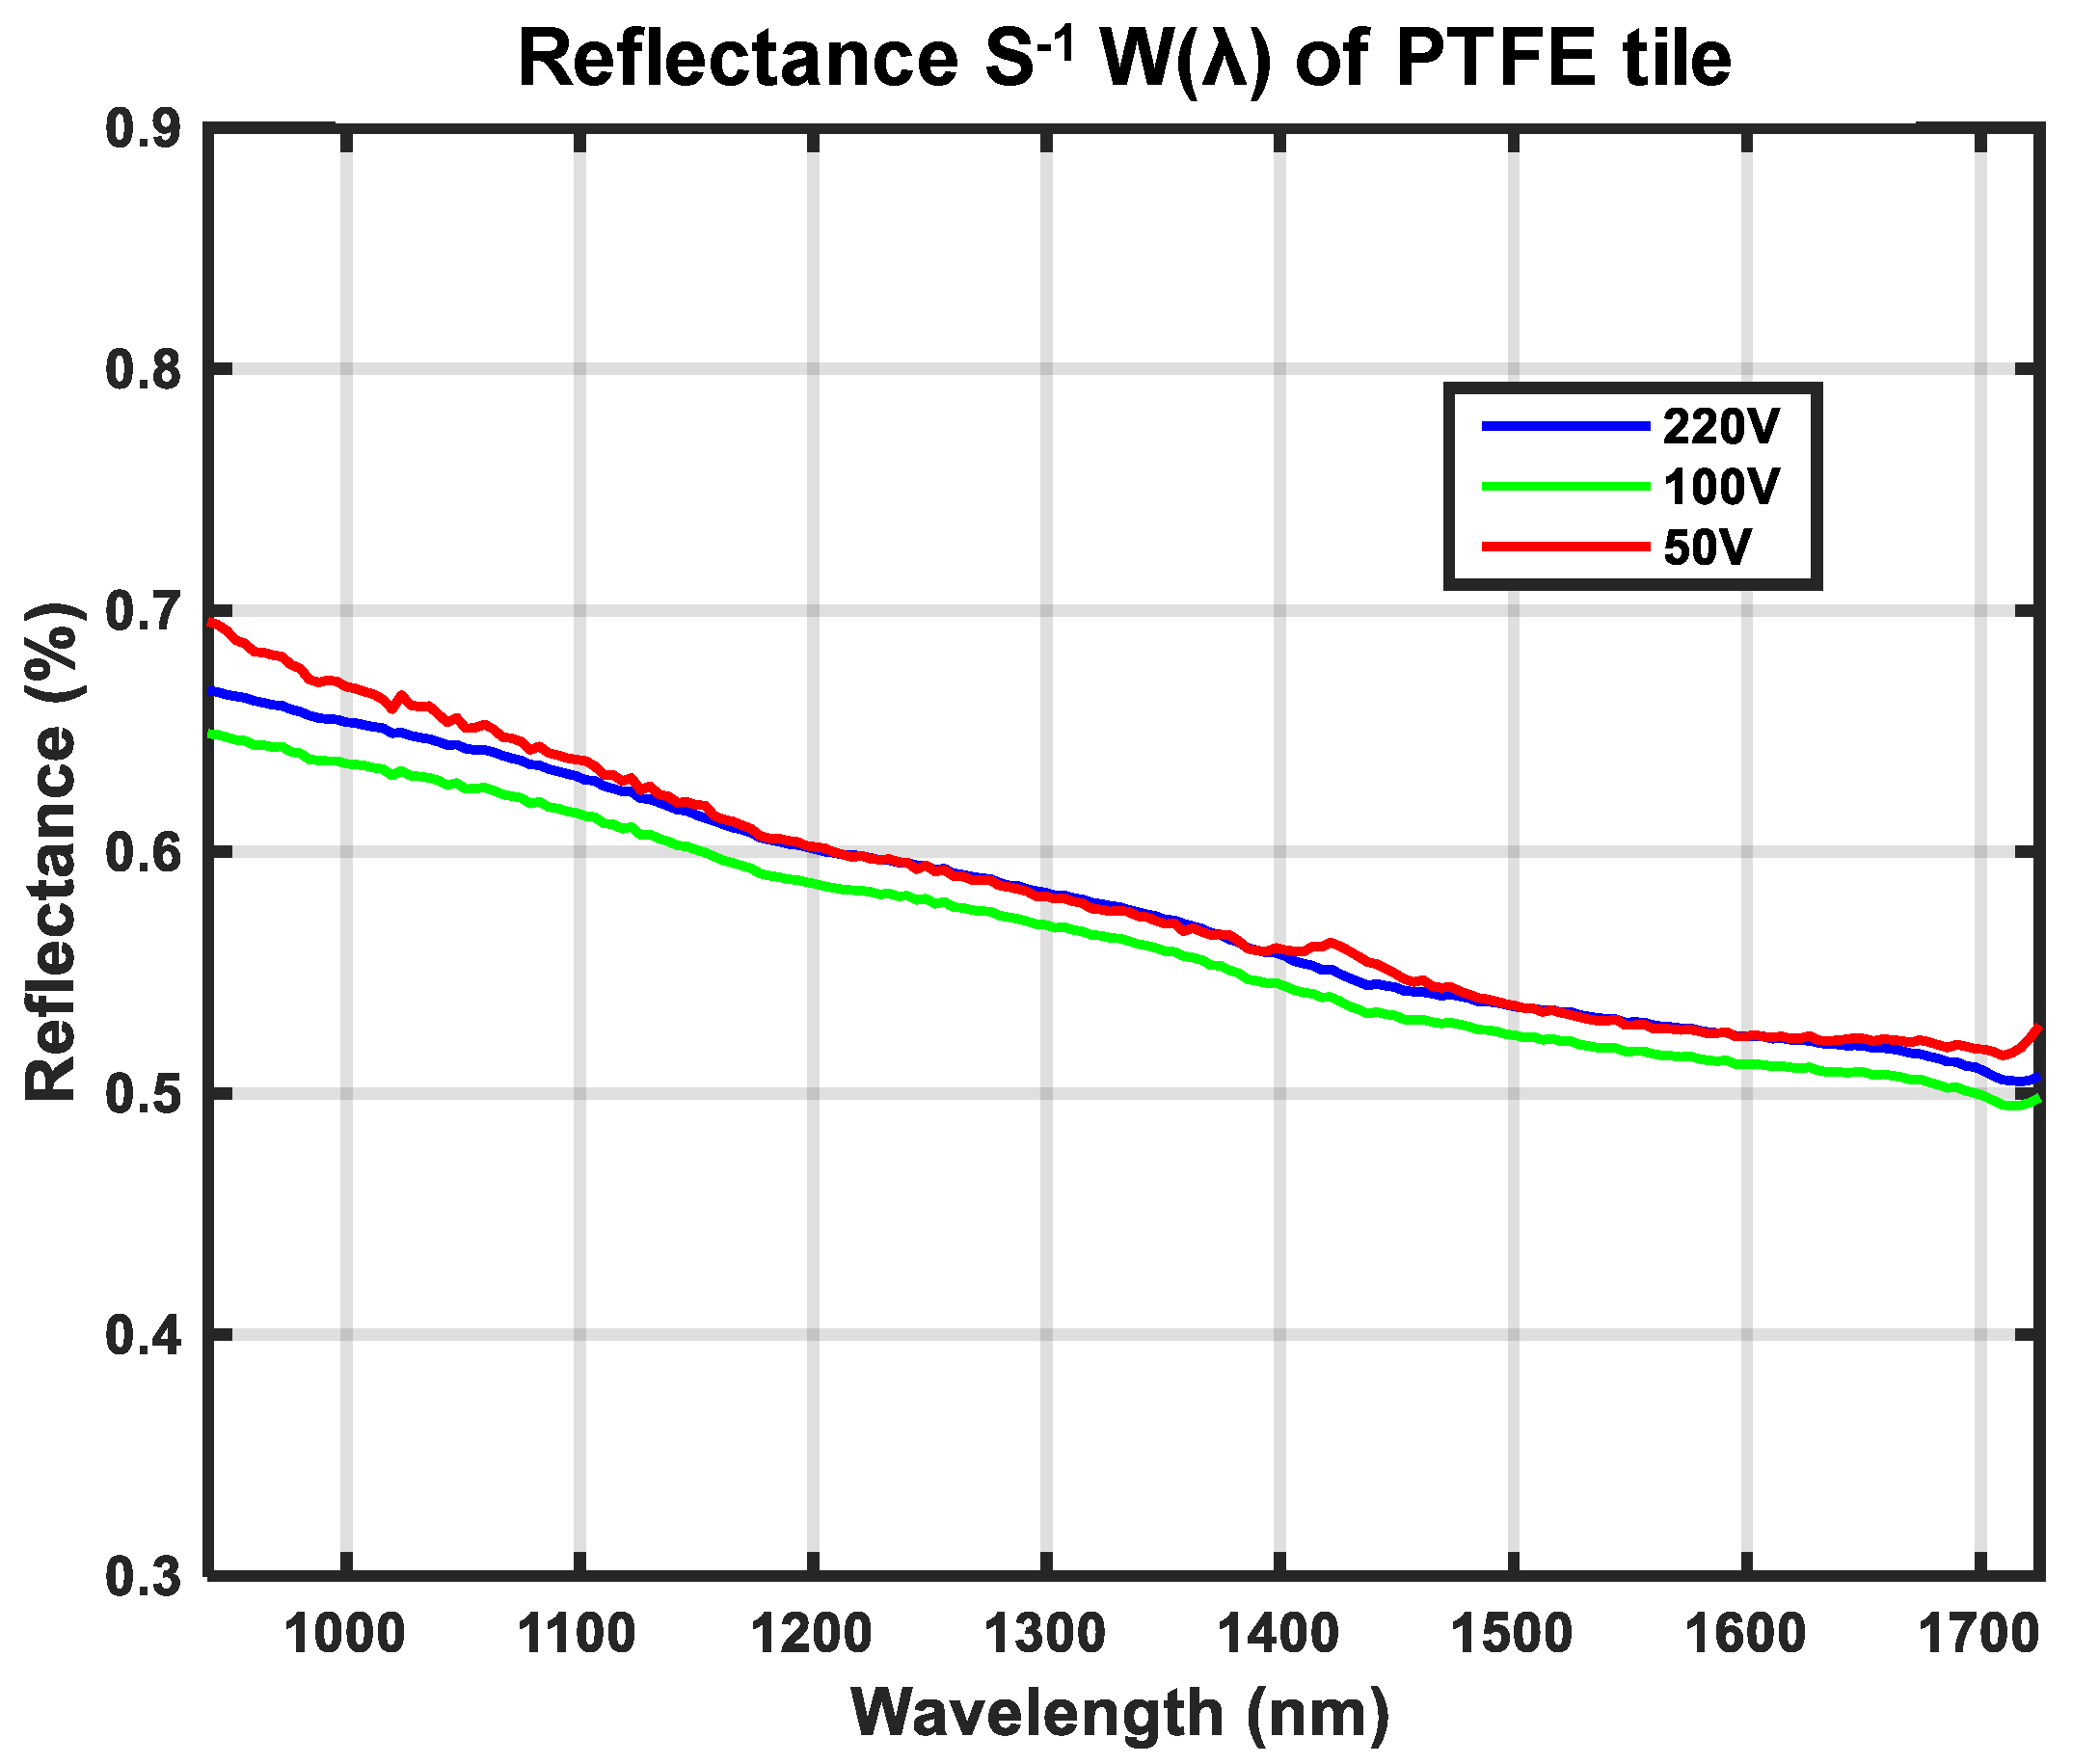
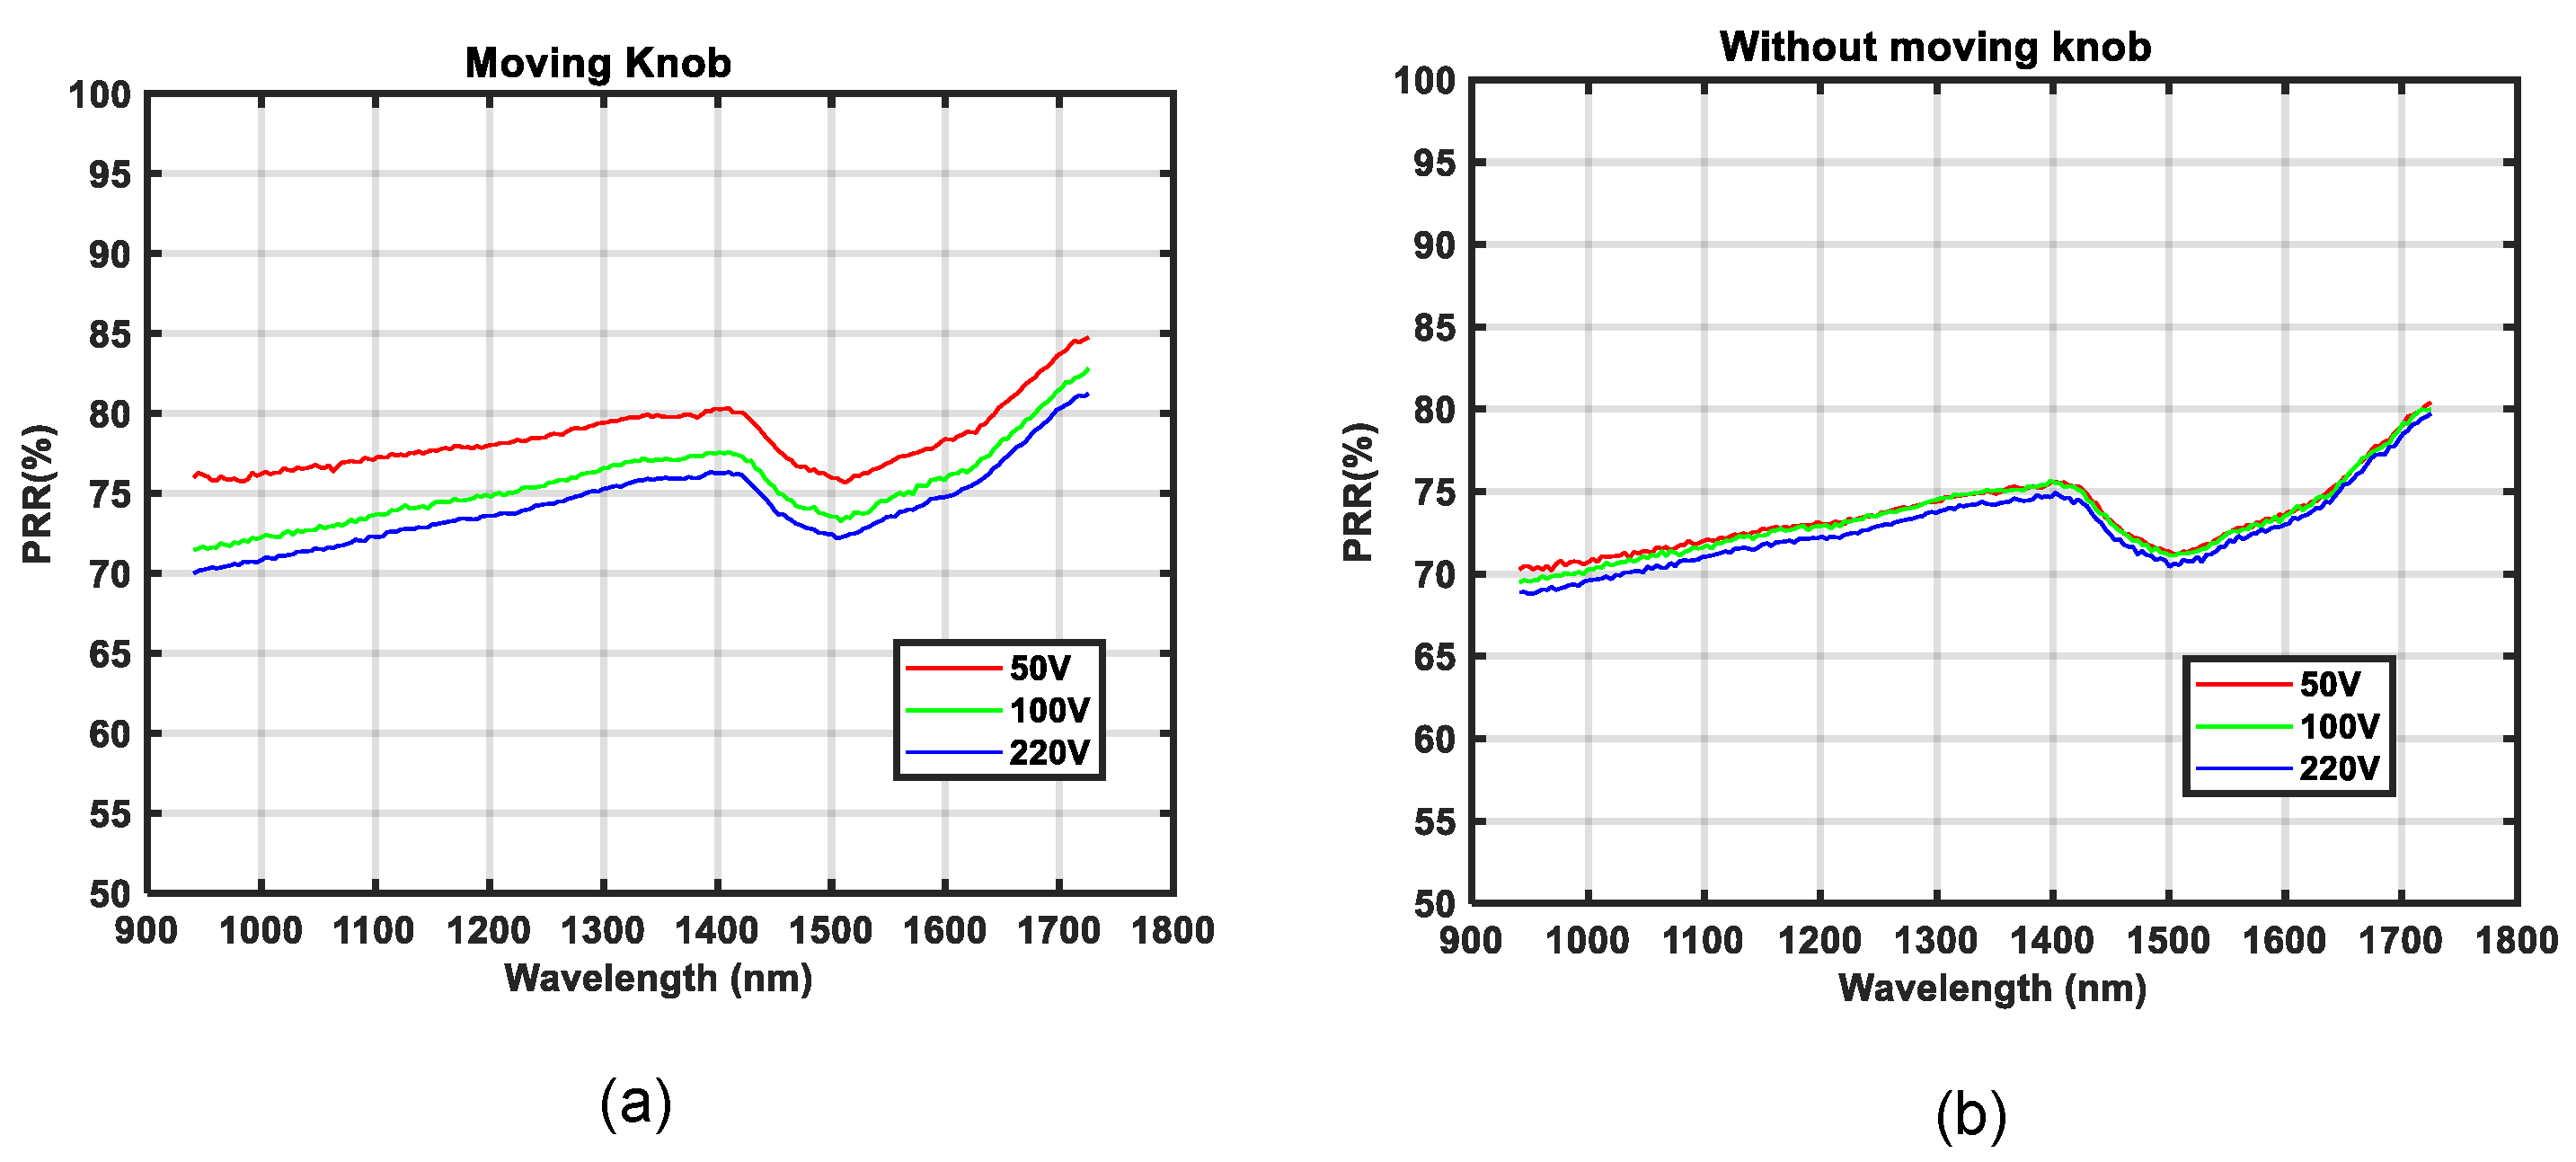
The spectral distribution of reflectance for the calibration reference
W(
λ) is shown in
Figure 16. The close similarity of the illumination spectra generated from lamp voltages 50 V, 100 V, and 220 V verify that the computed
W(
λ) is close to being independent of the illumination source. Ideally,
W(
λ) should only be dependent on the material chosen for the calibration reference and independent of the illumination source and camera. The computation of
W(
λ) using Equation (10), therefore requires the spectral distribution of light intensity DL(λ) to be measured separately using the same camera; for more details, see Equation (9).
Figure 5c depicts how the camera was directed towards the light source. The recorded light intensities are much higher for direct measurements in accordance with
Figure 5c than compared to the setup in
Figure 5a. This unknown scaling of intensities was modeled with the constant
s; see Equation (9) for further details, which also explains the low reflectance values in
Figure 16.
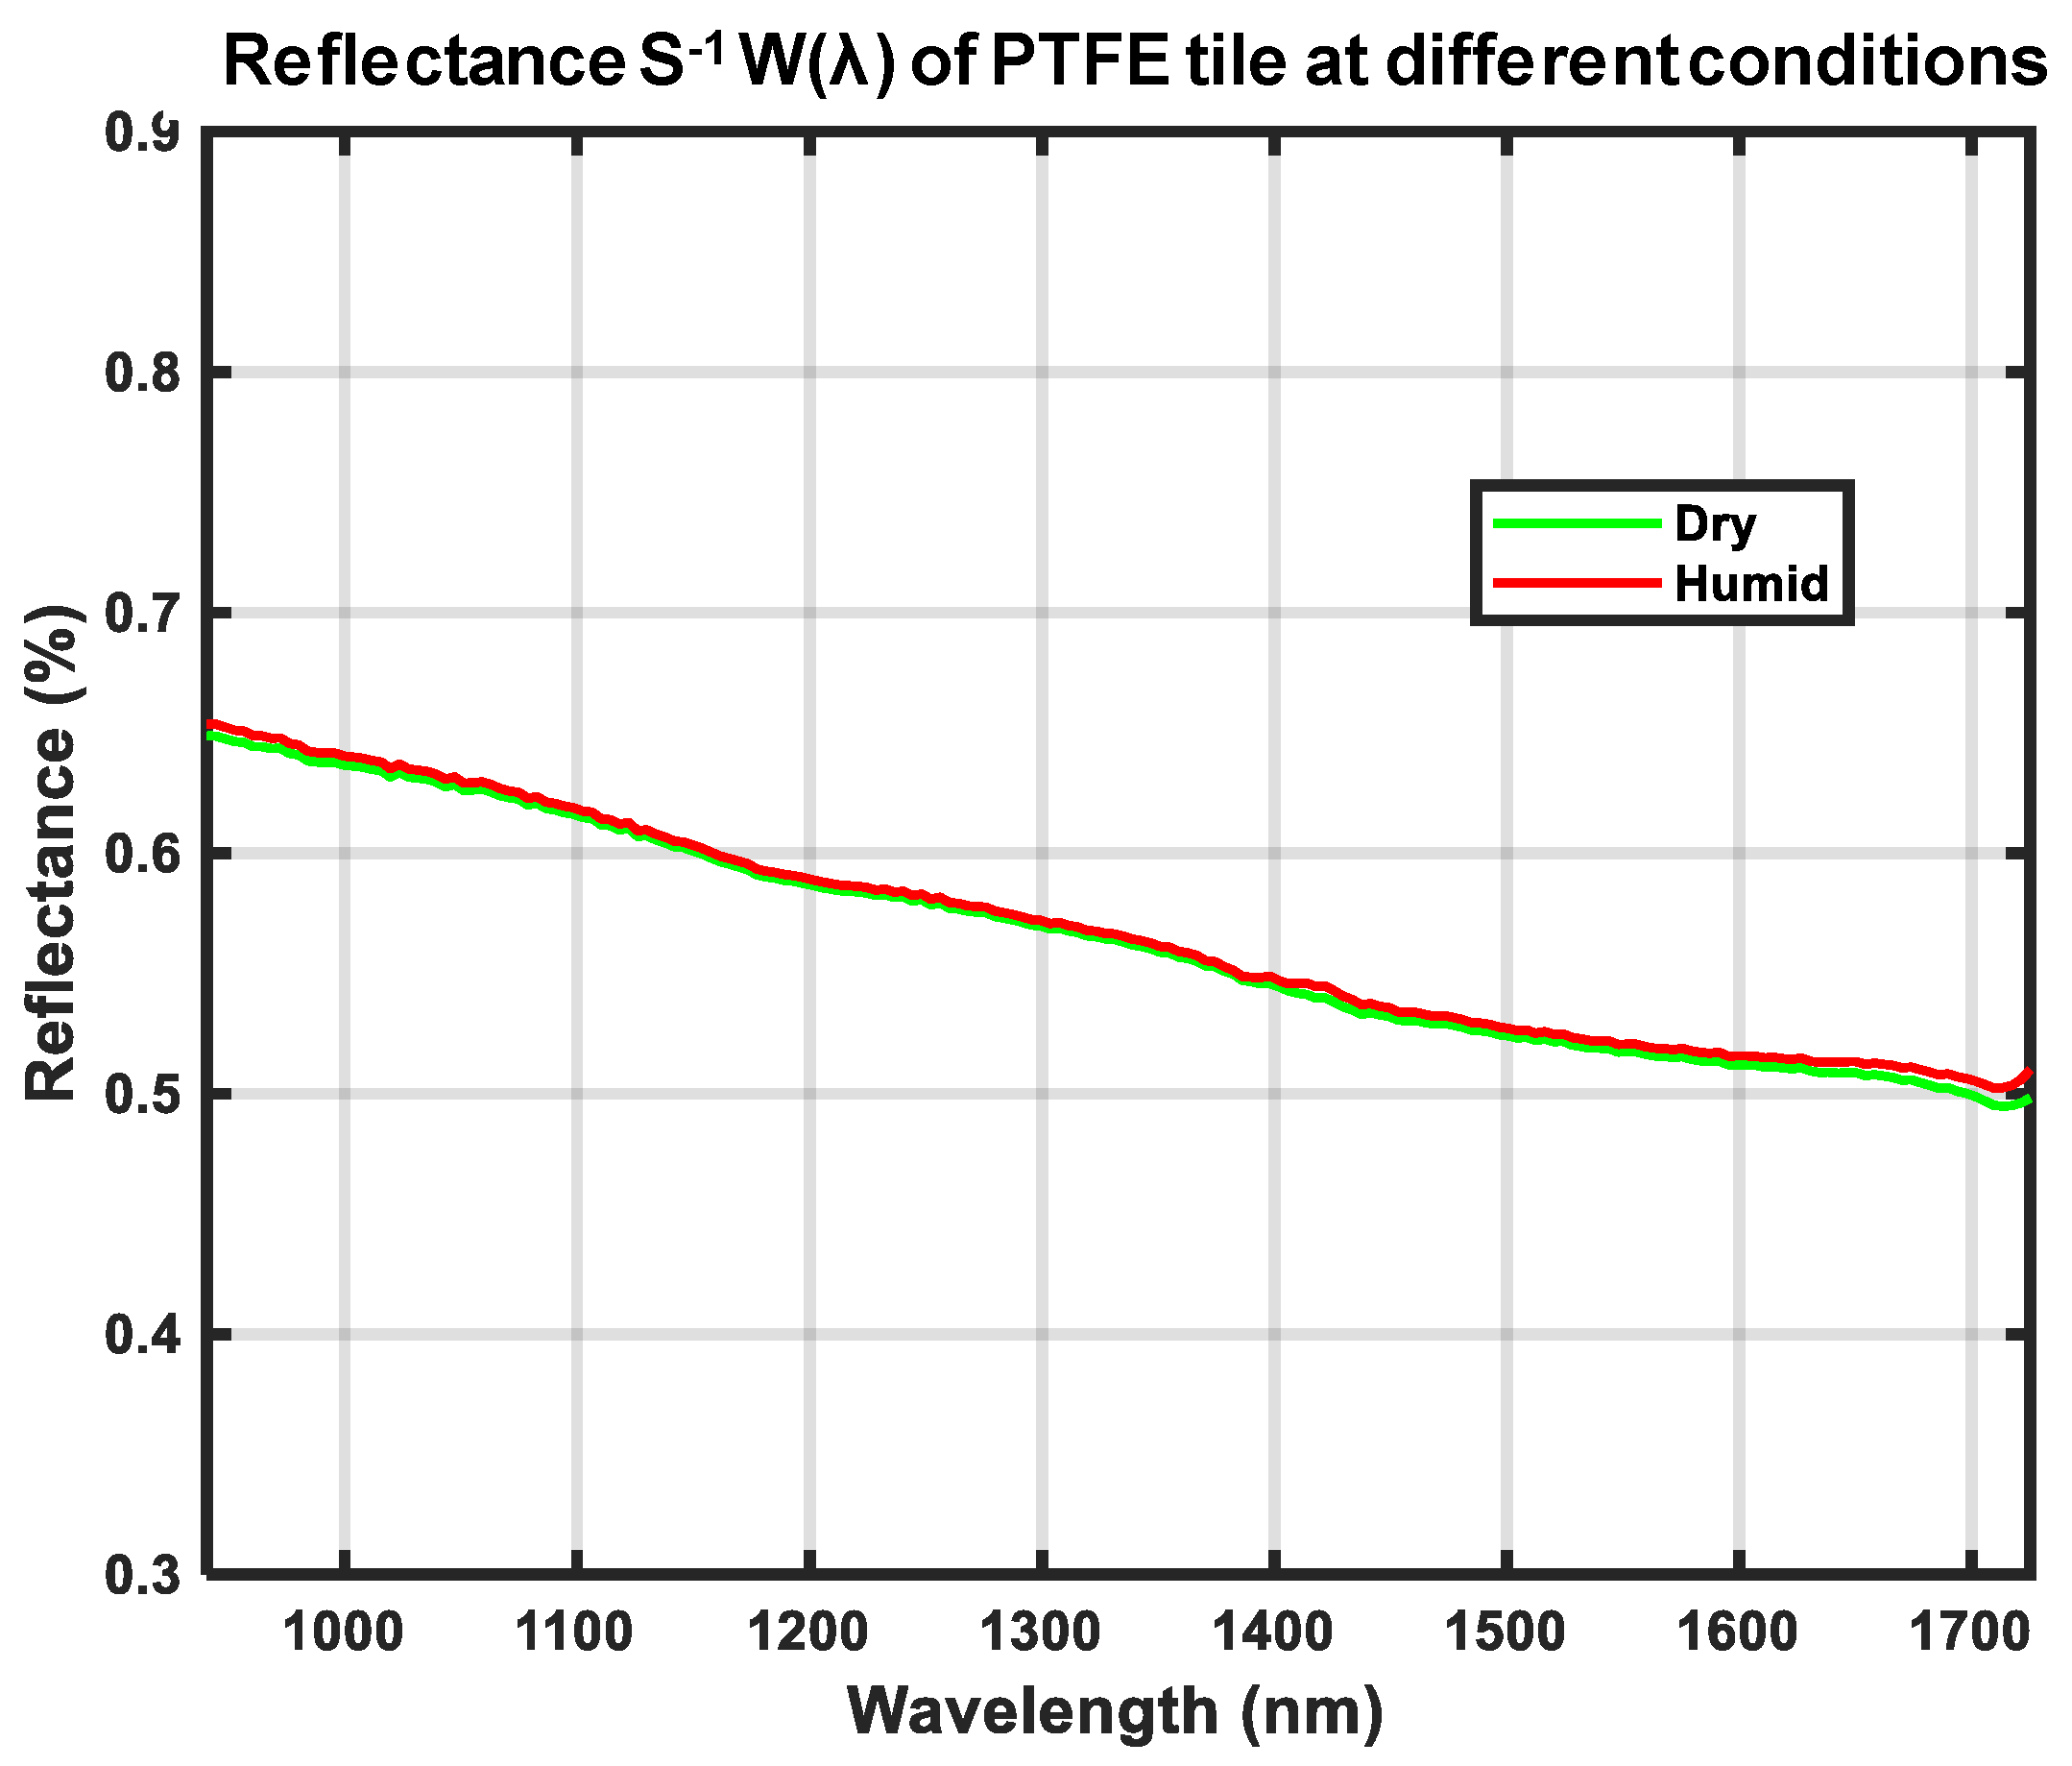
Figure 17 shows the computed
W(
λ) from a similar measurement of our calibration reference that was first submerged in water for 24 h. We wiped the visible water from the surface of the calibration reference and then measured
WR(
λ). The calibration reference was left to dry in an oven for 2 h at 70 °C and then the same measurement of
WR(
λ) was made again. The computed
W(
λ) for dry and humid conditions in
Figure 17 are close to identical, a requirement defined in
Section 2.1.
4. Discussion
The purpose of this research was to develop a method of spectral imaging to measure the relative reflectance
RR(
λ) of various surfaces, independent of the spectral distribution of both the light intensity of the illumination source
L(
λ) and the camera sensitivity
C(
λ). The analysis of road conditions was our test case. The relative reflectance of snow, icy asphalt, wet asphalt, and dry asphalt were successfully measured. These measurements were carried out using different exposure times for the calibration reference and for the analyzed surface. The results from these measurements, presented in
Figure 14, match closely with the known signatures of snow, ice, and wet asphalt presented in previous studies [
26,
27]. Therefore, the calibration procedure required to compute
RR(
λ) can be considered as feasible, assuming that the calibration reference is close to a ‘white reference’, as explained in
Section 2.1.
More accurate measurements of the spectral distribution of reflectance for a material
M(
λ) require a more advanced calibration procedure to assure that the measured
M(
λ) is not only independent of the illumination source and the camera but also of the calibration reference. In theory, it is shown that this is possible using Equation (8) if the spectral distribution of reflectance for the calibration reference
W(
λ) is known. For this reason, it is also shown how s
−1W(
λ) can be measured, as illustrated in
Figure 16 and
Figure 17. The constant
s is an unknown scaling factor preventing true reflectance from being measured, while the relative spectral distribution of reflectance should still be correct. One of the referenced research groups argue that calibrated reflectance standards are not needed. They compared the use of three different non-standard materials for calibration: Acryllic, Cardboard, and Teflon [
13].
Figure 16 shows that our PTFE calibration reference has similar reflectance to Spectralon
TM within a near-infrared light range, presented in [
19]. Generally, the true reflectance of a material is measured using an apparatus that incorporates an integrating sphere [
27]. We did not have access to an integrating sphere for this research. Instead, the experimental setups shown in
Figure 5 were used to measure s
−1W(
λ).
Figure 16 shows that the reflectance percentage of our calibration reference was very low. This is because of the unknown scaling factor
s, which was used to model the more powerful direct light source compared with the diffused reflectance of the calibration target.
As one of the purposes of this study was to measure relative reflectance independent of an illumination source, the quality of our results directly relates to how much the measurement graphs for different voltages overlap; for more details, see
Figure 14. It can be seen that one of the measurements was slightly less overlapping with the other two, especially in the case of wet asphalt, as shown in
Figure 14c. By investigating this result, it was found that the source of error was the limited precision of the variable transformer that was used to set the lamp voltages. To validate our findings, another experiment was conducted. Spectral measurements of brown paper at three different voltage levels: 50 V, 100 V, and 200 V, were recorded. Then the calibration reference was placed in front of the camera and the same spectral measurements were made again using lamp voltages, 50 V, 100 V, and 220 V. It was found that the results did not overlap well, as shown in
Figure 18a. In a second experiment, both the paper and the calibration reference were recorded without changing the lamp voltage in-between. This experiment was performed for 50 V, 100 V, and 220 V, and it was found that all three measurements overlapped almost perfectly; see
Figure 18b. From this experiment, it was concluded that the source of error must have been the precision of the lamp voltages set by the variable transformer.
The score plot of the PCA analysis of the relative reflectance, shown in
Figure 15b, shows that all of the data vectors
RR(
λ) are grouped into distant clusters, depending on the road conditions measured. This clustering of data vectors is irrespective of the spectral distribution of light intensity of the illumination source. The large interclass and small intraclass distances emphasize that our proposed calibration method enables the classification of road conditions, even with large variations in the spectral distribution of light intensity. On the other hand, the score plot of PCA of direct reflectance
MR(
λ) (un-calibrated data), shown in
Figure 15a, shows large intra-class and small interclass distances. Furthermore, the classification results also show that it is possible to improve the classification performance with the use of the proposed calibration method.
A calibration reference that is used in outdoor conditions must not absorb humidity such that it affects the spectral distribution of reflected light. This requirement was formulated in
Section 2.1.
Figure 17 shows the result of experiments conducted to determine the possible sensitivity to humidity of our PTFE calibration target reference. Measurements of
s−1W(
λ) were taken in very humid and dry conditions. As the two measurements overlap almost perfectly, this shows that the inexpensive PTFE tile chosen is close to completely insensitive to such environmental changes. It should thus be possible, e.g., to place the calibration reference on humid ground without affecting its spectral distribution of reflectance.
The empirical evidence from the experiment on road status classification is not strong, considering the limited volume on data. Only three different spectral distributions of illumination were used and only a few different locations for each class of road status were included. However, in combination with the theoretical modeling of the calibration procedure, the total evidence for the capability of presented method to suppress any impact from variable spectra of illumination L(λ) was more convincing.
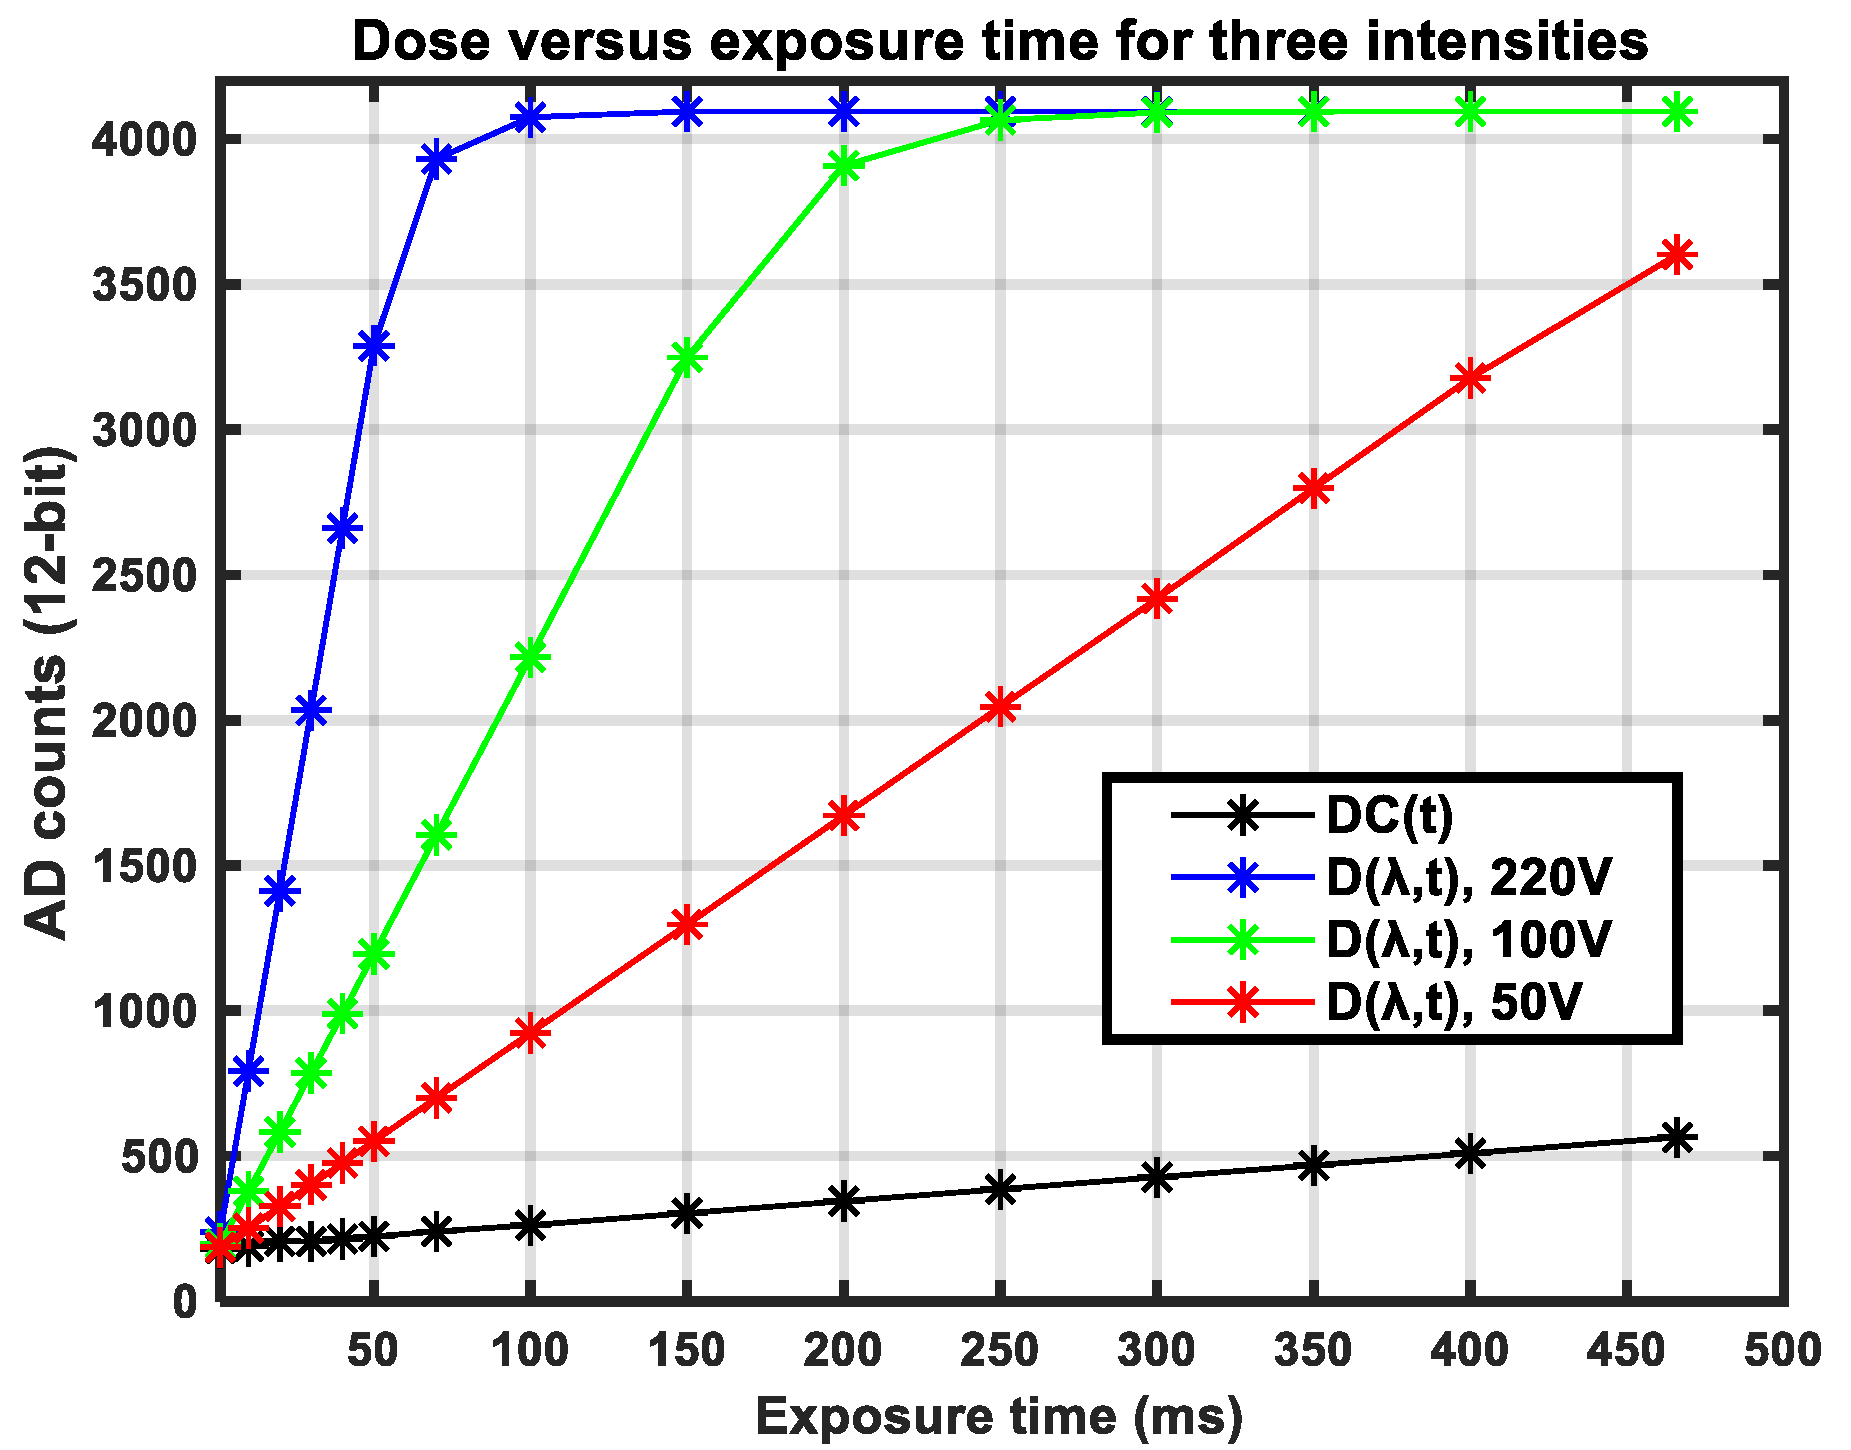
The presented theoretical model comprises a complete hyperspectral imaging system, including spectral distributions of illumination, camera sensitivity, reference, and surface reflectance. The concept of dose, intensity, and exposure time was included in the model, allowing different exposure times for reference and measurements to be used. This flexible use of exposure times was incorporated into the road status experiment and also provided empirical evidence for the specific camera used. However, the normalization of intensity as modeled by Equation (4) could have become erroneous if the camera dose response curve showed more non-linearity than what was recorded for the Specim FX17 camera shown in
Figure 8. If necessary, more accurate models for the dose response could have been included.
This study is lacking empirical evidence for the idea that variations in spectral distribution of camera sensitivity C(λ) can be suppressed, and only a theoretical model is provided. A reliable experiment would require the use of several very expensive cameras, preferably from different manufacturers, a cost which is not possible for the university to cover.


