
Full-Self-Powered Humidity Sensor Based on Electrochemical Aluminum–Water Reaction

 , , ,
, , ,  ,
,
Abstract
1. Introduction
2. Materials and Methods
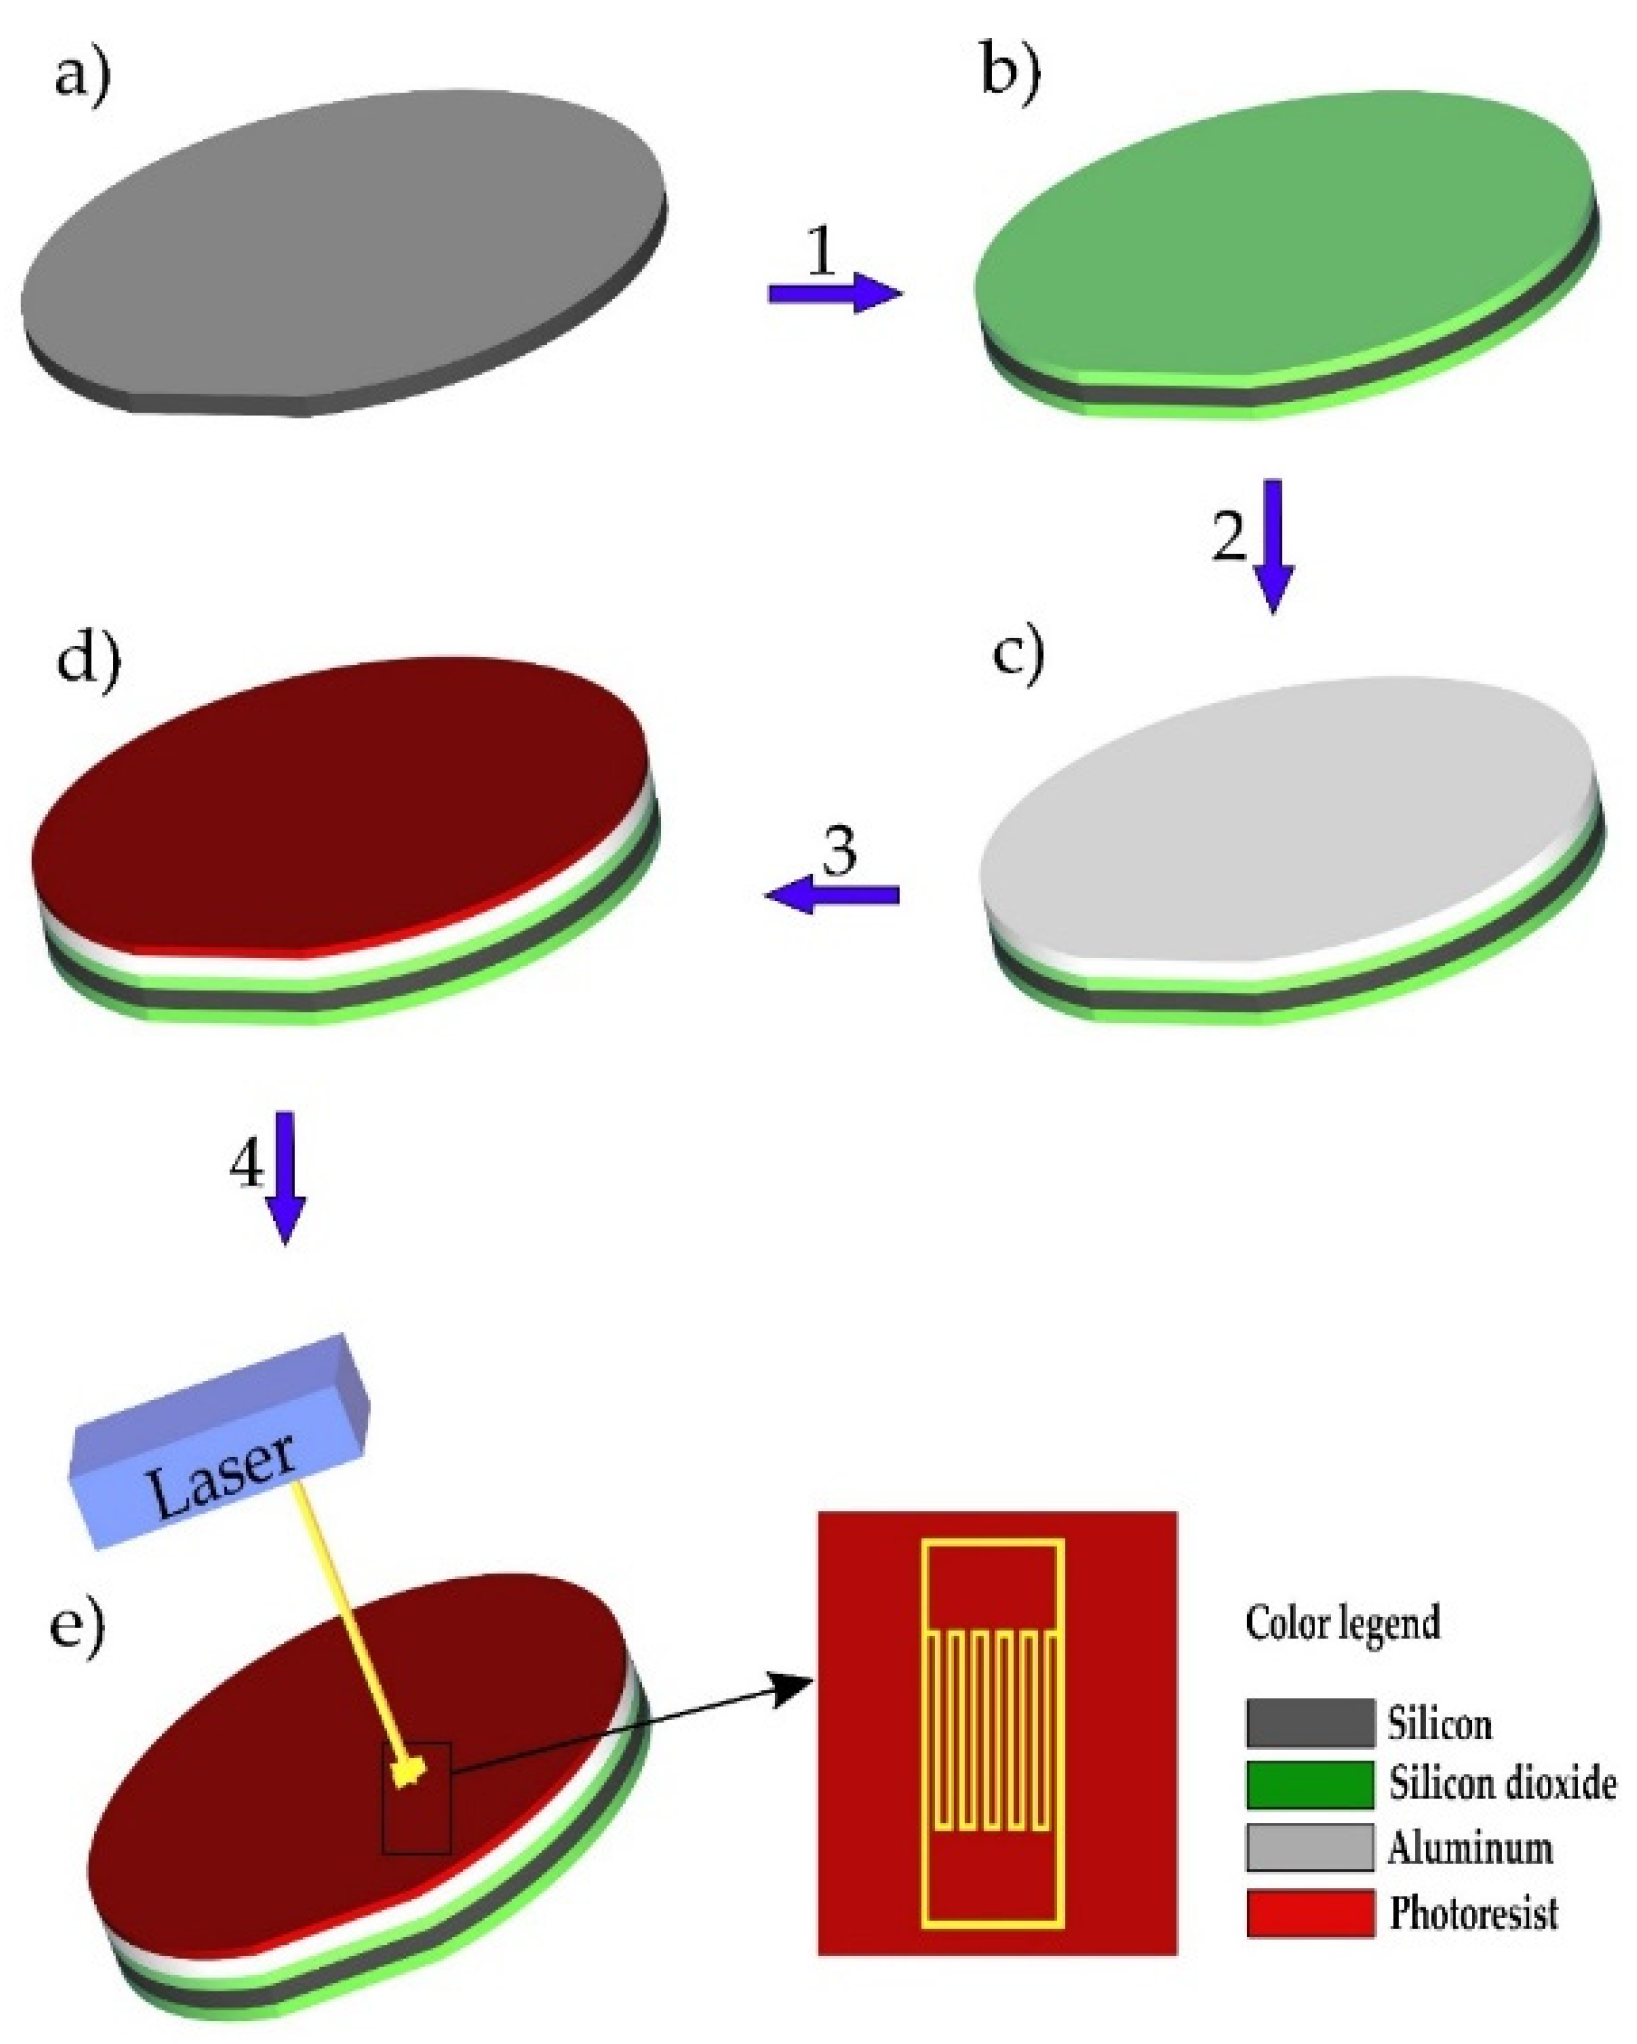
2.1. Fabrication
2.2. Scanning Electron Microscopy
2.3. Atomic Force Microscopy
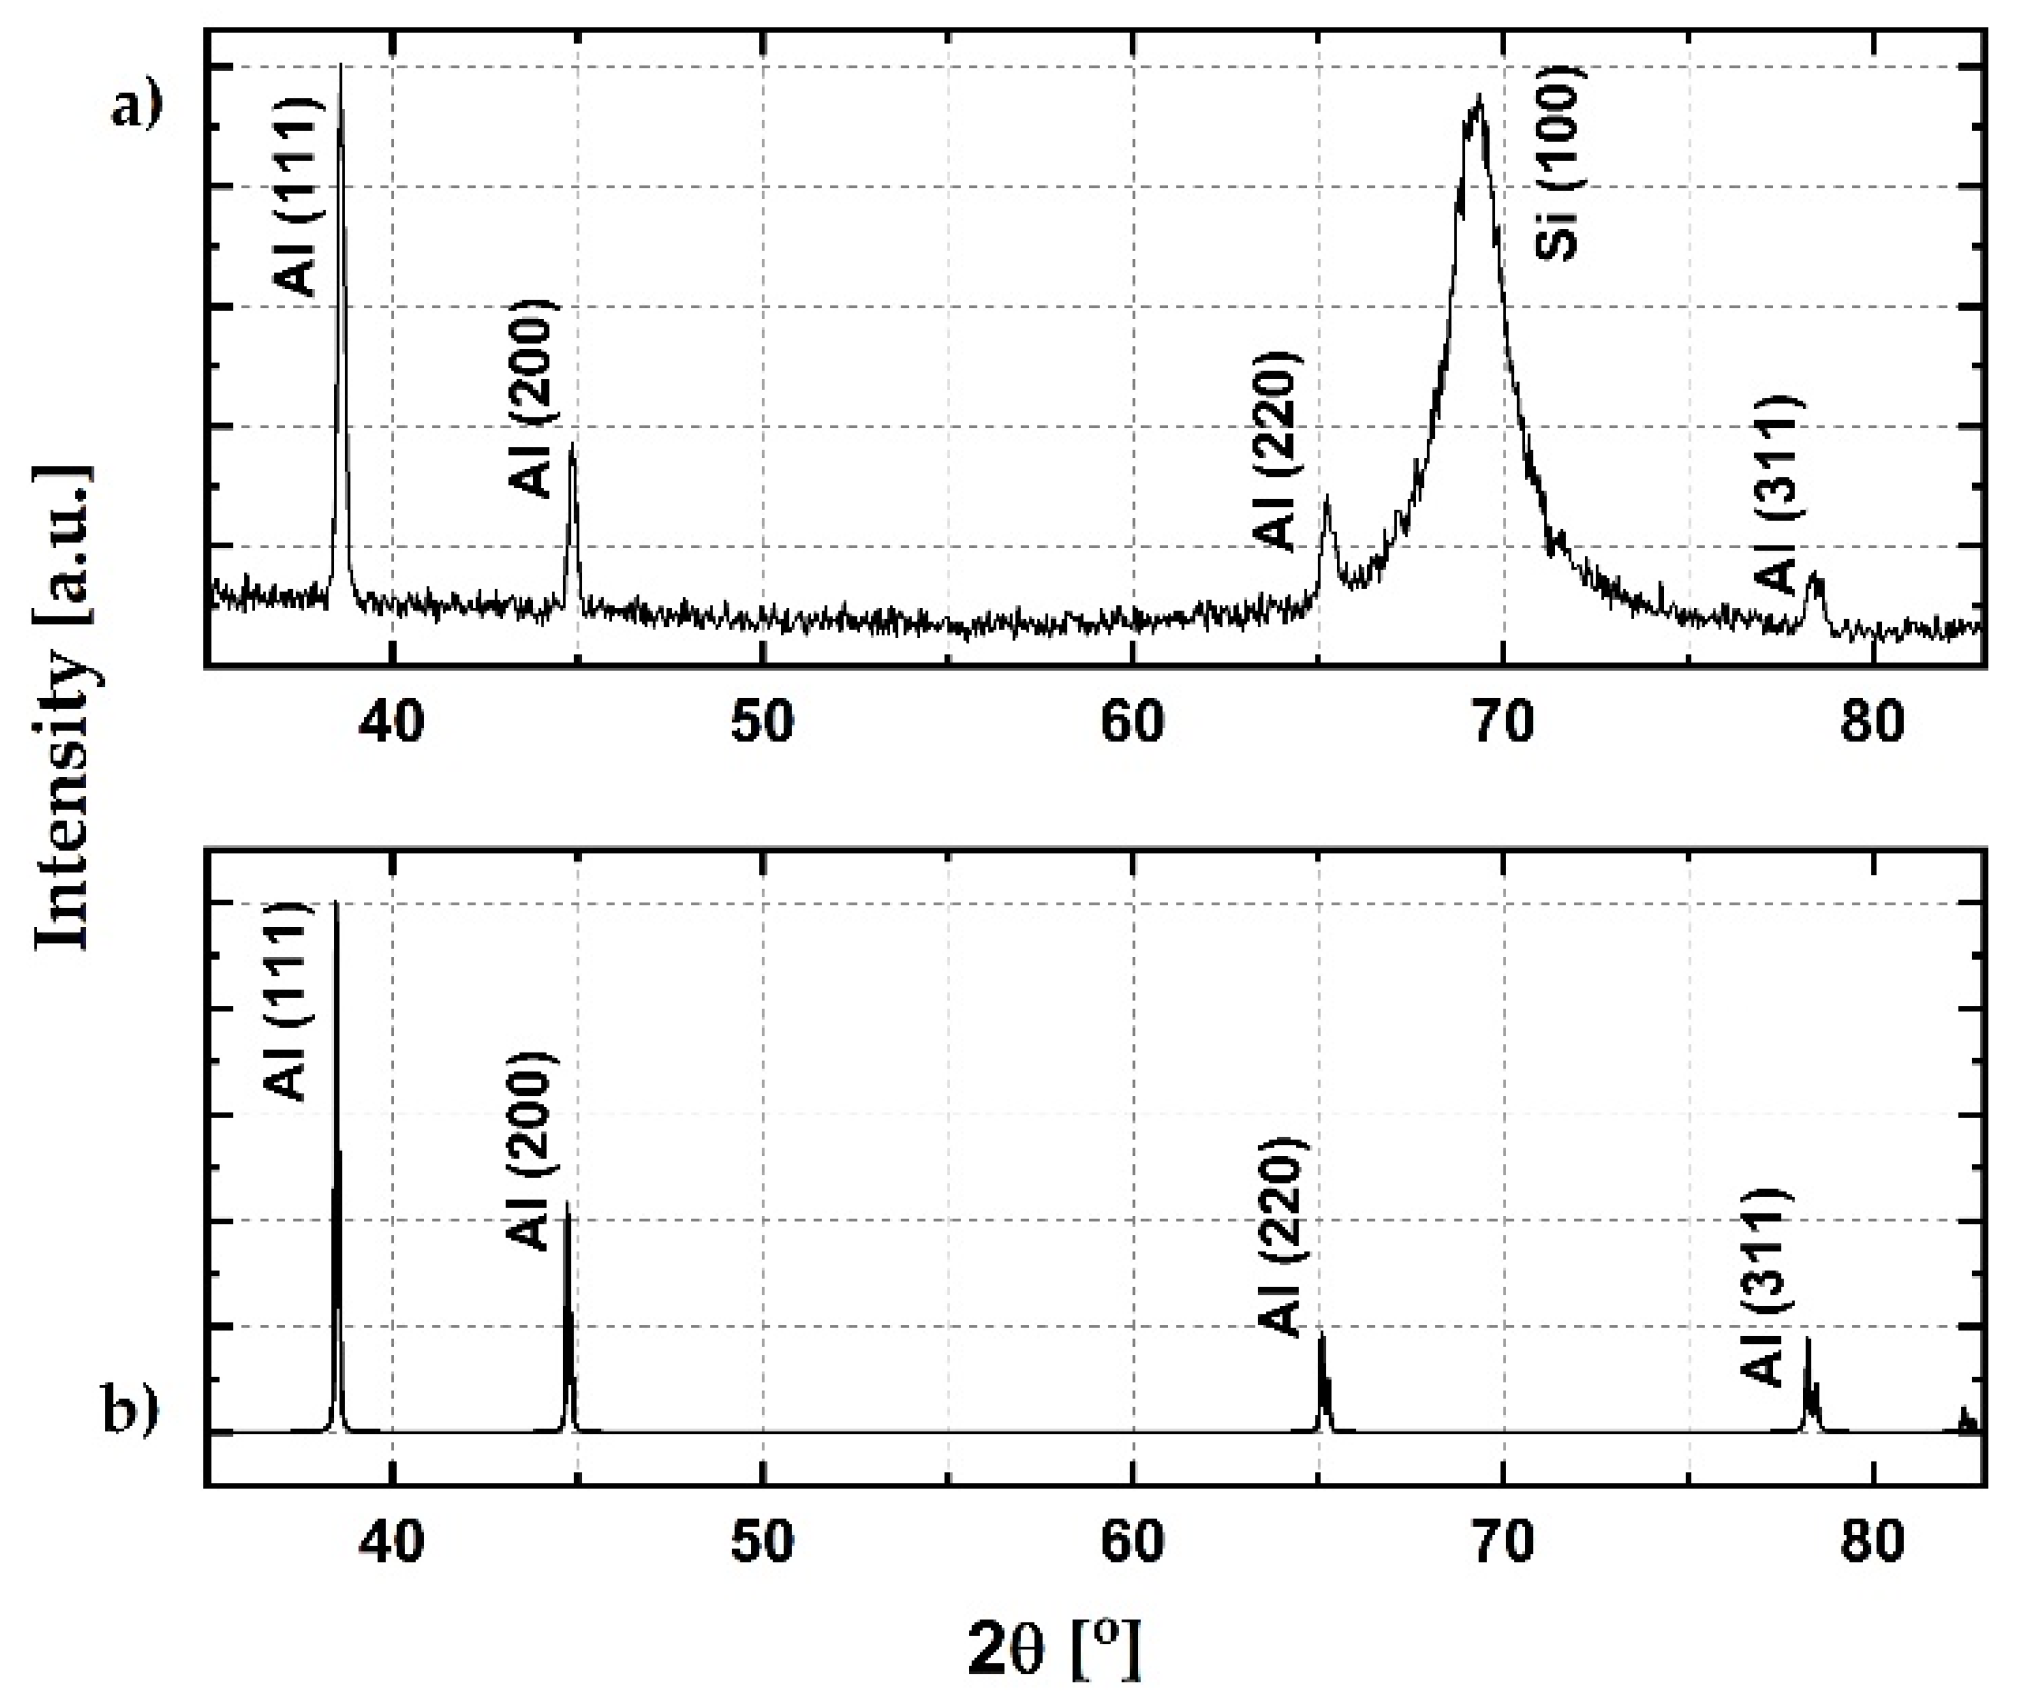
2.4. X-ray Diffraction
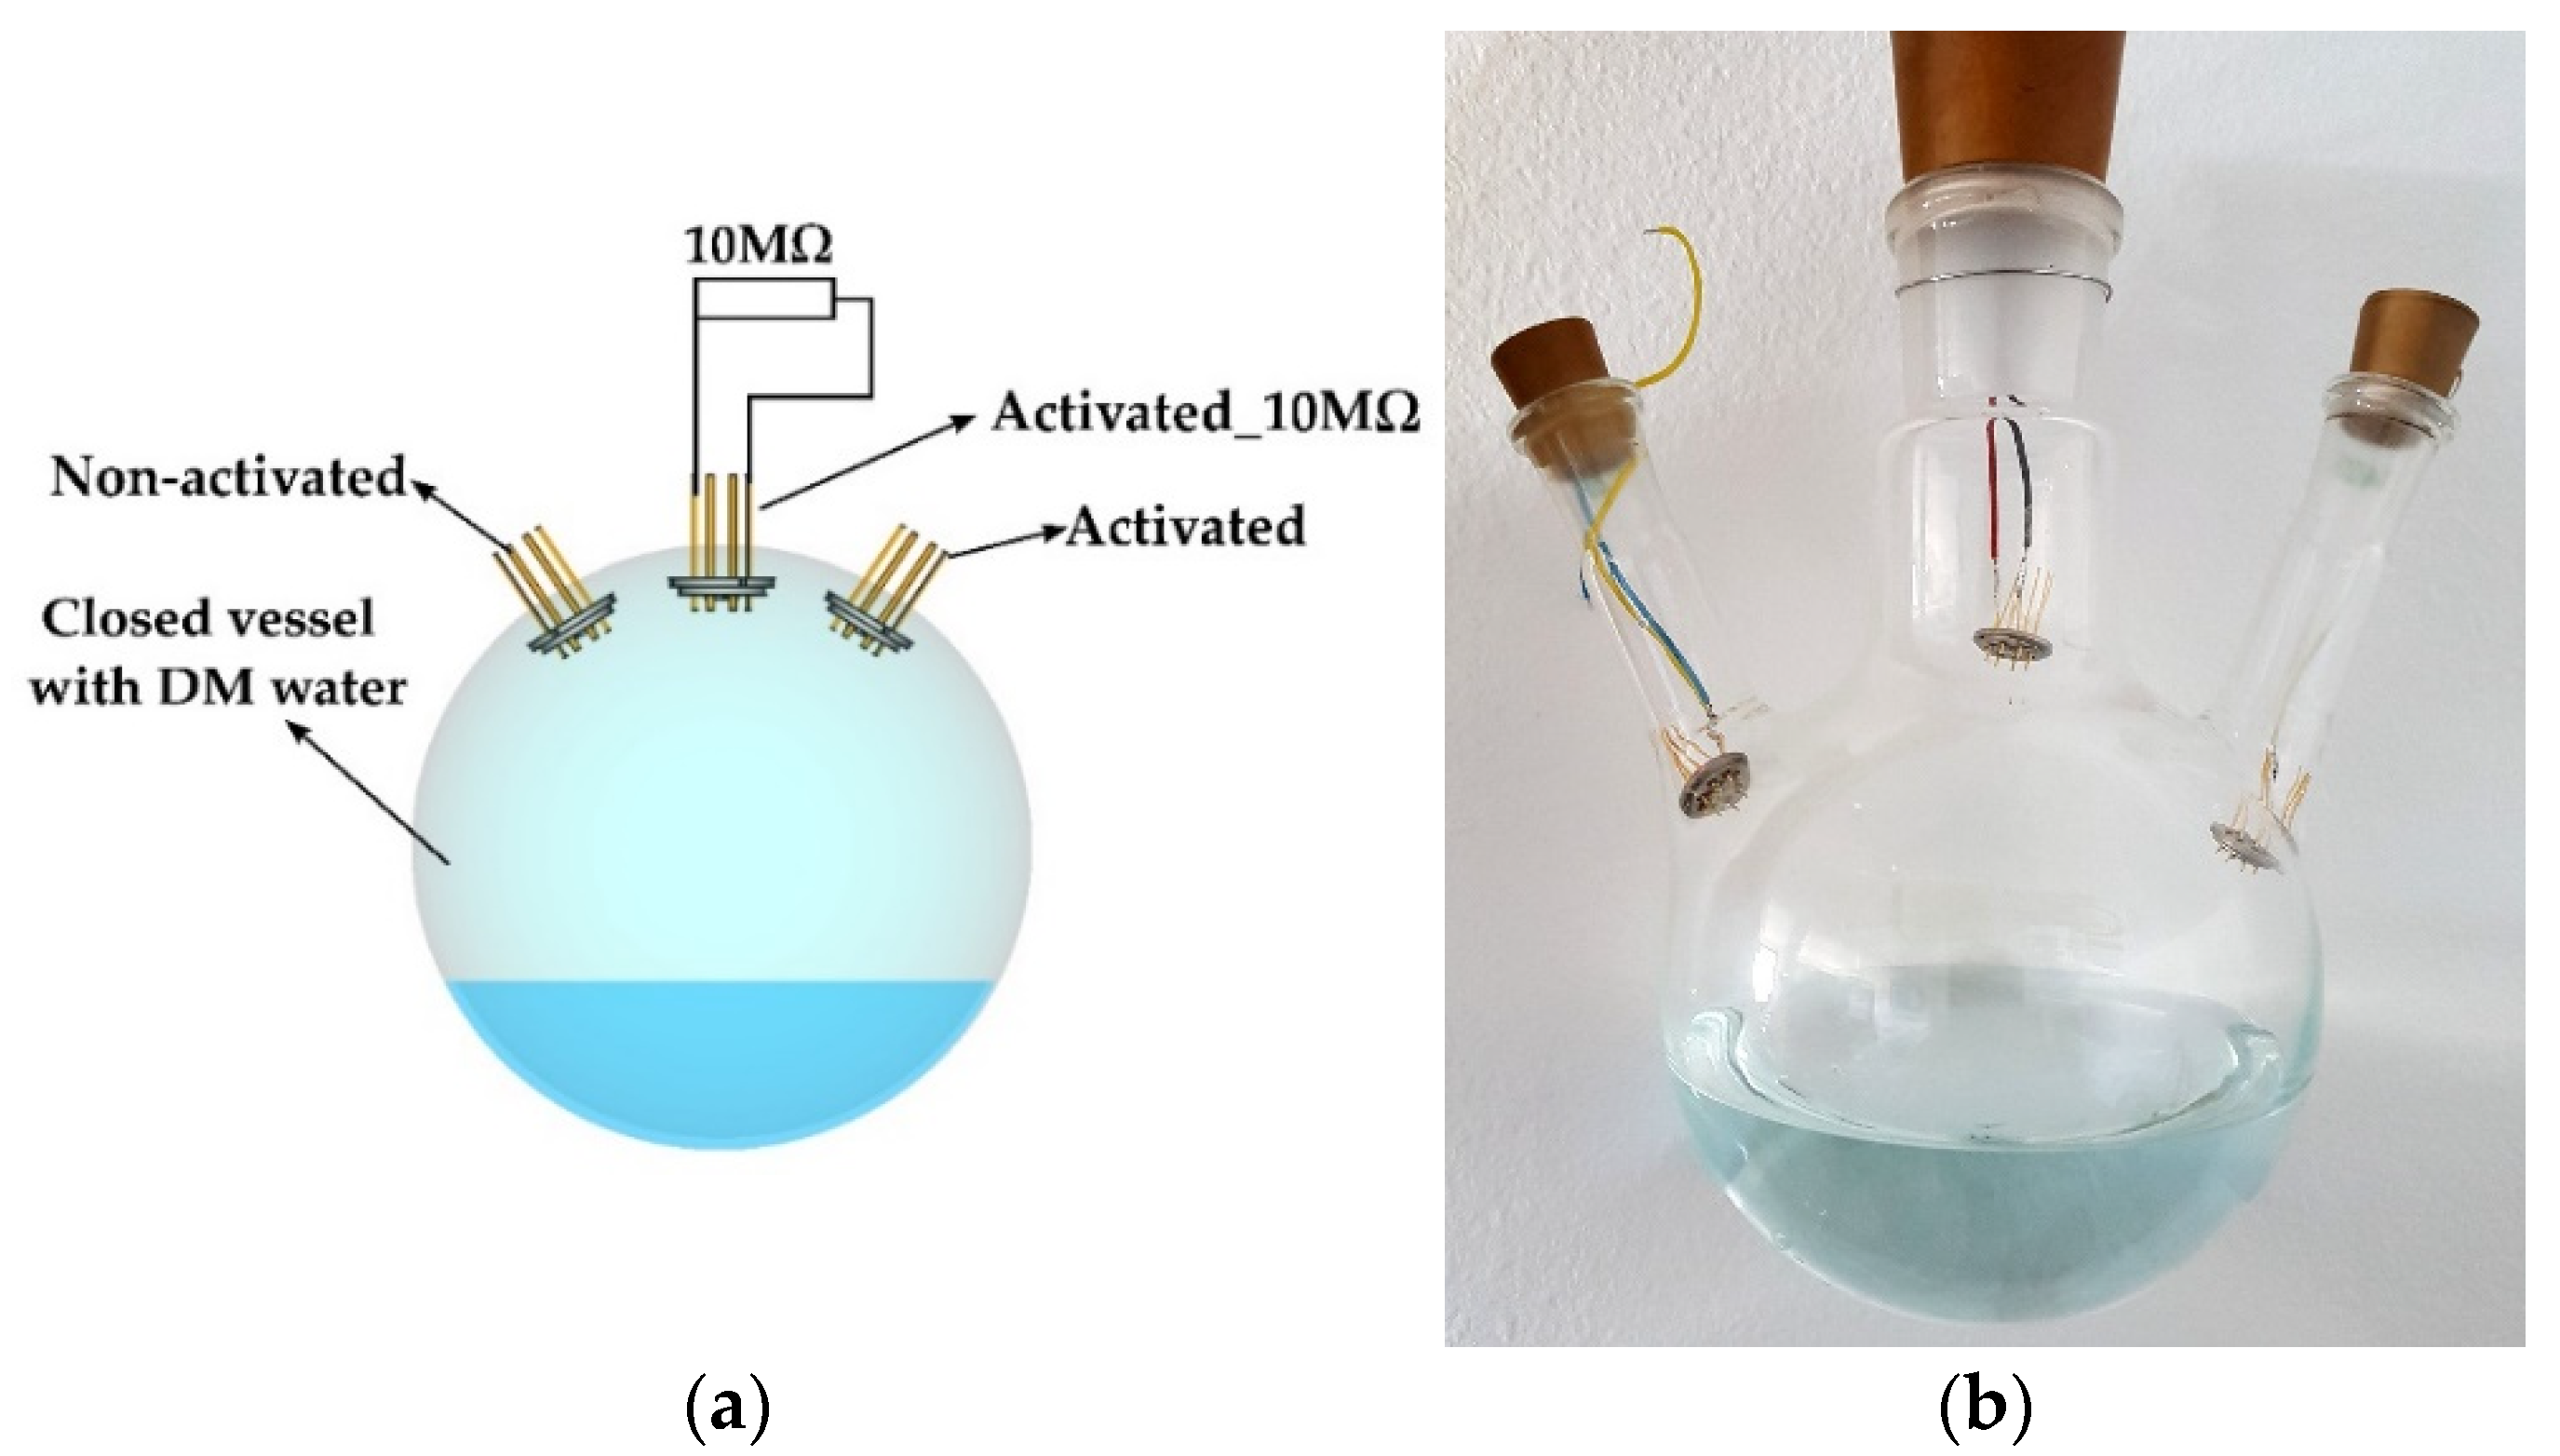
2.5. Electrode Activation
3. Results and Discussion
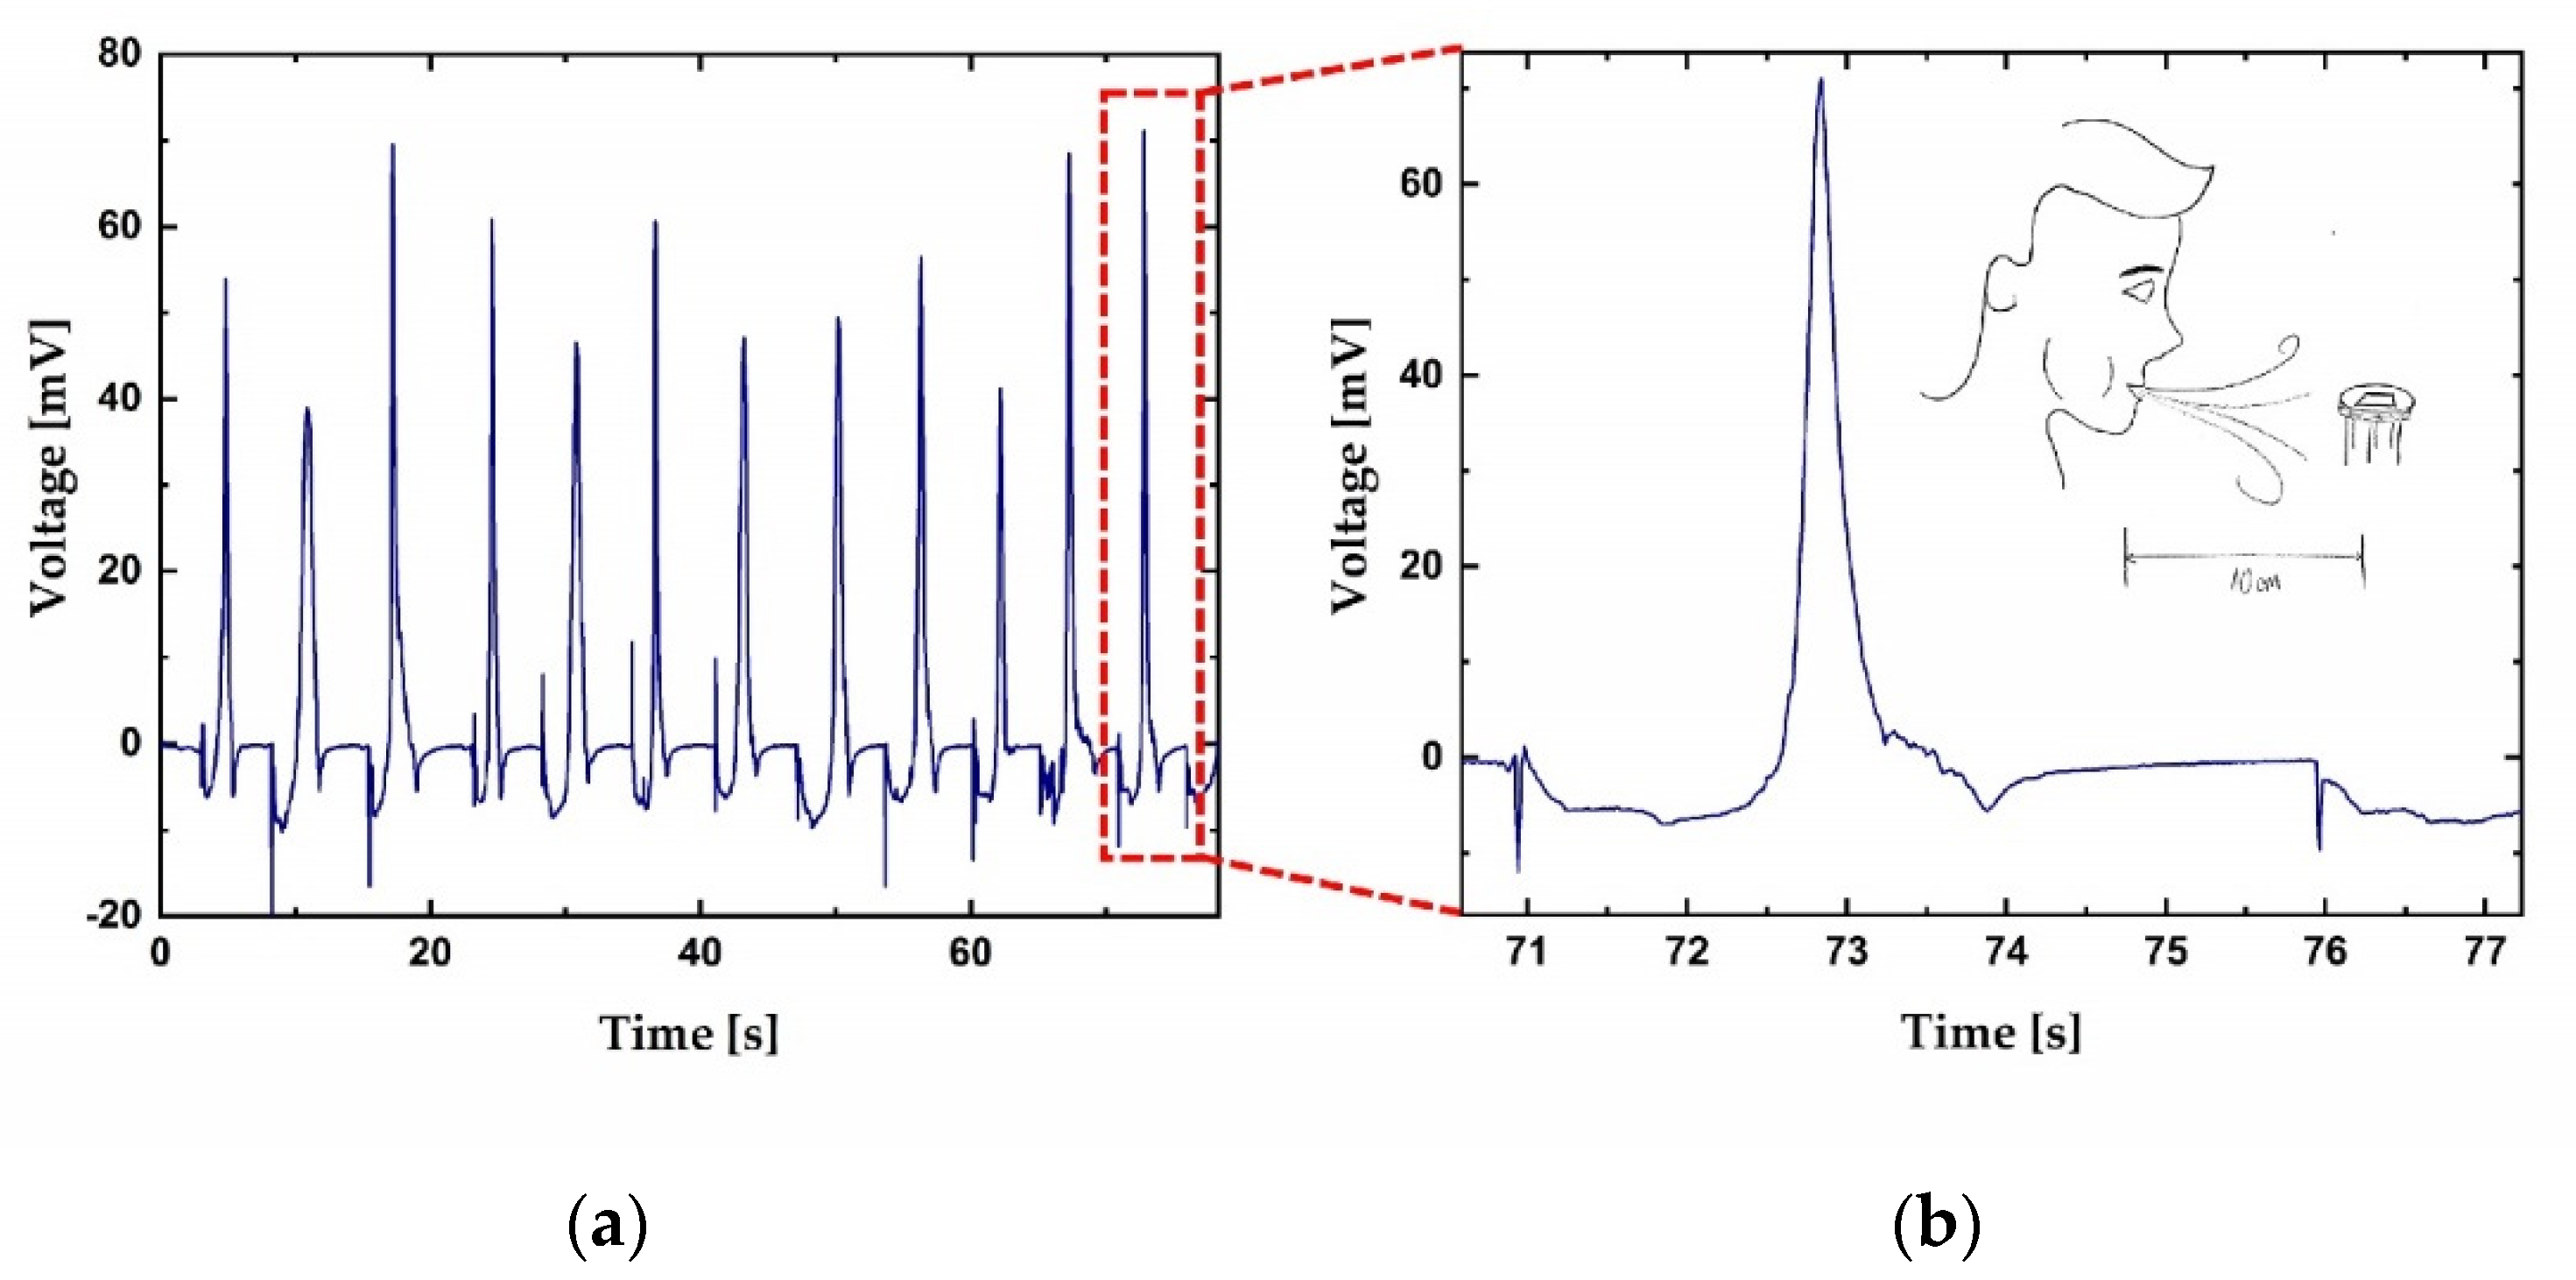
3.1. Human Breath Test
3.2. Electrochemistry of Aluminum–Water Reaction
3.3. Micro-Fourier Transform Infrared Spectroscopy
3.4. Electrochemical Impedance Spectroscopy
3.5. Possible Concurrent Processes
3.5.1. RF Interference
3.5.2. Hydrovoltaics
4. Conclusions
Author Contributions
Funding
Data Availability Statement
Conflicts of Interest
References
- Wernecke, R.; Wernecke, J. Moisture and Humidity Measurement Methods in Solid, Liquid, and Gaseous Substances. In Industrial Moisture and Humidity Measurement, 1st ed.; Wernecke, R., Wernecke, J., Eds.; Wiley: Weinhem, Germany, 2014; pp. 57–160. [Google Scholar] [CrossRef]
- Fontes, J. Humidity Sensors. In Sensor Technology Handbook, 1st ed.; Wilson, J.S., Ed.; Elsevier Inc: Amsterdam, The Netherlands, 2005; pp. 271–284. [Google Scholar] [CrossRef]
- Blank, T.A.; Eksperiandova, L.P.; Belikov, K.N. Recent trends of ceramic humidity sensors development: A review. Sens. Actuators B Chem. 2016, 228, 416–442. [Google Scholar] [CrossRef]
- Aliofkhazraei, M.; Ali, N. Recent Developments in Miniaturization of Sensor Technologies and Their Applications. Compr. Mater. Process. 2014, 13, 245–306. [Google Scholar] [CrossRef]
- Wu, Z.; Cheng, T.; Wang, Z.L. Self-Powered Sensors and Systems Based on Nanogenerators. Sensors 2020, 20, 2925. [Google Scholar] [CrossRef]
- Mitton, N.; Wolhuter, R. Energy Harvesting in Wireless Sensor Networks. In Rechargeable Sensor Networks: Technology, Theory, and Application, 1st ed.; Chen, J., He, S., Sun, Y., Eds.; World Scientific: Singapore, 2013; pp. 205–220. [Google Scholar] [CrossRef]
- Kiziroglou, M.E.; Yeatman, E.M. Materials and techniques for energy harvesting. In Functional Materials for Sustainable Energy Applications; Kilner, J.A., Skinner, S.J., Irvine, S.J.C., Edwards, P.P., Eds.; Elsevier: Amsterdam, The Netherlands, 2012; pp. 541–572. [Google Scholar] [CrossRef]
- Zhang, Y.; Xie, M.; Adamaki, V.; Khanbareh, H.; Bowen, C.R. Control of electro-chemical processes using energy harvesting materials and devices. Chem. Soc. Rev. 2017, 46, 7757–7786. [Google Scholar] [CrossRef]
- Ibrahim, H.H.; Singh, M.S.J.; Al-Bawri, S.S.; Islam, M.T. Synthesis, Characterization and Development of Energy Harvesting Techniques Incorporated with Antennas: A Review Study. Sensors 2020, 20, 2772. [Google Scholar] [CrossRef] [PubMed]
- Tang, X.; Wang, X.; Cattley, R.; Gu, F.; Ball, A.D. Energy Harvesting Technologies for Achieving Self-Powered Wireless Sensor Networks in Machine Condition Monitoring: A Review. Sensors 2018, 18, 4113. [Google Scholar] [CrossRef]
- Elvin, N.; Erturk, A. Introduction and Methods of Mechanical Energy Harvesting BT. In Advances in Energy Harvesting Methods; Elvin, N., Erturk, A., Eds.; Springer: New York, NY, USA, 2013; pp. 3–14. [Google Scholar]
- Beeby, S.P.; O’Donnell, T. Electromagnetic Energy Harvesting BT. In Energy Harvesting Technologies; Priya, S., Inman, D.J., Eds.; Springer: Boston, MA, USA, 2009; pp. 129–161. [Google Scholar]
- Grattieri, M.; Minteer, S.D. Self-Powered Biosensors. ACS Sens. 2018, 3, 44–53. [Google Scholar] [CrossRef] [PubMed]
- Wu, F.; Yu, P.; Mao, L. Self-powered electrochemical systems as neurochemical sensors: Toward self-triggered in vivo analysis of brain chemistry. Chem. Soc. Rev. 2017, 46, 2692–2704. [Google Scholar] [CrossRef] [PubMed]
- Chen, Y.; Ji, W.; Yan, K.; Gao, J.; Zhang, J. Fuel cell-based self-powered electrochemical sensors for biochemical detection. Nano Energy 2019, 61, 173–193. [Google Scholar] [CrossRef]
- Bošković, M.V.; Sarajlić, M.; Frantlović, M.; Smiljanić, M.M.; Randjelović, D.V.; Zobenica, K.C.; Radović, D.V. Aluminum-based self-powered hyper-fast miniaturized sensor for breath humidity detection. Sens. Actuators B Chem. 2020, 321, 128635. [Google Scholar] [CrossRef]
- Güntner, A.T.; Abegg, S.; Königstein, K.; Gerber, P.A.; Schmidt-Trucksäss, A.; Pratsinis, S.E. Breath Sensors for Health Monitoring. ACS Sens. 2019, 4, 268–280. [Google Scholar] [CrossRef]
- Tai, H.; Wang, S.; Duan, Z.; Jiang, Y. Evolution of breath analysis based on humidity and gas sensors: Potential and challenges. Sens. Actuators B Chem. 2020, 318, 128104. [Google Scholar] [CrossRef]
- Katsoufis, P.; Katsaiti, M.; Mourelas, C.; Andrade, T.S.; Dracopoulos, V.; Politis, C.; Avgouropoulos, G.; Lianos, P. Study of a Thin Film Aluminum-Air Battery. Energies 2020, 13, 1447. [Google Scholar] [CrossRef]
- Faegh, E.; Ng, B.; Hayman, D.; Mustain, W.E. Practical assessment of the performance of aluminium battery technologies. Nat. Energy 2021, 6, 21–29. [Google Scholar] [CrossRef]
- Kalinin, S.V.; Dyck, O.E.; Balke, N.; Neumayer, S.; Tsai, W.-Y.; Vasudevan, R.; Lingerfelt, D.B.; Ahmadi, M.; Ziatdinov, M.; McDowell, M.T.; et al. Toward Electrochemical Studies on the Nanometer and Atomic Scales: Progress, Challenges, and Opportunities. ACS Nano 2019, 13, 9735–9780. [Google Scholar] [CrossRef] [PubMed]
- Shen, D.; Duley, W.W.; Peng, P.; Xiao, M.; Feng, J.; Liu, L.; Zou, G.; Zhou, Y.N. Moisture-Enabled Electricity Generation: From Physics and Materials to Self-Powered Applications. Adv. Mater. 2020, 32, e2003722. [Google Scholar] [CrossRef]
- Zhang, Z.; Li, X.; Yin, J.; Xu, Y.; Fei, W.; Xue, M.; Wang, Q.; Zhou, J.; Guo, W. Emerging hydrovoltaic technology. Nat. Nanotechnol. 2018, 13, 1109–1119. [Google Scholar] [CrossRef]
- Momma, K.; Izumi, F. VESTA 3for three-dimensional visualization of crystal, volumetric and morphology data. J. Appl. Crystallogr. 2011, 44, 1272–1276. [Google Scholar] [CrossRef]
- Jette, E.R.; Foote, F. Precision Determination of Lattice Constants. J. Chem. Phys. 1935, 3, 605–616. [Google Scholar] [CrossRef]
- Lei, X.F.; Ma, J.X. Synthesis and electrochemical performance of aluminum based composites. J. Braz. Chem. Soc. 2010, 21, 209–213. [Google Scholar] [CrossRef]
- Fan, L.; Lu, H.; Leng, J.; Sun, Z.; Chen, C. The effect of crystal orientation on the aluminum anodes of the aluminum–air batteries in alkaline electrolytes. J. Power Sources 2015, 299, 66–69. [Google Scholar] [CrossRef]
- Patra, S.; Mitra, P.; Pradhan, S.K. Preparation of nanodimensional CdS by chemical dipping technique and their characterization. Mater. Res. 2011, 14, 17–20. [Google Scholar] [CrossRef]
- Singh, M.M.; Vijaya, G.; Krupashankara, M.S.; Sridhara, B.K.; Shridhar, T.N. Deposition and Characterization of Aluminium Thin film Coatings using DC Magnetron Sputtering Process. Mater. Today Proc. 2018, 5, 2696–2704. [Google Scholar] [CrossRef]
- Evertsson, J.; Bertram, F.; Zhang, F.; Rullik, L.; Merte, L.; Shipilin, M.; Soldemo, M.; Ahmadi, S.; Vinogradov, N.; Carlà, F.; et al. The thickness of native oxides on aluminum alloys and single crystals. Appl. Surf. Sci. 2015, 349, 826–832. [Google Scholar] [CrossRef]
- Liu, Y.; Sun, Q.; Li, W.; Adair, K.R.; Li, J.; Sun, X. A comprehensive review on recent progress in aluminum–air batteries. Green Energy Environ. 2017, 2, 246–277. [Google Scholar] [CrossRef]
- Spellman, J.P. Magnesium and Aluminum batteries. In Linden’s Handbook of Batteries, 4th ed.; Reddy, T.B., Ed.; McGraw-Hill Education: New York, NY, USA, 2011. [Google Scholar]
- Mori, R. Recent Developments for Aluminum–Air Batteries. Electrochem. Energy Rev. 2020, 3, 344–369. [Google Scholar] [CrossRef]
- Sun, Z.; Lu, H.; Fan, L.; Hong, Q.; Leng, J.; Chen, C. Performance of Al-Air Batteries Based on Al–Ga, Al–In and Al–Sn Alloy Electrodes. J. Electrochem. Soc. 2015, 162, A2116–A2122. [Google Scholar] [CrossRef]
- Kopani, M.; Mikula, M.; Takahashi, M.; Rusnák, J.; Pinčík, E. FT IR spectroscopy of silicon oxide layers prepared with perchloric acid. Appl. Surf. Sci. 2013, 269, 106–109. [Google Scholar] [CrossRef]
- Khan, A.S.; Khalid, H.; Sarfraz, Z.; Khan, M.; Iqbal, J.; Muhammad, N.; Fareed, M.A.; Rehman, I.U. Vibrational spectroscopy of selective dental restorative materials. Appl. Spectrosc. Rev. 2016, 52, 507–540. [Google Scholar] [CrossRef]
- Webber, J.; Zorzi, J.E.; Perottoni, C.A.; e Silva, S.M.; Cruz, R.C.D. Identification of α-Al2O3 surface sites and their role in the adsorption of stearic acid. J. Mater. Sci. 2016, 51, 5170–5184. [Google Scholar] [CrossRef]
- Pletincx, S.; Trotochaud, L.; Fockaert, L.-L.; Mol, J.M.C.; Head, A.R.; Karslıoğlu, O.; Bluhm, H.; Terryn, H.; Hauffman, T. In Situ Characterization of the Initial Effect of Water on Molecular Interactions at the Interface of Organic/Inorganic Hybrid Systems. Sci. Rep. 2017, 7, srep45123. [Google Scholar] [CrossRef] [PubMed]
- Hass, K.C.; Schneider, W.F.; Curioni, A.; Andreoni, W. First-Principles Molecular Dynamics Simulations of H2O on α-Al2O3(0001). J. Phys. Chem. B 2000, 104, 5527–5540. [Google Scholar] [CrossRef]
- Shirai, T.; Li, J.W.; Ishizaki, C.; Ishizaki, K.; Matsumaru, K. Surface hydration states of commercial high purity α-Al2O3powders evaluated by temperature programmed desorption mass spectrometry and diffuse reflectance infrared Fourier transform spectroscopy. Sci. Technol. Adv. Mater. 2005, 6, 123–128. [Google Scholar] [CrossRef]
- Lee, D.H.; Condrate, R.A. An FTIR spectral investigation of the structural species found on alumina surfaces. Mater. Lett. 1995, 23, 241–246. [Google Scholar] [CrossRef]
- Locorotondc, E.; Pugi, L.; Berzi, L.; Pierini, M.; Scavuzzc, S.; Ferraris, A.; Airale, A.G.; Carello, M. Modeling and simulation of Constant Phase Element for battery Electrochemical Impedance Spectroscopy. In Proceedings of the 2019 IEEE 5th International Forum on Research and Technology for Society and Industry (RTSI), Florence, Italy, 9–12 September 2019; pp. 225–230. [Google Scholar]
- Slouka, C.; Wurm, D.J.; Brunauer, G.; Welzl-Wachter, A.; Spadiut, O.; Fleig, J.; Herwig, C. A Novel Application for Low Frequency Electrochemical Impedance Spectroscopy as an Online Process Monitoring Tool for Viable Cell Concentrations. Sensors 2016, 16, 1900. [Google Scholar] [CrossRef]
- Martin, M.; Lasia, A. Influence of experimental factors on the constant phase element behavior of Pt electrodes. Electrochim. Acta 2011, 56, 8058–8068. [Google Scholar] [CrossRef]
- Yin, J.; Zhou, J.; Fang, S.; Guo, W. Hydrovoltaic Energy on the Way. Joule 2020, 4, 1852–1855. [Google Scholar] [CrossRef]


| Element | Al | Si | O | Total |
|---|---|---|---|---|
| Atomic % | 61.72 | 26.56 | 11.72 | 100 |
| Qid [Ω−1cm−2s0.92] | nid | Qdl [Ω−1cm−2s0.9] | ndl | W [Ω−1s0.5] | R0 [Ω] | Rct [Ωcm2] | Rsol [Ωcm2] |
|---|---|---|---|---|---|---|---|
| 13 × 10−9 | 0.92 | 757 × 10−9 | 0.9 | 1.96 × 10⁻⁶ | 0.9 | 165 | 162 |
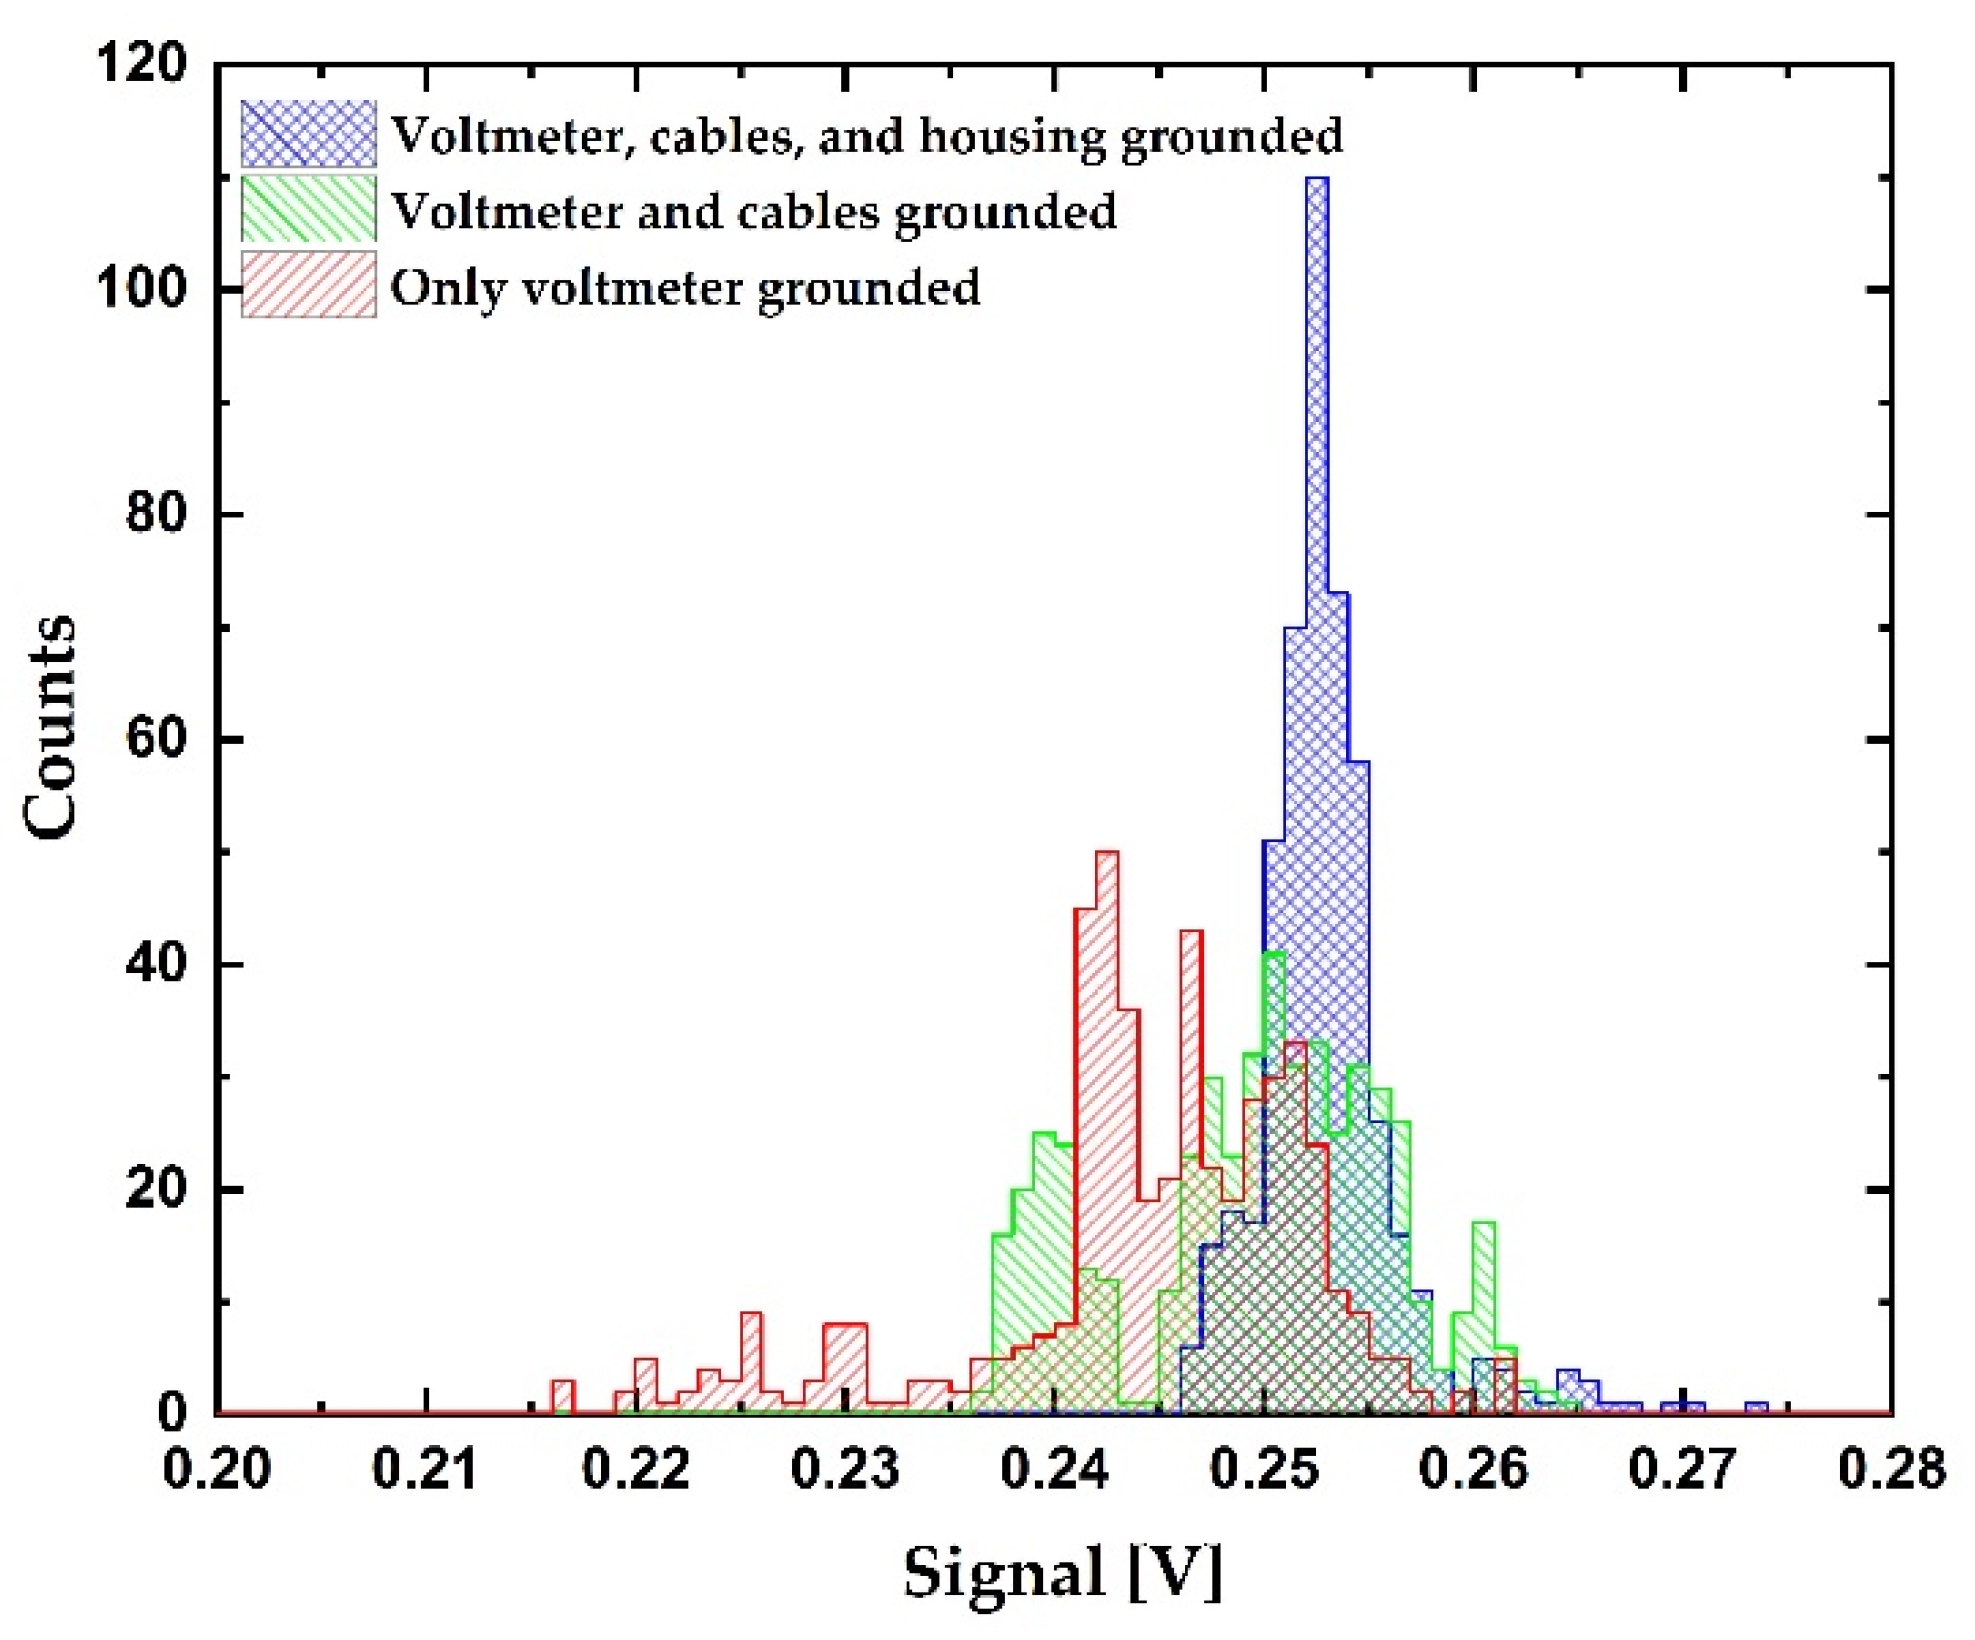
| STD [V] | Mean [V] | SNR [dB] | |
|---|---|---|---|
| Voltmeter, cables, and housing grounded | 3.4 × 10⁻³ | 0.253 | 37.4 |
| Voltmeter and cables grounded | 6.5 × 10⁻³ | 0.250 | 31.7 |
| Voltmeter grounded | 8.1 × 10⁻³ | 0.255 | 30.0 |
Publisher’s Note: MDPI stays neutral with regard to jurisdictional claims in published maps and institutional affiliations. |
© 2021 by the authors. Licensee MDPI, Basel, Switzerland. This article is an open access article distributed under the terms and conditions of the Creative Commons Attribution (CC BY) license (https://creativecommons.org/licenses/by/4.0/).
Share and Cite
Bošković, M.V.; Šljukić, B.; Vasiljević Radović, D.; Radulović, K.; Rašljić Rafajilović, M.; Frantlović, M.; Sarajlić, M. Full-Self-Powered Humidity Sensor Based on Electrochemical Aluminum–Water Reaction. Sensors 2021, 21, 3486. https://doi.org/10.3390/s21103486
Bošković MV, Šljukić B, Vasiljević Radović D, Radulović K, Rašljić Rafajilović M, Frantlović M, Sarajlić M. Full-Self-Powered Humidity Sensor Based on Electrochemical Aluminum–Water Reaction. Sensors. 2021; 21(10):3486. https://doi.org/10.3390/s21103486
Chicago/Turabian StyleBošković, Marko V., Biljana Šljukić, Dana Vasiljević Radović, Katarina Radulović, Milena Rašljić Rafajilović, Miloš Frantlović, and Milija Sarajlić. 2021. "Full-Self-Powered Humidity Sensor Based on Electrochemical Aluminum–Water Reaction" Sensors 21, no. 10: 3486. https://doi.org/10.3390/s21103486
APA StyleBošković, M. V., Šljukić, B., Vasiljević Radović, D., Radulović, K., Rašljić Rafajilović, M., Frantlović, M., & Sarajlić, M. (2021). Full-Self-Powered Humidity Sensor Based on Electrochemical Aluminum–Water Reaction. Sensors, 21(10), 3486. https://doi.org/10.3390/s21103486