
Augmenting Speech Quality Estimation in Software-Defined Networking Using Machine Learning Algorithms


Abstract
:1. Introduction
- Control and data plane separation,
- Centralized network management,
- Standardized logical structure of switch components,
- General and standardized interface (API) for data plane instructions installation.
- Flow tables,
- Group tables,
- Meter tables.
2. Related Work
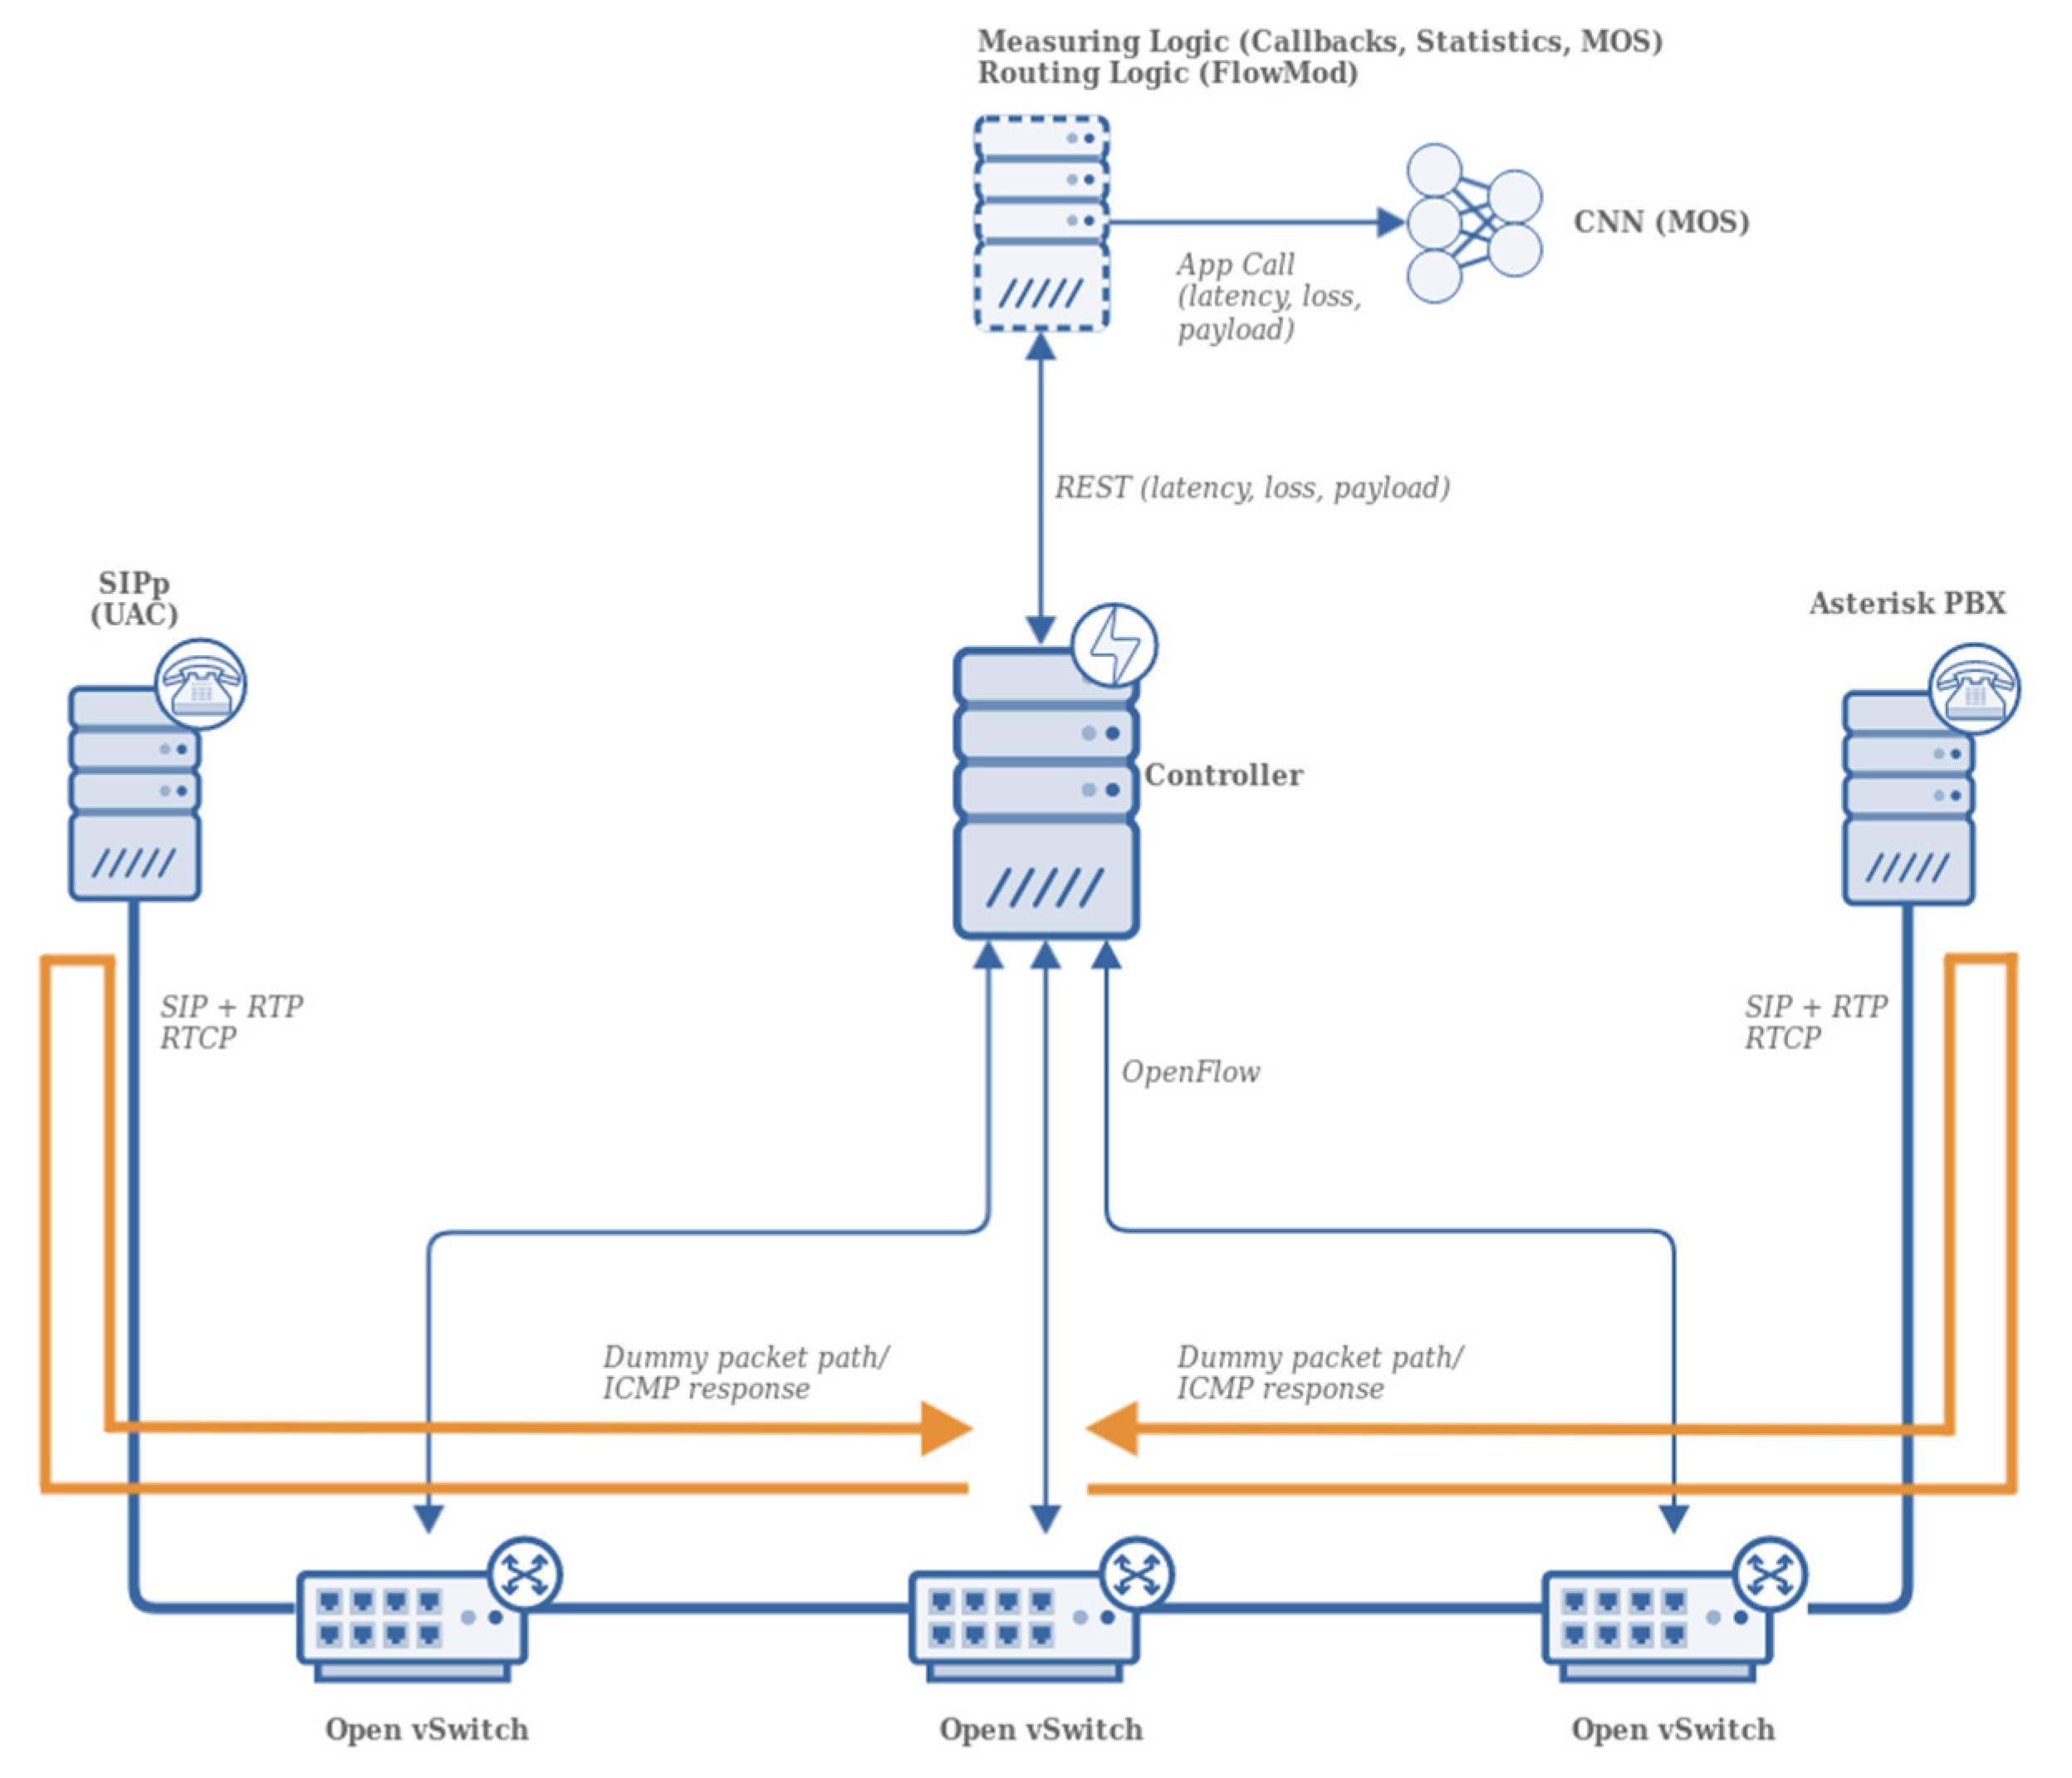
3. Experimental Setup
3.1. Simulation Environment
- 8C/16T CPU@2400 MHz,
- 16GB DDR4 RAM@2933 MHz,
- Debian 10 x64,
- Mininet 2.2.2,
- Open vSwitch 2.10.1,
- Ryu Controller 4.30,
- SIPp 3.5,
- Asterisk 13.22.
3.2. Simulation Procedure
- State “1”—network is operational and packets are transmitted without any error,
- State “3”—network is not operational and packets are lost,
- State “4”—network is operational and packets are lost in an independent fashion, little to no burty losses occur,
- State “2”—network is not operational and packets are transmitted in an almost independent fashion.
- TensorFlow 1.12 with GPU support,
- Keras 2.2.5,
- Scikit-learn 0.21.3,
- Numpy1.17.0.
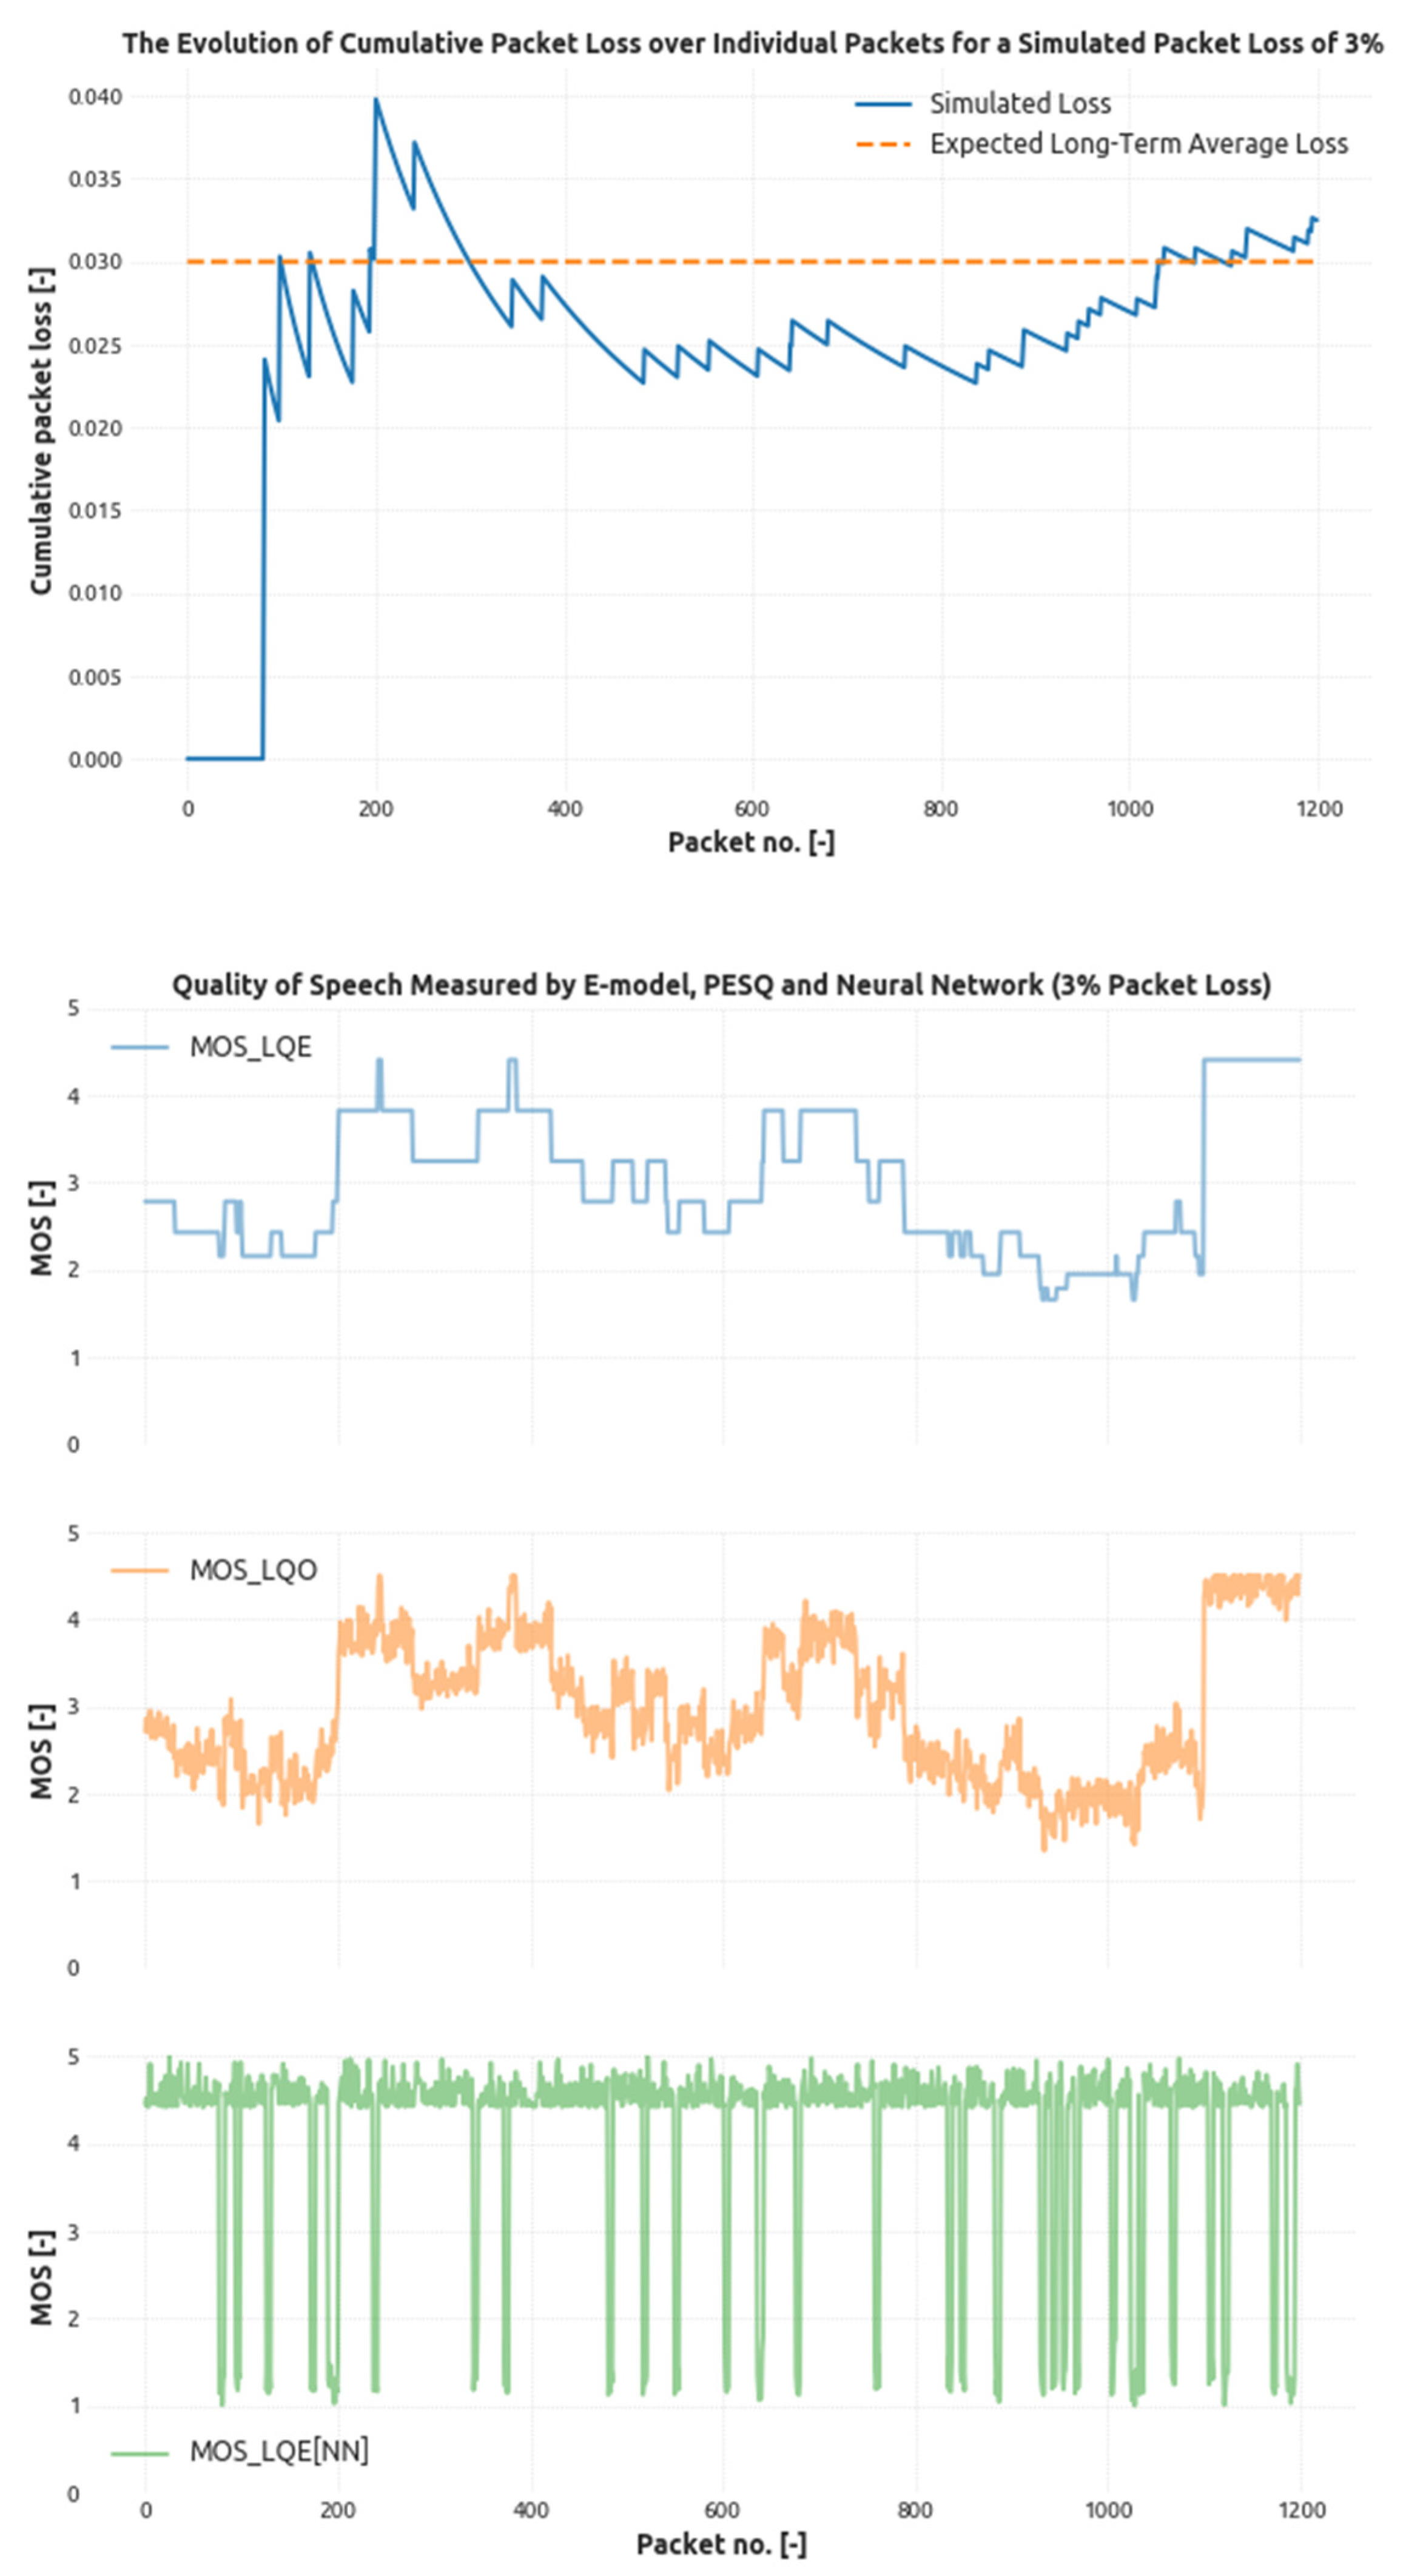
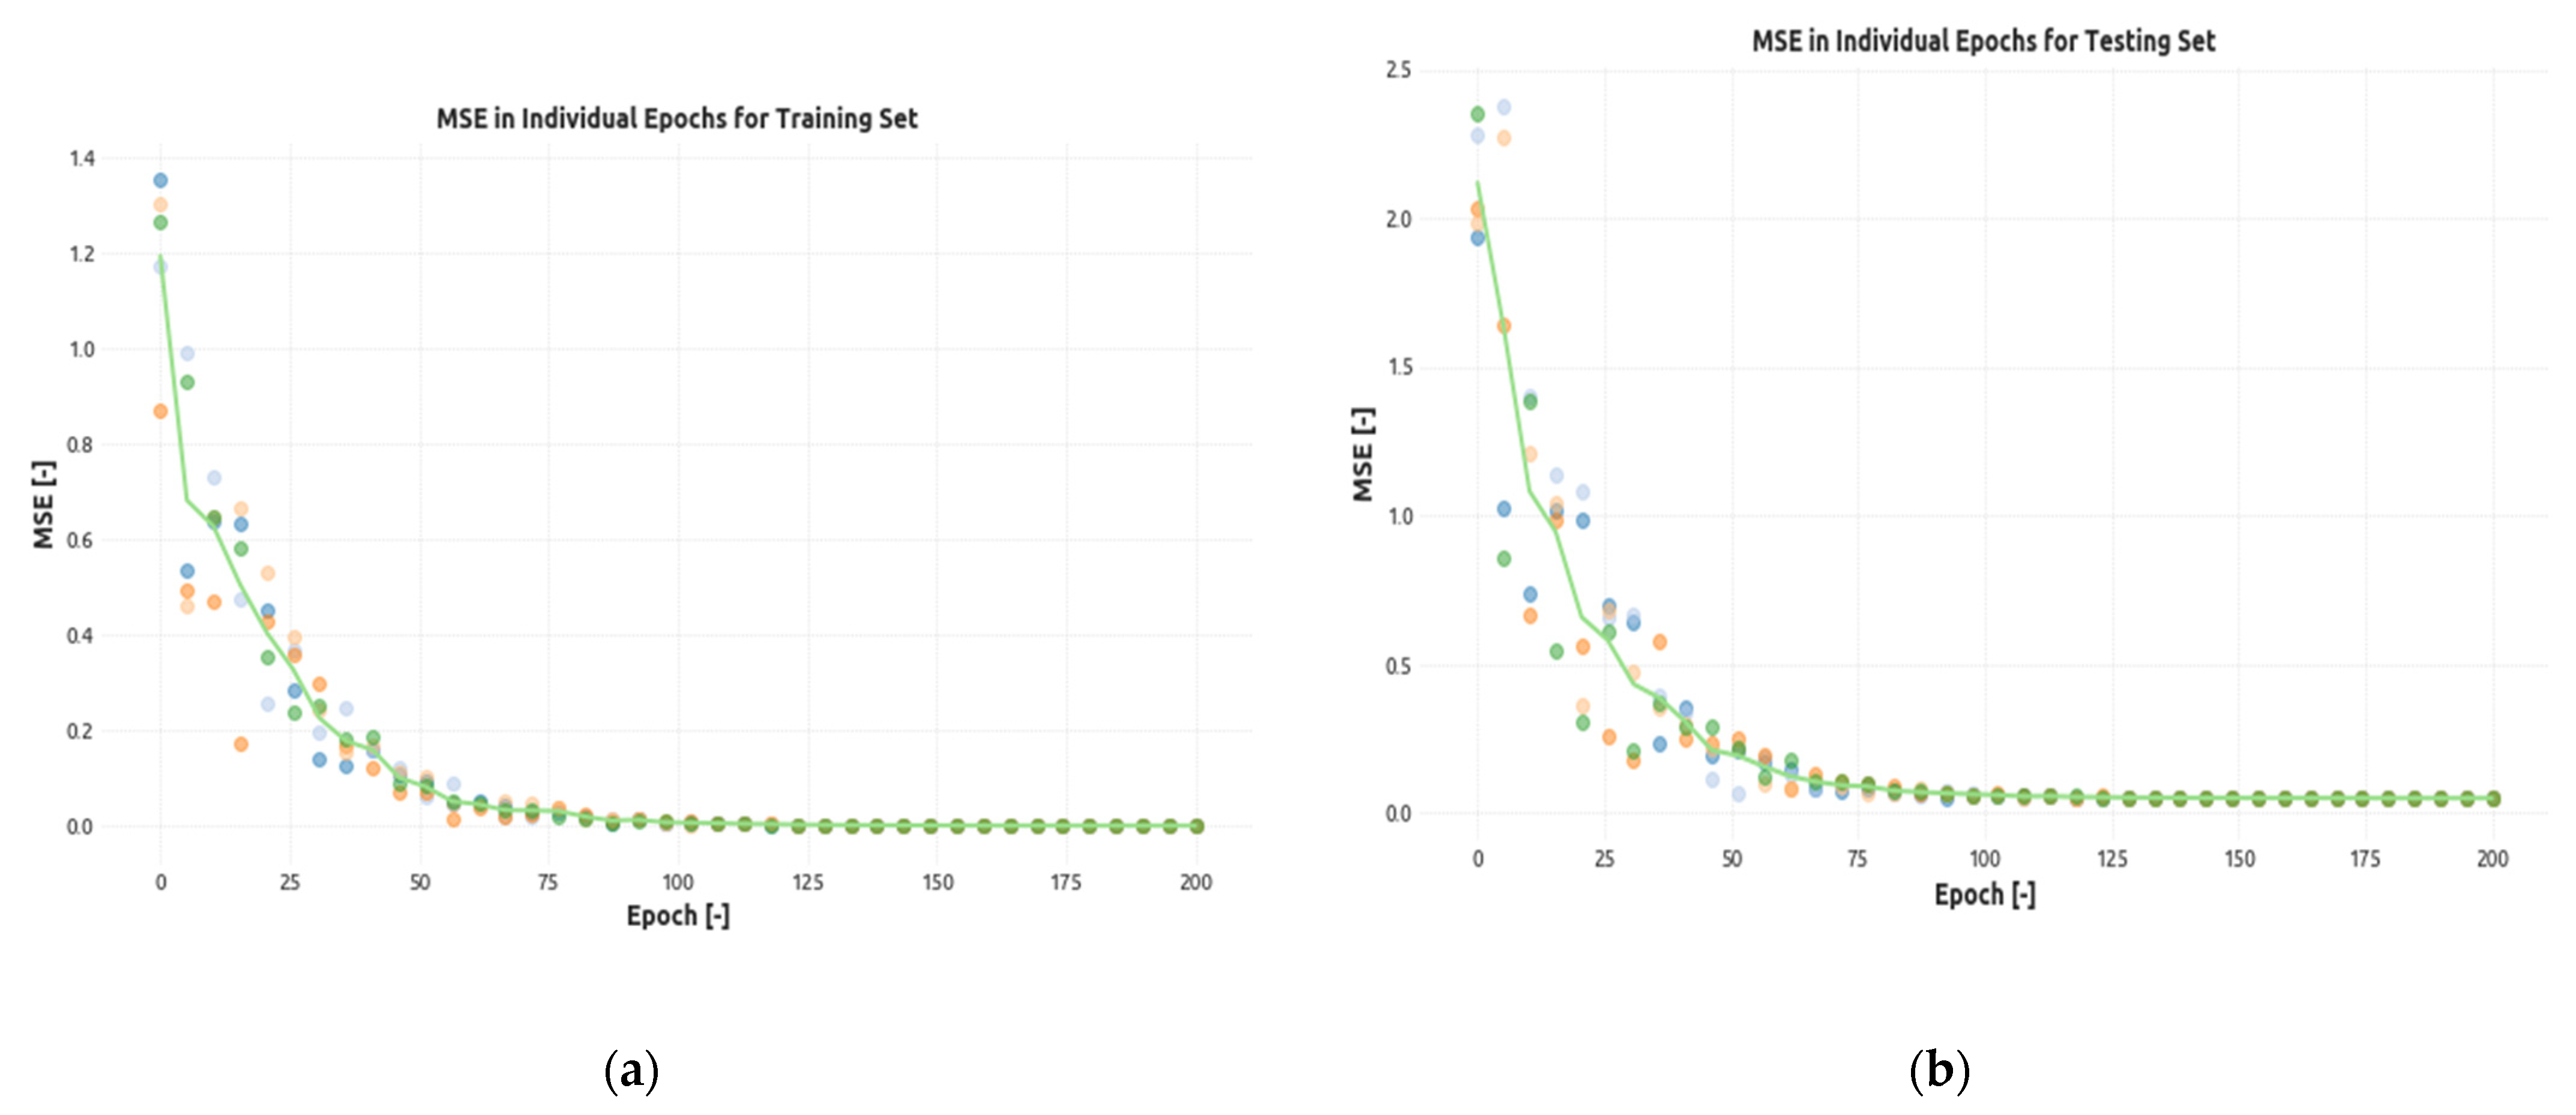
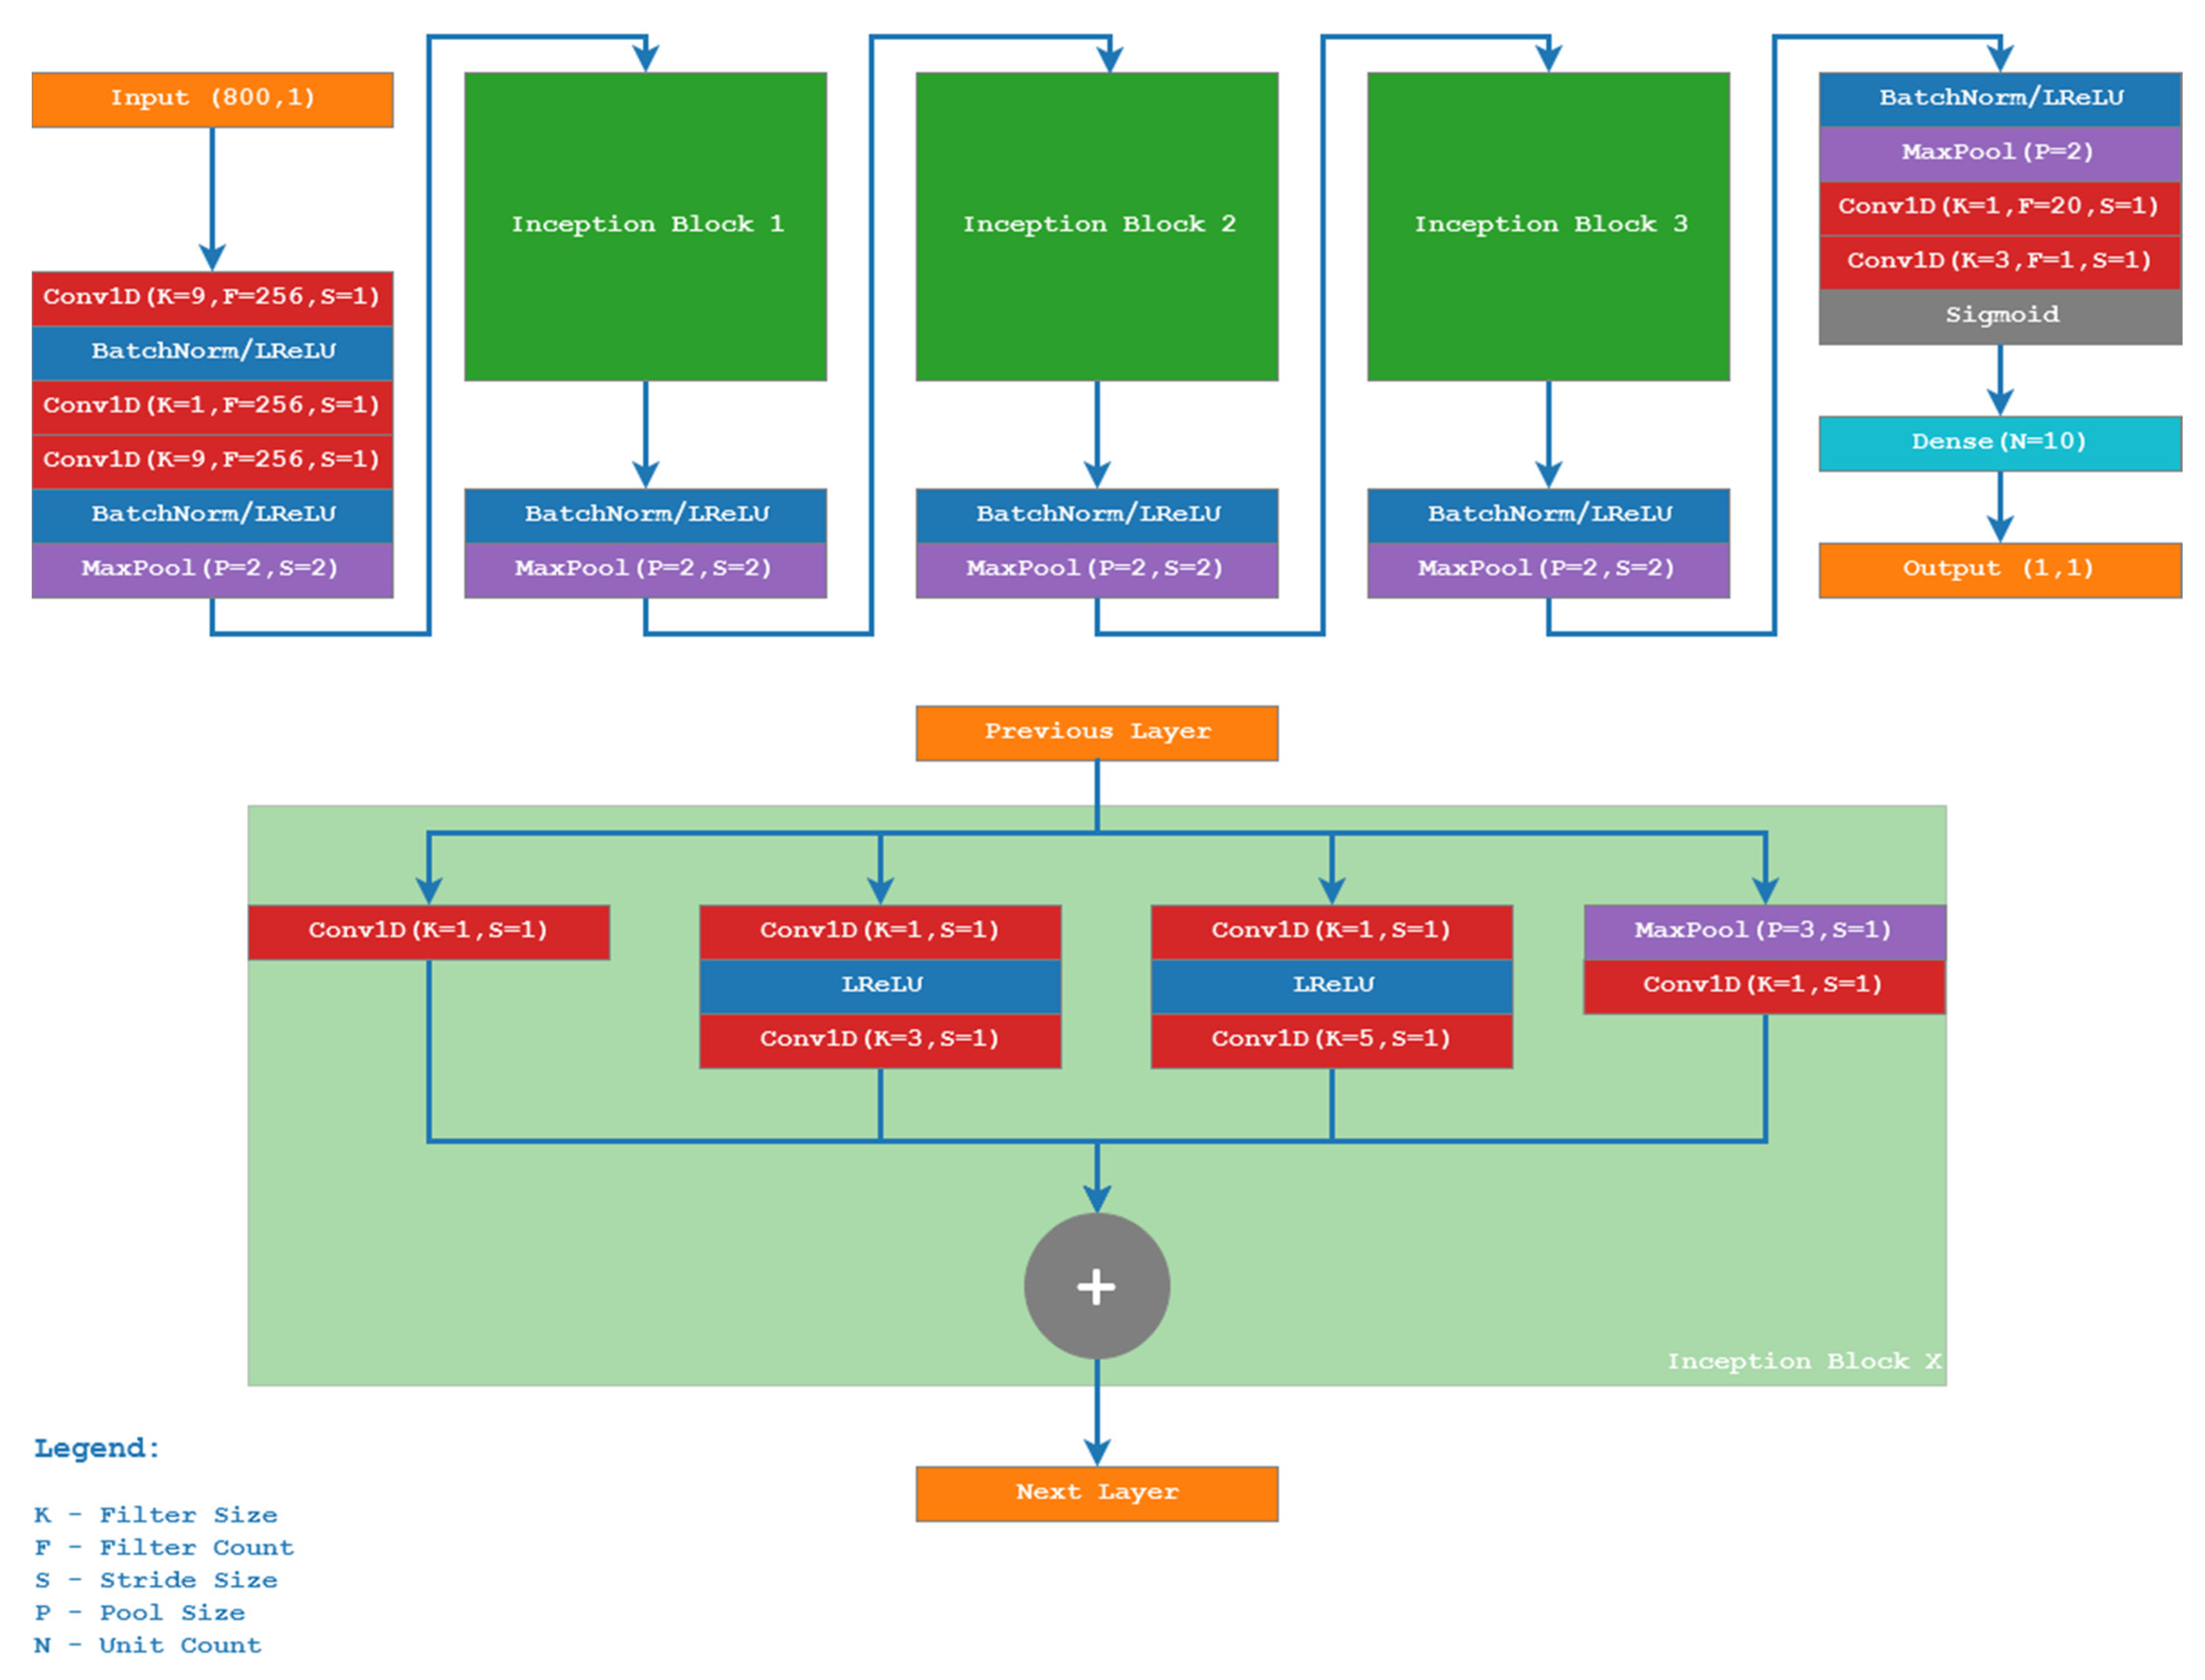
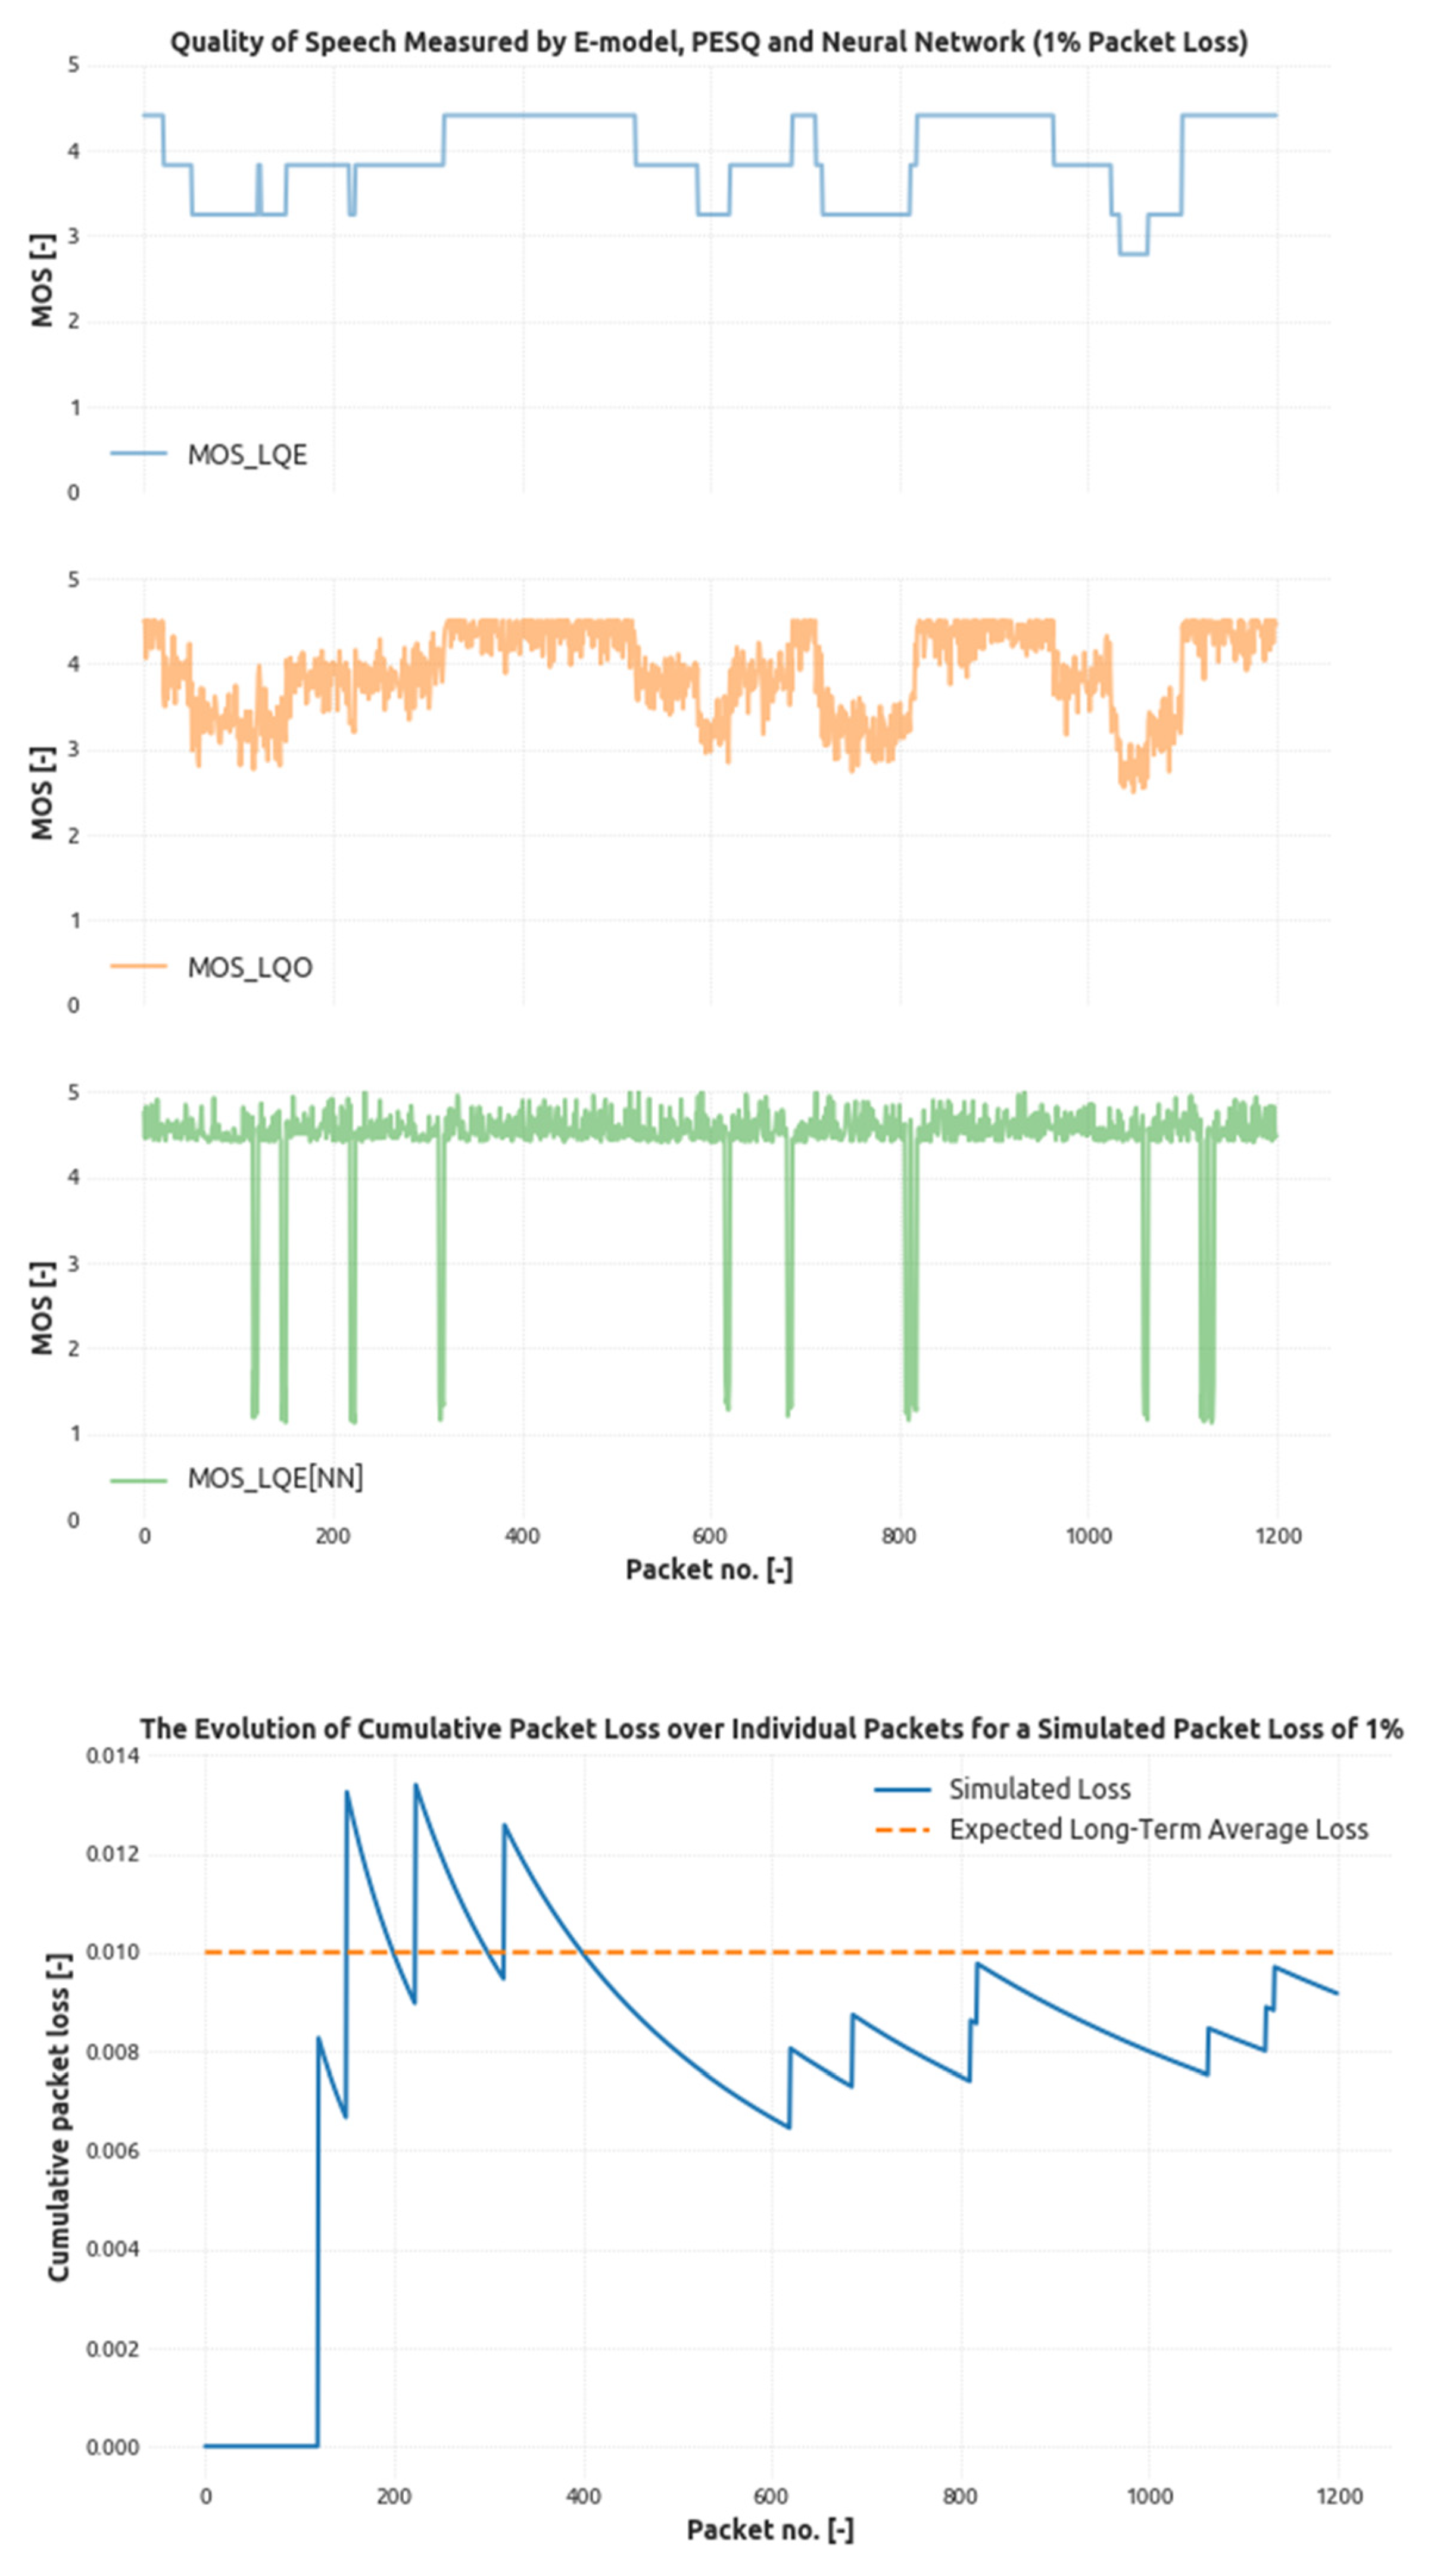
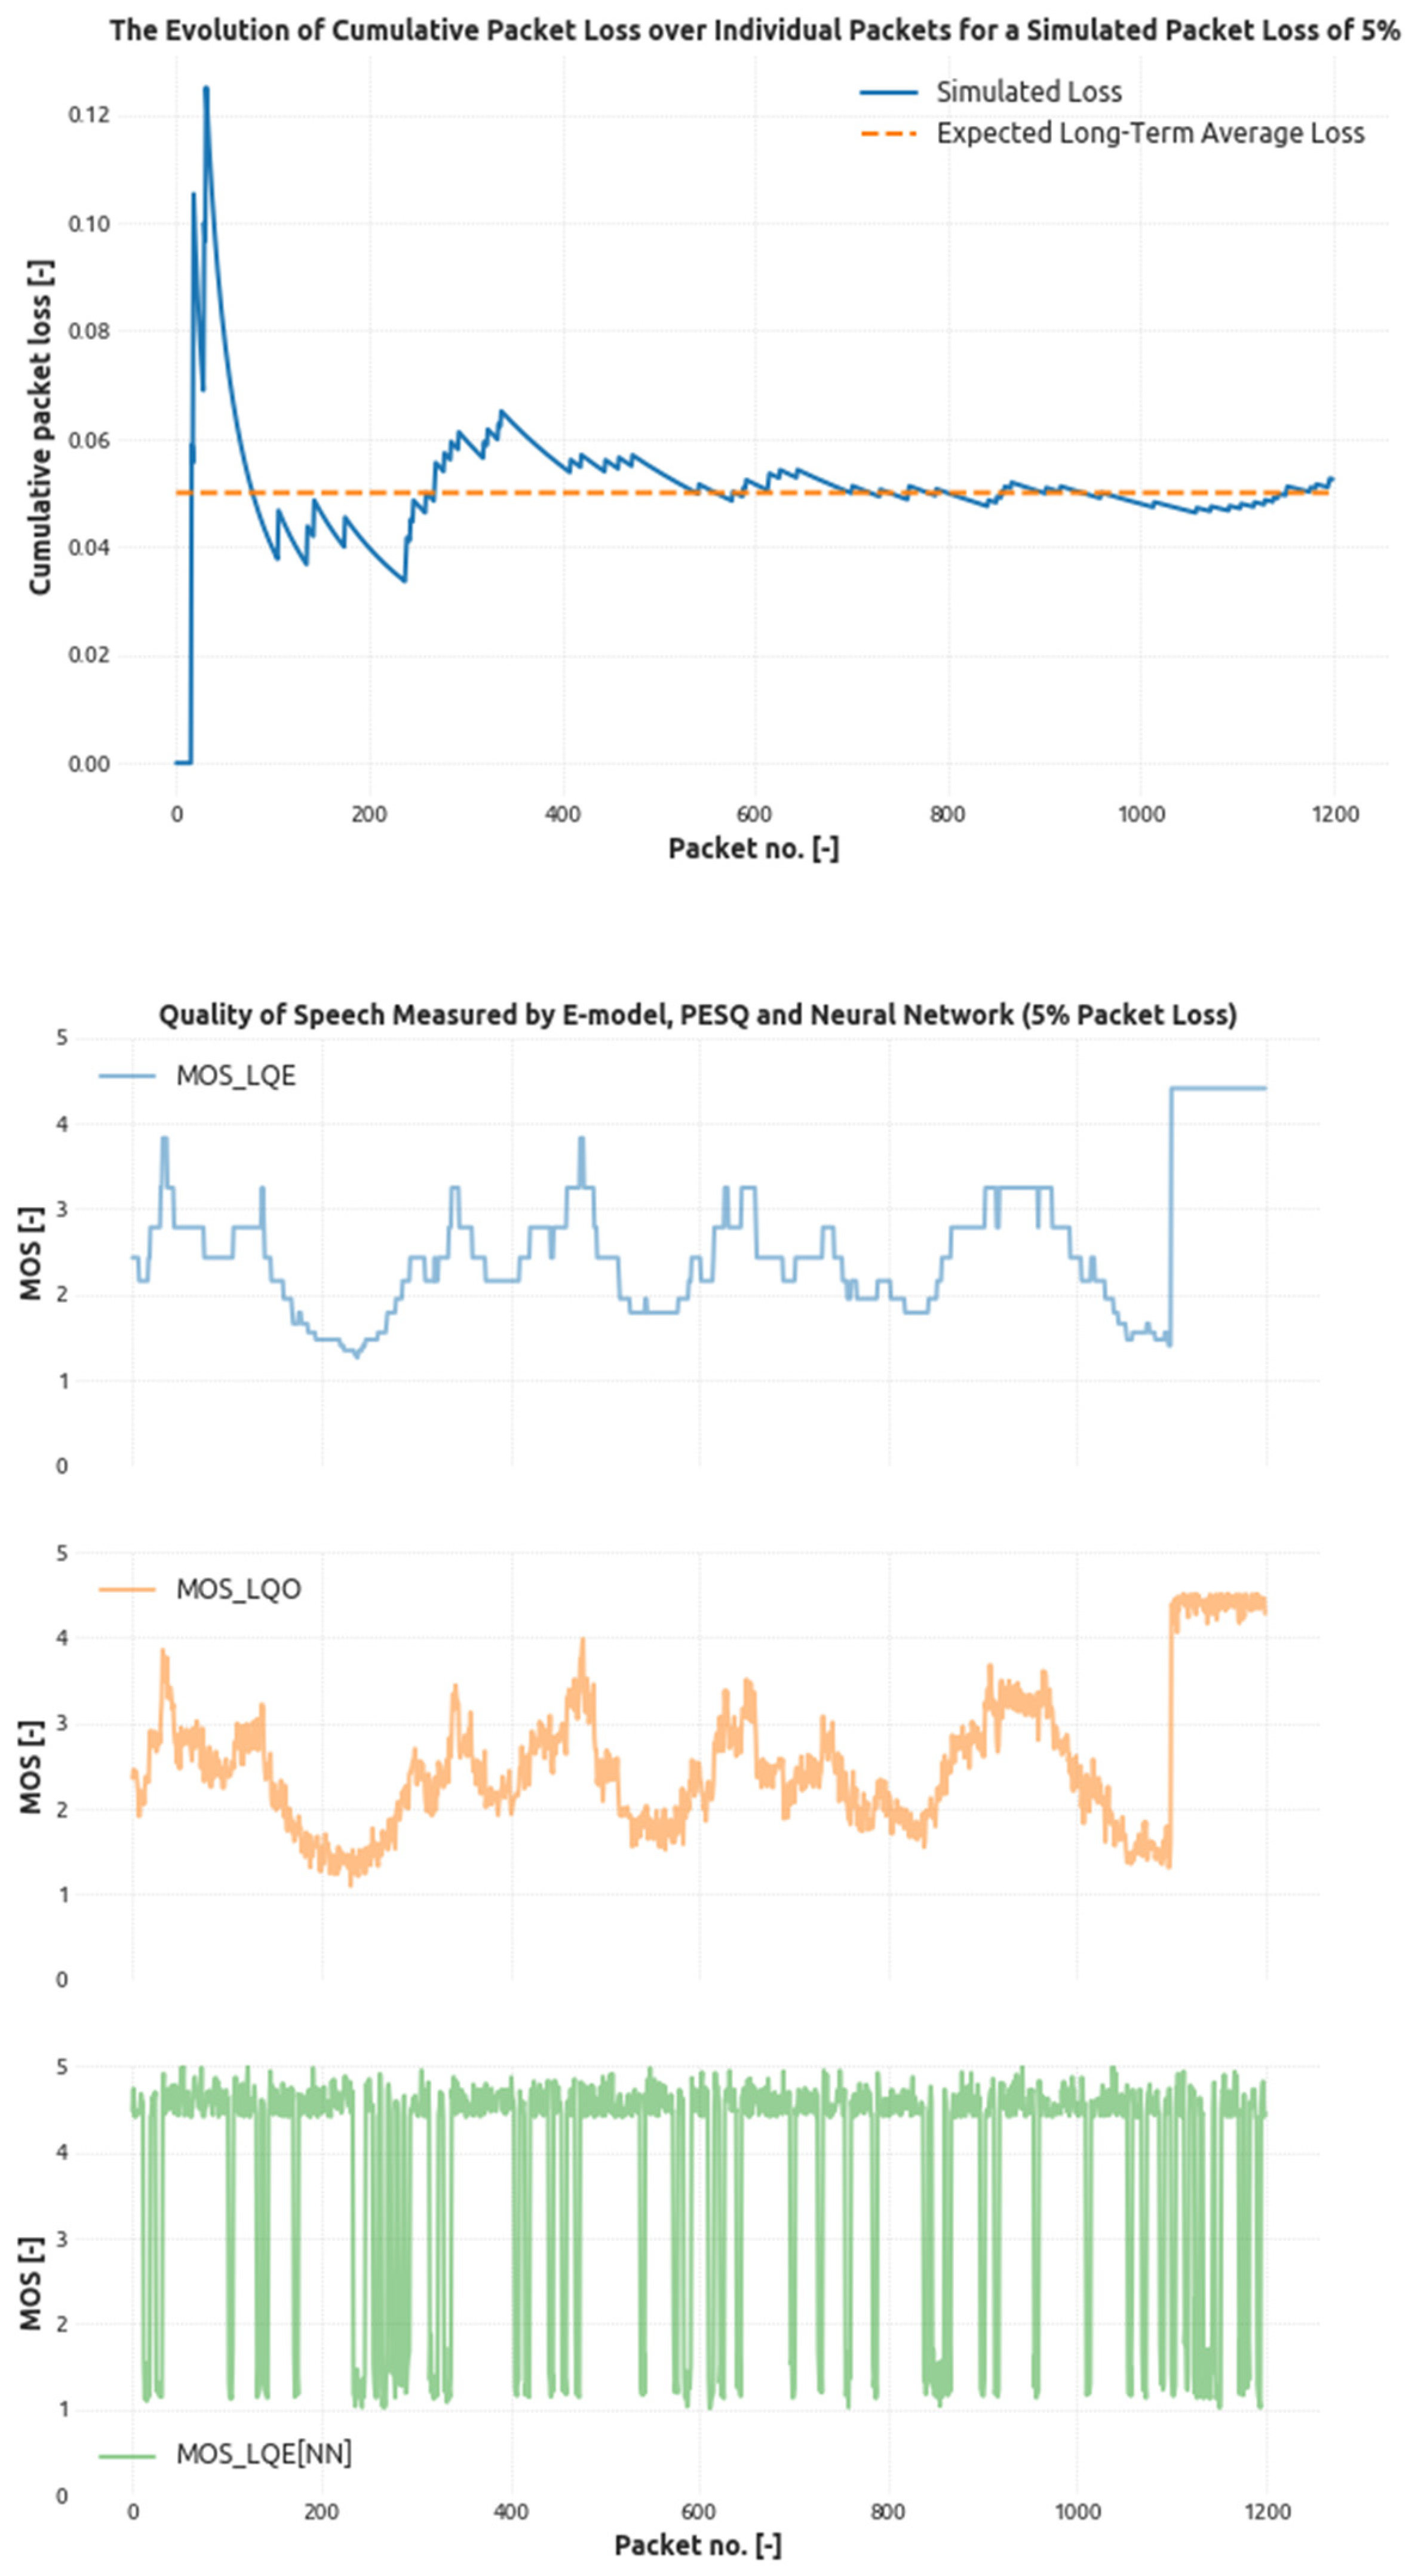
4. Results
- p13 = 0.005,
- p31 = 0.99,
- p32 = 0.005,
- p23 = 0.9,
- p14 = 0.005.
- p13 = 0.005,
- p31 = 0.99,
- p32 = 0.005,
- p23 = 0.9,
- p14 = 0.005,
- p13 = 0.005,
- p31 = 0.99,
- p32 = 0.005,
- p23 = 0.9,
- p14 = 0.005,
5. Conclusions
Author Contributions
Funding
Institutional Review Board Statement
Informed Consent Statement
Conflicts of Interest
References
- Haleplidis, E.; Joachimpillai, D.; Salim, J.H.; Lopez, D.; Martin, J.; Pentikousis, K.; Denazis, S.; Koufopavlou, O. ForCES ap-plicability to SDN-enhanced NFV. In Proceedings of the Information Technology and Systems Conference, Bandung, Indonesia, 16–17 November 2015; pp. 951–956. [Google Scholar]
- Caesar, M.; Caldwell, D.; Feamster, N.; Rexford, J.; Shaikh, A.; Merwe, J. Design and Implementation of a Routing Control Platform. In Proceedings of the 2nd Symposium on Networked Systems Design & Implementation, Boston, MA, USA, 2–4 May 2005; pp. 15–28. [Google Scholar]
- OpenFlow Switch Specification—Version 1.5.1, Open Networking Foundation. Available online: https://www.opennetworking.org/wp-content/uploads/2014/10/openflow-switch-v1.5.1.pdf (accessed on 13 April 2021).
- Frnda, J.; Voznak, M.; Rozhon, J.; Mehic, M. Prediction model of QoS for Triple play services. In Proceedings of the 2013 21st Telecommunications Forum Telfor, Belgrade, Serbia, 26–28 November 2013; pp. 733–736. [Google Scholar]
- Methods for Subjective Determination of Transmission Quality, ITU-T. Available online: https://www.itu.int/rec/T-REC-P.800-199608-I/en (accessed on 13 April 2021).
- Perceptual Evaluation of Speech Quality (PESQ): An Objective Method for End-to-End Speech Quality Assessment of Narrow-Band Telephone Networks and Speech Codecs, ITU-T. Available online: https://www.itu.int/rec/t-rec-p.862 (accessed on 13 April 2021).
- Rozhon, J.; Voznak, M. Development of a speech quality monitoring tool based on ITU-T P.862. In Proceedings of the 2011 34th International Conference on Telecommunications and Signal Processing (TSP), Budapest, Hungary, 18–20 August 2011; pp. 62–66. [Google Scholar]
- De Rango, F.; Tropea, M.; Fazio, P.; Marano, S. Overview on VoIP: Subjective and objective measurement methods. Int. J. Comput. Sci. Netw. Secur. 2006, 6, 140–153. [Google Scholar]
- Perceptual Objective Listening Quality Prediction, ITU-T. Available online: https://www.itu.int/rec/t-rec-p.863 (accessed on 13 April 2021).
- Voznak, M. Non-intrusive speech quality assessment in simplified E-model. WSEAS Trans. Syst. 2021, 11, 315–325. [Google Scholar]
- The E-Model: A Computational Model for Use in Transmission Planning, ITU-T. Available online: https://www.itu.int/rec/T-REC-G.107-201506-I/en (accessed on 13 April 2021).
- Transmission Impairments Due to Speech Processing, ITU-T. Available online: https://www.itu.int/rec/T-REC-G.113-200711-I/en (accessed on 13 April 2021).
- De Rango, F.; Fazio, P.; Scarcello, F.; Conte, F. A New Distributed Application and Network Layer Protocol for VoIP in Mobile Ad Hoc Networks. IEEE Trans. Mob. Comput. 2014, 13, 2185–2198. [Google Scholar] [CrossRef]
- Voznak, M.; Rozhon, J. Methodology for SIP infrastructure performance testing. WSEAS Trans. Comput. 2021, 9, 1012–1021. [Google Scholar]
- Voznak, M.; Tomes, M.; Vaclavikova, Z.; Halas, M. E-model improvement for speech quality evaluation including codecs tandeming. In Proceedings of the International Conference on Data Networks, Communications, Computers, Faro, Portugal, 3–5 November 2010; pp. 119–124. [Google Scholar]
- Rozhon, J.; Voznak, M. SIP registration burst load test. In Proceedings of the Communications in Computer and Information Science, 189 CCIS, Ostrava, Czech Republic, 7–9 July 2011; pp. 329–336. [Google Scholar]
- Voznak, M.; Rozhon, J. Approach to stress tests in SIP environment based on marginal analysis. Telecommun. Syst. 2011, 52, 1583–1593. [Google Scholar] [CrossRef]
- Queiroz, W.; Capretz, M.A.; Dantas, M. An approach for SDN traffic monitoring based on big data techniques. J. Netw. Comput. Appl. 2019, 131, 28–39. [Google Scholar] [CrossRef]
- Vieira, D.; Juca, P.; Callado, A. A Solution for QoS Provisioning in VoIP Services on the OpenFlow Platform. In Proceedings of the Euro American Conference on Telematics and Information Systems (EATIS), Fortaleza, Brazil, 12–15 November 2018; pp. 1–5. [Google Scholar]
- Rozhon, J.; Rezac, F.; Safarik, J.; Gresak, E.; Jalowiczor, J. Measuring and monitoring the QoS and QoE in software defined networking environments. In Proceedings of the Signal Processing, Sensor/Information Fusion, and Target Recognition XXVIII, Baltimore, MD, USA, 15–17 April 2019. [Google Scholar]
- Van Adrichem, N.L.M.; Doerr, C.; Kuipers, F.A. OpenNetMon: Network monitoring in OpenFlow Software-Defined Networks. In Proceedings of the 2014 IEEE Network Operations and Management Symposium (NOMS), Krakow, Poland, 5–9 May 2014; pp. 1–8. [Google Scholar]
- Pulse Code Modulation (PCM) of Voice Frequencies, ITU-T. Available online: https://www.itu.int/rec/T-REC-G.711-198811-I/en (accessed on 13 April 2021).
- Clark, A.D. Modeling the effects of burst packet loss and recency on subjective voice quality. In Proceedings of the IP Telephony Workshop, New York, NY, USA, 2–3 April 2001. [Google Scholar]
- Hasslinger, G.; Hohlfeld, O. The Gilbert-Elliott model for packet loss in real time services on the internet. In Proceedings of the 14th GI/ITG Conference—Measurement, Modelling and Evalutation of Computer and Communication Systems, Dortmund, Germany, 31 March–2 April 2008; pp. 1–15. [Google Scholar]
- Tropea, M.; Fedele, G. Classifiers Comparison for Convolutional Neural Networks (CNNs) in Image Classification. In Proceedings of the 2019 IEEE/ACM 23rd International Symposium on Distributed Simulation and Real Time Applications (DS-RT), Cosenza, Italy, 7–9 October 2019; pp. 1–4. [Google Scholar]
- Keles, H.Y.; Rozhon, J.; Ilk, H.G.; Voznak, M. DeepVoCoder: A CNN Model for Compression and Coding of Narrow Band Speech. IEEE Access 2019, 7, 75081–75089. [Google Scholar] [CrossRef]
- Szegedy, C.; Liu, W.; Jia, Y.; Sermanet, P.; Reed, S.; Anguelov, D.; Erhan, D.; Vanhoucke, V.; Rabinovich, A. Going Deeper with Convolutions. In Proceedings of the 2015 IEEE Conference on Computer Vision and Pattern Recognition (CVPR), Boston, MA, USA, 7–12 June 2015; pp. 1–9. [Google Scholar]


Publisher’s Note: MDPI stays neutral with regard to jurisdictional claims in published maps and institutional affiliations. |
© 2021 by the authors. Licensee MDPI, Basel, Switzerland. This article is an open access article distributed under the terms and conditions of the Creative Commons Attribution (CC BY) license (https://creativecommons.org/licenses/by/4.0/).
Share and Cite
Rozhon, J.; Rezac, F.; Jalowiczor, J.; Behan, L. Augmenting Speech Quality Estimation in Software-Defined Networking Using Machine Learning Algorithms. Sensors 2021, 21, 3477. https://doi.org/10.3390/s21103477
Rozhon J, Rezac F, Jalowiczor J, Behan L. Augmenting Speech Quality Estimation in Software-Defined Networking Using Machine Learning Algorithms. Sensors. 2021; 21(10):3477. https://doi.org/10.3390/s21103477
Chicago/Turabian StyleRozhon, Jan, Filip Rezac, Jakub Jalowiczor, and Ladislav Behan. 2021. "Augmenting Speech Quality Estimation in Software-Defined Networking Using Machine Learning Algorithms" Sensors 21, no. 10: 3477. https://doi.org/10.3390/s21103477
APA StyleRozhon, J., Rezac, F., Jalowiczor, J., & Behan, L. (2021). Augmenting Speech Quality Estimation in Software-Defined Networking Using Machine Learning Algorithms. Sensors, 21(10), 3477. https://doi.org/10.3390/s21103477