
Ability of a Set of Trunk Inertial Indexes of Gait to Identify Gait Instability and Recurrent Fallers in Parkinson’s Disease

 , , , , , , ,
  , and
, and 
Abstract
1. Introduction
2. Materials and Methods
2.1. Subjects
2.2. Instrumentation
2.3. Task Description
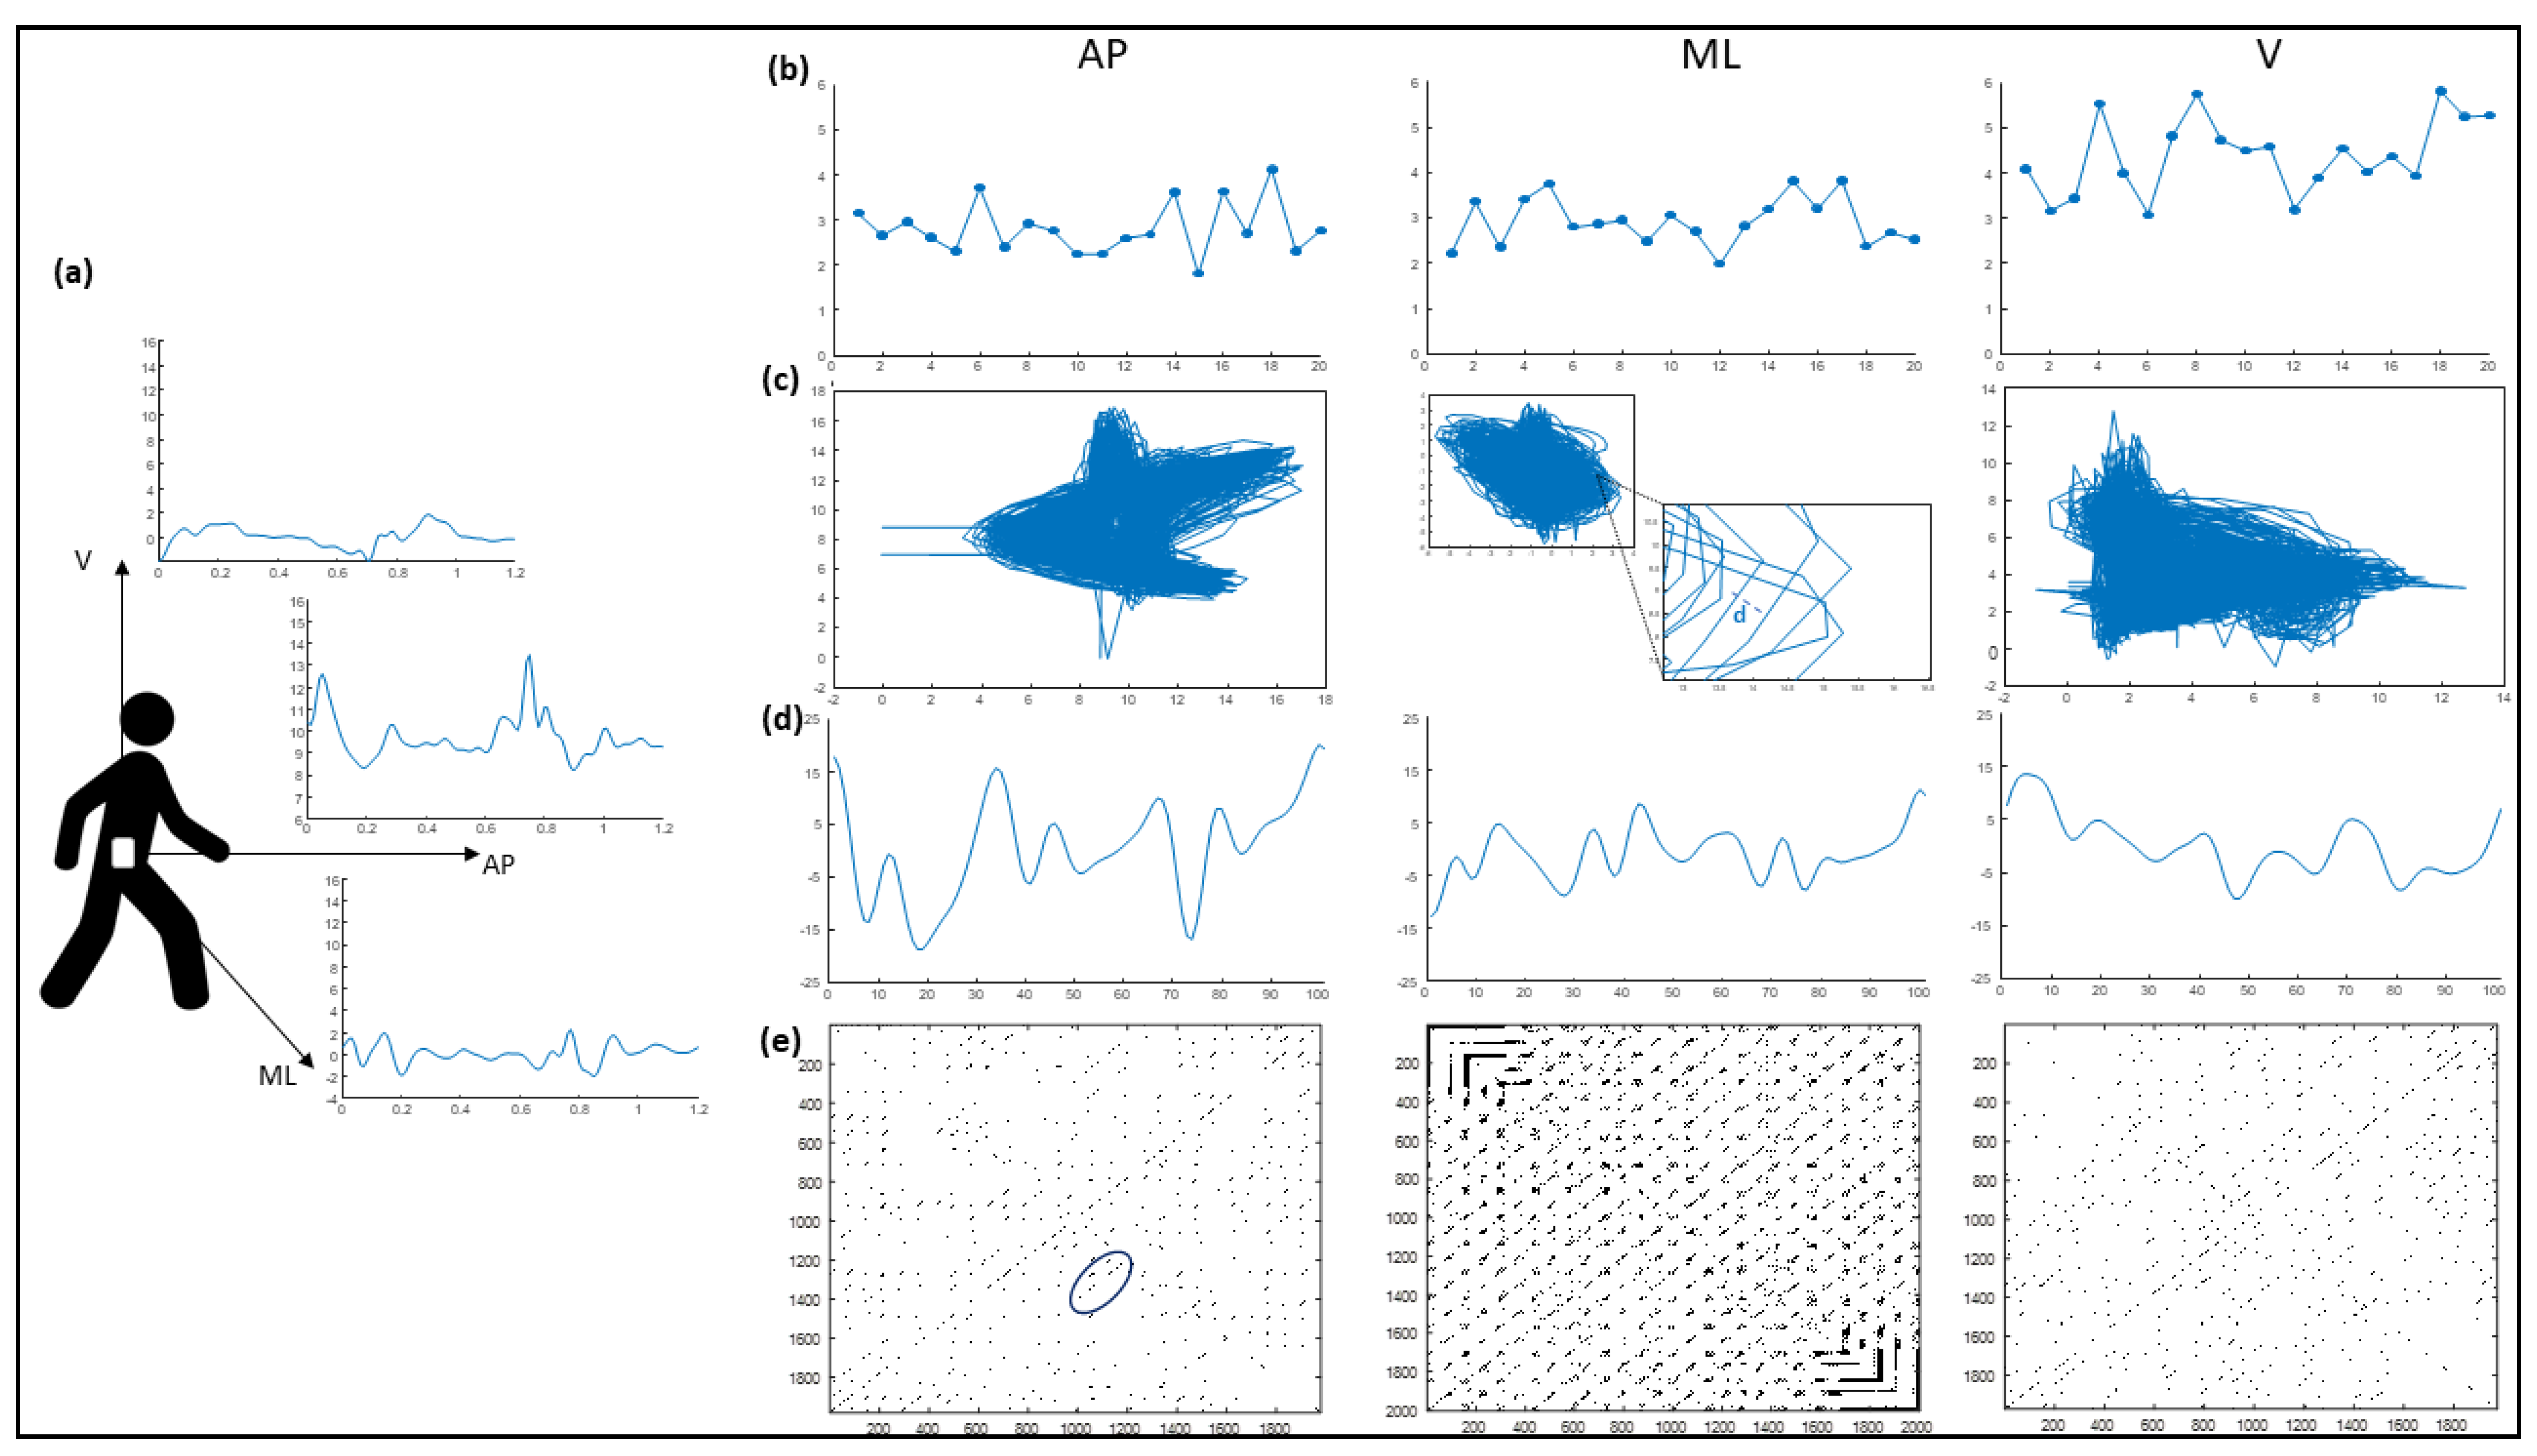
2.4. Inertial Sensor Data Processing
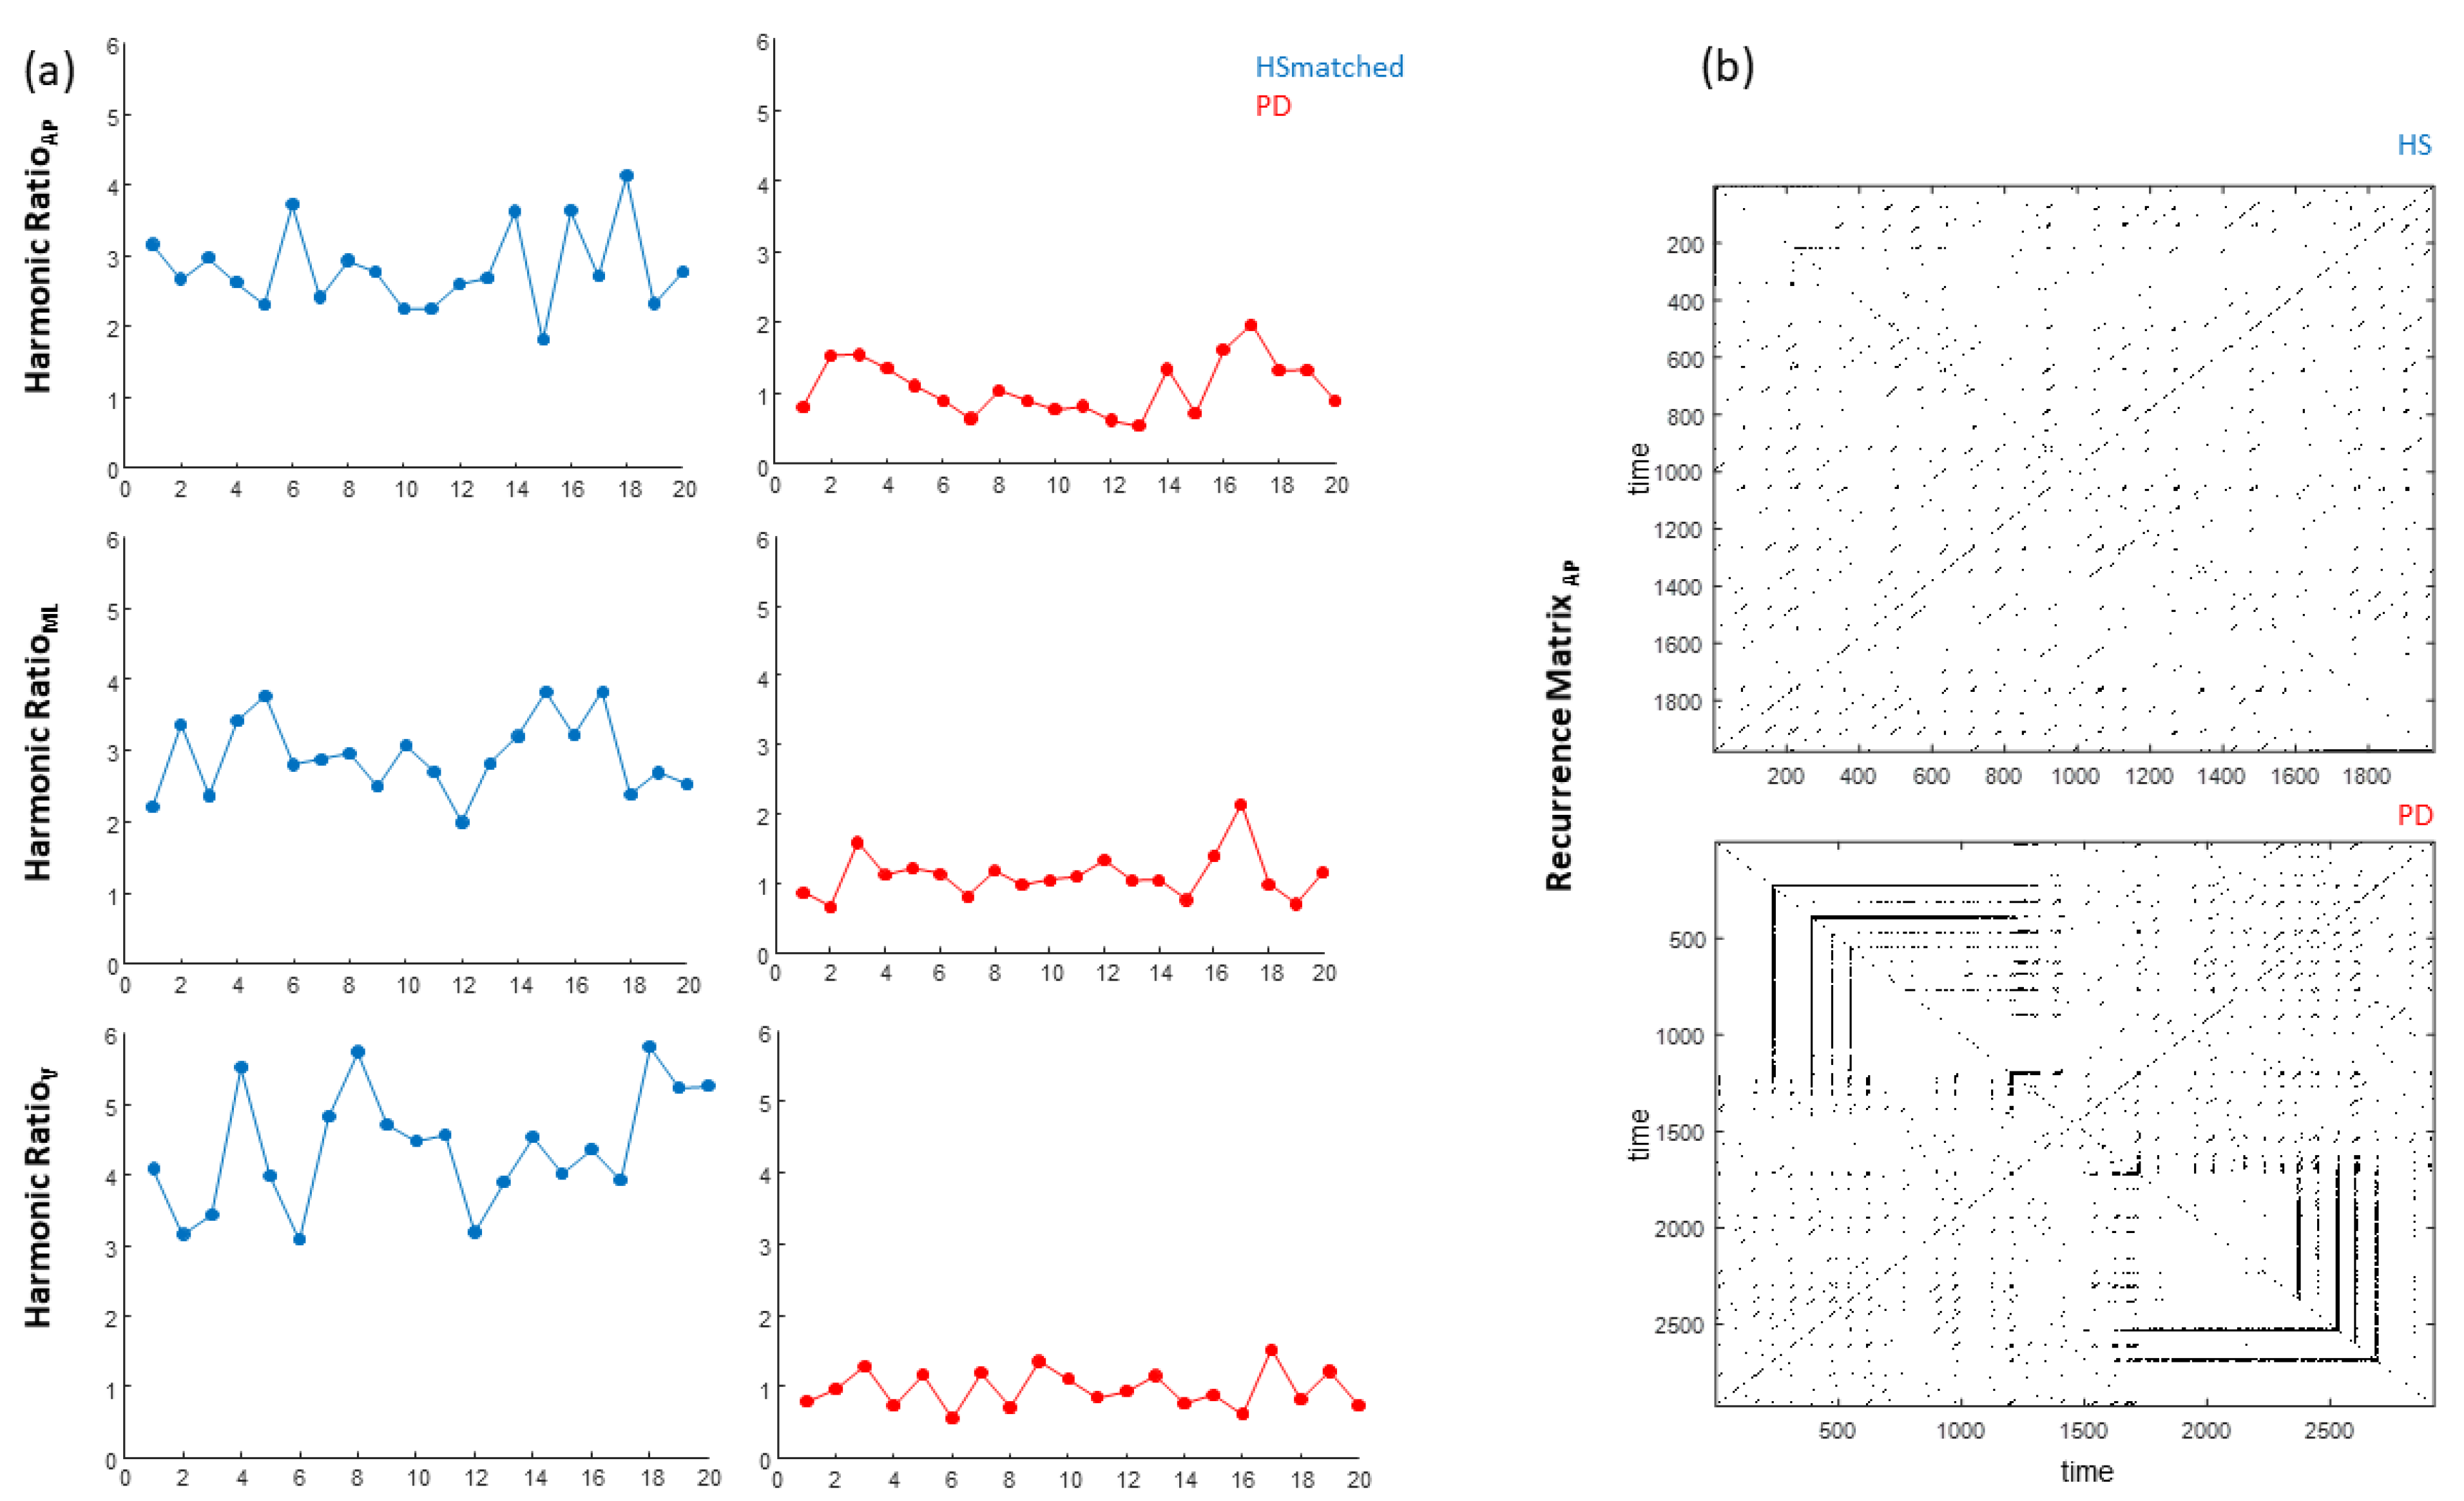
2.4.1. HR Calculation
2.4.2. RQA Calculation
2.4.3. CV
2.4.4. NJS
2.4.5. LLE
2.5. Clinical Assessment
2.6. Statistical Analysis
3. Results
3.1. Subjects and Matching Procedure Results
3.2. Discriminative Ability Results
3.3. Partial Correlation Analysis Results
4. Discussion
5. Conclusions
Author Contributions
Funding
Institutional Review Board Statement
Informed Consent Statement
Data Availability Statement
Conflicts of Interest
References
- Morris, M.E.; Iansek, R.; Matyas, T.A.; Summers, J.J. The pathogenesis of gait hypokinesia in parkinson’s disease. Brain 1994, 117, 1169–1181. [Google Scholar] [CrossRef] [PubMed]
- Amboni, M.; Iuppariello, L.; Iavarone, A.; Fasano, A.; Palladino, R.; Rucco, R.; Picillo, M.; Lista, I.; Varriale, P.; Vitale, C.; et al. Step length predicts executive dysfunction in Parkinson’s disease: A 3-year prospective study. J. Neurol. 2018, 265, 2211–2220. [Google Scholar] [CrossRef]
- De Boer, A.G.E.M.; Wijker, W.; Speelman, J.D.; De Haes, J.C.J.M. Quality of life in patients with Parkinson’s disease: Development of a questionnaire. J. Neurol. Neurosurg. Psychiatry 1996, 61, 70–74. [Google Scholar] [CrossRef] [PubMed]
- Martínez-Martín, P. An introduction to the concept of “quality of life in Parkinson’s disease”. J. Neurol. 1998, 245 (Suppl. S1). [Google Scholar] [CrossRef]
- McCrone, P.; Allcock, L.M.; Burn, D.J. Predicting the cost of Parkinson’s disease. Mov. Disord. 2007, 22, 804–812. [Google Scholar] [CrossRef] [PubMed]
- Martinez-Martin, P.; Macaulay, D.; Jalundhwala, Y.J.; Mu, F.; Ohashi, E.; Marshall, T.; Sail, K. The long-term direct and indirect economic burden among Parkinson’s disease caregivers in the United States. Mov. Disord. 2019, 34, 236–245. [Google Scholar] [CrossRef] [PubMed]
- Mirelman, A.; Bonato, P.; Camicioli, R.; Ellis, T.D.; Giladi, N.; Hamilton, J.L.; Hass, C.J.; Hausdorff, J.M.; Pelosin, E.; Almeida, Q.J. Gait impairments in Parkinson’s disease. Lancet Neurol. 2019, 18, 697–708. [Google Scholar] [CrossRef]
- Espay, A.J.; Bonato, P.; Nahab, F.B.; Maetzler, W.; Dean, J.M.; Klucken, J.; Eskofier, B.M.; Merola, A.; Horak, F.; Lang, A.E.; et al. Technology in Parkinson’s disease: Challenges and opportunities. Mov. Disord. 2016, 31, 1272–1282. [Google Scholar] [CrossRef] [PubMed]
- Espay, A.J.; Hausdorff, J.M.; Sánchez-Ferro, Á.; Klucken, J.; Merola, A.; Bonato, P.; Paul, S.S.; Horak, F.B.; Vizcarra, J.A.; Mestre, T.A.; et al. A roadmap for implementation of patient-centered digital outcome measures in Parkinson’s disease obtained using mobile health technologies. Mov. Disord. 2019, 34, 657–663. [Google Scholar] [CrossRef]
- Winser, S.J.; Kannan, P.; Bello, U.M.; Whitney, S.L. Measures of balance and falls risk prediction in people with Parkinson’s disease: A systematic review of psychometric properties. Clin. Rehabil. 2019, 33, 1949–1962. [Google Scholar] [CrossRef]
- Jacobs, J.V.; Horak, F.B.; Tran, V.K.; Nutt, J.G. Multiple balance tests improve the assessment of postural stability in subjects with Parkinson’s disease. J. Neurol. Neurosurg. Psychiatry 2006, 77, 322–326. [Google Scholar] [CrossRef]
- Bloem, B.R.; Marinus, J.; Almeida, Q.; Dibble, L.; Nieuwboer, A.; Post, B.; Ruzicka, E.; Goetz, C.; Stebbins, G.; Martinez-Martin, P.; et al. Measurement instruments to assess posture, gait, and balance in Parkinson’s disease: Critique and recommendations. Mov. Disord. 2016, 31, 1342–1355. [Google Scholar] [CrossRef] [PubMed]
- Sangarapillai, K.; Norman, B.M.; Almeida, Q.J. Rehabilitation of falls in parkinson’s disease: Self-perception vs. objective measures of fall risk. Brain Sci. 2021, 11, 320. [Google Scholar] [CrossRef] [PubMed]
- Dingwell, J.B.; Cusumano, J.P. Nonlinear time series analysis of normal and pathological human walking. Chaos 2000, 10, 848–863. [Google Scholar] [CrossRef] [PubMed]
- England, S.A.; Granata, K.P. The influence of gait speed on local dynamic stability of walking. Gait Posture 2007, 25, 172–178. [Google Scholar] [CrossRef] [PubMed]
- Hamacher, D.; Singh, N.B.; Van Dieën, J.H.; Heller, M.O.; Taylor, W.R. Kinematic measures for assessing gait stability in elderly individuals: A systematic review. J. R. Soc. Interface 2011, 8, 1682–1698. [Google Scholar] [CrossRef] [PubMed]
- Bruijn, S.M.; Meijer, O.G.; Beek, P.J.; Van Dieen, J.H. Assessing the stability of human locomotion: A review of current measures. J. R. Soc. Interface 2013, 10, 20120999. [Google Scholar] [CrossRef]
- Siragy, T.; Nantel, J. Quantifying Dynamic Balance in Young, Elderly and Parkinson’s Individuals: A Systematic Review. Front. Aging Neurosci. 2018, 10, 387. [Google Scholar] [CrossRef] [PubMed]
- Frenkel-Toledo, S.; Giladi, N.; Peretz, C.; Herman, T.; Gruendlinger, L.; Hausdorff, J.M. Effect of gait speed on gait rhythmicity in Parkinson’s disease: Variability of stride time and swing time respond differently. J. Neuroeng. Rehabil. 2005, 2. [Google Scholar] [CrossRef] [PubMed]
- Baltadjieva, R.; Giladi, N.; Gruendlinger, L.; Peretz, C.; Hausdorff, J.M. Marked alterations in the gait timing and rhythmicity of patients with de novo Parkinson’s disease. Eur. J. Neurosci. 2006, 24, 1815–1820. [Google Scholar] [CrossRef]
- Auriel, E.; Hausdorff, J.M.; Herman, T.; Simon, E.S.; Giladi, N. Effects of methylphenidate on cognitive function and gait in patients with Parkinson’s disease: A pilot study. Clin. Neuropharmacol. 2006, 29, 15–17. [Google Scholar] [CrossRef]
- Plotnik, M.; Giladi, N.; Hausdorff, J.M. A new measure for quantifying the bilateral coordination of human gait: Effects of aging and Parkinson’s disease. Exp. Brain Res. 2007, 181, 561–570. [Google Scholar] [CrossRef] [PubMed]
- Herman, T.; Giladi, N.; Gruendlinger, L.; Hausdorff, J.M. Six Weeks of Intensive Treadmill Training Improves Gait and Quality of Life in Patients with Parkinson’s Disease: A Pilot Study. Arch. Phys. Med. Rehabil. 2007, 88, 1154–1158. [Google Scholar] [CrossRef] [PubMed]
- Cole, M.H.; Silburn, P.A.; Wood, J.M.; Worringham, C.J.; Kerr, G.K. Falls in Parkinson’s disease: Kinematic evidence for impaired head and trunk control. Mov. Disord. 2010, 25, 2369–2378. [Google Scholar] [CrossRef] [PubMed]
- Latt, M.D.; Menz, H.B.; Fung, V.S.; Lord, S.R. Acceleration patterns of the head and pelvis during gait in older people with Parkinson’s disease: A comparison of fallers and nonfallers. J. Gerontol. Ser. A Biol. Sci. Med. Sci. 2009, 64, 700–706. [Google Scholar] [CrossRef]
- Lowry, K.A.; Smiley-Oyen, A.L.; Carrel, A.J.; Kerr, J.P. Walking stability using harmonic ratios in Parkinson’s disease. Mov. Disord. 2009, 24, 261–267. [Google Scholar] [CrossRef]
- Thumm, P.C.; Maidan, I.; Brozgol, M.; Shustak, S.; Gazit, E.; Shema Shiratzki, S.; Bernad-Elazari, H.; Beck, Y.; Giladi, N.; Hausdorff, J.M.; et al. Treadmill walking reduces pre-frontal activation in patients with Parkinson’s disease. Gait Posture 2018, 62, 384–387. [Google Scholar] [CrossRef]
- Miller Koop, M.; Ozinga, S.J.; Rosenfeldt, A.B.; Alberts, J.L. Quantifying turning behavior and gait in Parkinson’s disease using mobile technology. IBRO Rep. 2018, 5, 10–16. [Google Scholar] [CrossRef]
- Palmerini, L.; Mellone, S.; Avanzolini, G.; Valzania, F.; Chiari, L. Quantification of motor impairment in Parkinson’s disease using an instrumented timed up and go test. IEEE Trans. Neural Syst. Rehabil. Eng. 2013, 21, 664–673. [Google Scholar] [CrossRef]
- Sylos Labini, F.; Meli, A.; Ivanenko, Y.P.; Tufarelli, D. Recurrence quantification analysis of gait in normal and hypovestibular subjects. Gait Posture 2012, 35, 48–55. [Google Scholar] [CrossRef]
- Ramdani, S.; Tallon, G.; Bernard, P.L.; Blain, H. Recurrence quantification analysis of human postural fluctuations in older fallers and non-fallers. Ann. Biomed. Eng. 2013, 41, 1713–1725. [Google Scholar] [CrossRef]
- Cole, M.H.; Sweeney, M.; Conway, Z.J.; Blackmore, T.; Silburn, P.A. Imposed Faster and Slower Walking Speeds Influence Gait Stability Differently in Parkinson Fallers. Arch. Phys. Med. Rehabil. 2017, 98, 639–648. [Google Scholar] [CrossRef] [PubMed]
- Fukuchi, C.A.; Fukuchi, R.K.; Duarte, M. Effects of walking speed on gait biomechanics in healthy participants: A systematic review and meta-analysis. Syst. Rev. 2019, 8, 153. [Google Scholar] [CrossRef]
- Zampogna, A.; Mileti, I.; Palermo, E.; Celletti, C.; Paoloni, M.; Manoni, A.; Mazzetta, I.; Costa, G.D.; Pérez-López, C.; Camerota, F.; et al. Fifteen years of wireless sensors for balance assessment in neurological disorders. Sensors 2020, 20, 3247. [Google Scholar] [CrossRef] [PubMed]
- Brognara, L.; Palumbo, P.; Grimm, B.; Palmerini, L. Assessing Gait in Parkinson’s Disease Using Wearable Motion Sensors: A Systematic Review. Diseases 2019, 7, 18. [Google Scholar] [CrossRef] [PubMed]
- Schlachetzki, J.C.M.; Barth, J.; Marxreiter, F.; Gossler, J.; Kohl, Z.; Reinfelder, S.; Gassner, H.; Aminian, K.; Eskofier, B.M.; Winkler, J.; et al. Wearable sensors objectively measure gait parameters in Parkinson’s disease. PLoS ONE 2017, 12, e0183989. [Google Scholar] [CrossRef]
- Rovini, E.; Maremmani, C.; Cavallo, F. How wearable sensors can support parkinson’s disease diagnosis and treatment: A systematic review. Front. Neurosci. 2017, 11, 555. [Google Scholar] [CrossRef]
- Maetzler, W.; Domingos, J.; Srulijes, K.; Ferreira, J.J.; Bloem, B.R. Quantitative wearable sensors for objective assessment of Parkinson’s disease. Mov. Disord. 2013, 28, 1628–1637. [Google Scholar] [CrossRef]
- Ramdhani, R.A.; Khojandi, A.; Shylo, O.; Kopell, B.H. Optimizing clinical assessments in Parkinson’s disease through the use of wearable sensors and data driven modeling. Front. Comput. Neurosci. 2018, 12, 72. [Google Scholar] [CrossRef]
- Kuo, A.D.; Donelan, J.M. Dynamic principles of gait and their clinical implications. Phys. Ther. 2010, 90, 157–174. [Google Scholar] [CrossRef]
- Horak, F.B.; Mancini, M. Objective biomarkers of balance and gait for Parkinson’s disease using body-worn sensors. Mov. Disord. 2013, 28, 1544–1551. [Google Scholar] [CrossRef]
- Czech, M.; Demanuele, C.; Erb, M.K.; Ramos, V.; Zhang, H.; Ho, B.; Patel, S. The impact of reducing the number of wearable devices on measuring gait in parkinson disease: Noninterventional exploratory study. JMIR Rehabil. Assist. Technol. 2020, 7. [Google Scholar] [CrossRef] [PubMed]
- Hughes, A.J.; Daniel, S.E.; Kilford, L.; Lees, A.J. Accuracy of clinical diagnosis of idiopathic Parkinson’s disease: A clinico-pathological study of 100 cases. J. Neurol. Neurosurg. Psychiatry 1992, 55, 181–184. [Google Scholar] [CrossRef] [PubMed]
- Hoehn, M.M.; Yahr, M.D. Parkinsonism: Onset, progression, and mortality. Neurology 1967, 17, 427–442. [Google Scholar] [CrossRef] [PubMed]
- Kroneberg, D.; Elshehabi, M.; Meyer, A.C.; Otte, K.; Doss, S.; Paul, F.; Nussbaum, S.; Berg, D.; Kühn, A.A.; Maetzler, W.; et al. Less is more—Estimation of the number of strides required to assess gait variability in spatially confined settings. Front. Aging Neurosci. 2019, 11, 435. [Google Scholar] [CrossRef]
- Riva, F.; Bisi, M.C.; Stagni, R. Gait variability and stability measures: Minimum number of strides and within-session reliability. Comput. Biol. Med. 2014, 50, 9–13. [Google Scholar] [CrossRef] [PubMed]
- Pasciuto, I.; Bergamini, E.; Iosa, M.; Vannozzi, G.; Cappozzo, A. Overcoming the limitations of the Harmonic Ratio for the reliable assessment of gait symmetry. J. Biomech. 2017, 53, 84–89. [Google Scholar] [CrossRef] [PubMed]
- Folstein, M.F.; Folstein, S.E.; McHugh, P.R. “Mini-mental state”. A practical method for grading the cognitive state of patients for the clinician. J. Psychiatr. Res. 1975, 12, 189–198. [Google Scholar] [CrossRef]
- Perneczky, R.; Wagenpfeil, S.; Komossa, K.; Grimmer, T.; Diehl, J.; Kurz, A. Mapping scores onto stages: Mini-mental state examination and clinical dementia rating. Am. J. Geriatr. Psychiatry 2006, 14, 139–144. [Google Scholar] [CrossRef] [PubMed]
- Beck, A.T.; Ward, C.H.; Mendelson, M.; Mock, J.; Erbaugh, J. An Inventory for Measuring Depression. Arch. Gen. Psychiatry 1961, 4, 561–571. [Google Scholar] [CrossRef]
- Goodarzi, Z.; Mrklas, K.J.; Roberts, D.J.; Jette, N.; Pringsheim, T.; Holroyd-Leduc, J. Detecting depression in Parkinson disease: A systematic review and meta-analysis. Neurology 2016, 87, 426–437. [Google Scholar] [CrossRef]
- Altman, R.; Alarcón, G.; Appelrouth, D.; Bloch, D.; Borenstein, D.; Brandt, K.; Brown, C.; Cooke, T.D.; Daniel, W.; Feldman, D.; et al. The American College of Rheumatology criteria for the classification and reporting of osteoarthritis of the hip. Arthritis Rheum. 1991, 34, 505–514. [Google Scholar] [CrossRef] [PubMed]
- Fitzgerald, G.K.; Hinman, R.S.; Zeni, J.; Risberg, M.A.; Snyder-Mackler, L.; Bennell, K.L. OARSI Clinical Trials Recommendations: Design and conduct of clinical trials of rehabilitation interventions for osteoarthritis. Osteoarthr. Cartil. 2015, 23, 803–814. [Google Scholar] [CrossRef] [PubMed]
- Damen, J.; Van Rijn, R.M.; Emans, P.J.; Hilberdink, W.K.H.A.; Wesseling, J.; Oei, E.H.G.; Bierma-Zeinstra, S.M.A. Prevalence and development of hip and knee osteoarthritis according to American College of Rheumatology criteria in the CHECK cohort. Breast Cancer Res. 2019, 21. [Google Scholar] [CrossRef]
- Serrao, M.; Chini, G.; Caramanico, G.; Bartolo, M.; Castiglia, S.F.; Ranavolo, A.; Conte, C.; Venditto, T.; Coppola, G.; Di Lorenzo, C.; et al. Prediction of responsiveness of gait variables to rehabilitation training in Parkinson’s disease. Front. Neurol. 2019, 10, 826. [Google Scholar] [CrossRef] [PubMed]
- Rinaldi, M.; Ranavolo, A.; Conforto, S.; Martino, G.; Draicchio, F.; Conte, C.; Varrecchia, T.; Bini, F.; Casali, C.; Pierelli, F.; et al. Increased lower limb muscle coactivation reduces gait performance and increases metabolic cost in patients with hereditary spastic paraparesis. Clin. Biomech. 2017, 48, 63–72. [Google Scholar] [CrossRef]
- Mari, S.; Serrao, M.; Casali, C.; Conte, C.; Martino, G.; Ranavolo, A.; Coppola, G.; Draicchio, F.; Padua, L.; Sandrini, G.; et al. Lower limb antagonist muscle co-activation and its relationship with gait parameters in cerebellar ataxia. Cerebellum 2014, 13, 226–236. [Google Scholar] [CrossRef] [PubMed]
- Cofré, L.E.; Lythgo, N.; Morgan, D.; Galea, M.P. Aging modifies joint power and work when gait speeds are matched. Gait Posture 2011, 33, 484–489. [Google Scholar] [CrossRef]
- Peterson, D.S.; Mancini, M.; Fino, P.C.; Horak, F.; Smulders, K. Speeding Up Gait in Parkinson’s Disease. J. Parkinsons Dis. 2020, 10, 245–253. [Google Scholar] [CrossRef]
- Smidt, G.L. Methods of studying gait. Phys. Ther. 1974, 54, 13–17. [Google Scholar] [CrossRef]
- Iosa, M.; Picerno, P.; Paolucci, S.; Morone, G. Wearable inertial sensors for human movement analysis. Expert Rev. Med. Devices 2016, 13, 641–659. [Google Scholar] [CrossRef]
- Webber, C.L.; Zbilut, J.P. Dynamical assessment of physiological systems and states using recurrence plot strategies. J. Appl. Physiol. 1994, 76, 965–973. [Google Scholar] [CrossRef] [PubMed]
- Kennel, M.B.; Abarbanel, H.D.I. False neighbors and false strands: A reliable minimum embedding dimension algorithm. Phys. Rev. E Stat. Phys. Plasmas Fluids Relat. Interdiscip. Top. 2002, 66. [Google Scholar] [CrossRef] [PubMed]
- Wallot, S.; Mønster, D. Calculation of Average Mutual Information (AMI) and false-nearest neighbors (FNN) for the estimation of embedding parameters of multidimensional time series in matlab. Front. Psychol. 2018, 9, 1679. [Google Scholar] [CrossRef] [PubMed]
- Toebes, M.J.P.; Hoozemans, M.J.M.; Furrer, R.; Dekker, J.; Van Dieën, J.H. Local dynamic stability and variability of gait are associated with fall history in elderly subjects. Gait Posture 2012, 36, 527–531. [Google Scholar] [CrossRef] [PubMed]
- Fraser, A.M.; Swinney, H.L. Independent coordinates for strange attractors from mutual information. Phys. Rev. A 1986, 33, 1134–1140. [Google Scholar] [CrossRef] [PubMed]
- Zijlstra, W. Assessment of spatio-temporal parameters during unconstrained walking. Eur. J. Appl. Physiol. 2004, 92, 39–44. [Google Scholar] [CrossRef]
- Serrao, M.; Pierelli, F.; Ranavolo, A.; Draicchio, F.; Conte, C.; Don, R.; Di Fabio, R.; Lerose, M.; Padua, L.; Sandrini, G.; et al. Gait pattern in inherited cerebellar ataxias. Cerebellum 2012, 11, 194–211. [Google Scholar] [CrossRef]
- Van Schooten, K.S.; Rispens, S.M.; Elders, P.J.M.; van Dieën, J.H.; Pijnappels, M. Toward ambulatory balance assessment: Estimating variability and stability from short bouts of gait. Gait Posture 2014, 39, 695–699. [Google Scholar] [CrossRef][Green Version]
- Chini, G.; Ranavolo, A.; Draicchio, F.; Casali, C.; Conte, C.; Martino, G.; Leonardi, L.; Padua, L.; Coppola, G.; Pierelli, F.; et al. Local Stability of the Trunk in Patients with Degenerative Cerebellar Ataxia During Walking. Cerebellum 2017, 16, 26–33. [Google Scholar] [CrossRef]
- Goetz, C.G.; Tilley, B.C.; Shaftman, S.R.; Stebbins, G.T.; Fahn, S.; Martinez-Martin, P.; Poewe, W.; Sampaio, C.; Stern, M.B.; Dodel, R.; et al. Movement Disorder Society-Sponsored Revision of the Unified Parkinson’s Disease Rating Scale (MDS-UPDRS): Scale presentation and clinimetric testing results. Mov. Disord. 2008, 23, 2129–2170. [Google Scholar] [CrossRef] [PubMed]
- Yao, X.I.; Wang, X.; Speicher, P.J.; Hwang, E.S.; Cheng, P.; Harpole, D.H.; Berry, M.F.; Schrag, D.; Pang, H.H. Reporting and Guidelines in Propensity Score Analysis: A Systematic Review of Cancer and Cancer Surgical Studies. J. Natl. Cancer Inst. 2017, 109, djw323. [Google Scholar] [CrossRef] [PubMed]
- Nemanich, S.T.; Duncan, R.P.; Dibble, L.E.; Cavanaugh, J.T.; Ellis, T.D.; Ford, M.P.; Foreman, K.B.; Earhart, G.M. Predictors of gait speeds and the relationship of gait speeds to falls in men and women with parkinson disease. Parkinsons Dis. 2013, 2013. [Google Scholar] [CrossRef] [PubMed]
- Noh, B.; Youm, C.; Lee, M.; Cheon, S.M. Gait characteristics in individuals with Parkinson’s disease during 1-minute treadmill walking. PeerJ 2020, 2020. [Google Scholar] [CrossRef]
- Lindemann, U. Spatiotemporal gait analysis of older persons in clinical practice and research: Which parameters are relevant? Z. Gerontol. Geriatr. 2020, 53, 171–178. [Google Scholar] [CrossRef] [PubMed]
- Huijben, B.; van Schooten, K.S.; van Dieën, J.H.; Pijnappels, M. The effect of walking speed on quality of gait in older adults. Gait Posture 2018, 65, 112–116. [Google Scholar] [CrossRef] [PubMed]
- Craig, J.J.; Bruetsch, A.P.; Huisinga, J.M. Coordination of trunk and foot acceleration during gait is affected by walking velocity and fall history in elderly adults. Aging Clin. Exp. Res. 2019, 31, 943–950. [Google Scholar] [CrossRef]
- Lee, S.; Lee, D.K. What is the proper way to apply the multiple comparison test? Korean J. Anesthesiol. 2018, 71, 353–360. [Google Scholar] [CrossRef] [PubMed]
- Paul, S.S.; Allen, N.E.; Sherrington, C.; Heller, G.; Fung, V.S.C.; Close, J.C.T.; Lord, S.R.; Canning, C.G. Risk factors for frequent falls in people with Parkinson’s disease. J. Parkinsons Dis. 2014, 4, 699–703. [Google Scholar] [CrossRef] [PubMed]
- Allen, N.E.; Schwarzel, A.K.; Canning, C.G. Recurrent falls in parkinson’s disease: A systematic review. Parkinsons Dis. 2013, 2013, 906274. [Google Scholar] [CrossRef] [PubMed]
- Thomas, A.A.; Rogers, J.M.; Amick, M.M.; Friedman, J.H. Falls and the falls efficacy scale in Parkinson’s disease. J. Neurol. 2010, 257, 1124–1128. [Google Scholar] [CrossRef] [PubMed]
- Carter, J.V.; Pan, J.; Rai, S.N.; Galandiuk, S. ROC-ing along: Evaluation and interpretation of receiver operating characteristic curves. Surgery 2016, 159, 1638–1645. [Google Scholar] [CrossRef] [PubMed]
- Kallner, A. Bayes’ theorem, the roc diagram and reference values: Definition and use in clinical diagnosis. Biochem. Med. 2018, 28. [Google Scholar] [CrossRef] [PubMed]
- Fasano, A.; Canning, C.G.; Hausdorff, J.M.; Lord, S.; Rochester, L. Falls in Parkinson’s disease: A complex and evolving picture. Mov. Disord. 2017, 32, 1524–1536. [Google Scholar] [CrossRef]
- Eusebi, P. Diagnostic accuracy measures. Cerebrovasc. Dis. 2013, 36, 267–272. [Google Scholar] [CrossRef] [PubMed]
- Afsar, O.; Tirnakli, U.; Marwan, N. Recurrence Quantification Analysis at work: Quasi-periodicity based interpretation of gait force profiles for patients with Parkinson disease. Sci. Rep. 2018, 8. [Google Scholar] [CrossRef] [PubMed]
- Afşar, Ö. Recurrence Quantification Analysis on Gait Reaction Forces of Elderly Adults for Determination of Pathological States. Celal Bayar Univ. Fen Bilim. Derg. 2018, 14, 309–314. [Google Scholar] [CrossRef][Green Version]
- Varrecchia, T.; Castiglia, S.F.; Ranavolo, A.; Conte, C.; Tatarelli, A.; Coppola, G.; Di Lorenzo, C.; Draicchio, F.; Pierelli, F.; Serrao, M. An artificial neural network approach to detect presence and severity of Parkinson’s disease via gait parameters. PLoS ONE 2021, 16, e0244396. [Google Scholar] [CrossRef]
- Creaby, M.W.; Cole, M.H. Gait characteristics and falls in Parkinson’s disease: A systematic review and meta-analysis. Park. Relat. Disord. 2018, 57, 1–8. [Google Scholar] [CrossRef]
- Pham, T.D. Pattern analysis of computer keystroke time series in healthy control and early-stage Parkinson’s disease subjects using fuzzy recurrence and scalable recurrence network features. J. Neurosci. Methods 2018, 307, 194–202. [Google Scholar] [CrossRef]
- Djurić-Jovičić, M.; Belić, M.; Stanković, I.; Radovanović, S.; Kostić, V.S. Selection of gait parameters for differential diagnostics of patients with de novo Parkinson’s disease. Neurol. Res. 2017, 39, 853–861. [Google Scholar] [CrossRef]
- Kwon, K.Y.; Lee, H.M.; Kang, S.H.; Pyo, S.J.; Kim, H.J.; Koh, S.B. Recuperation of slow walking in de novo Parkinson’s disease is more closely associated with increased cadence, rather than with expanded stride length. Gait Posture 2017, 58, 1–6. [Google Scholar] [CrossRef]
- Mancini, M.; Carlson-Kuhta, P.; Zampieri, C.; Nutt, J.G.; Chiari, L.; Horak, F.B. Postural sway as a marker of progression in Parkinson’s disease: A pilot longitudinal study. Gait Posture 2012, 36, 471–476. [Google Scholar] [CrossRef]
- Bovonsunthonchai, S.; Vachalathiti, R.; Pisarnpong, A.; Khobhun, F.; Hiengkaew, V. Spatiotemporal Gait Parameters for Patients with Parkinson’s Disease Compared with Normal Individuals. Physiother. Res. Int. 2014, 19, 158–165. [Google Scholar] [CrossRef]
- Mak, M.K.Y. Reduced step length, not step length variability is central to gait hypokinesia in people with Parkinson’s disease. Clin. Neurol. Neurosurg. 2013, 115, 587–590. [Google Scholar] [CrossRef] [PubMed]
- Warabi, T.; Furuyama, H.; Kato, M. Gait bradykinesia: Difficulty in switching posture/gait measured by the anatomical y-axis vector of the sole in Parkinson’s disease. Exp. Brain Res. 2020, 238, 139–151. [Google Scholar] [CrossRef] [PubMed]
- Zampier, V.C.; Vitório, R.; Beretta, V.S.; Jaimes, D.A.R.; Orcioli-Silva, D.; Santos, P.C.R.; Gobbi, L.T.B. Gait bradykinesia and hypometria decrease as arm swing frequency and amplitude increase. Neurosci. Lett. 2018, 687, 248–252. [Google Scholar] [CrossRef] [PubMed]
- Fino, P.C.; Mancini, M.; Curtze, C.; Nutt, J.G.; Horak, F.B. Gait stability has phase-dependent dual-task costs in Parkinson’s disease. Front. Neurol. 2018, 9, 373. [Google Scholar] [CrossRef] [PubMed]


| HY 1 | HY 2 | HY 3 | HSmatched | |
|---|---|---|---|---|
| Mean (SD) | Mean (SD) | Mean (SD) | Mean (SD) | |
| HRAP | 2.00 (0.55) | 1.94 (0.51) | 1.65 (0.34) * # | 2.08 (0.67) |
| HRML | 1.82 (0.49) | 1.84 (0.48) | 1.63 (0.37) * | 1.97 (0.51) |
| HRV | 1.93 (0.53) | 1.86 (0.41) | 1.64 (0.37) * | 2.05 (0.50) |
| RQArecAP | 3.13 (2.04) | 4.21 (2.91) | 4.35 (4.10) | 5.24 (3.54) |
| RQArecML | 4.43 (4.83) | 3.80 (4.08) | 2.53 (3.77) | 3.86 (3.31) |
| RQArecV | 4.73 (5.50) | 3.44 (4.65) | 5.38 (7.62) | 2.76 (2.25) |
| RQAdetAP | 23.20 (15.94) * | 30.23 (17.89) * | 28.37 (22.74) * | 41.75 (27.07) |
| RQAdetML | 31.09 (26.35) | 33.93 (26.27) | 22.63 (25.10) | 34.93 (25.38) |
| RQAdetV | 27.17 (28.83) | 20.61 (20.05) | 25.40 (23.67) | 23.78 (16.04) |
| CV | 39.36 (17.85) | 35.56 (16.94) | 40.92 (18.30) * | 28.72 (14.08) |
| NJSAP | 2261.67 (1387.79) | 4157.58 (3465.20) | 4061.89 (2839.03) | 3512.49 (3047.39) |
| NJSML | 1169.38 (959.77) | 1518.38 (1115.65) | 1622.29 (1217.89) | 1558.43 (1221.20) |
| NJSV | 1127.09 (808.44) | 1526.17 (1166.67) | 1591.34 (1925.34) | 1656.37 (1169.45) |
| LLEAP | 0.53 (0.26) | 0.49 (0.20) | 0.60 (0.23) | 0.53 (0.26) |
| LLEML | 0.64 (0.23) | 0.58 (0.18) | 0.63 (0.20) | 0.54 (0.28) |
| LLEV | 0.82 (0.28) | 0.88 (0.21) | 0.88 (0.21) | 0.86 (0.29) |
| Gait Index | Subjects | AUC (95% CI) | OCP | Se (95% CI) | Sp (95% CI) | LR+ | LR− | PTP+ | PTP− |
|---|---|---|---|---|---|---|---|---|---|
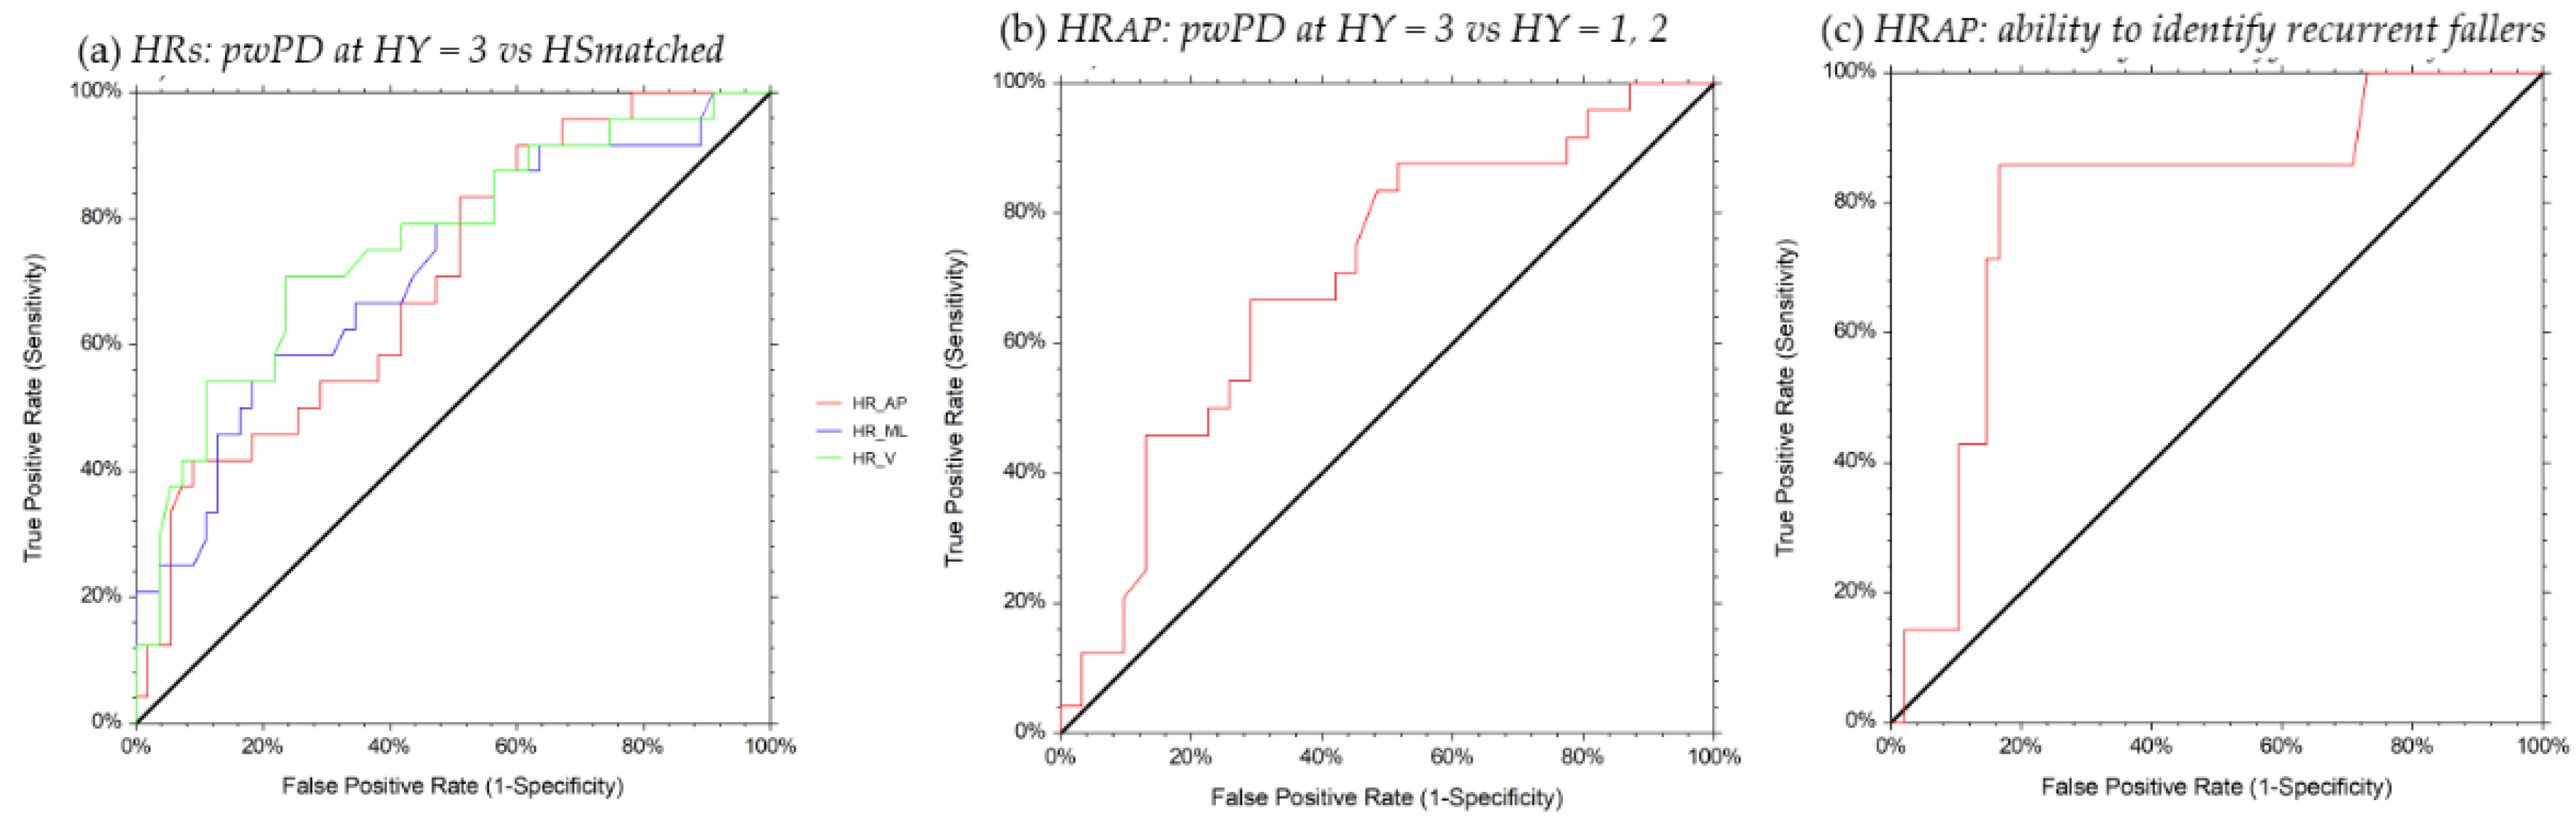
| HRAP | HY = 3 vs. HSmatched | 0.71 (0.56–0.81) | ≤1.50 | 0.42 (0.22–0.63) | 0.91 (0.80–0.97) | 4.58 | 0.64 | 67% | 22% |
| HY = 3 vs. HY = 1.2 | 0.70 (0.53–0.80) | ≤1.50 | 0.46 (0.25–0.67) | 0.87 (0.70–0.96) | 3.55 | 0.62 | 73% | 32% | |
| recurrent fallers (≥5) | 0.80 (0.52–0.92) | ≤1.50 | 0.85 (0.42–0.98) | 0.83 (0.70–0.92) | 5.14 | 0.17 | 77% | 10% | |
| HRML | HY = 3 vs. HSmatched | 0.72 (0.56–0.82) | ≤1.58 | 0.58 (0.36–0.78) | 0.78 (0.65–0.88) | 2.67 | 0.53 | 54% | 19% |
| HRV | HY = 3 vs. HSmatched | 0.76 (0.61–0.86) | ≤1.74 | 0.71 (0.49–0.87) | 0.76 (0.63–0.87) | 3.00 | 0.38 | 57% | 14% |
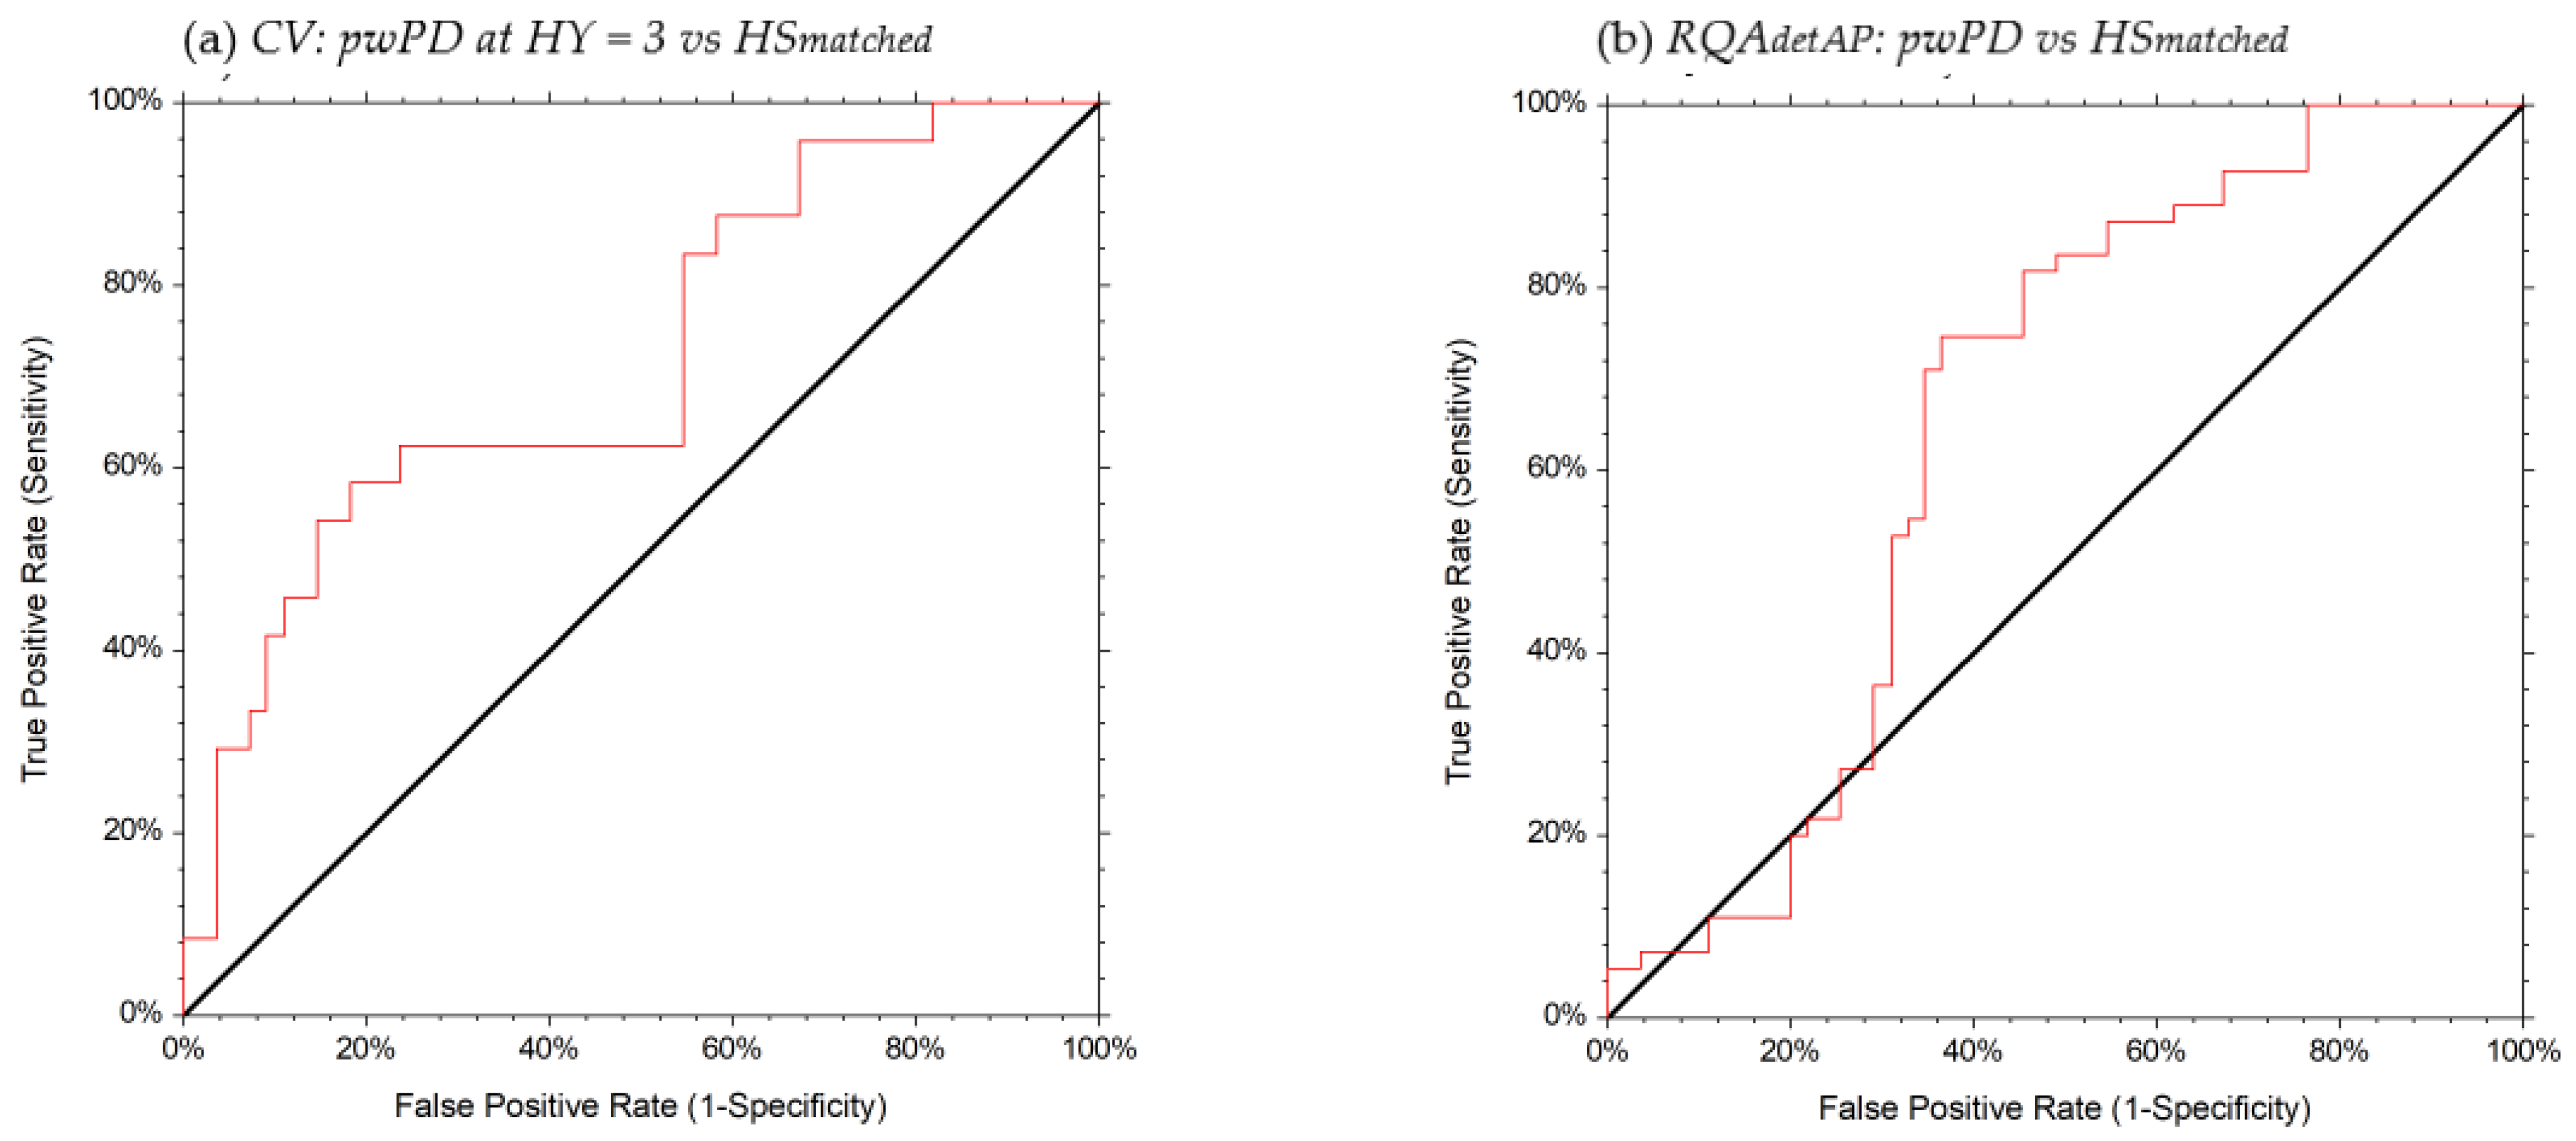
| RQAdetAP | All subjects with PD vs. HSmatched | 0.65 (0.53–0.75) | ≤38.85 | 0.74 (0.61–0.85) | 0.63 (0.49–0.76) | 2.05 | 0.40 | 67% | 29% |
| CV | HY = 3 vs. HSmatched | 0.72 (0.57–0.82) | ≥38.06 | 0.58 (0.36–0.78) | 0.81 (0.69–0.91) | 3.21 | 0.51 | 58% | 18% |
Publisher’s Note: MDPI stays neutral with regard to jurisdictional claims in published maps and institutional affiliations. |
© 2021 by the authors. Licensee MDPI, Basel, Switzerland. This article is an open access article distributed under the terms and conditions of the Creative Commons Attribution (CC BY) license (https://creativecommons.org/licenses/by/4.0/).
Share and Cite
Castiglia, S.F.; Tatarelli, A.; Trabassi, D.; De Icco, R.; Grillo, V.; Ranavolo, A.; Varrecchia, T.; Magnifica, F.; Di Lenola, D.; Coppola, G.; et al. Ability of a Set of Trunk Inertial Indexes of Gait to Identify Gait Instability and Recurrent Fallers in Parkinson’s Disease. Sensors 2021, 21, 3449. https://doi.org/10.3390/s21103449
Castiglia SF, Tatarelli A, Trabassi D, De Icco R, Grillo V, Ranavolo A, Varrecchia T, Magnifica F, Di Lenola D, Coppola G, et al. Ability of a Set of Trunk Inertial Indexes of Gait to Identify Gait Instability and Recurrent Fallers in Parkinson’s Disease. Sensors. 2021; 21(10):3449. https://doi.org/10.3390/s21103449
Chicago/Turabian StyleCastiglia, Stefano Filippo, Antonella Tatarelli, Dante Trabassi, Roberto De Icco, Valentina Grillo, Alberto Ranavolo, Tiwana Varrecchia, Fabrizio Magnifica, Davide Di Lenola, Gianluca Coppola, and et al. 2021. "Ability of a Set of Trunk Inertial Indexes of Gait to Identify Gait Instability and Recurrent Fallers in Parkinson’s Disease" Sensors 21, no. 10: 3449. https://doi.org/10.3390/s21103449
APA StyleCastiglia, S. F., Tatarelli, A., Trabassi, D., De Icco, R., Grillo, V., Ranavolo, A., Varrecchia, T., Magnifica, F., Di Lenola, D., Coppola, G., Ferrari, D., Denaro, A., Tassorelli, C., & Serrao, M. (2021). Ability of a Set of Trunk Inertial Indexes of Gait to Identify Gait Instability and Recurrent Fallers in Parkinson’s Disease. Sensors, 21(10), 3449. https://doi.org/10.3390/s21103449