Respiratory Monitoring Based on Tracheal Sounds: Continuous Time-Frequency Processing of the Phonospirogram Combined with Phonocardiogram-Derived Respiration

 , , , and
Abstract
1. Introduction
1.1. Apnea Detection
1.1.1. Detection in the Temporal Domain
1.1.2. Detection in the Frequency Domain
1.2. Phonocardiogram (PCG)-Derived Respiration
2. Material and Method
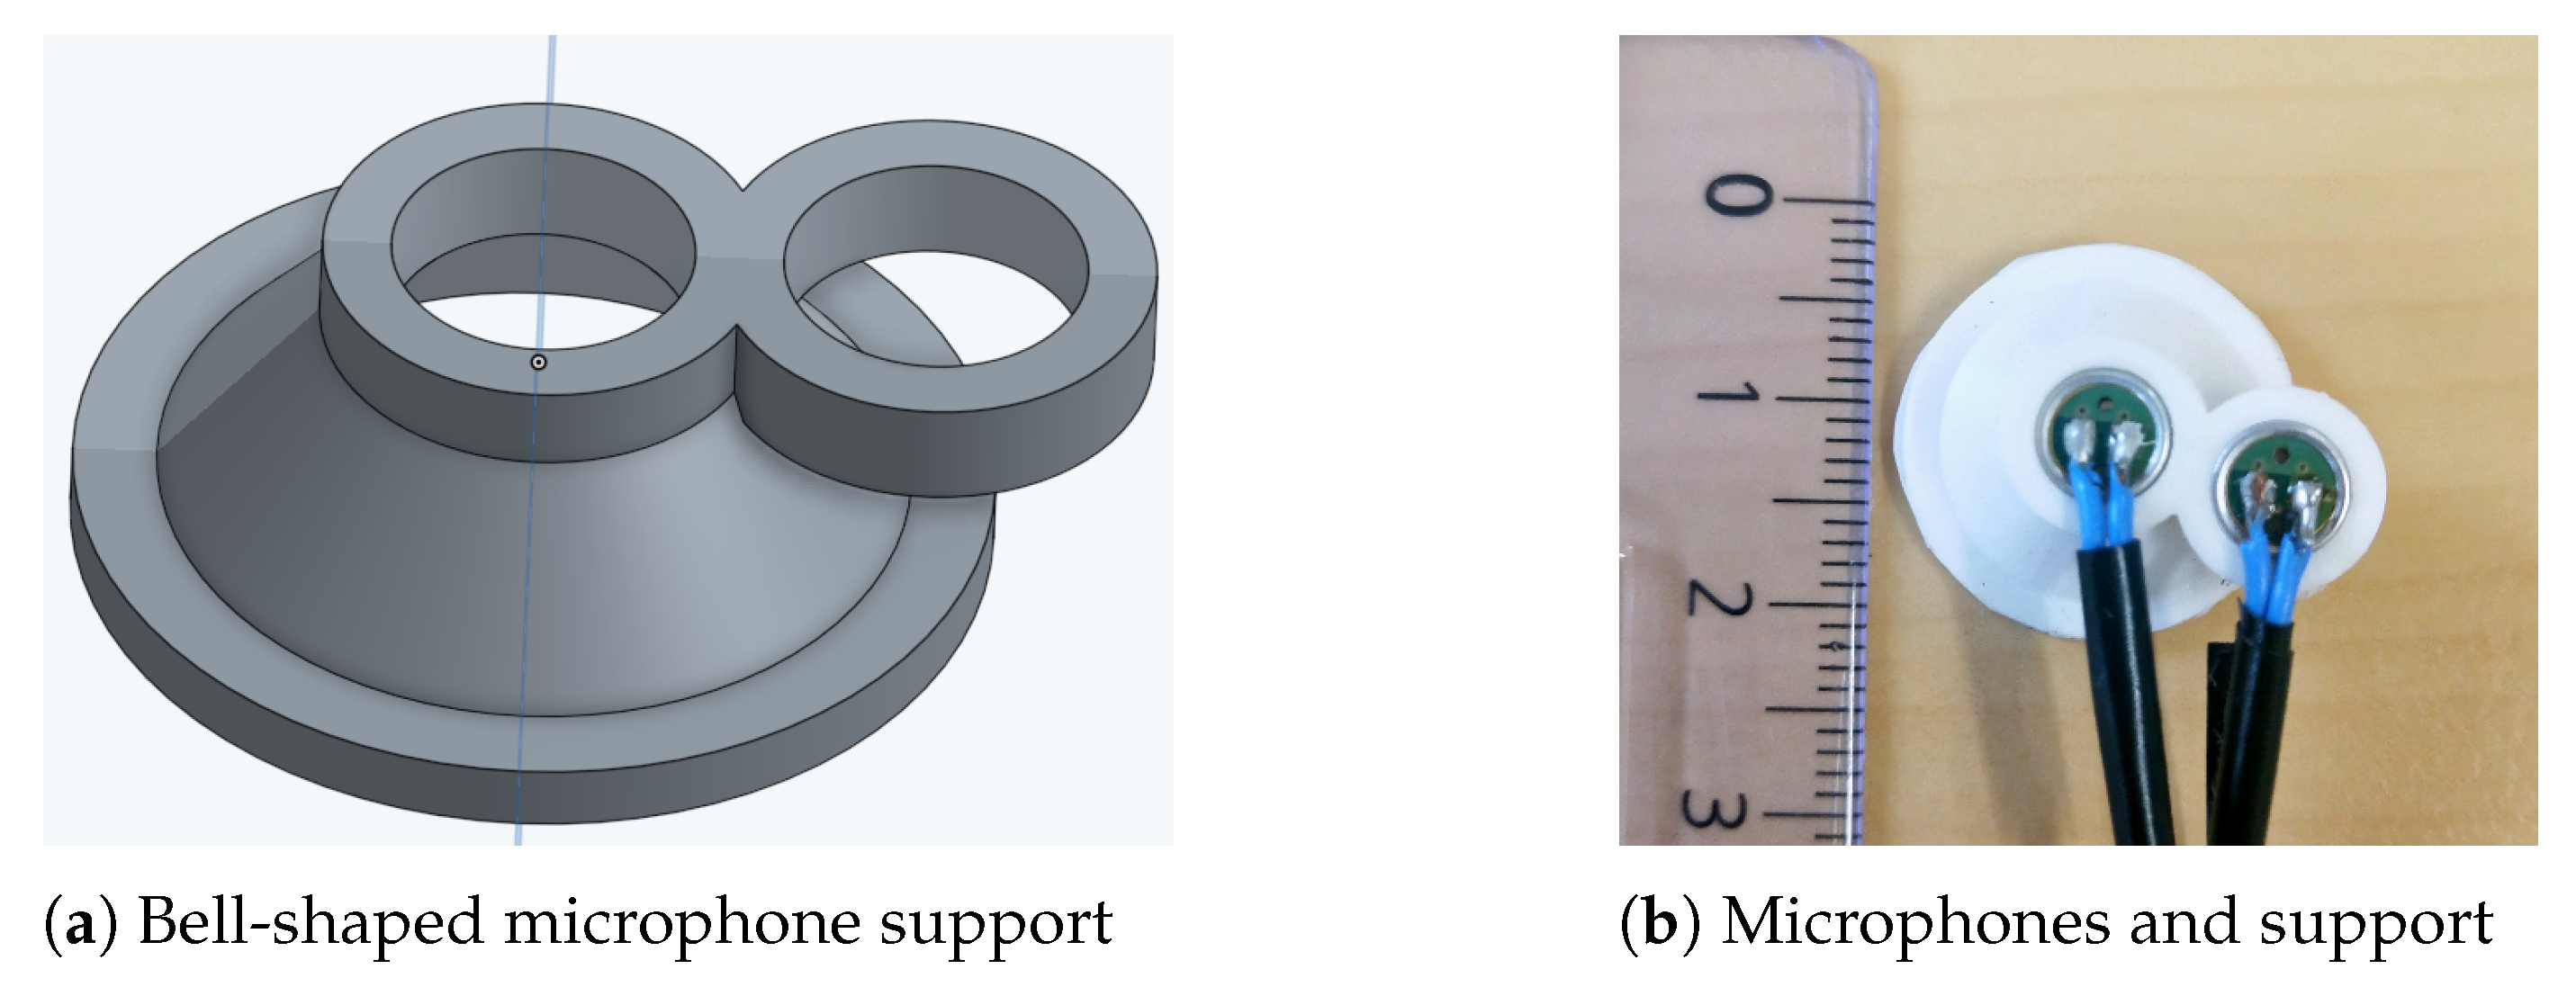
2.1. Material
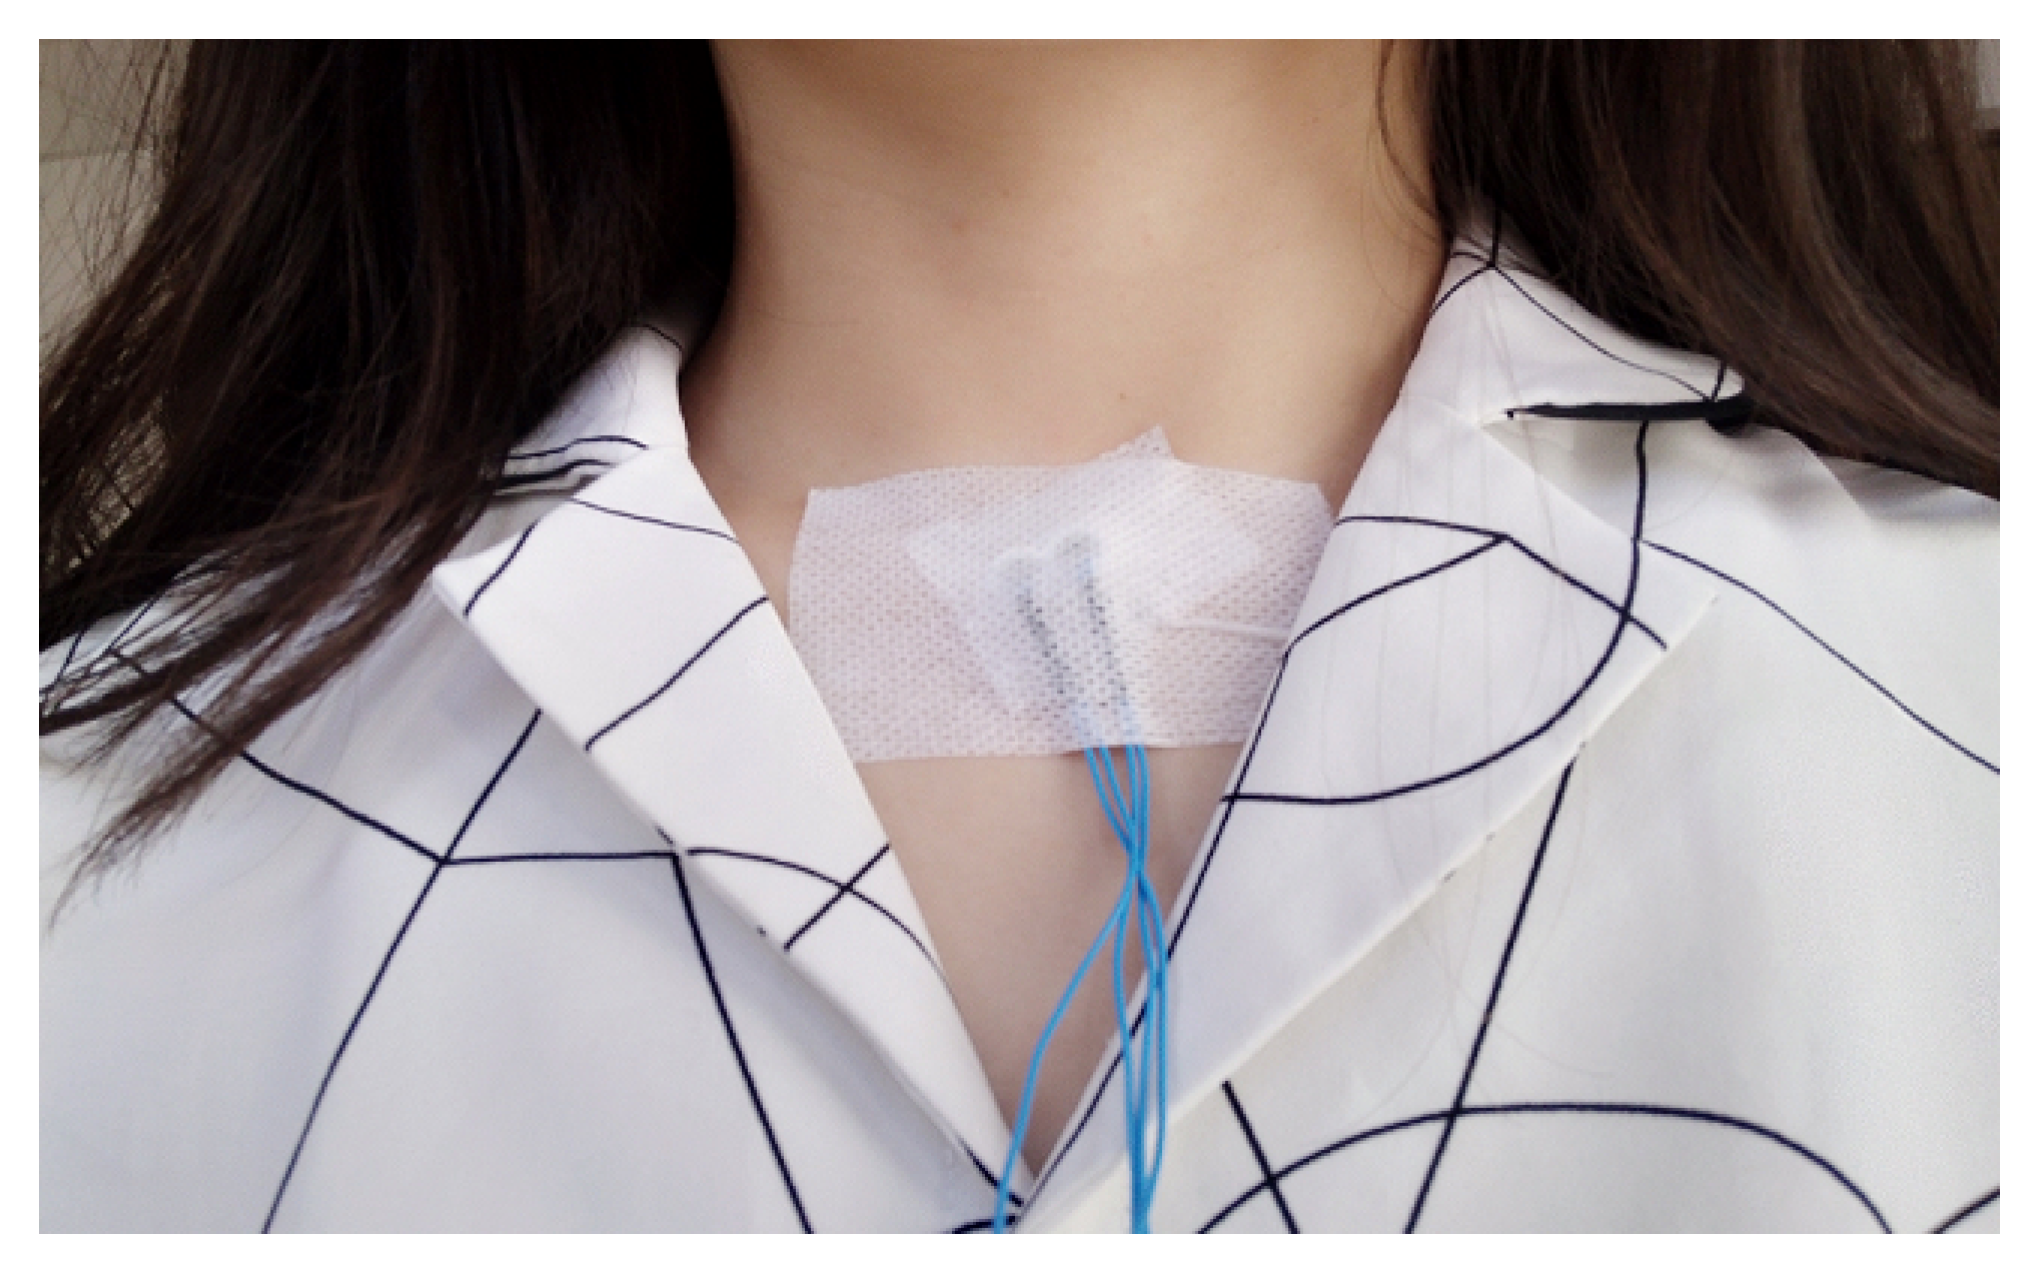
2.2. Protocol
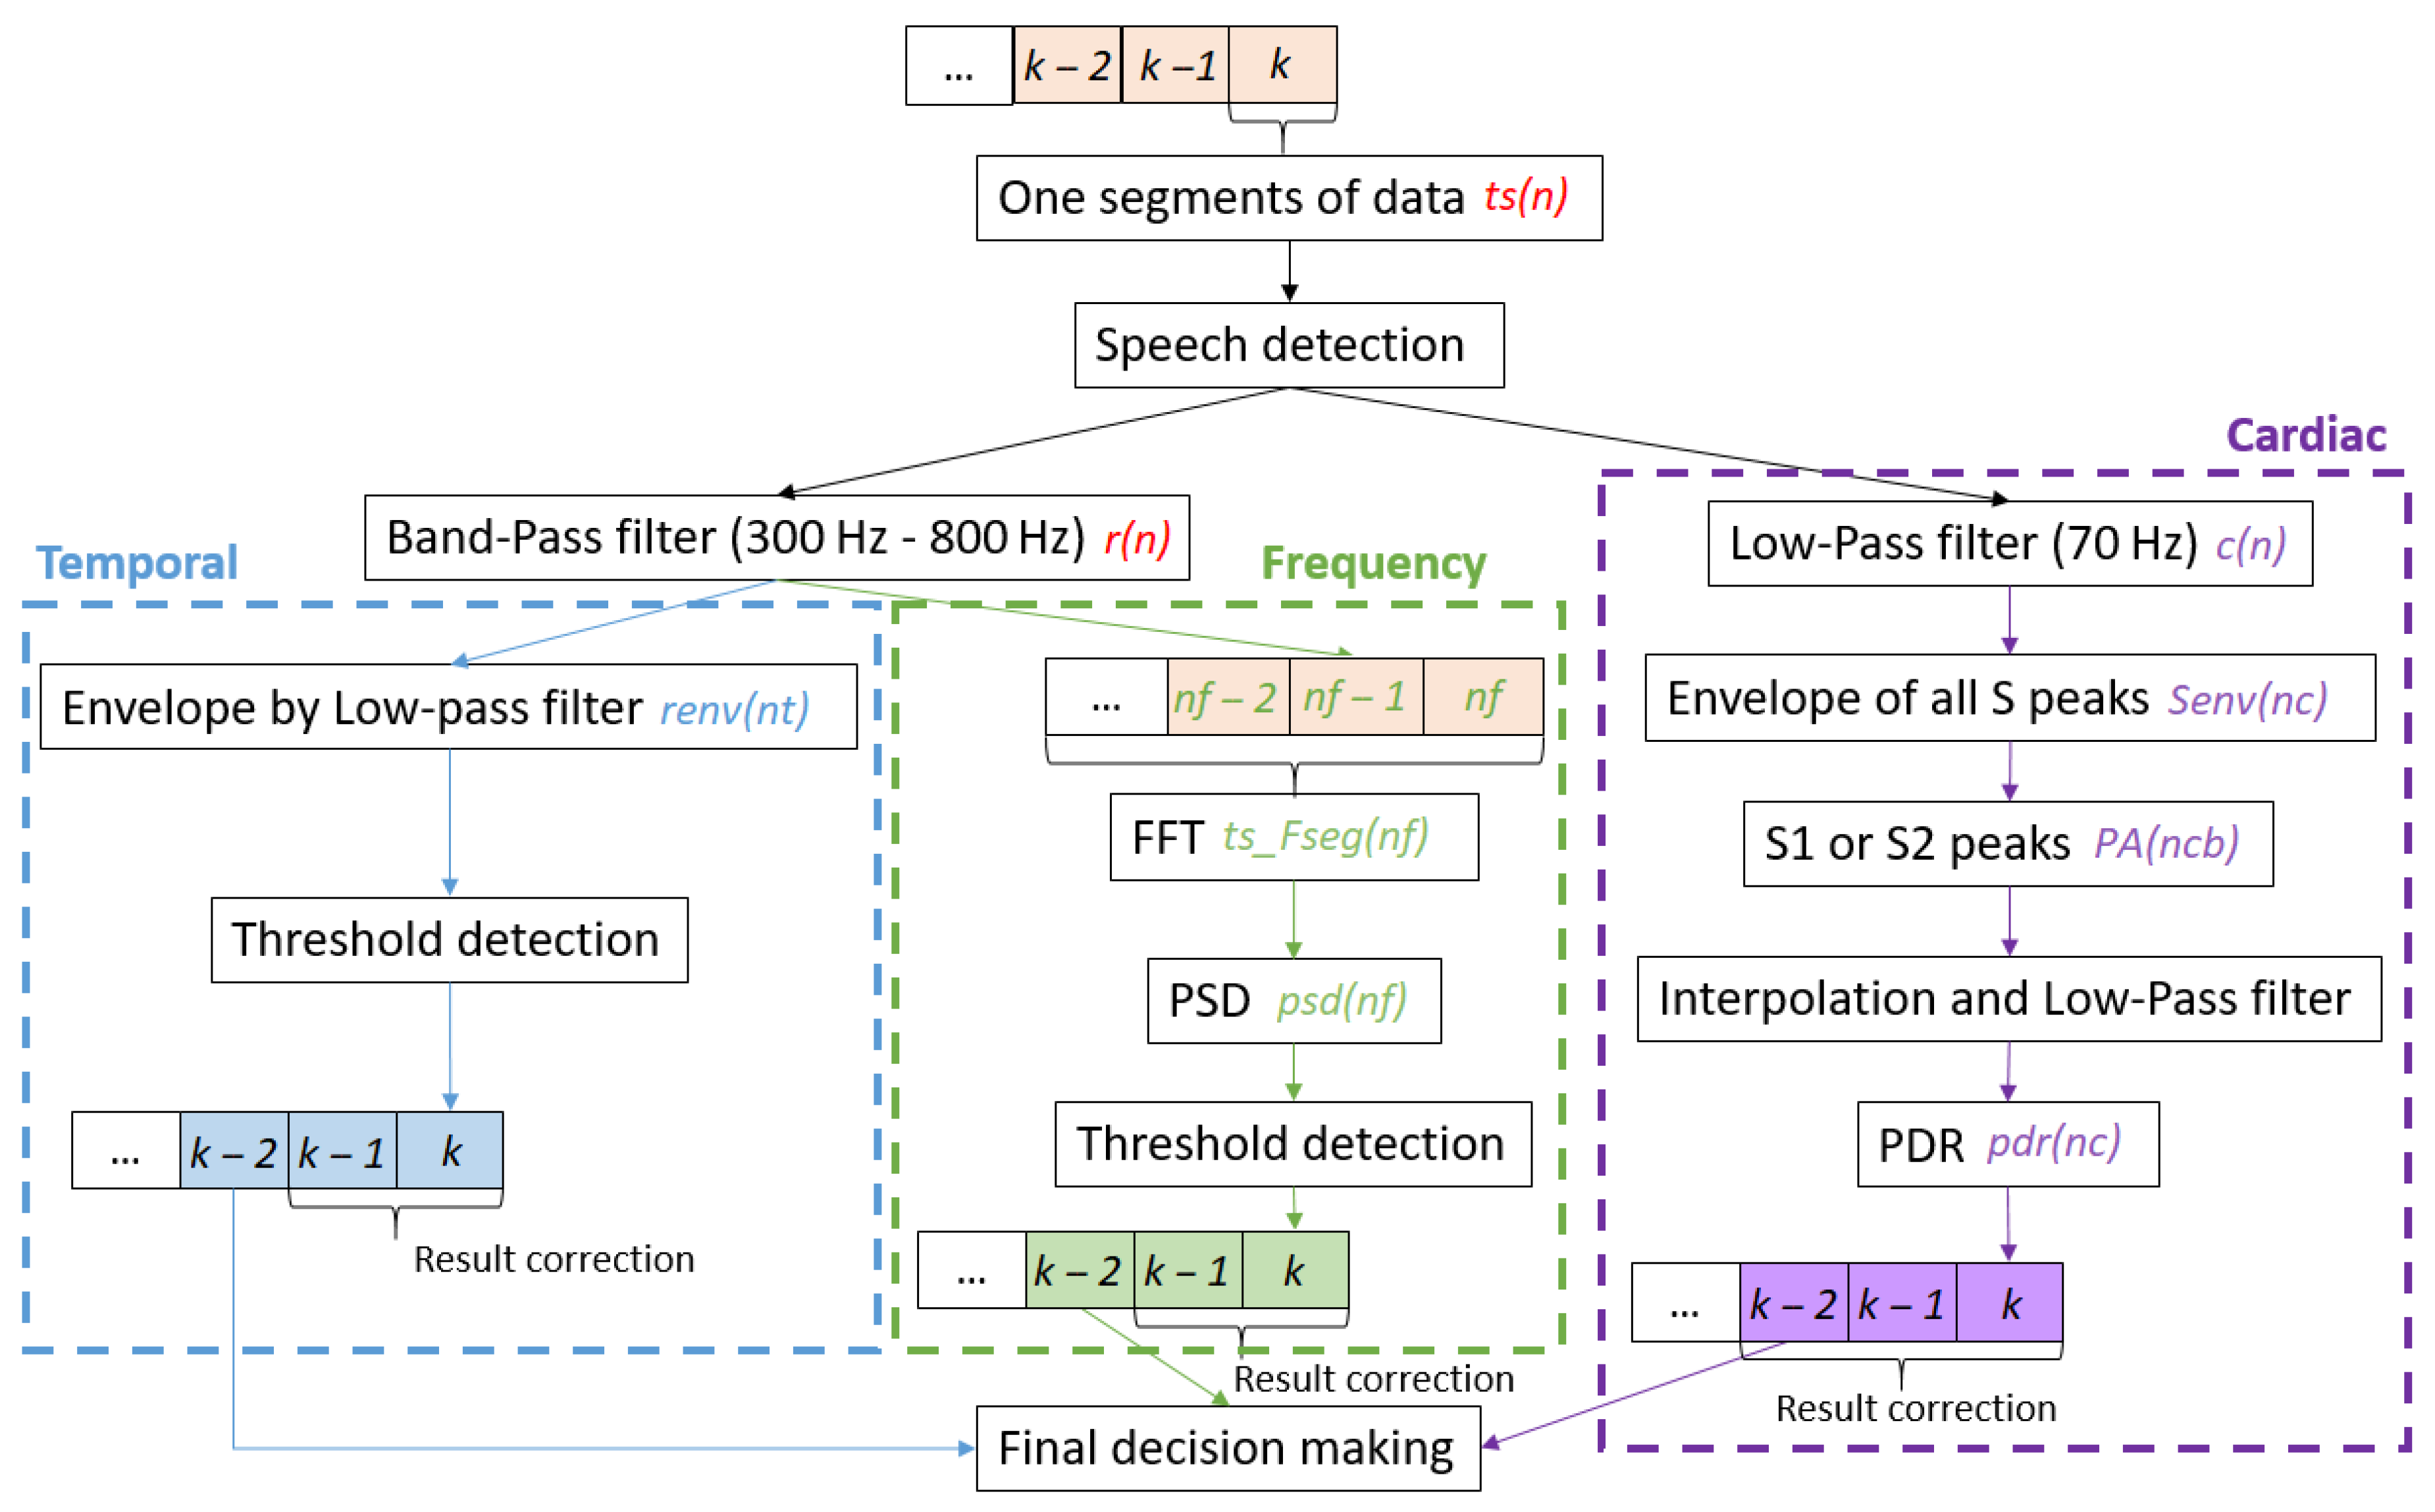
2.3. Algorithm
2.3.1. Speech Detection
2.3.2. Frequency Band Separation
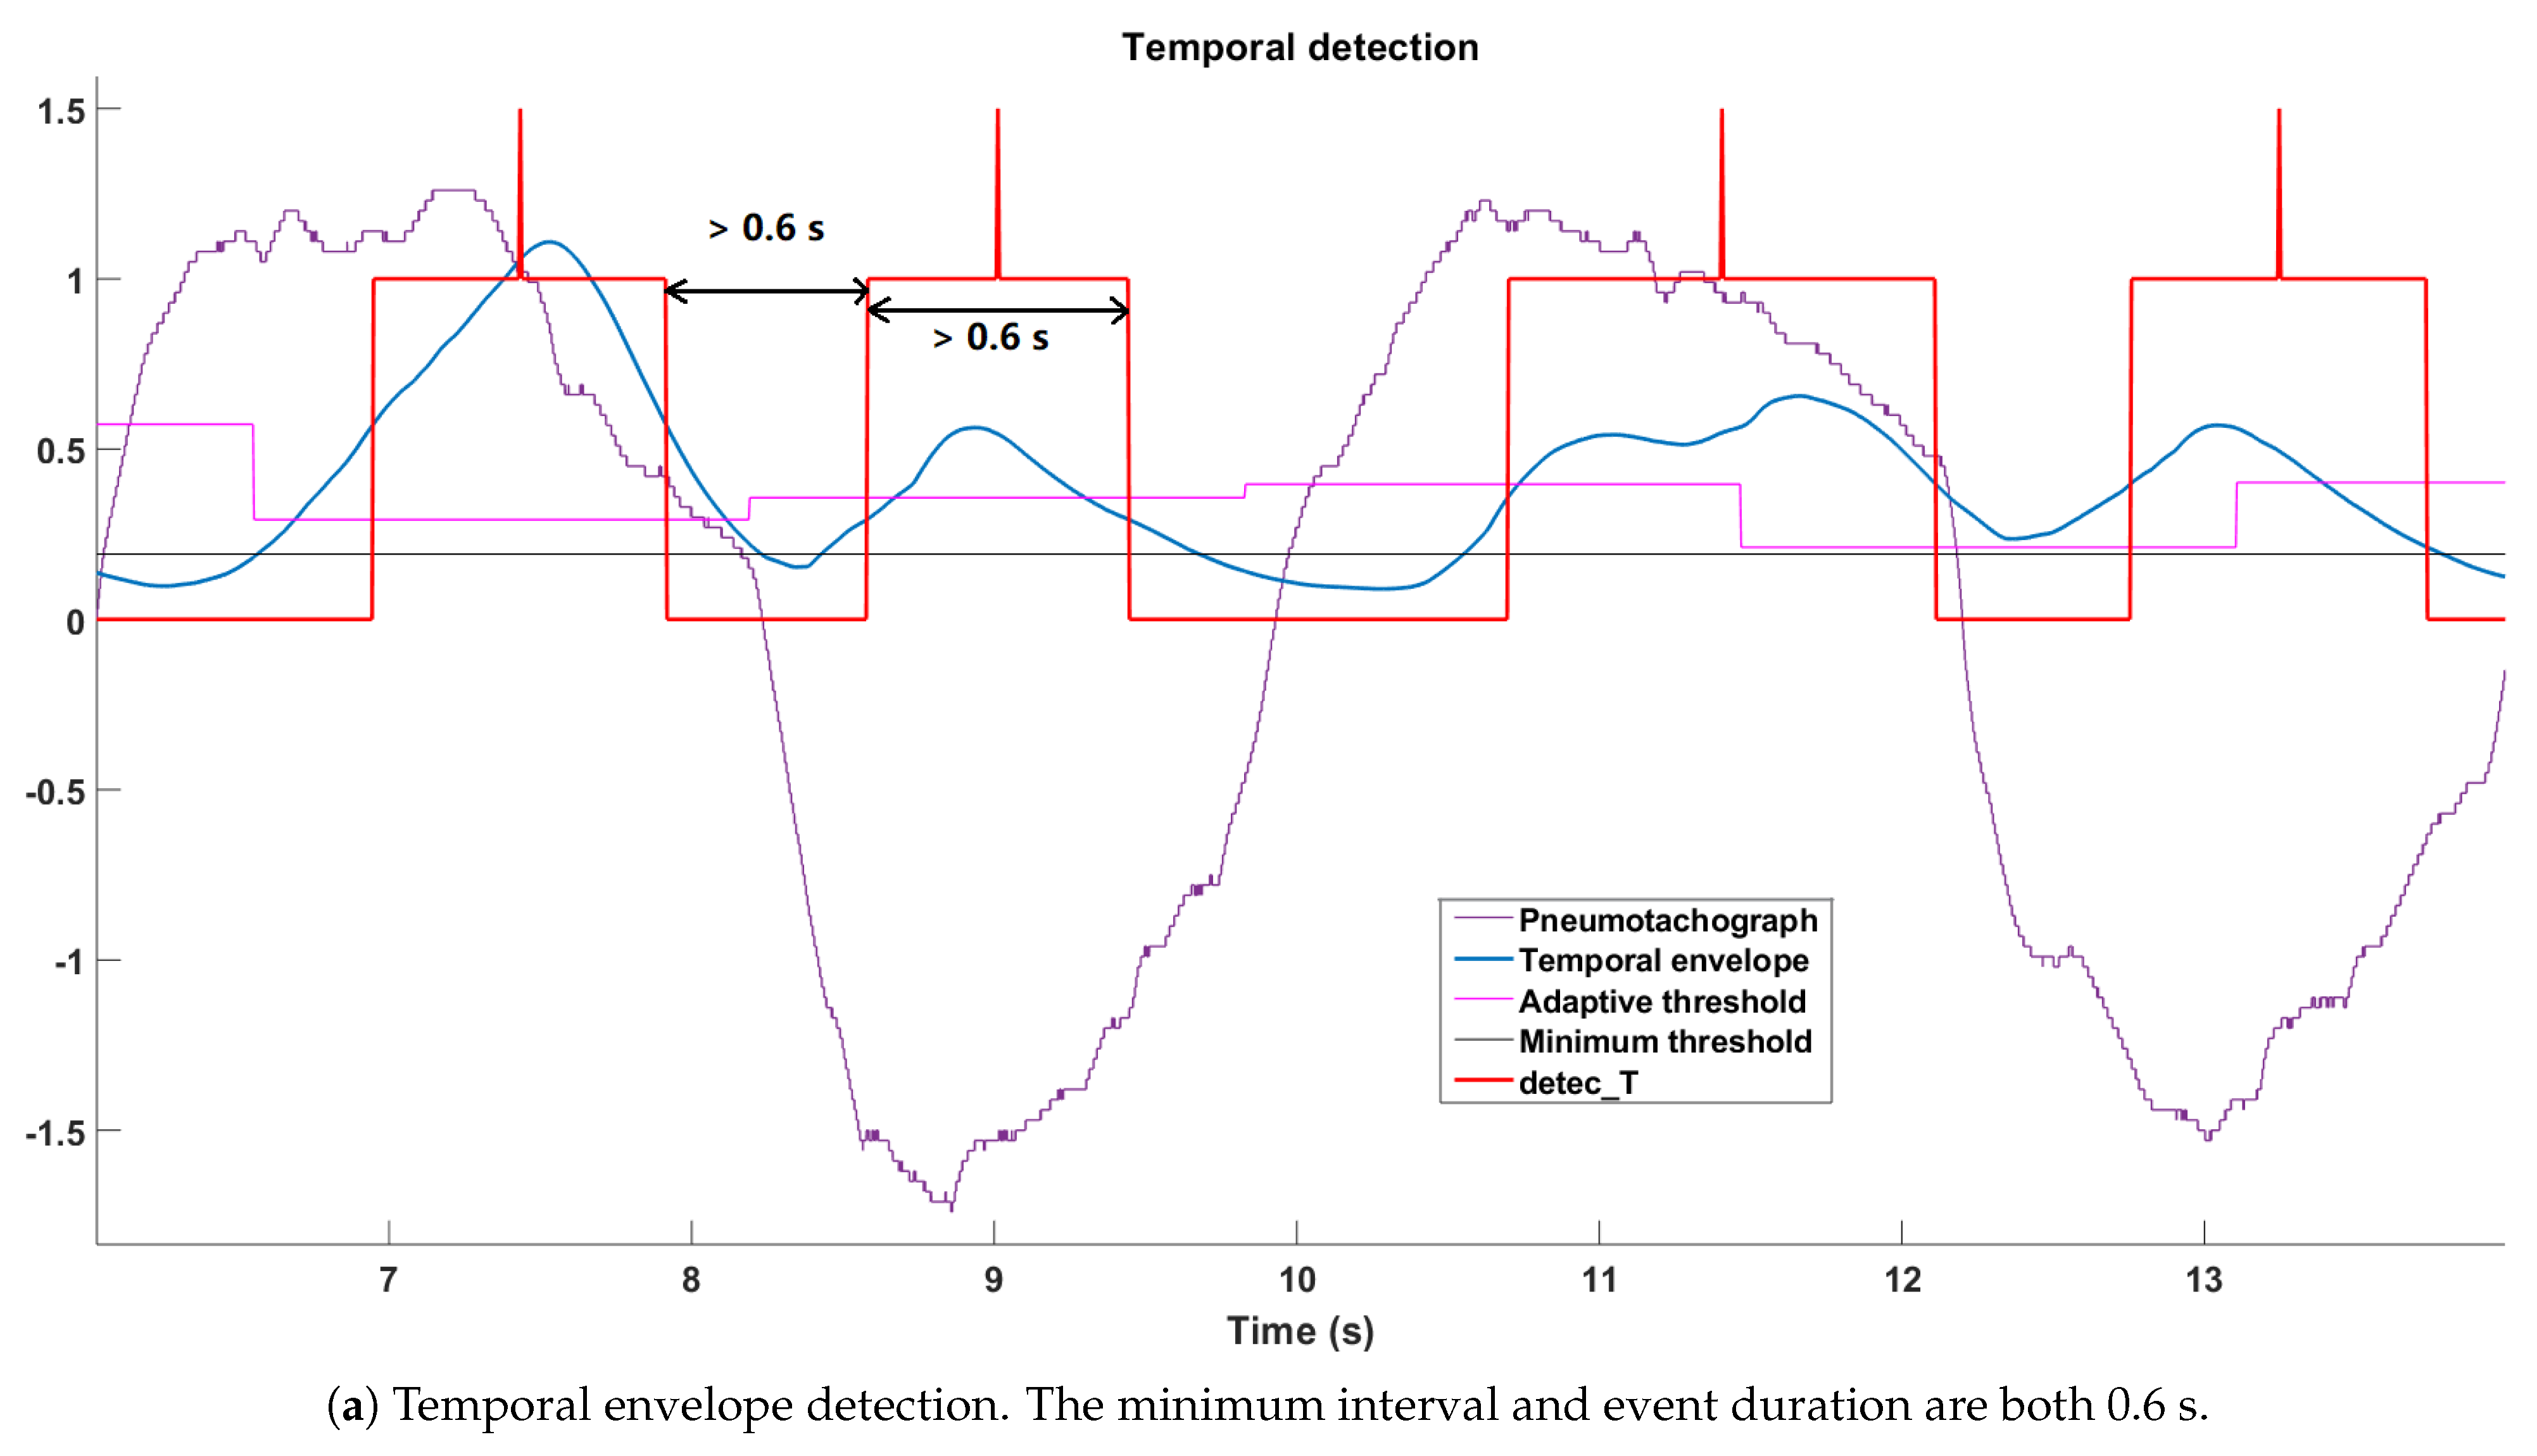
2.3.3. Temporal Envelope Detection
- The minimum threshold:where the is within any 3 s of apnea in the same recording;
- The adaptive threshold:
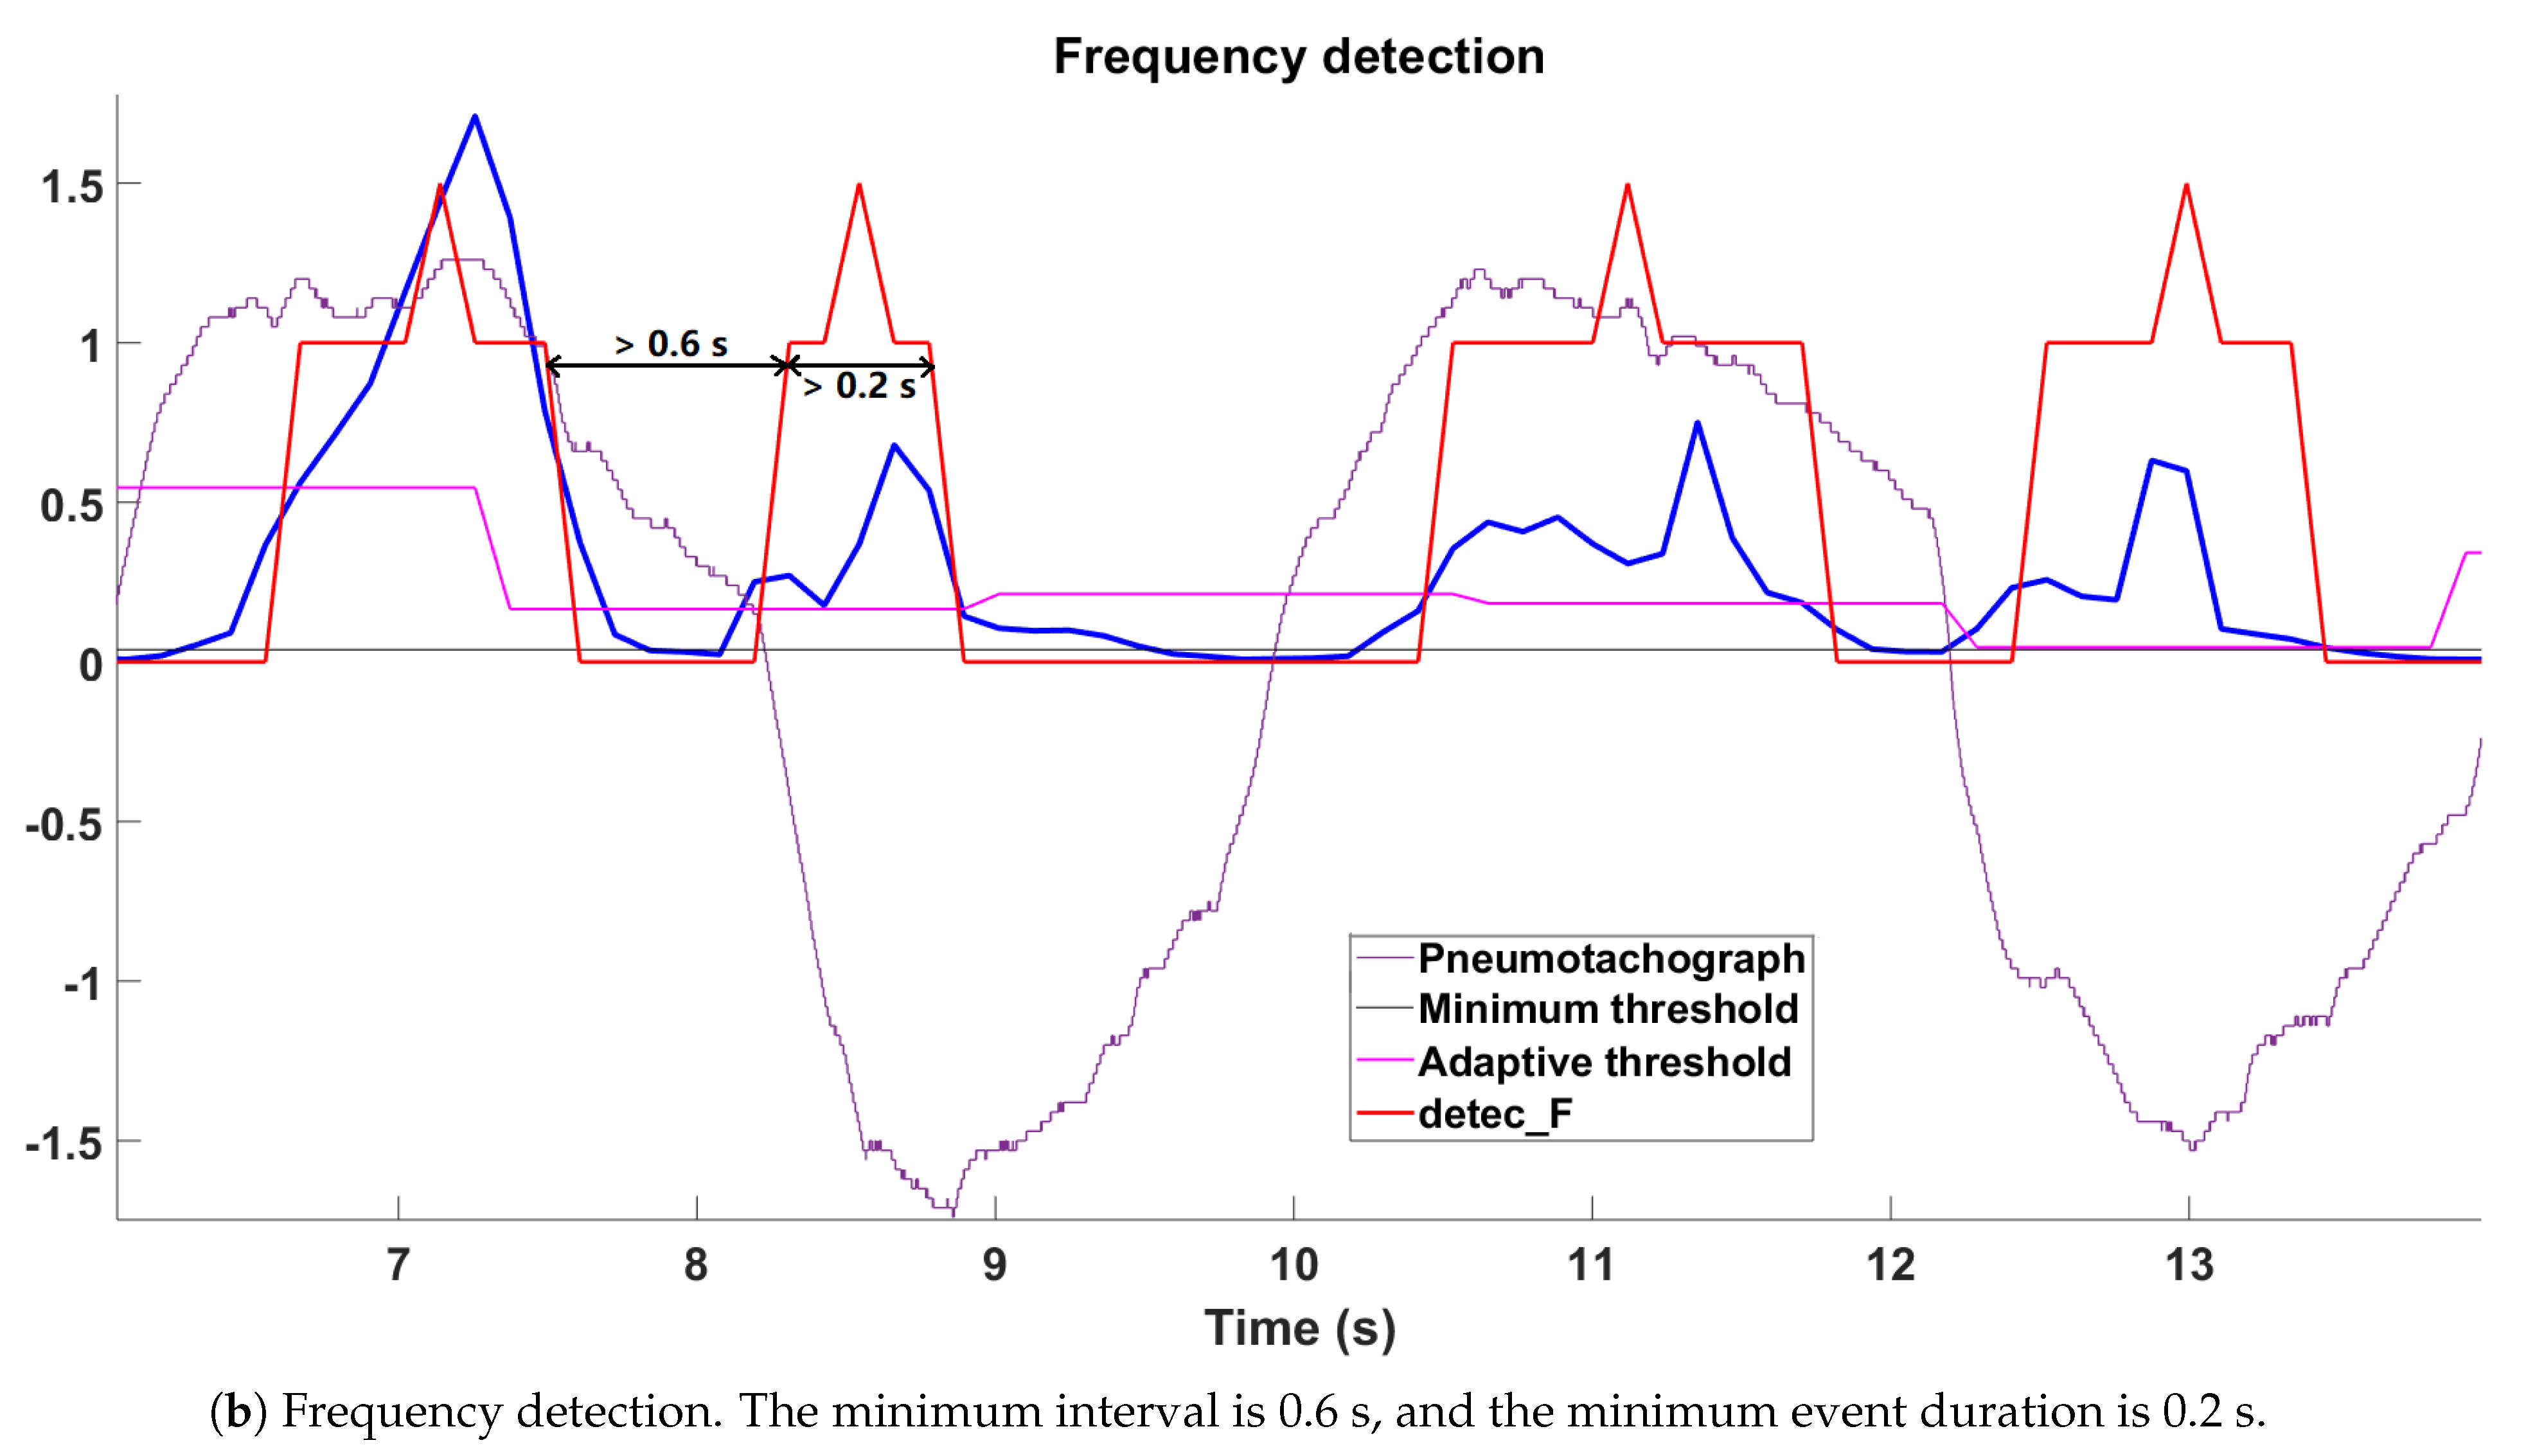
2.3.4. Frequency Detection
- The minimum threshold:where the is within any 3 s of apnea;
- The adaptive threshold:where is the number of segments per bin, which equals 15.
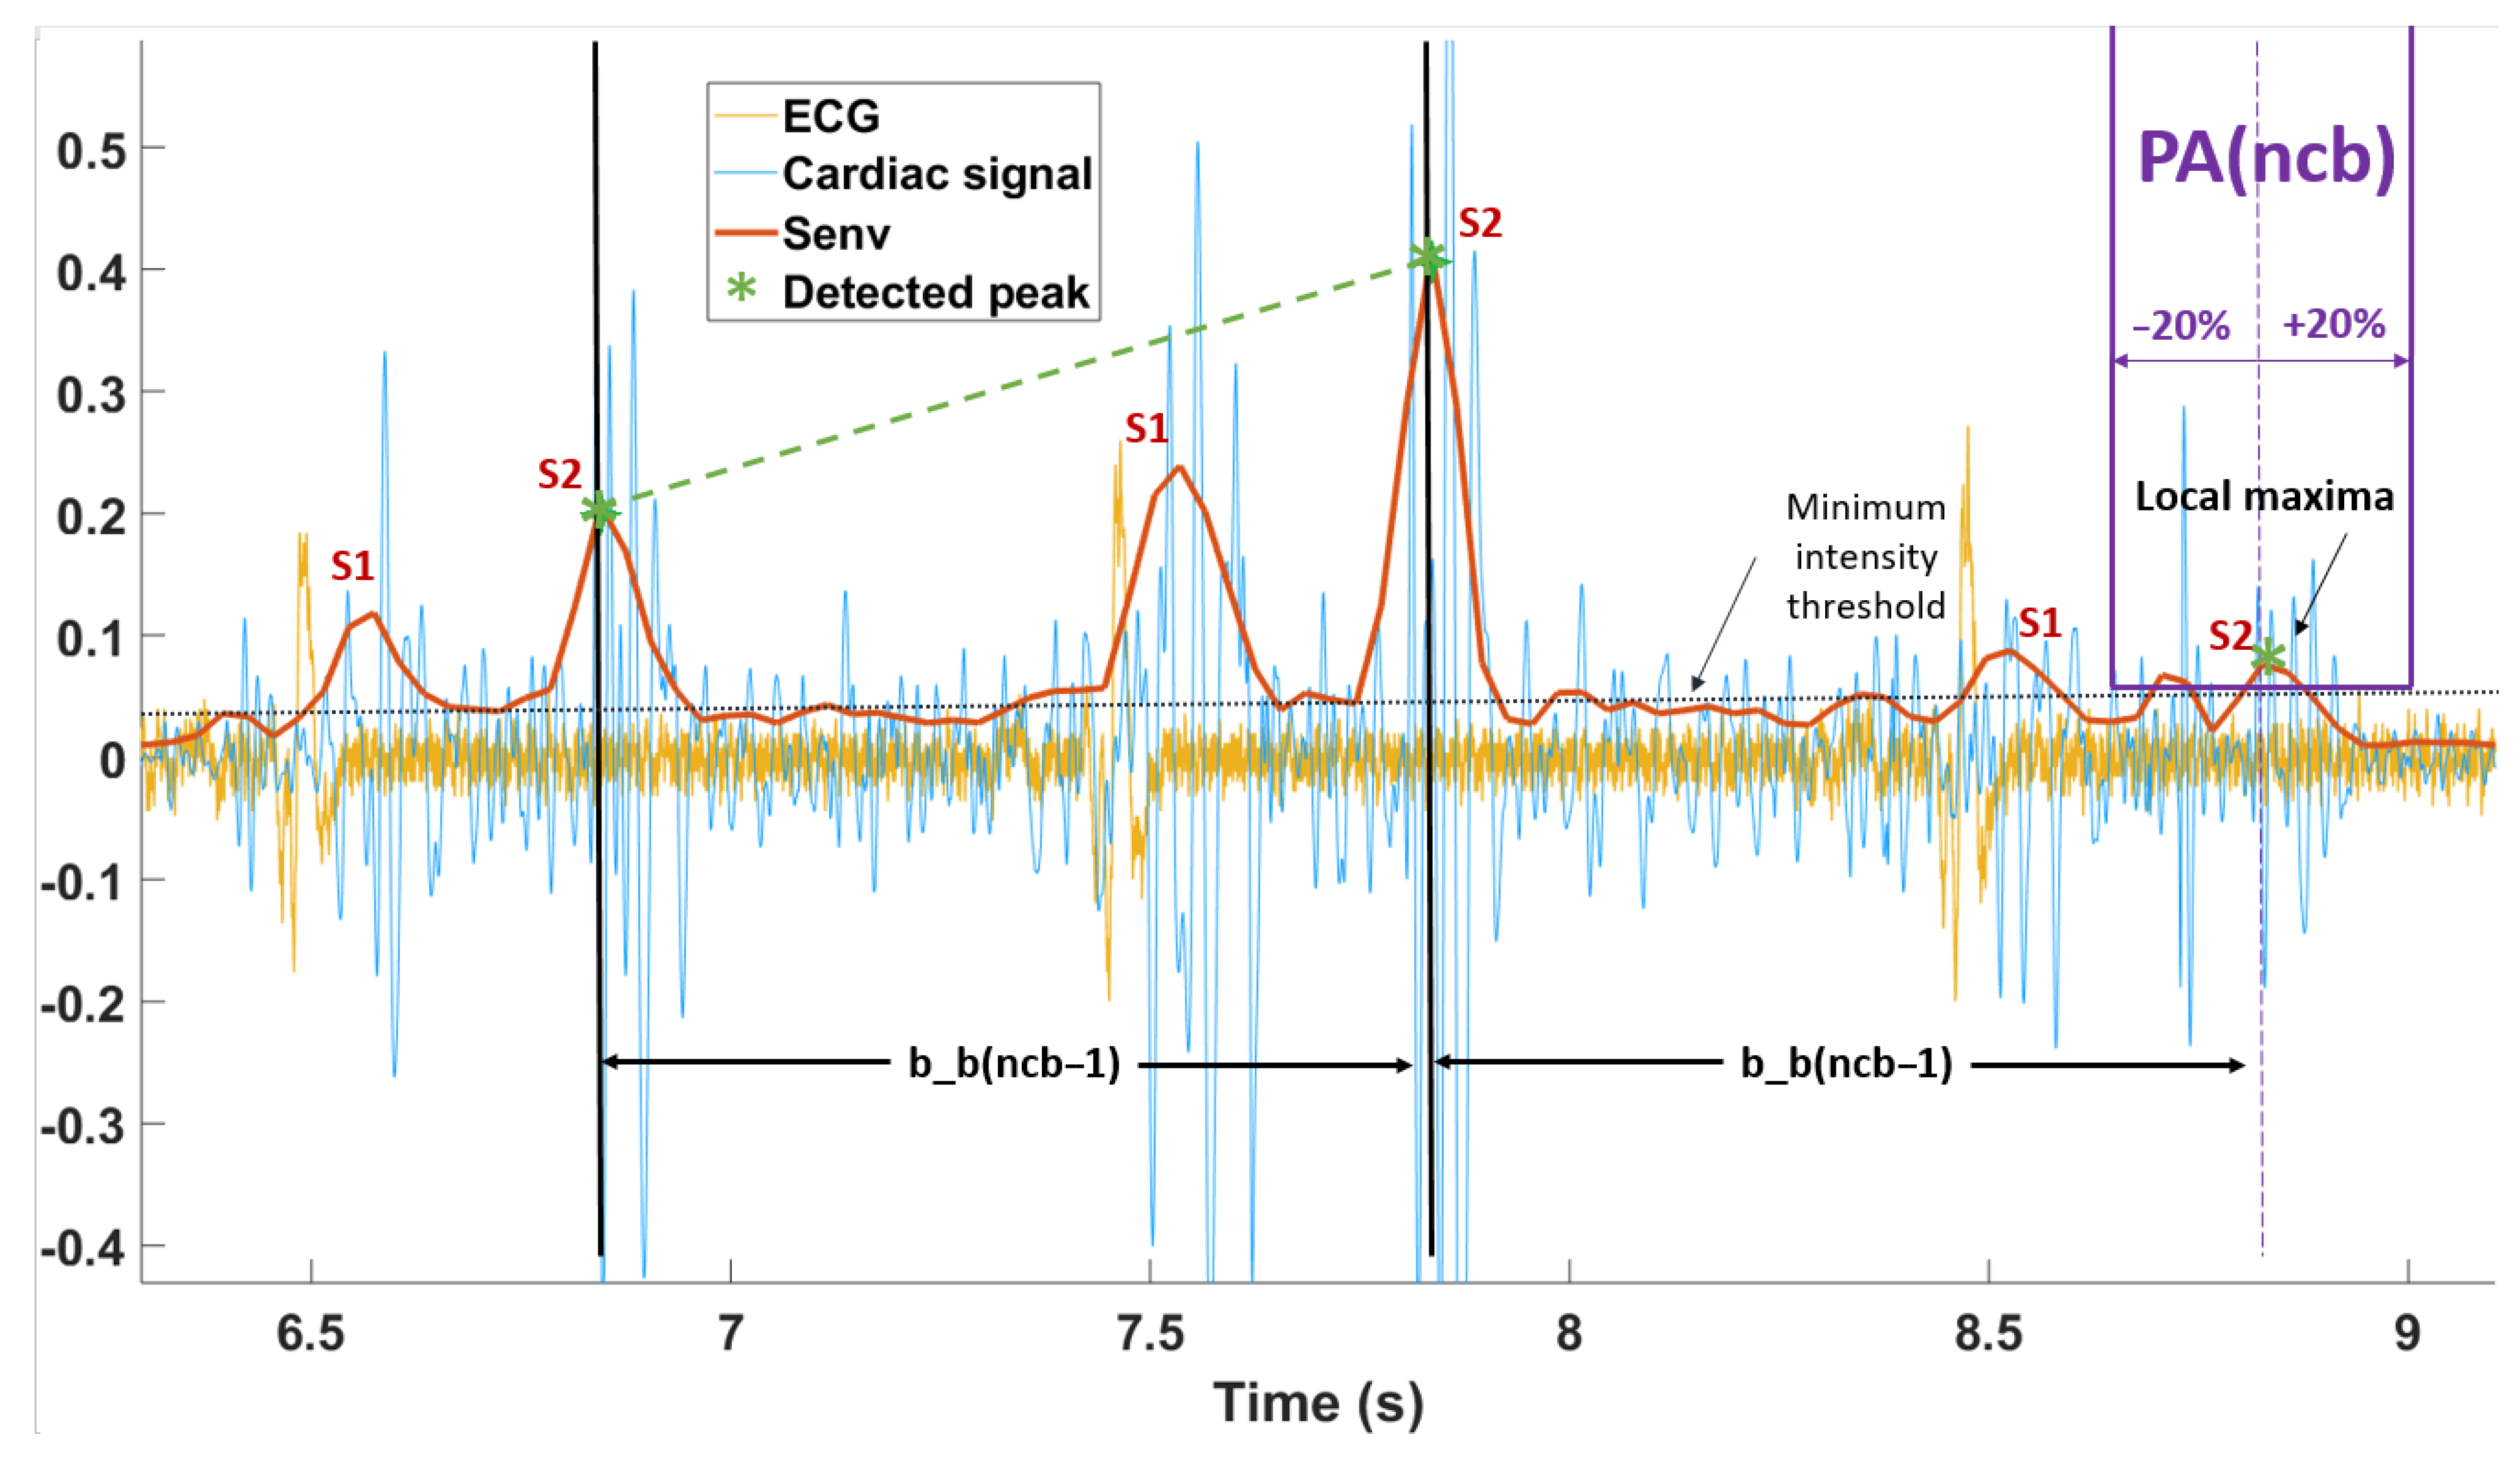
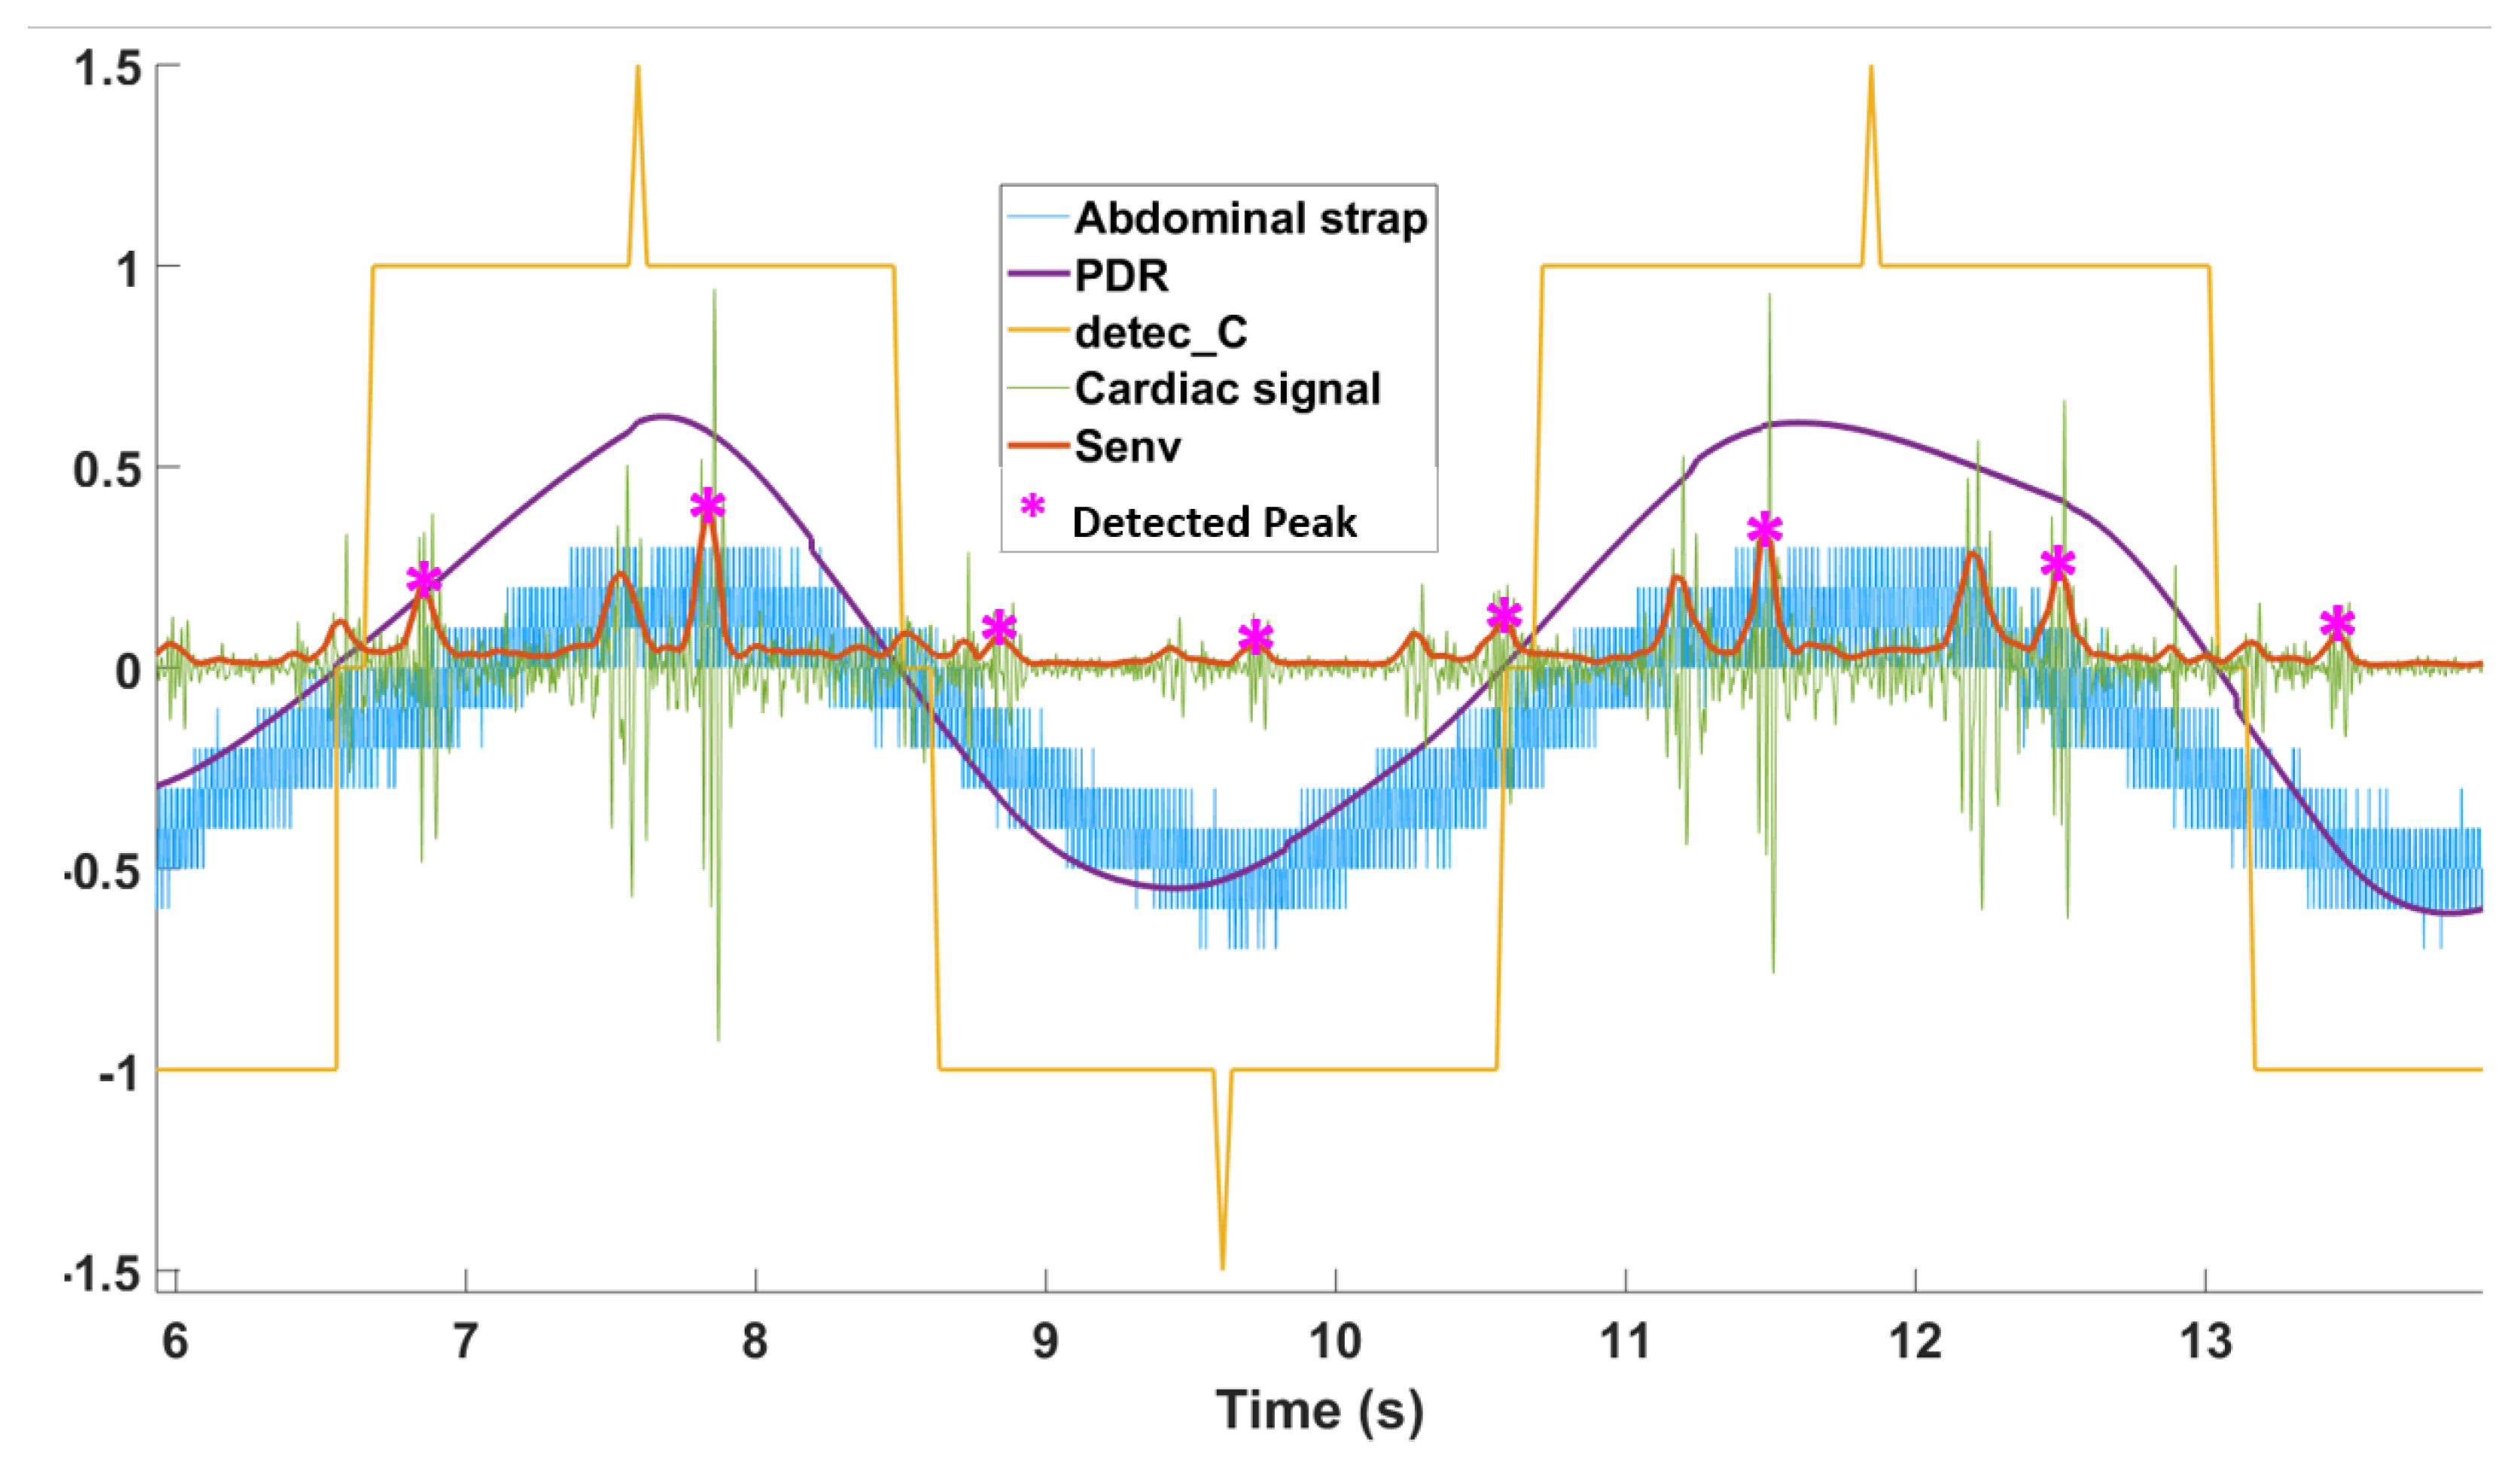
2.3.5. PDR Detection
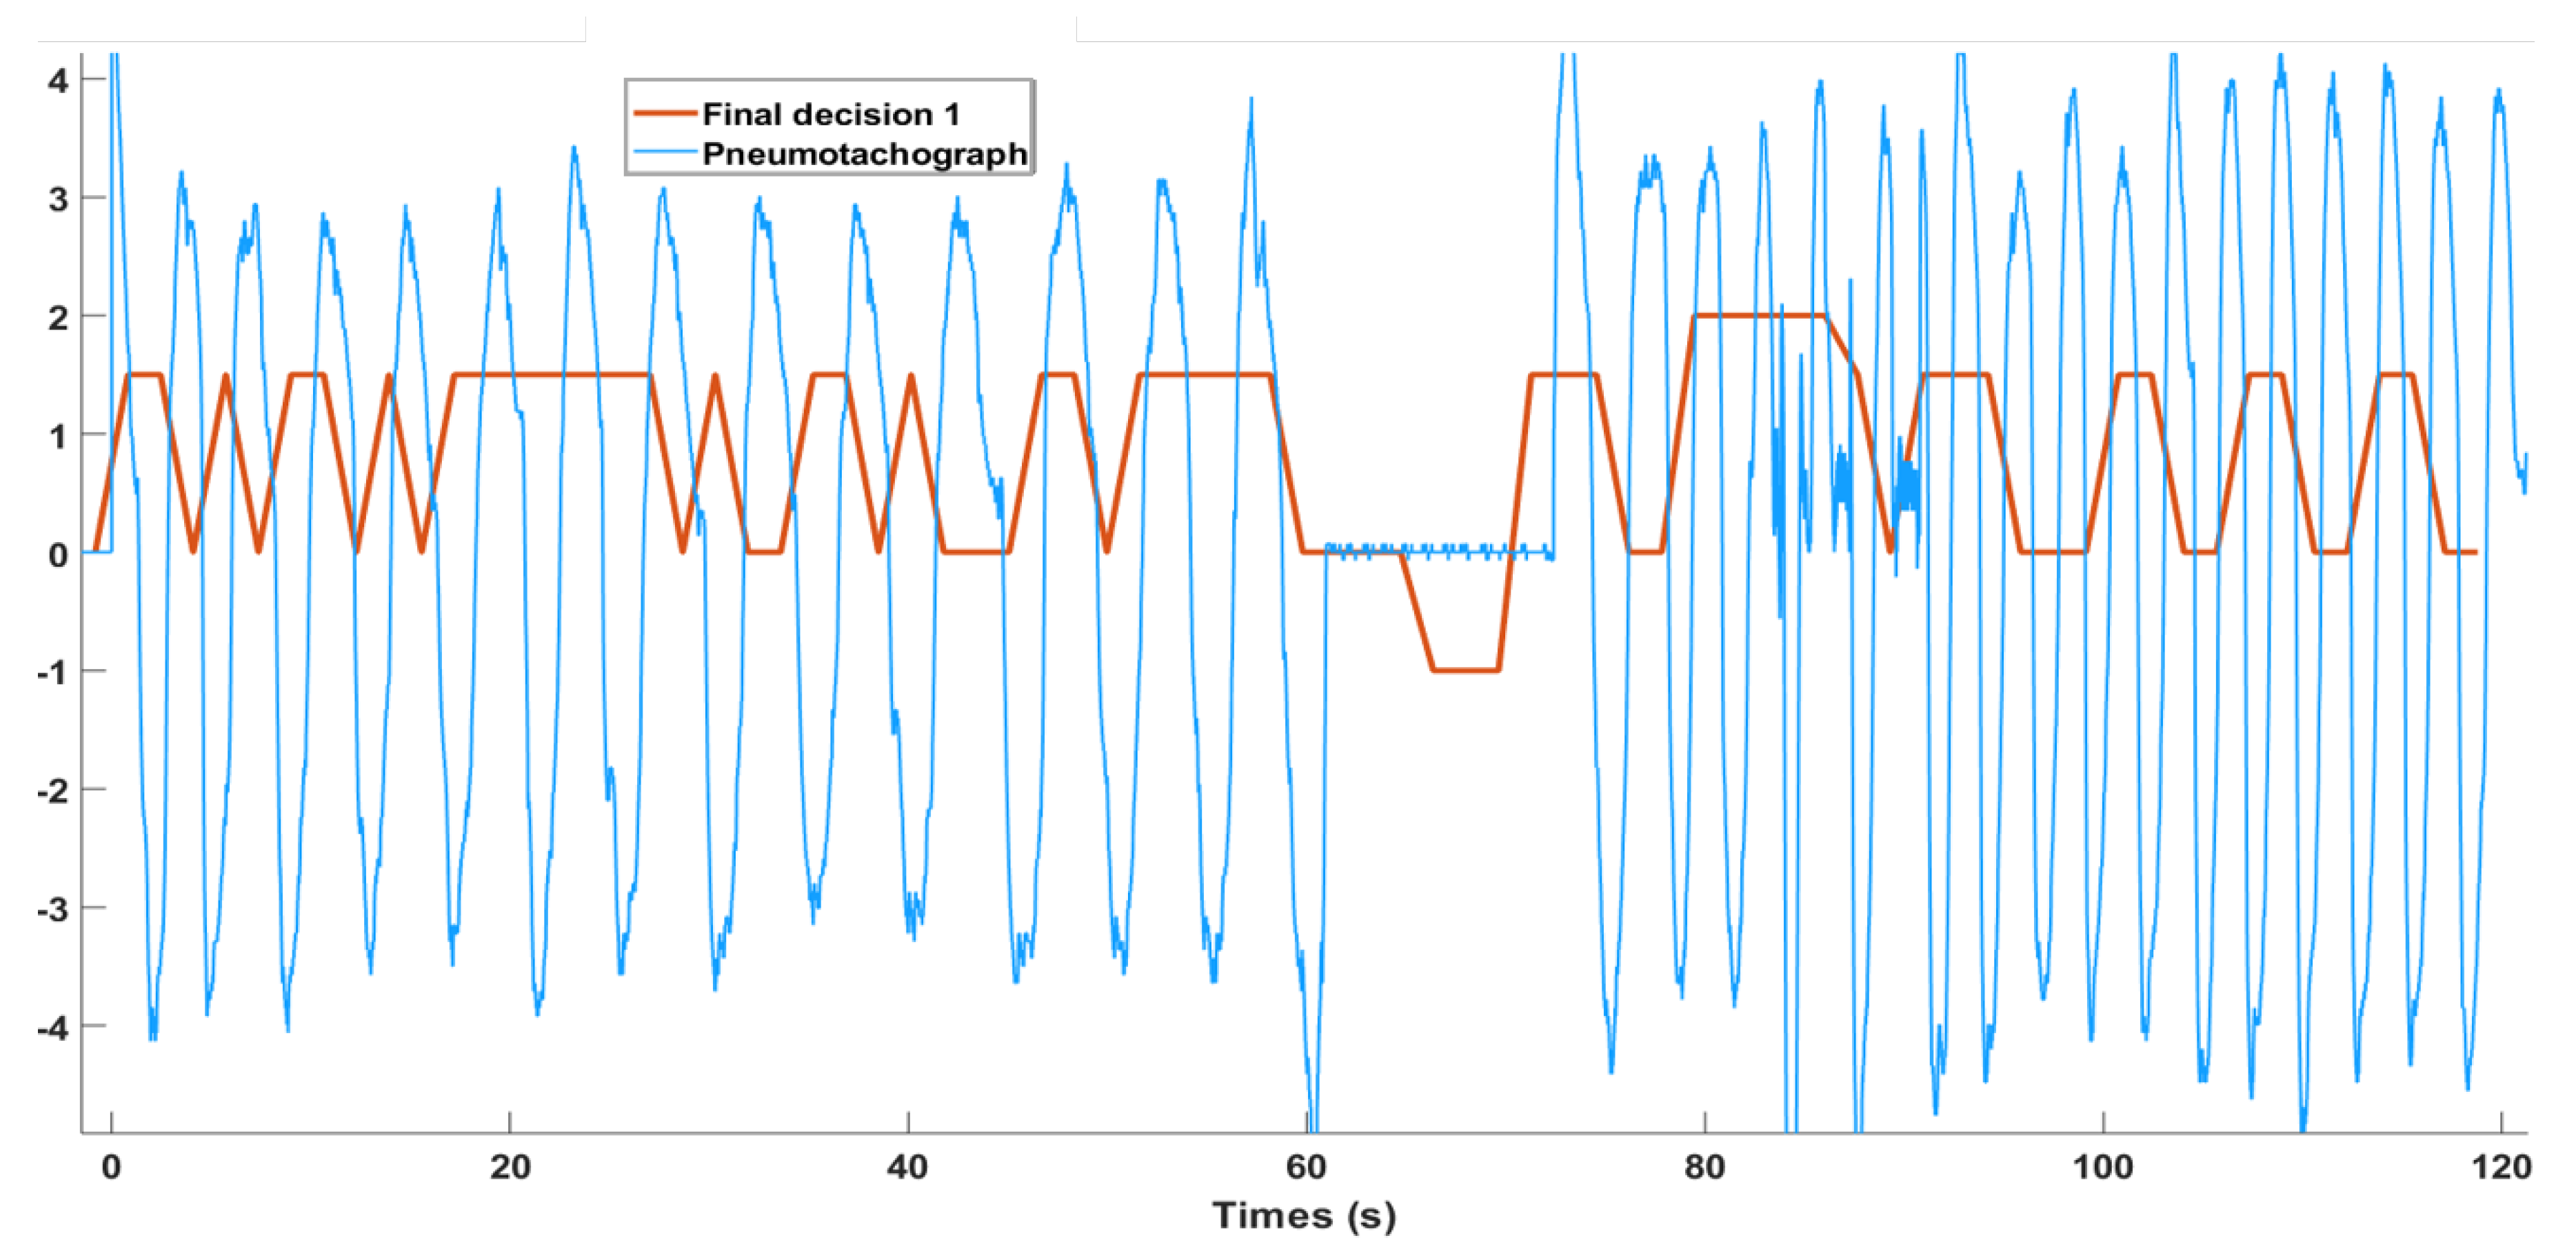
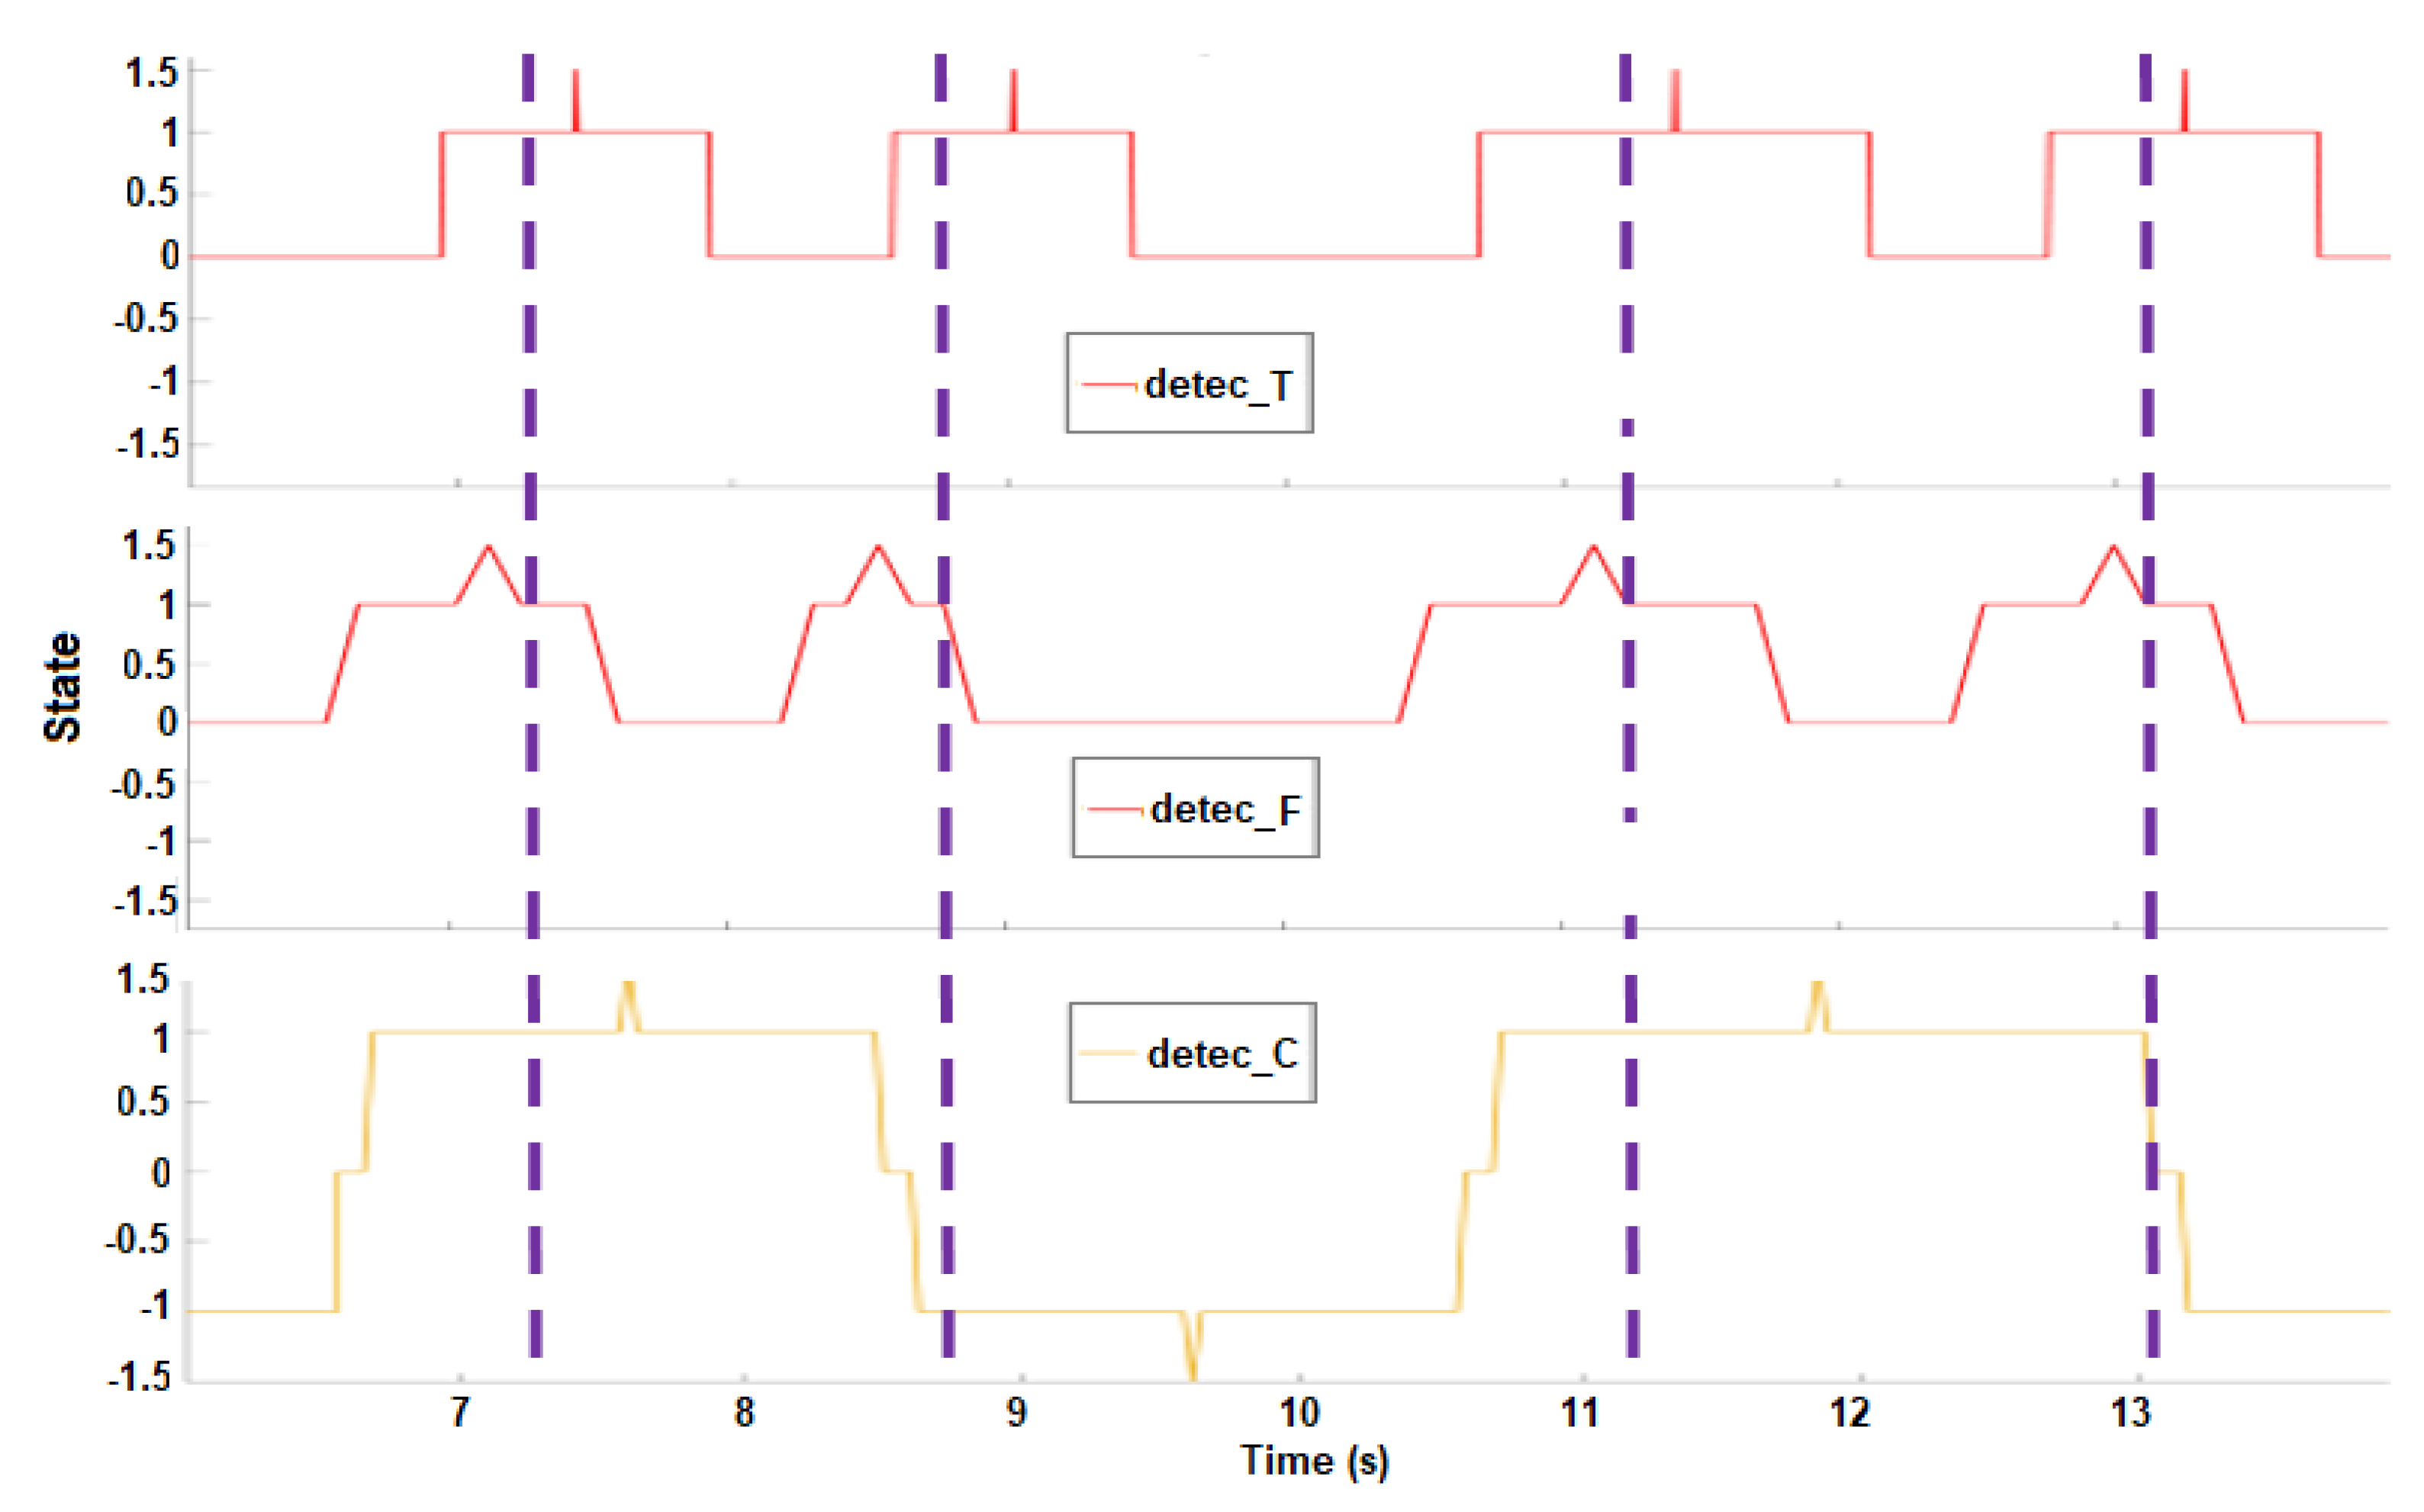
2.3.6. Decision-Making
Apnea Detection
Breathing Activities Assessment
Statistics
3. Results
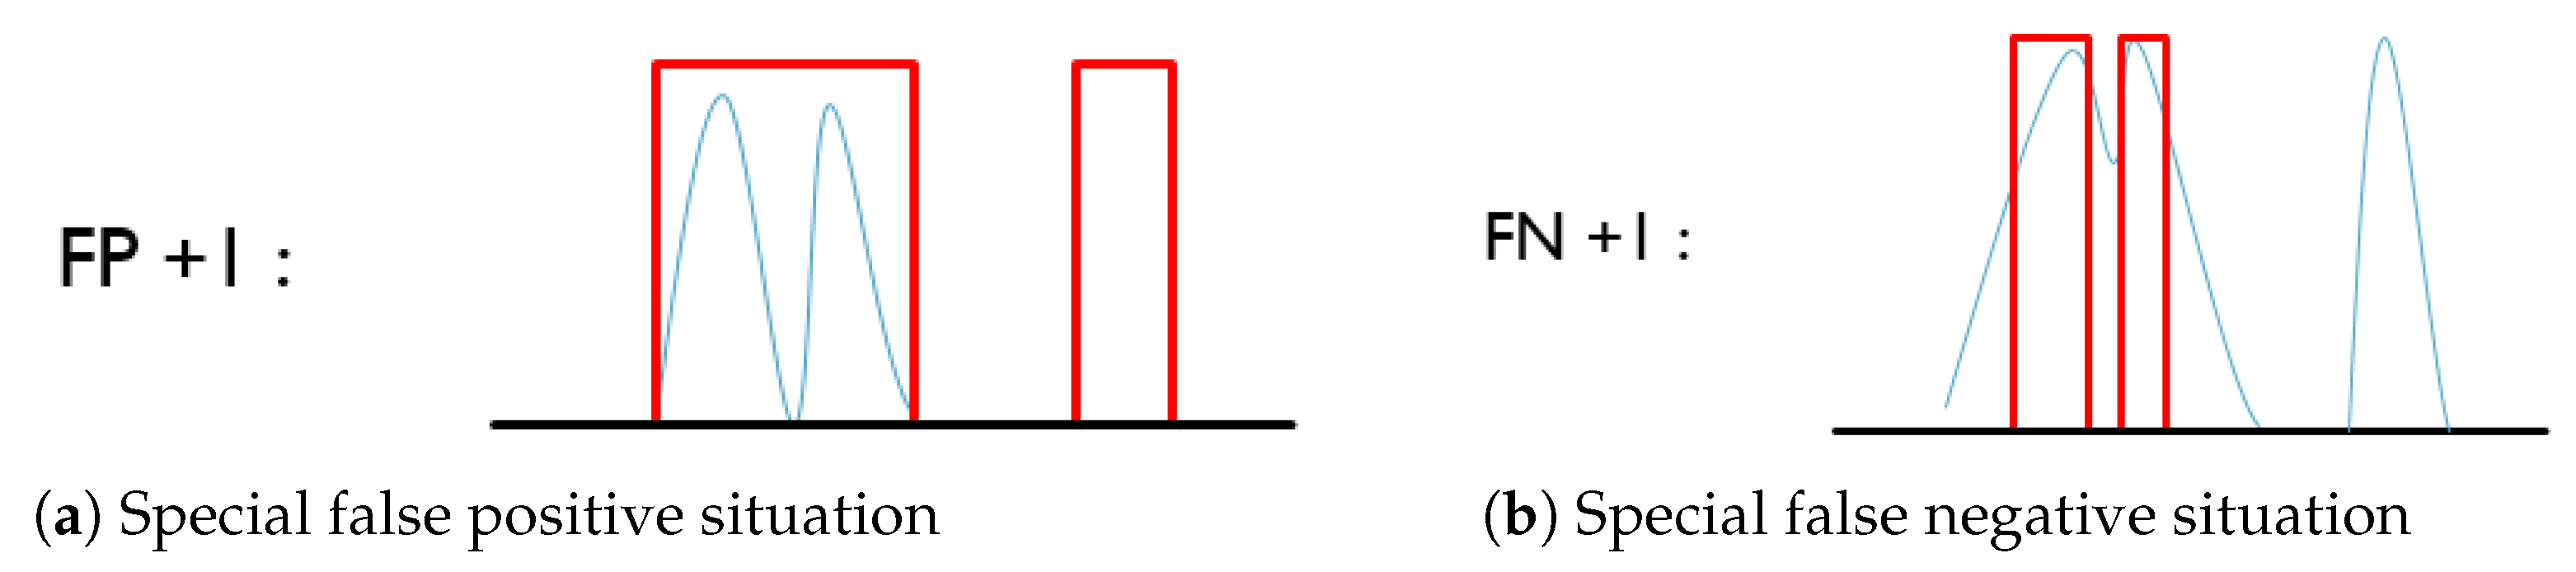
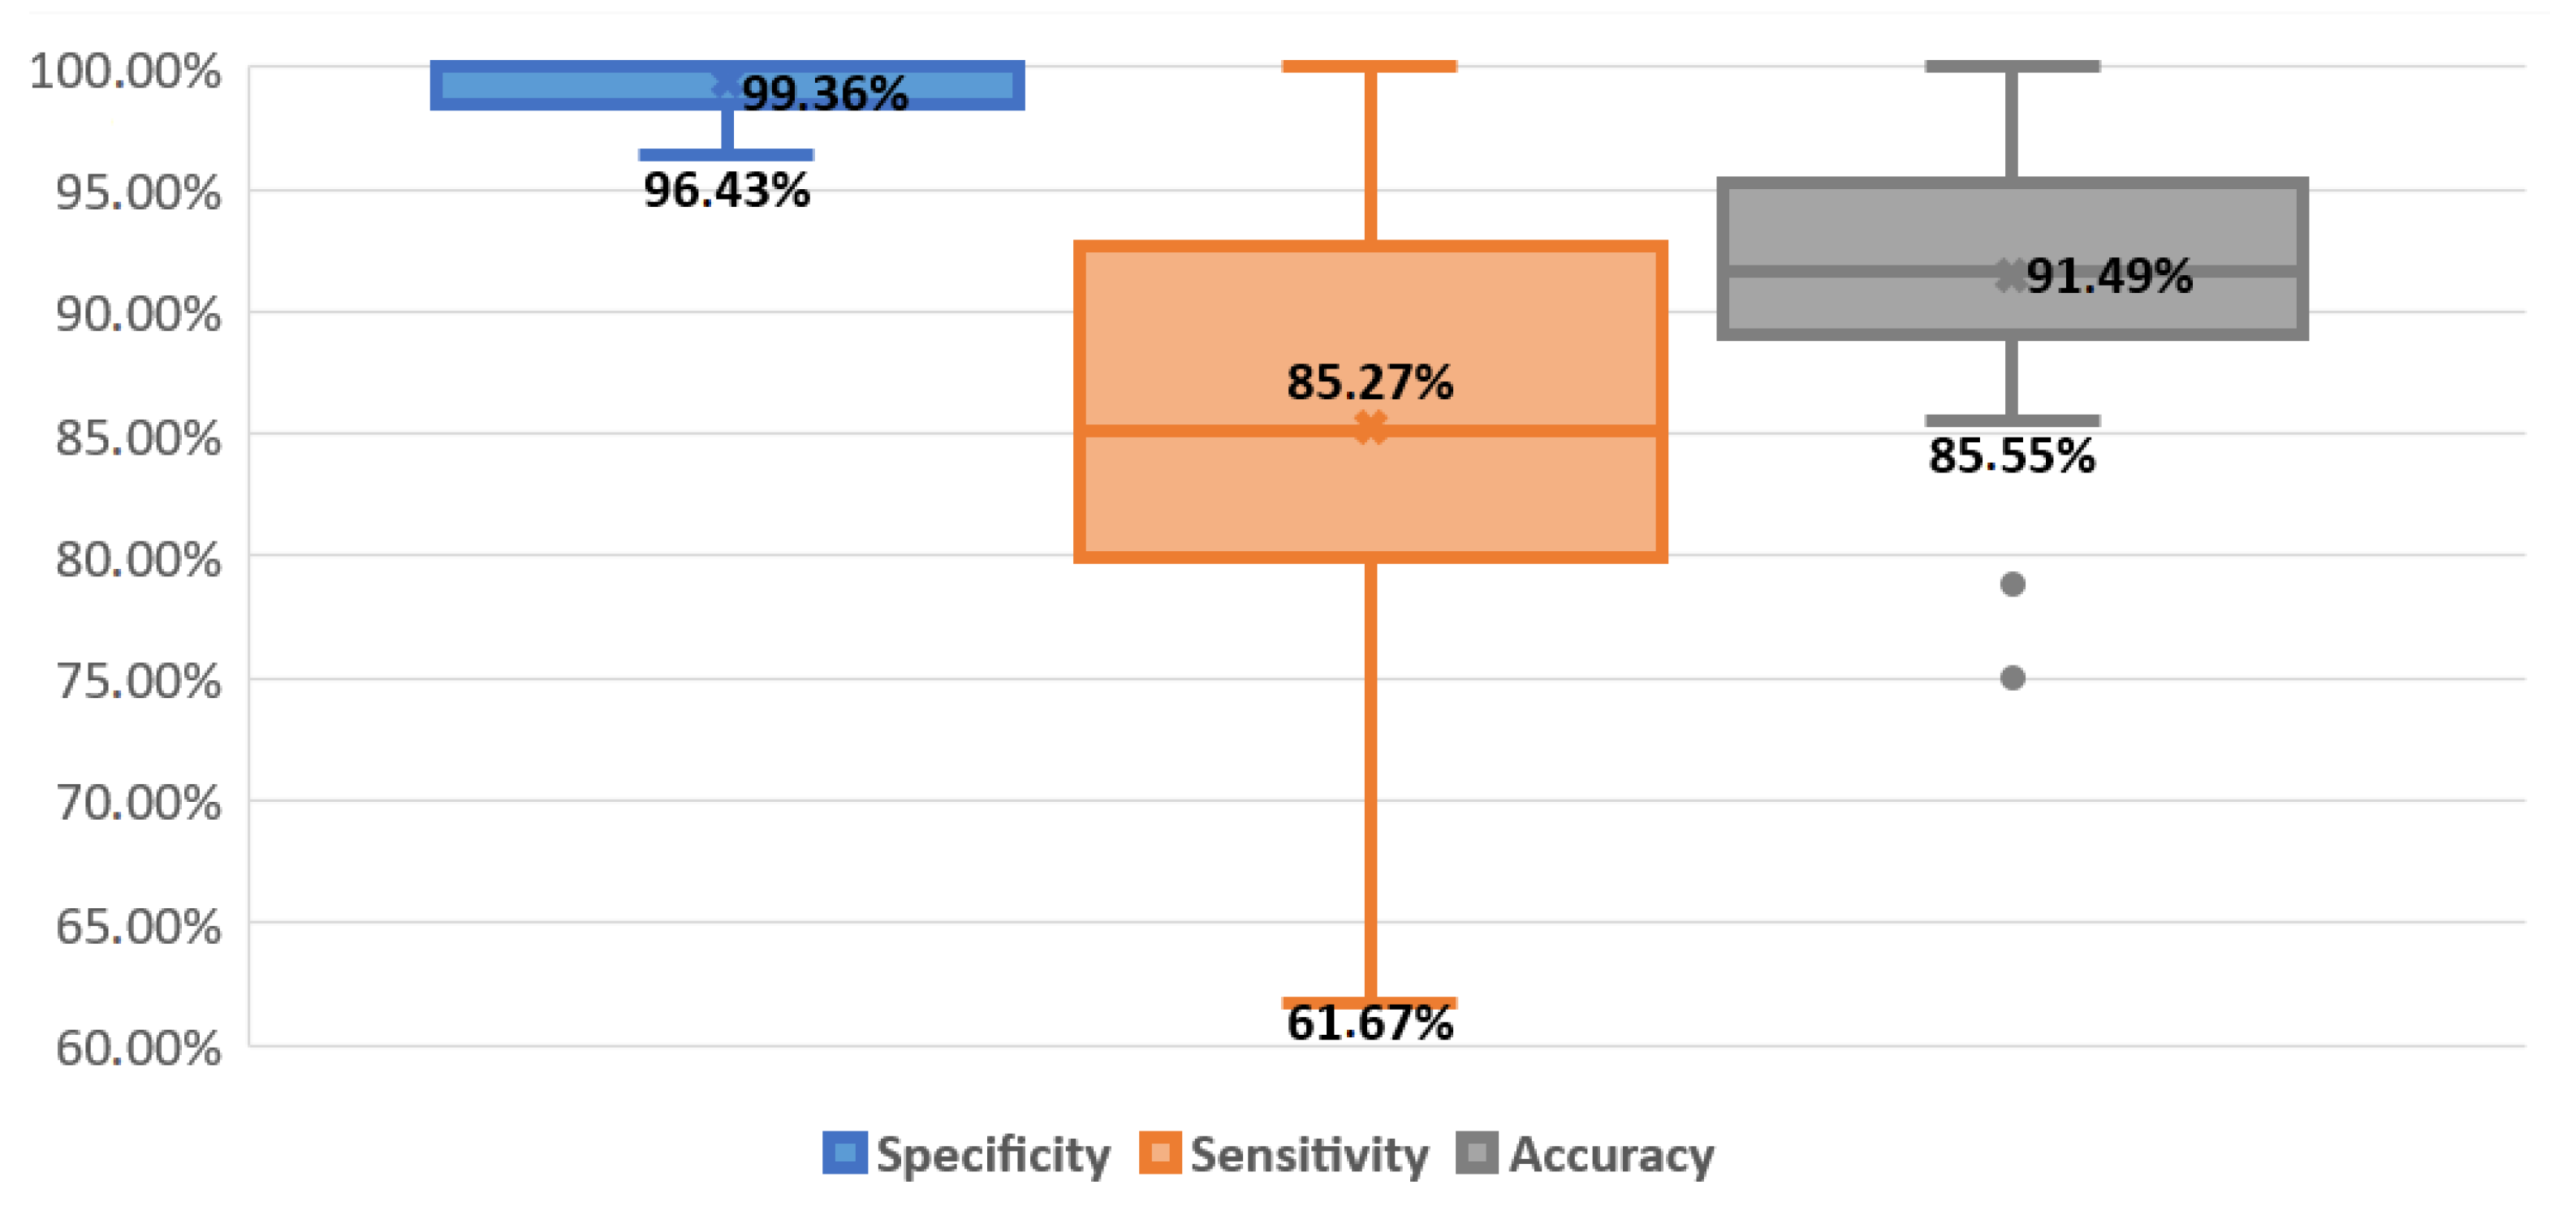
3.1. Evaluation Method
- the specificity of respiratory detection (breathing/apnea) from TS must be >82.9%.
- the accuracy of respiratory detection (breathing/apnea) from TS must be >90.5%.
3.2. Apnea Detection
3.3. Breathing Activities Assessment
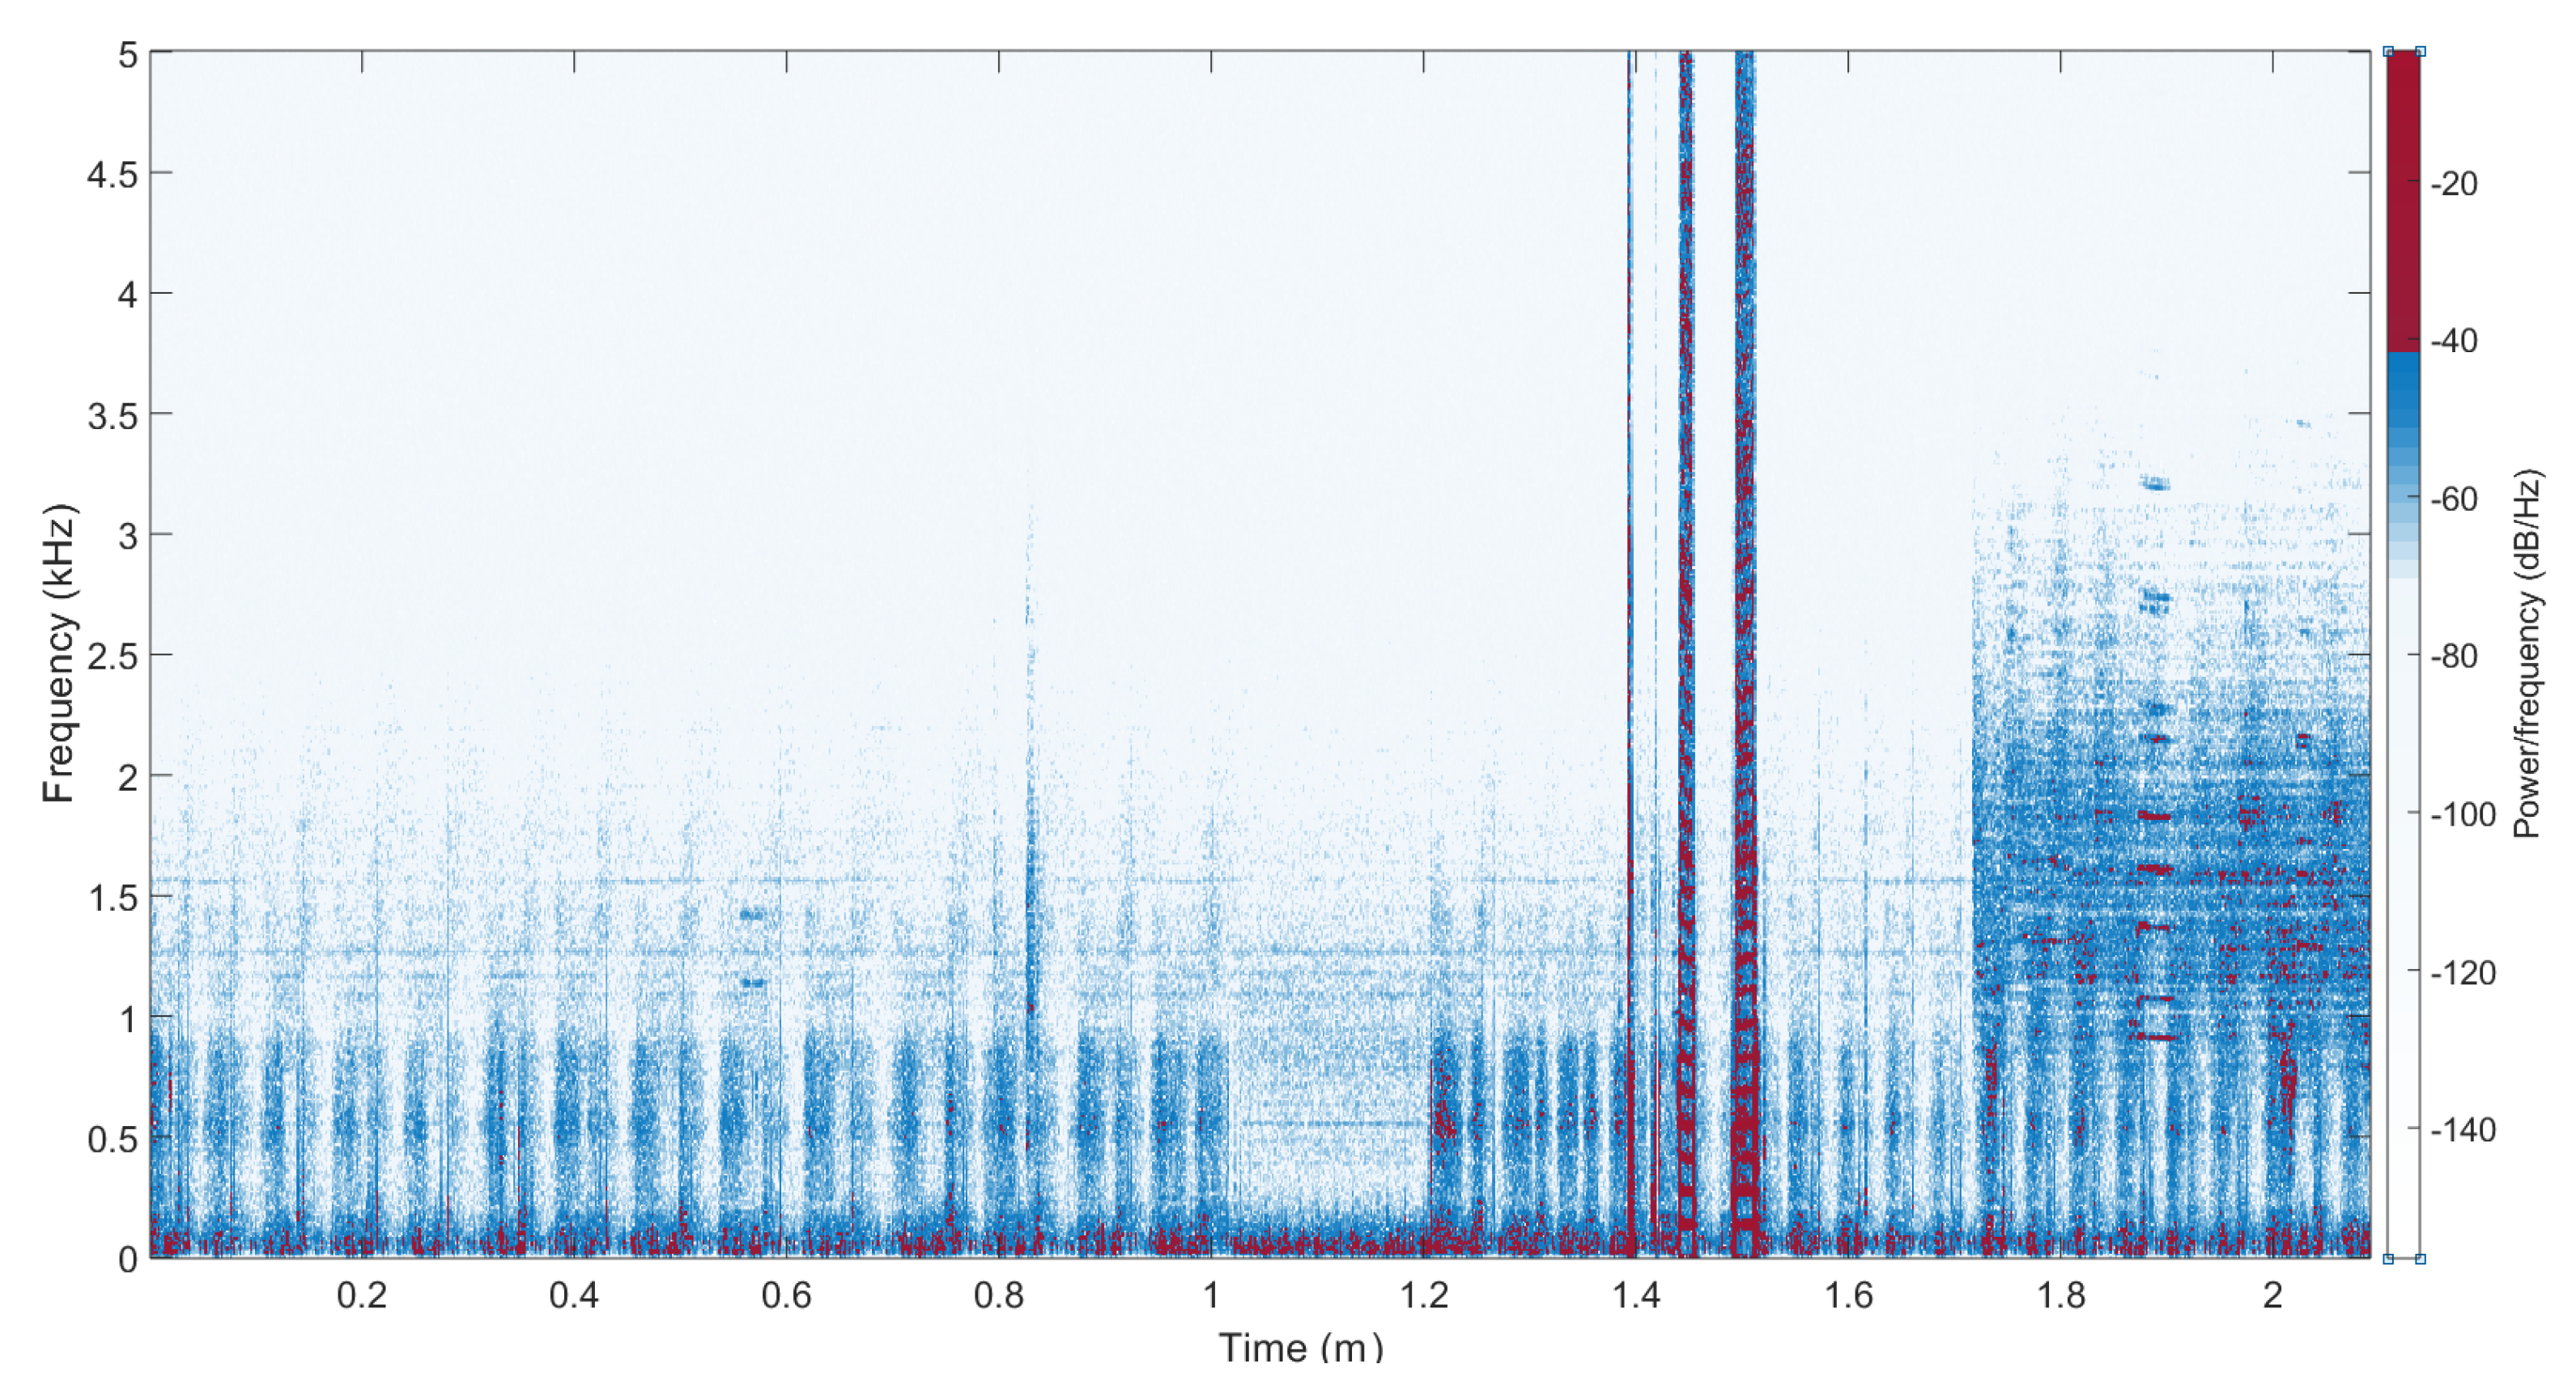
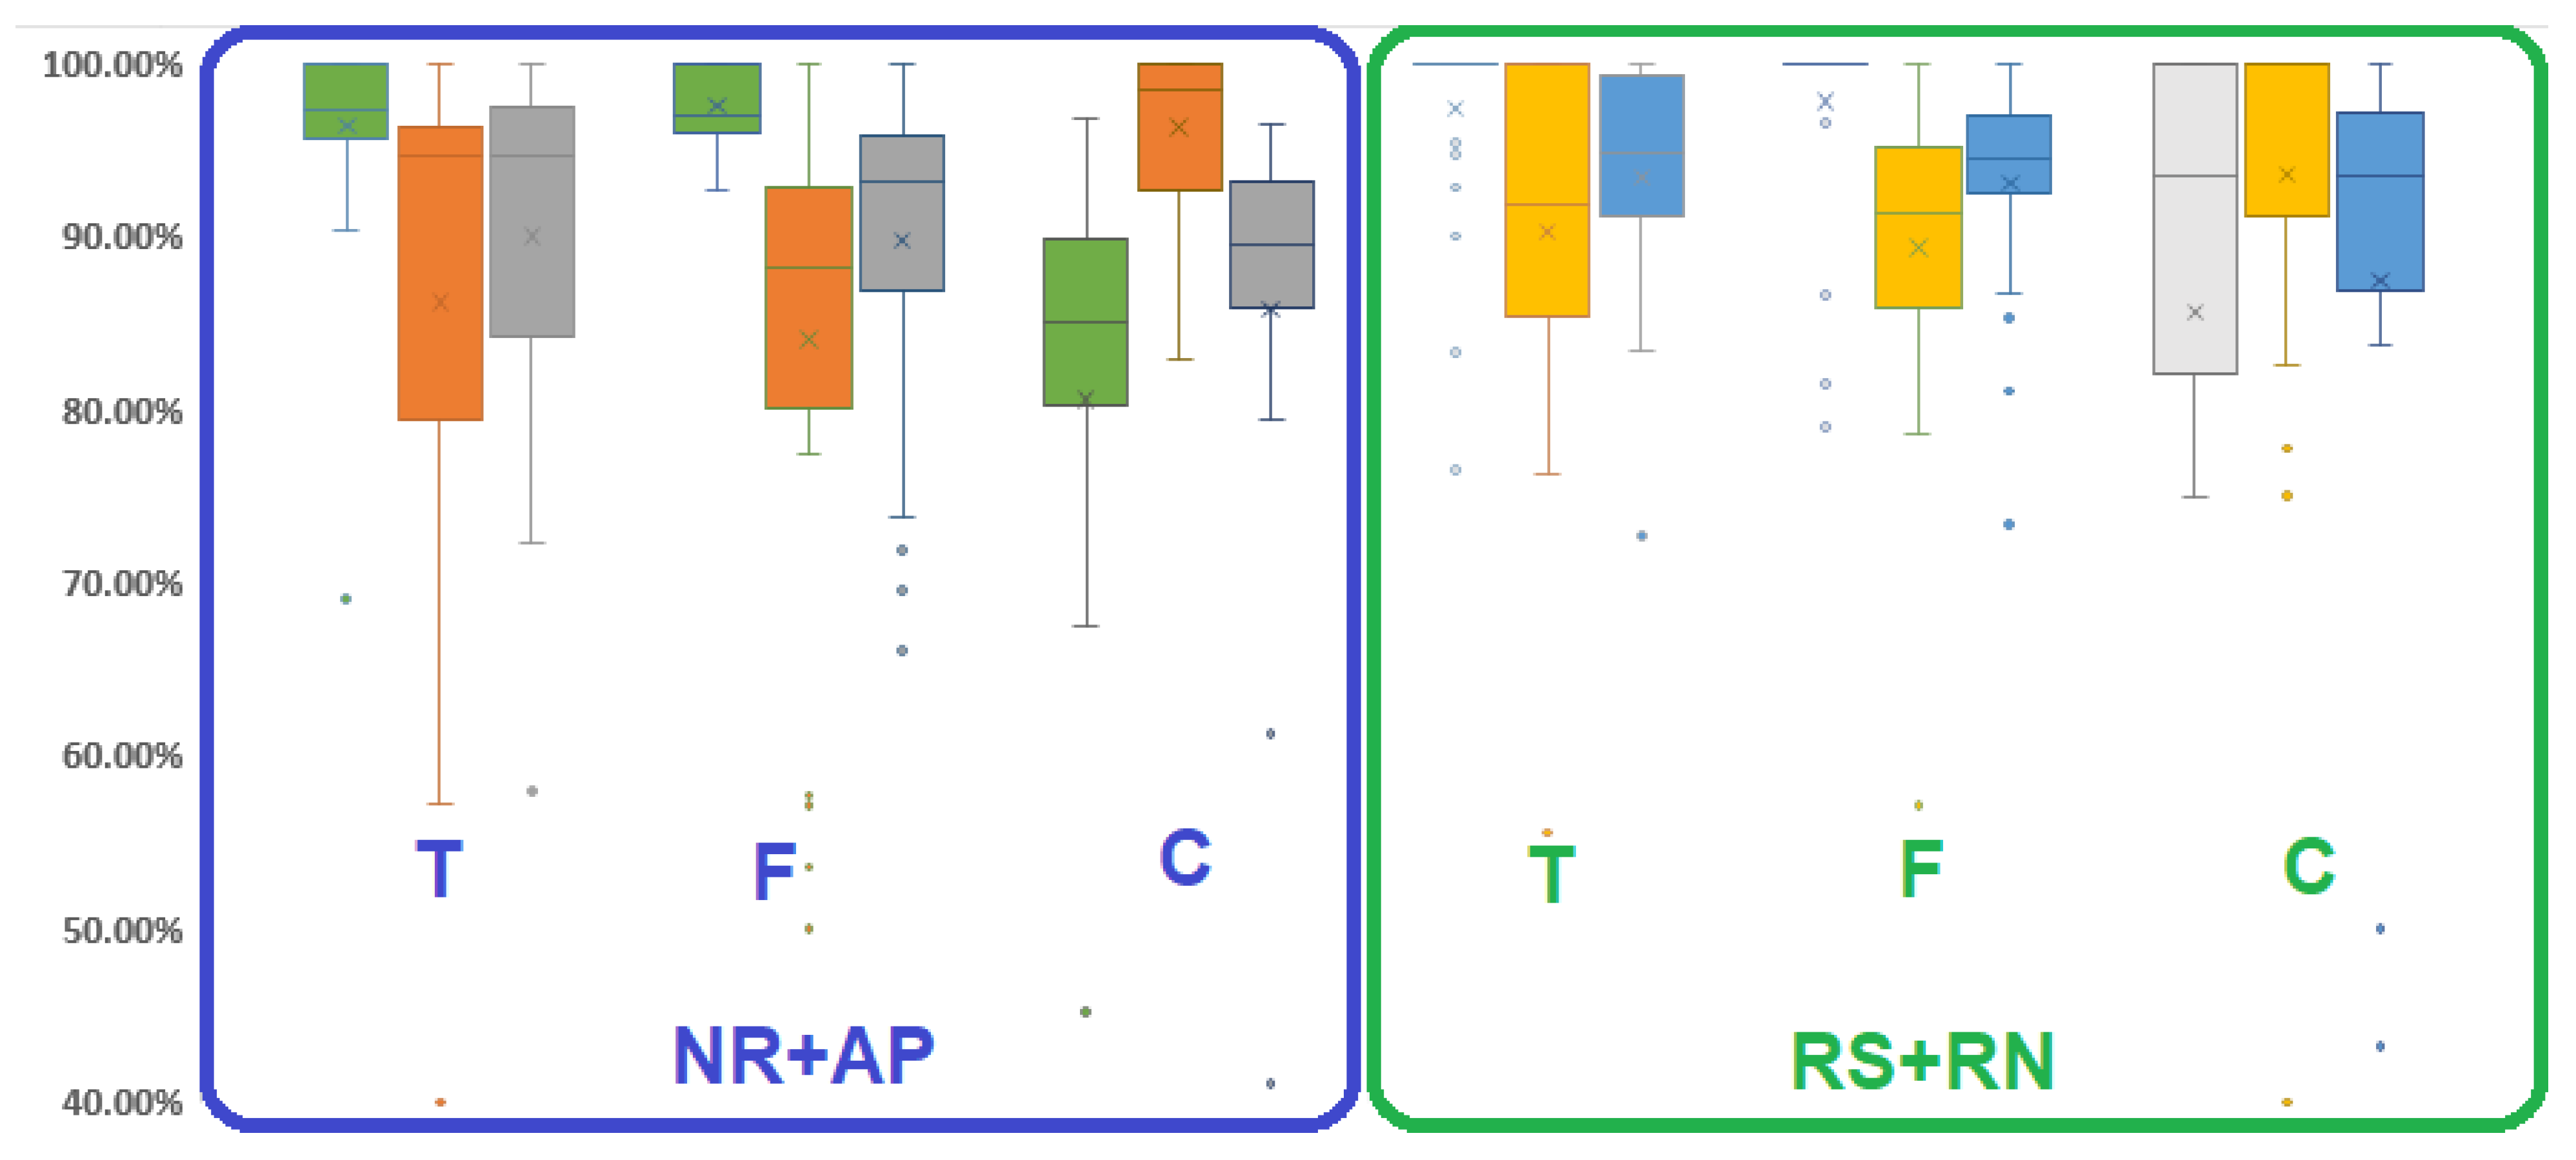
3.3.1. Influence of Speech and Noise
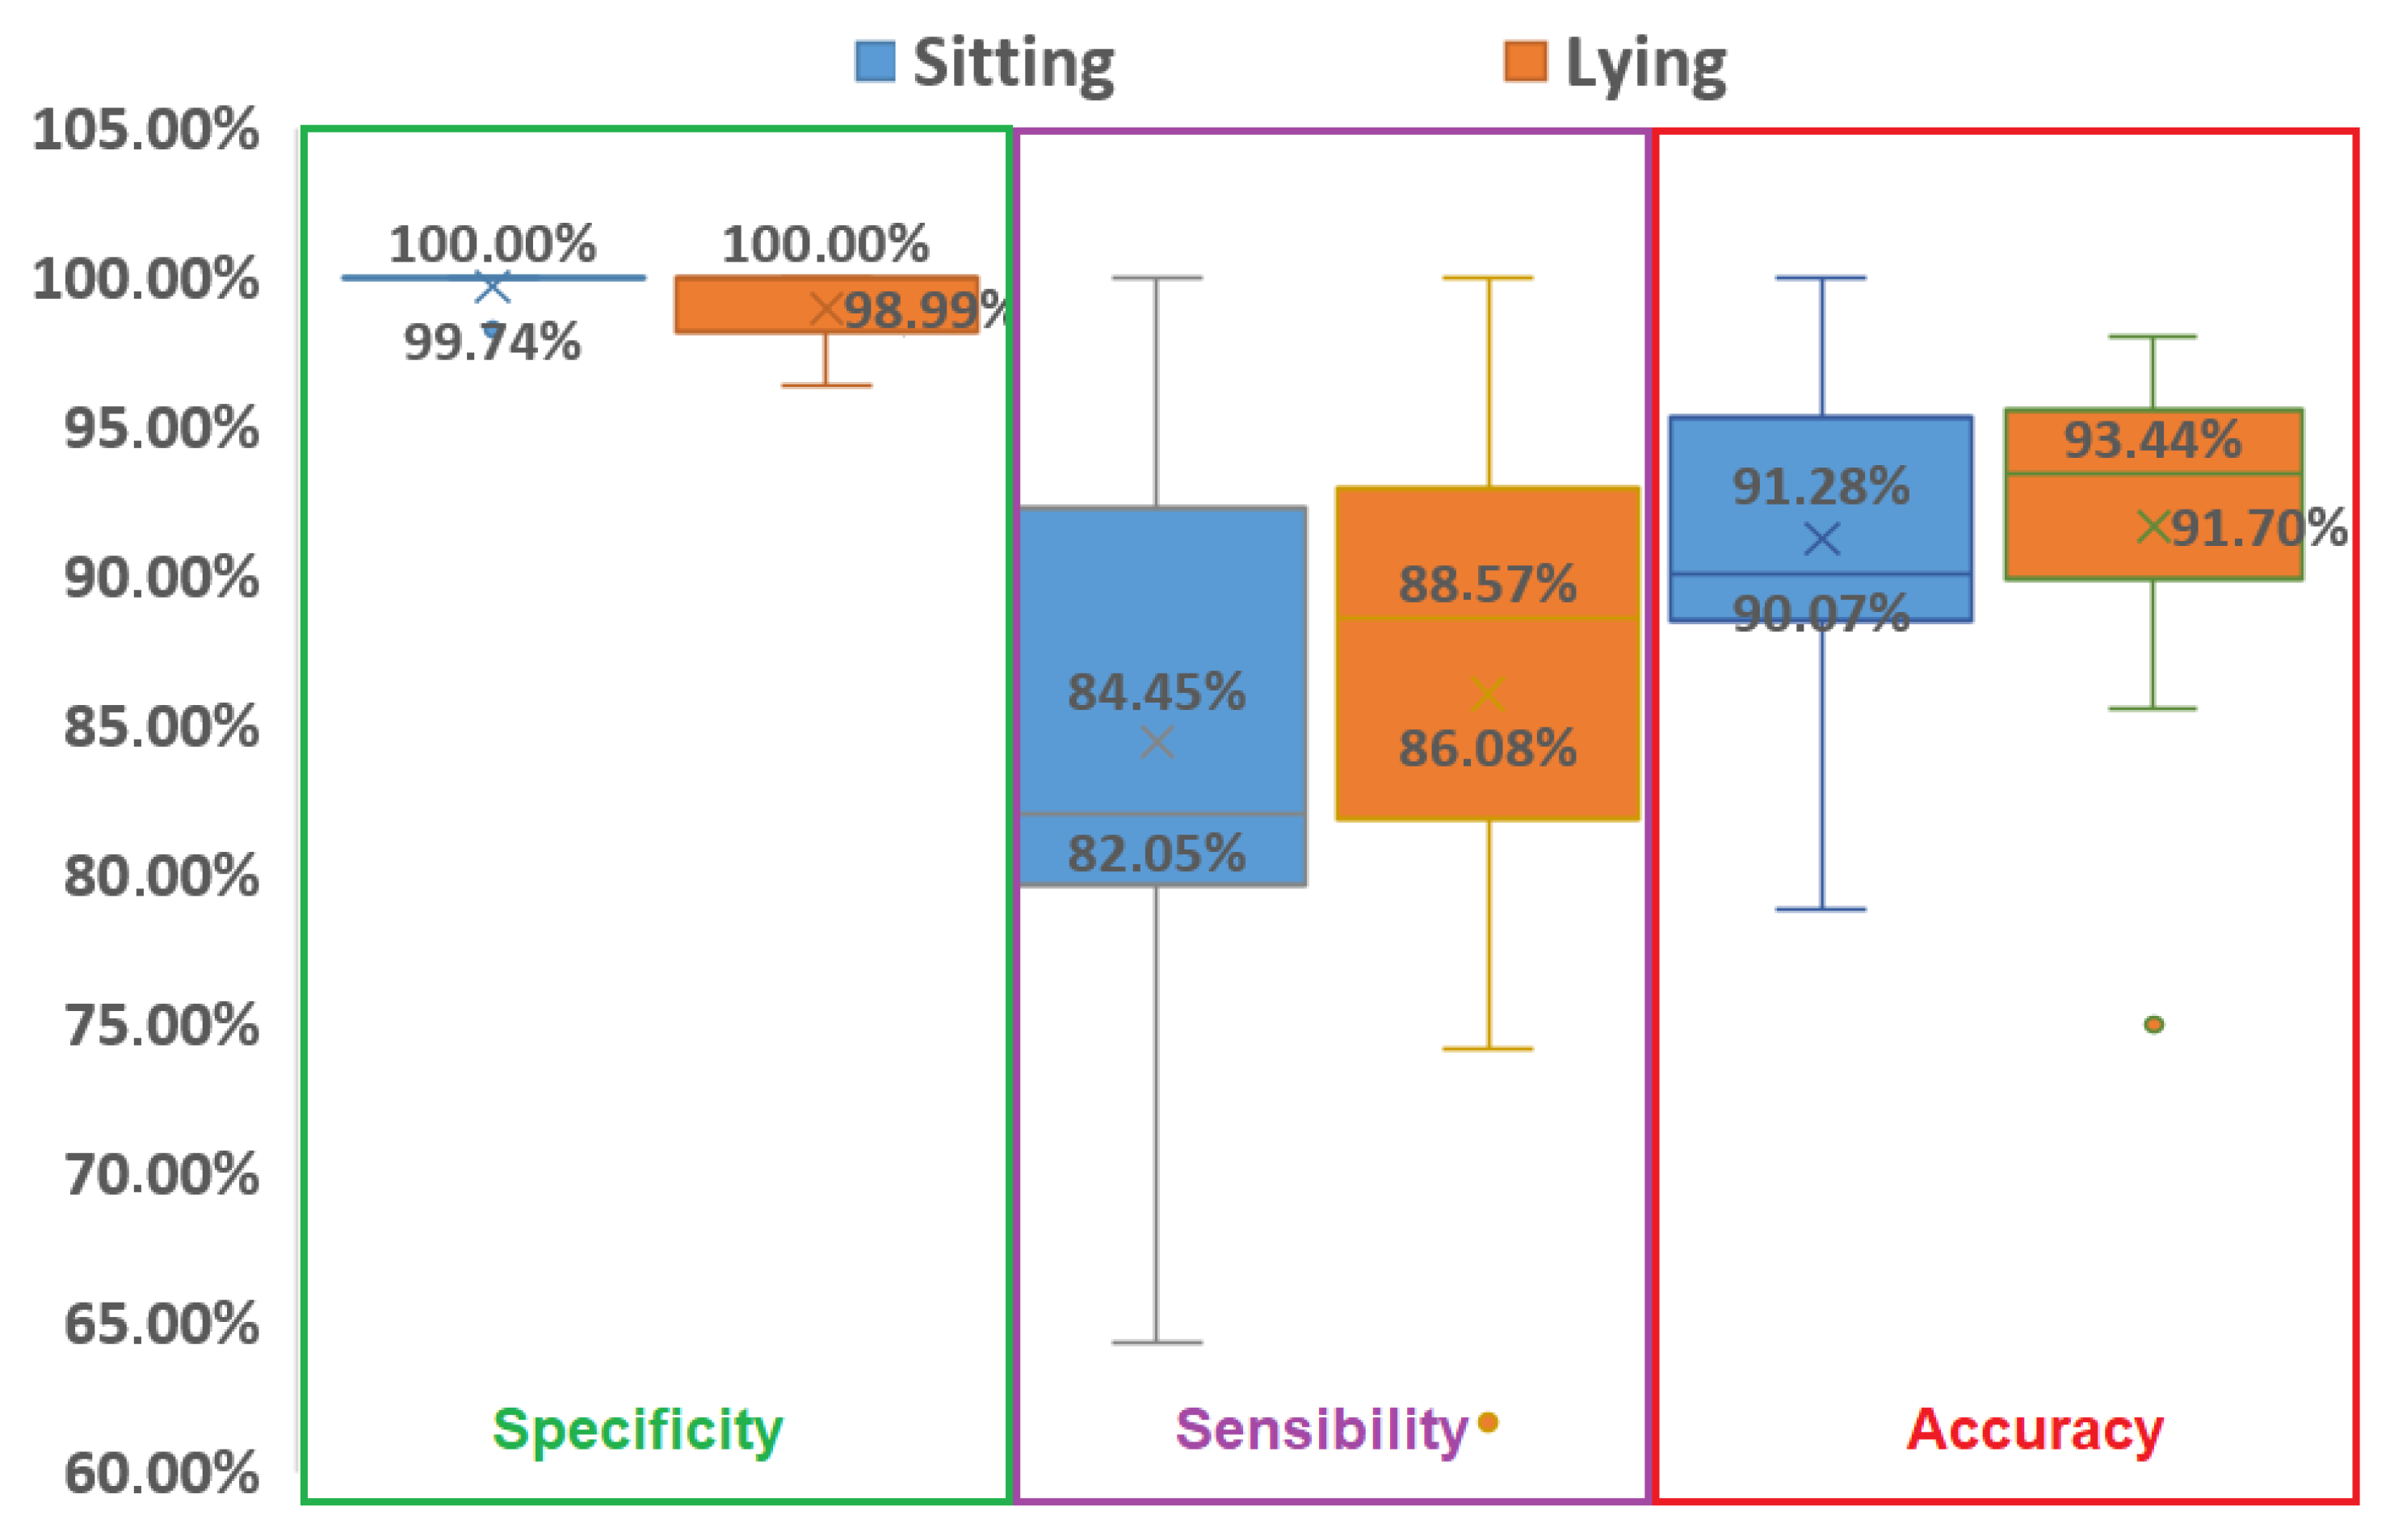
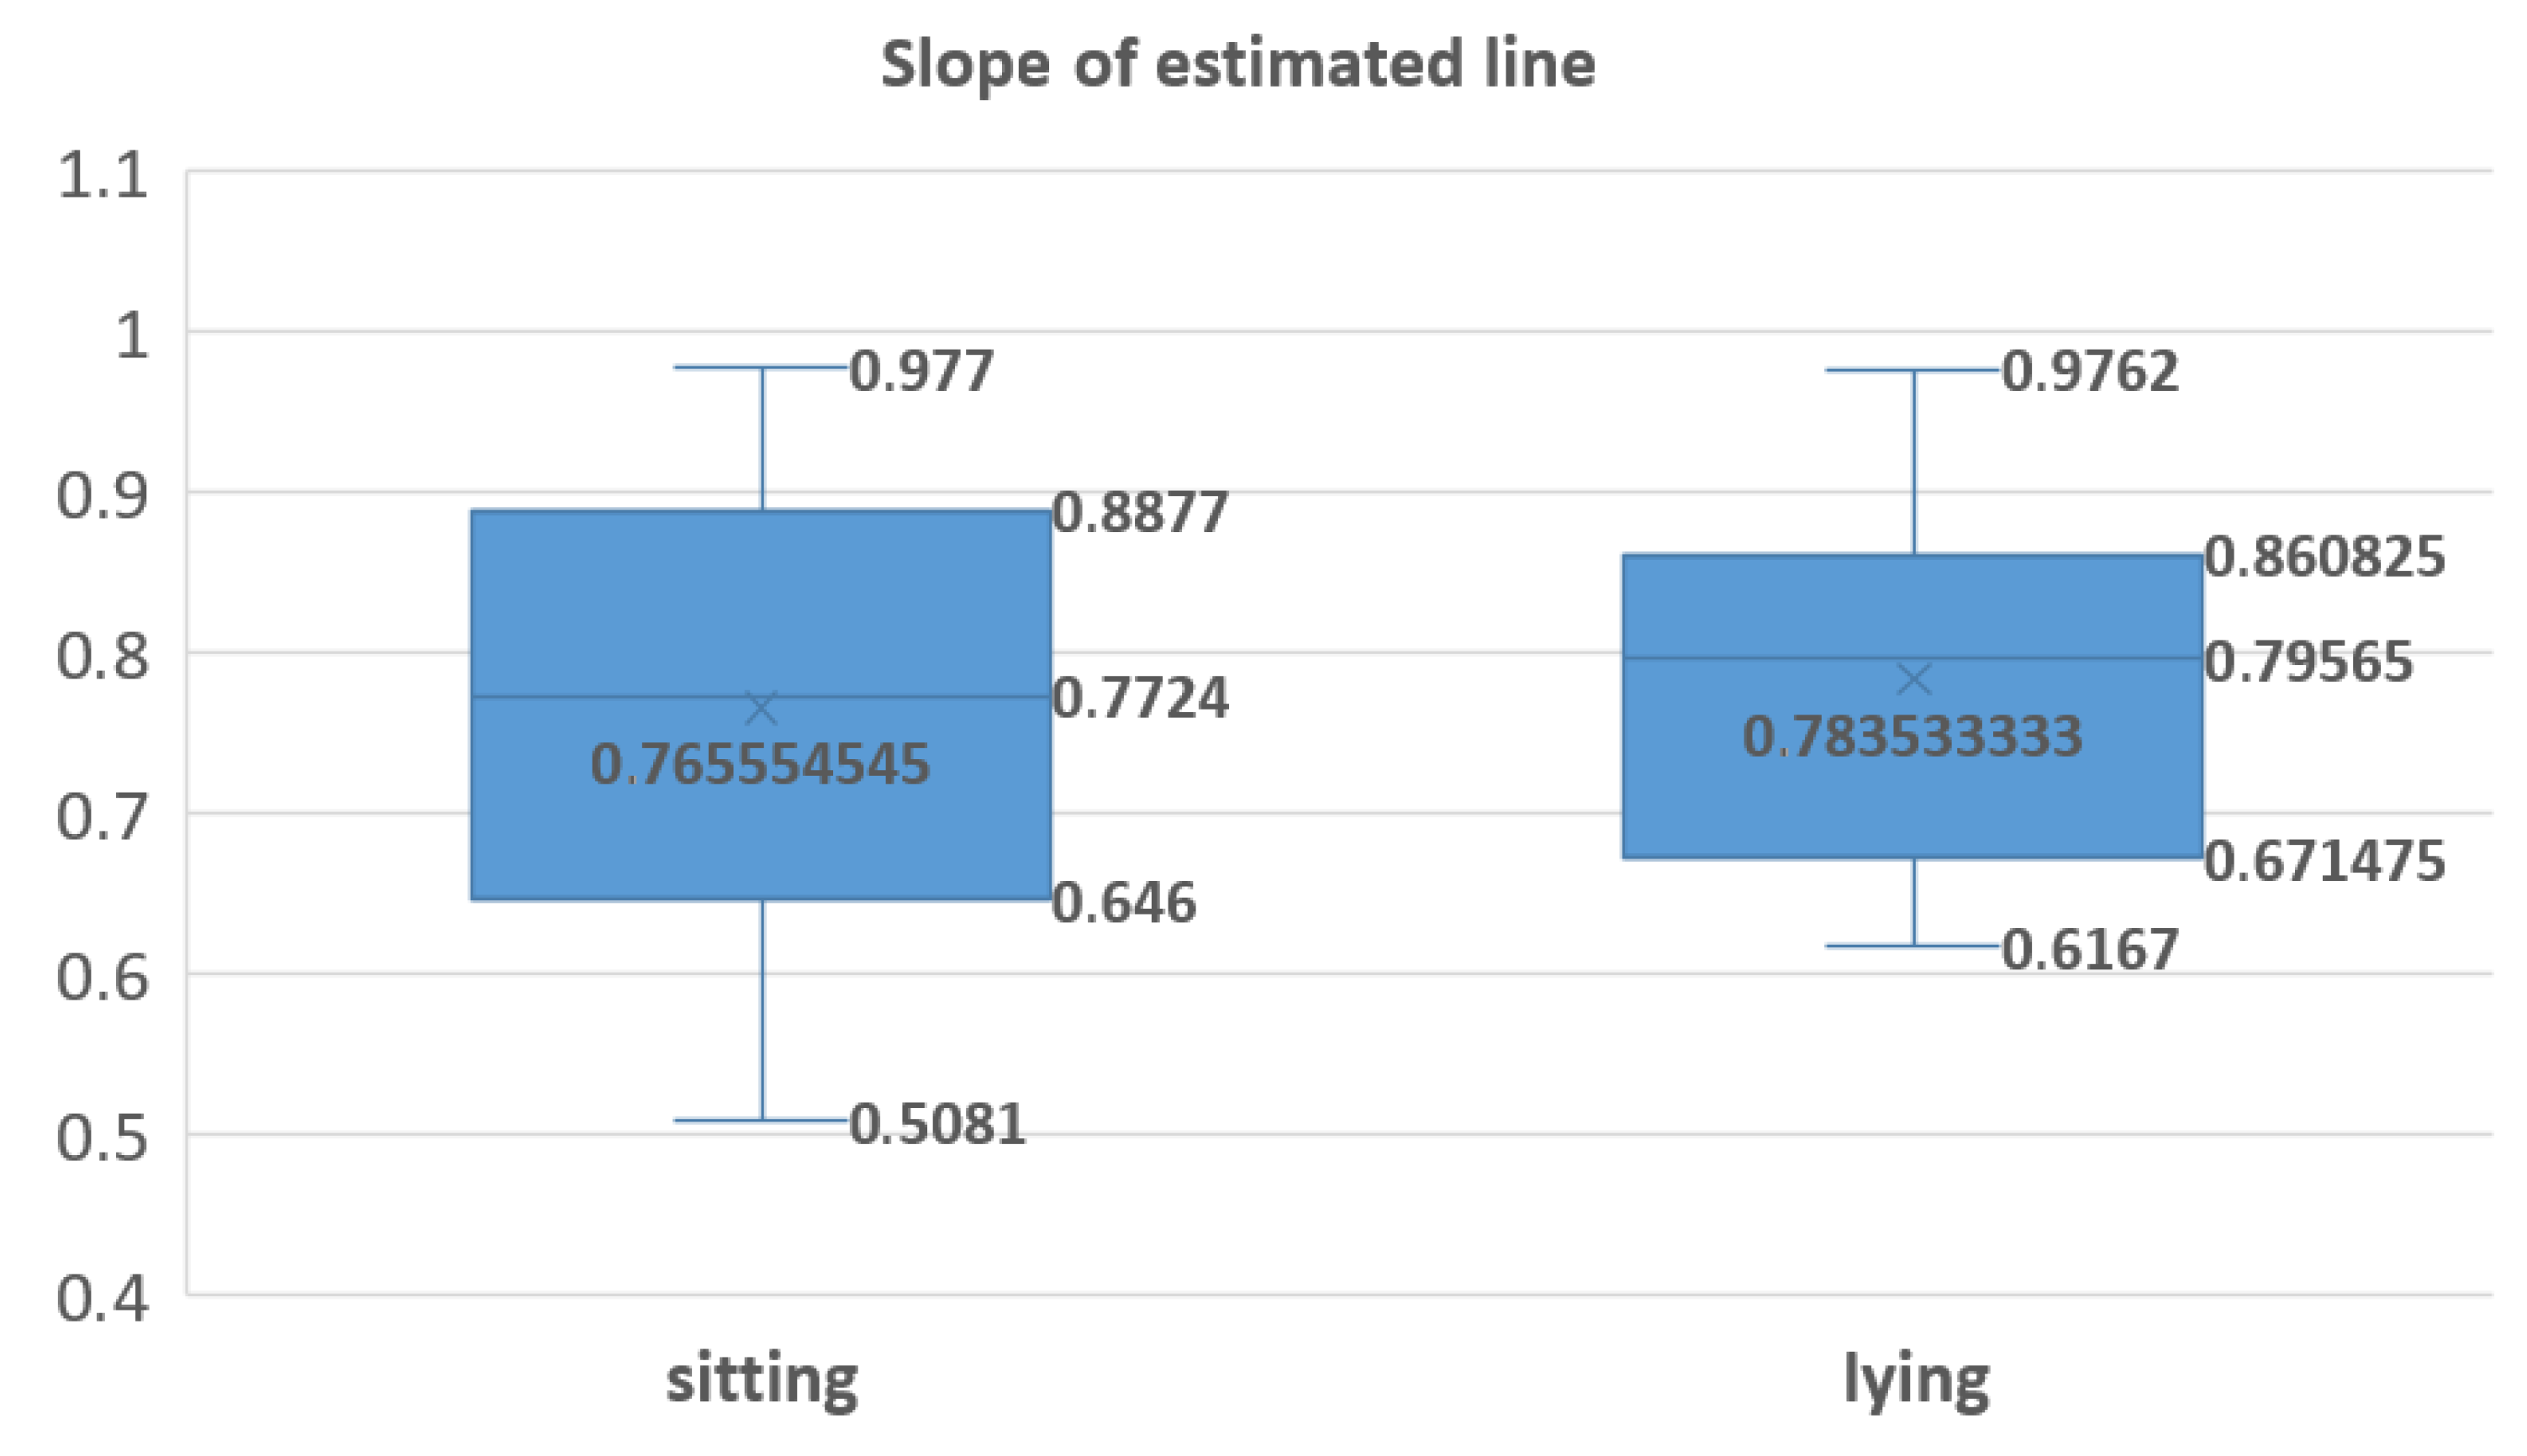
3.3.2. Influence of Position
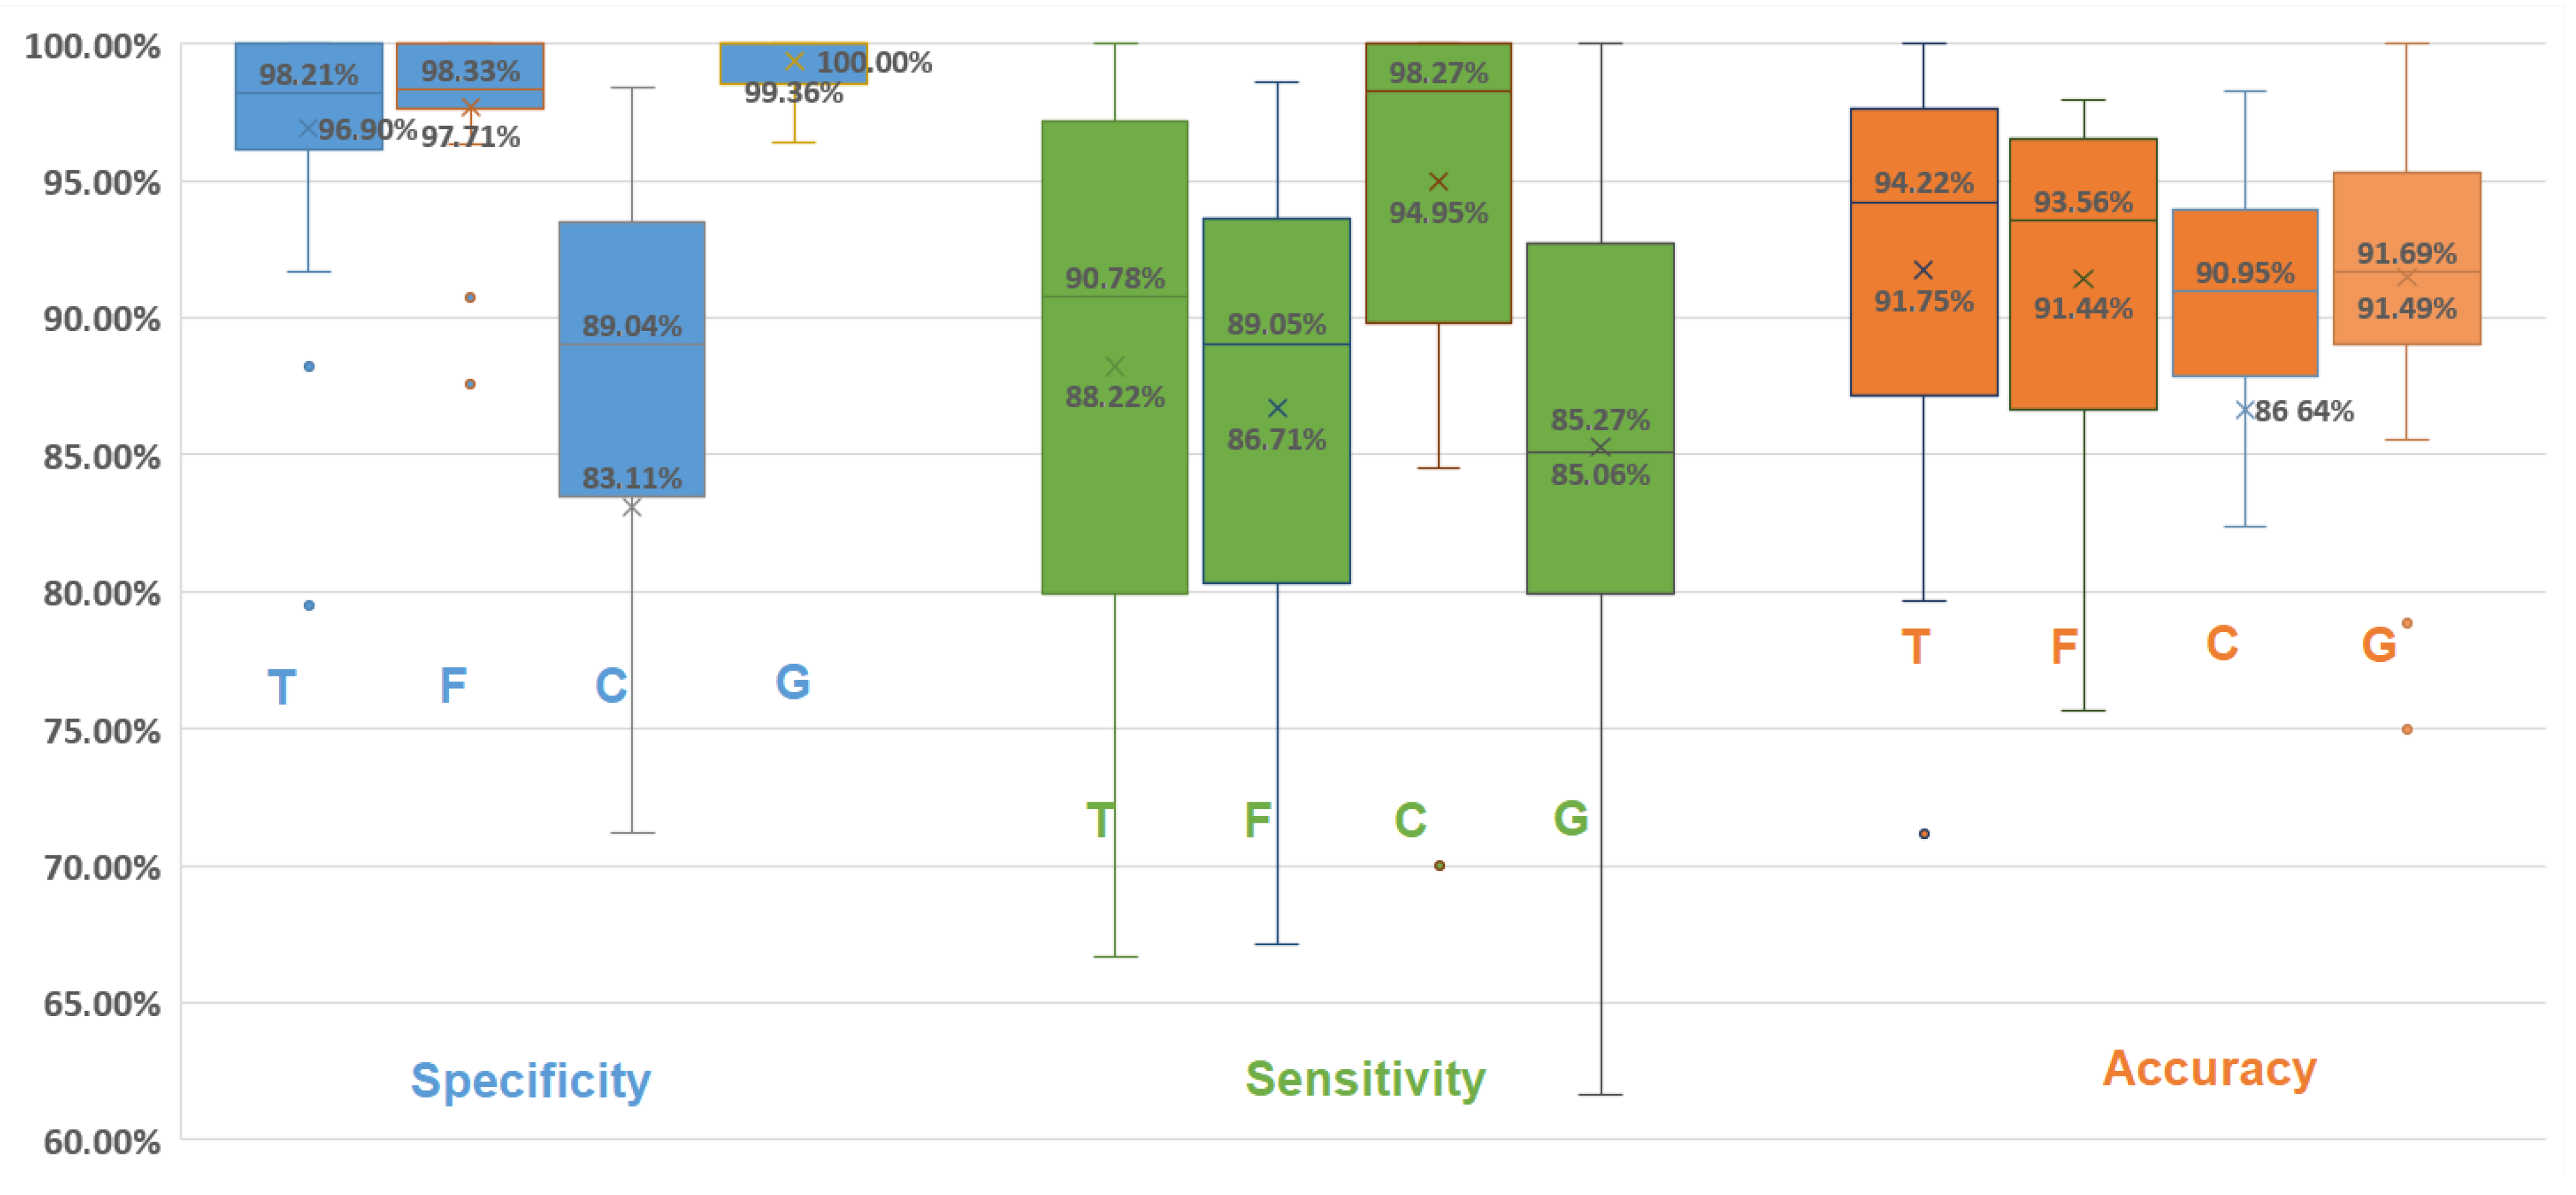
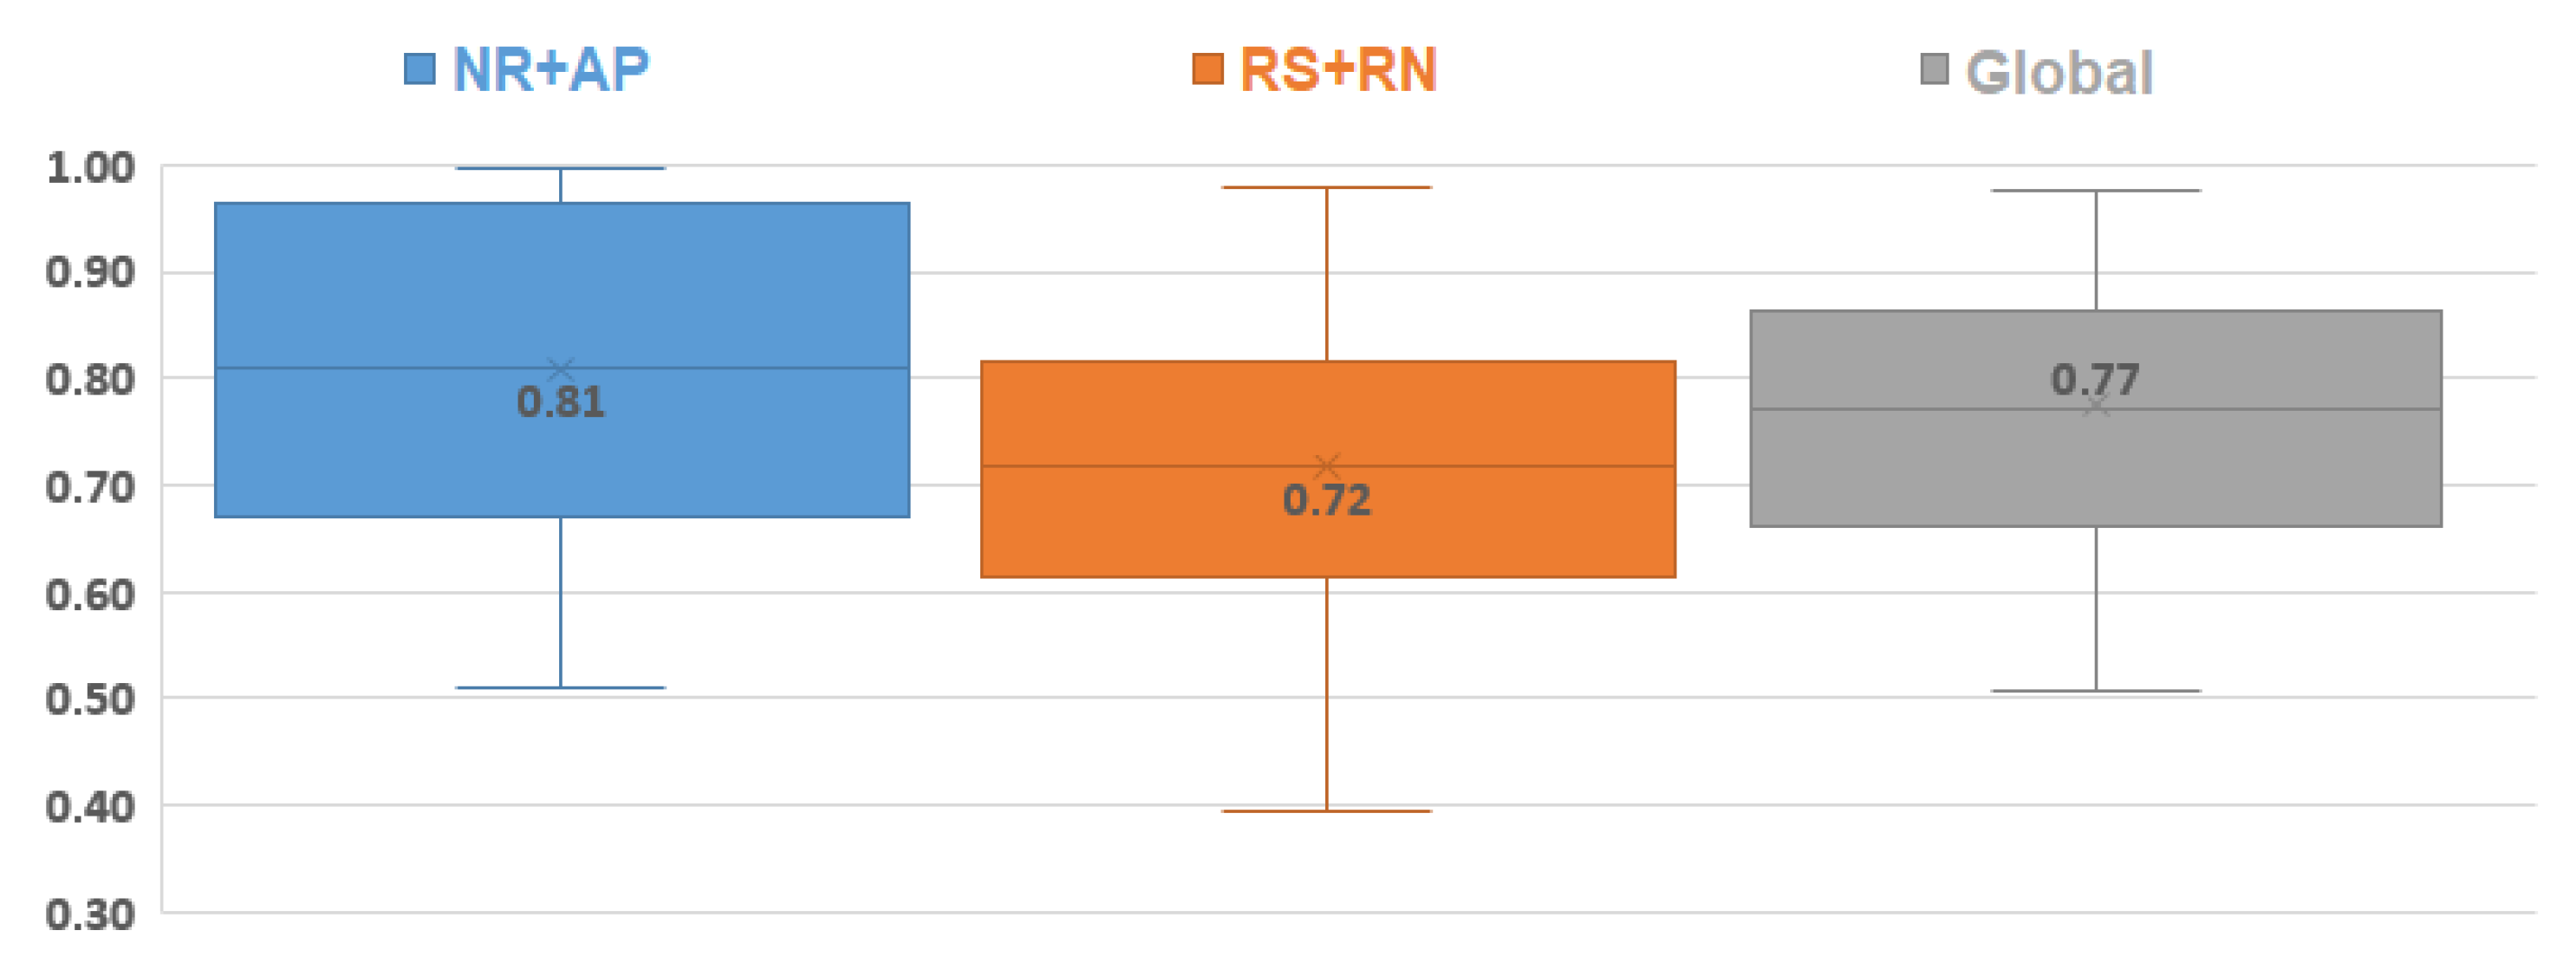
3.3.3. Advantage of Combining Several Detection Domains
3.4. Cardiac Sound Processing
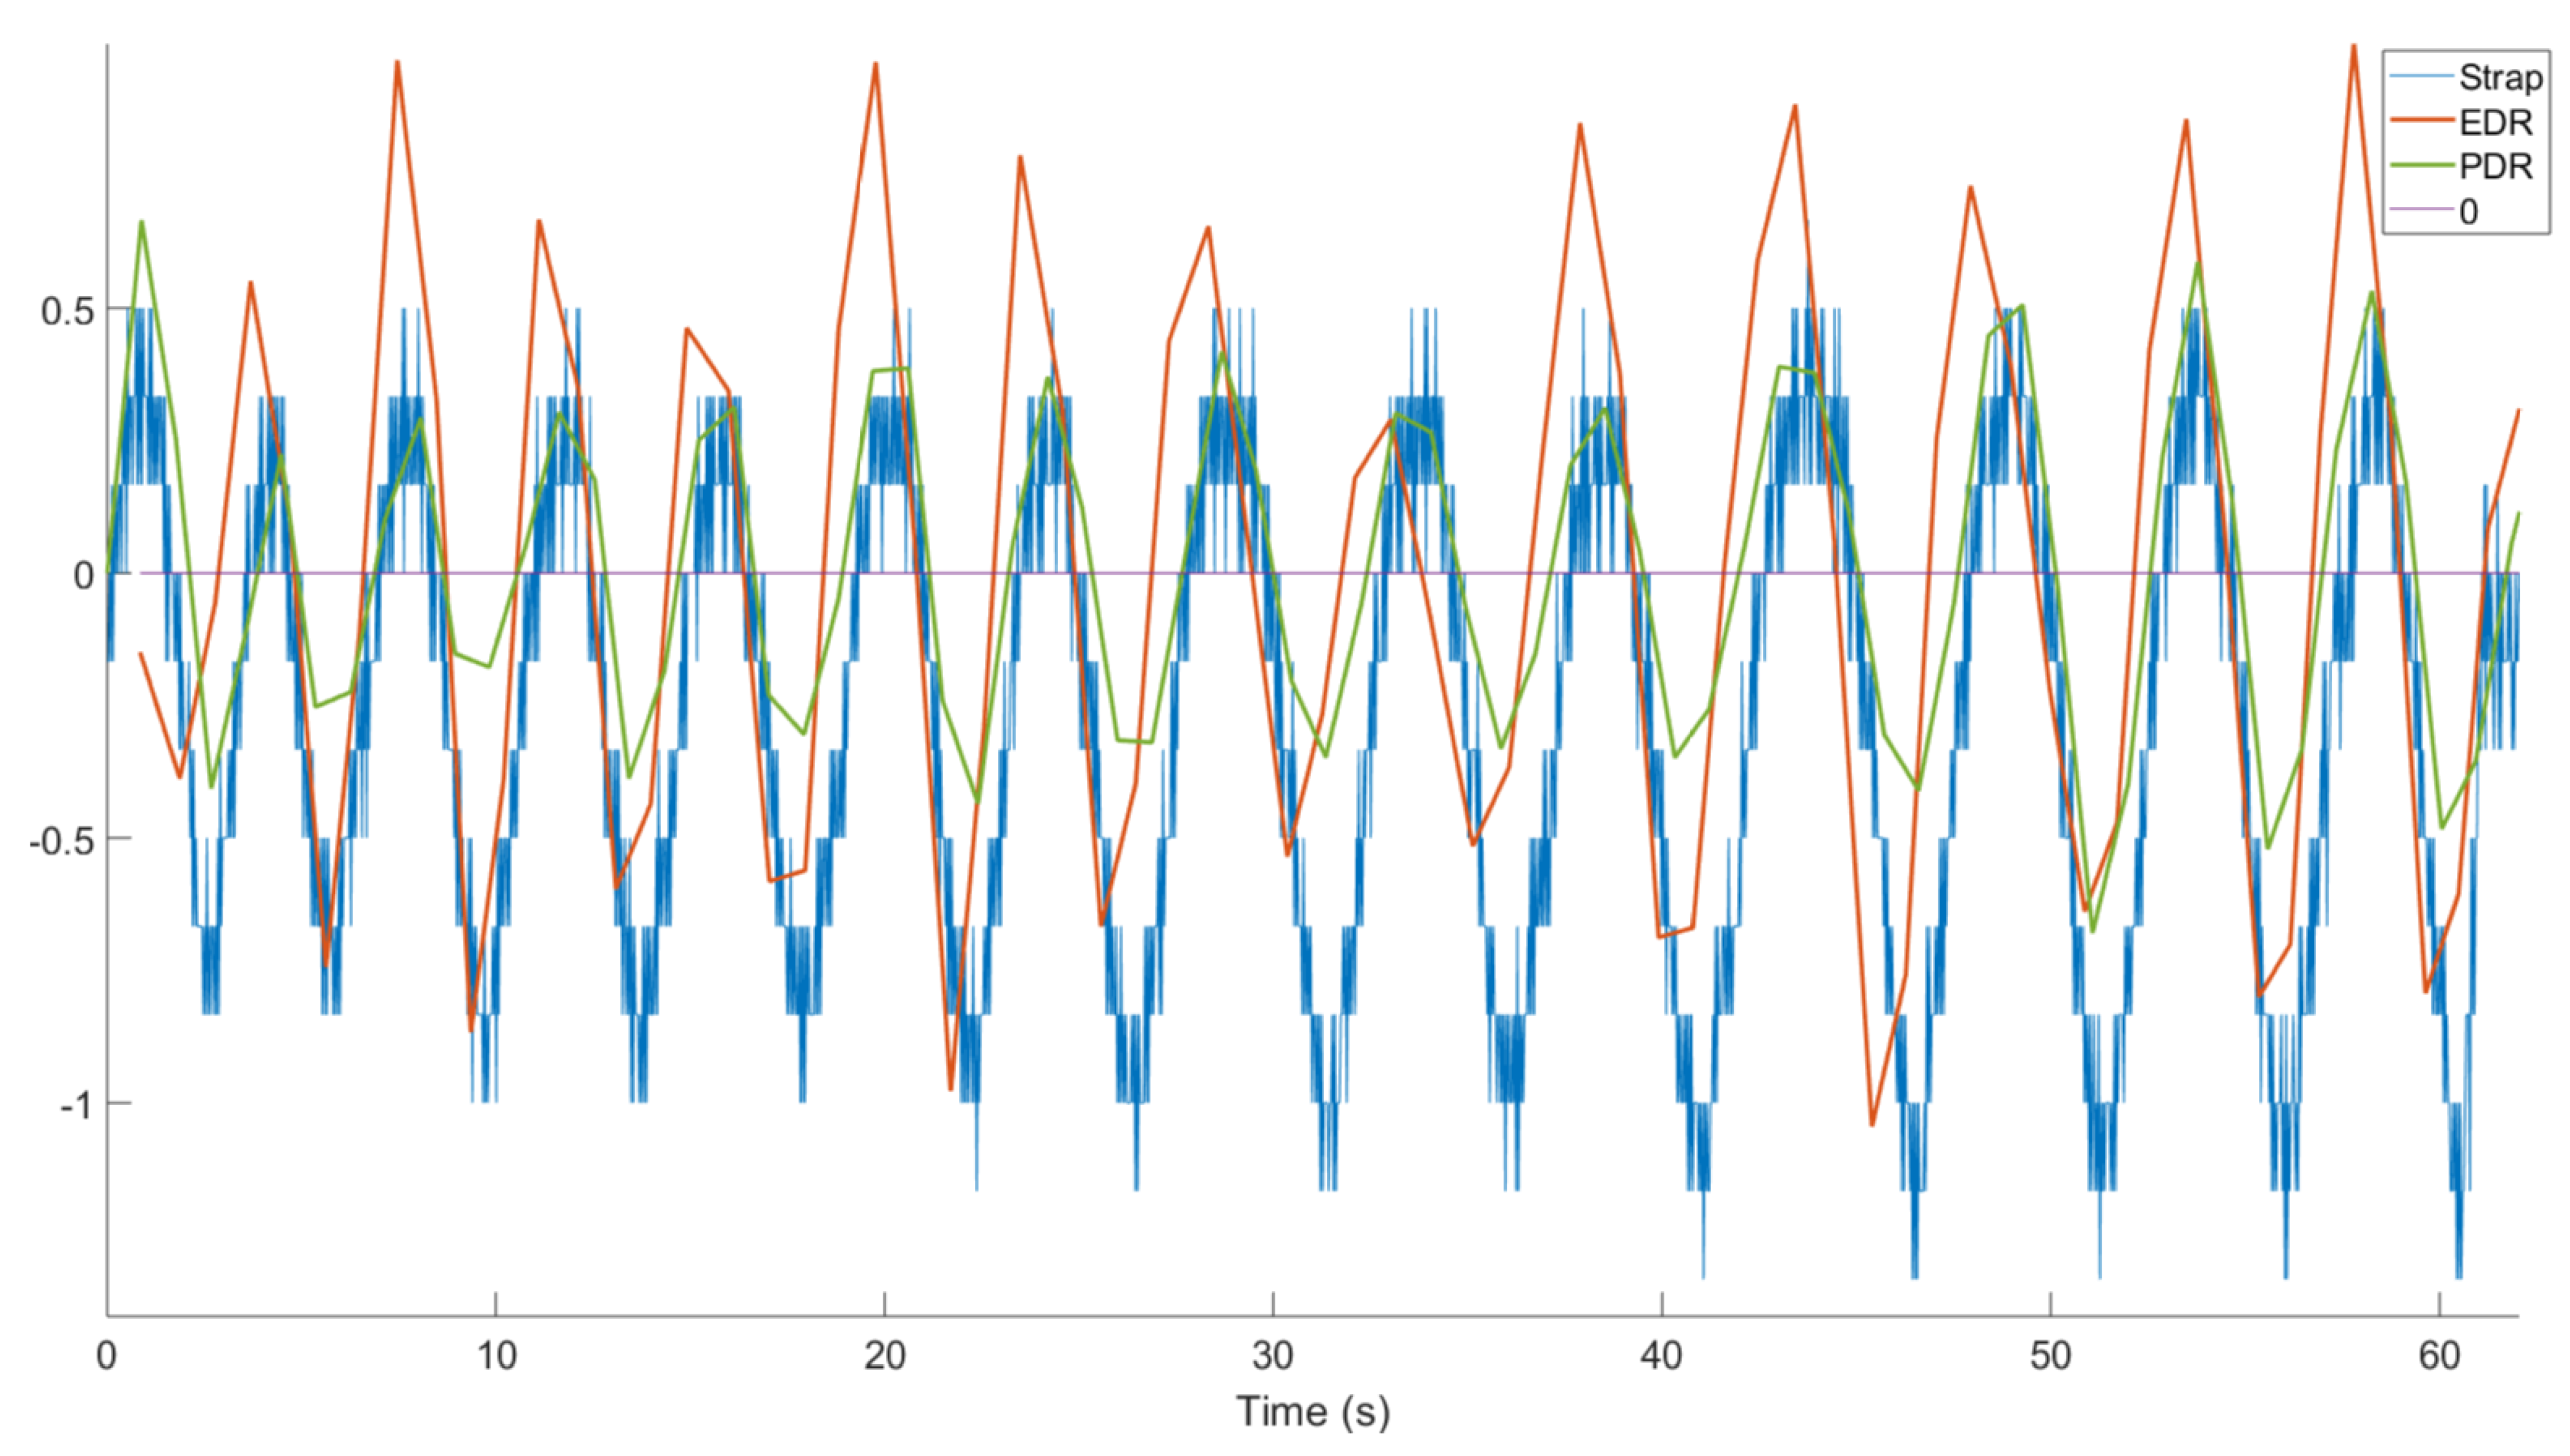
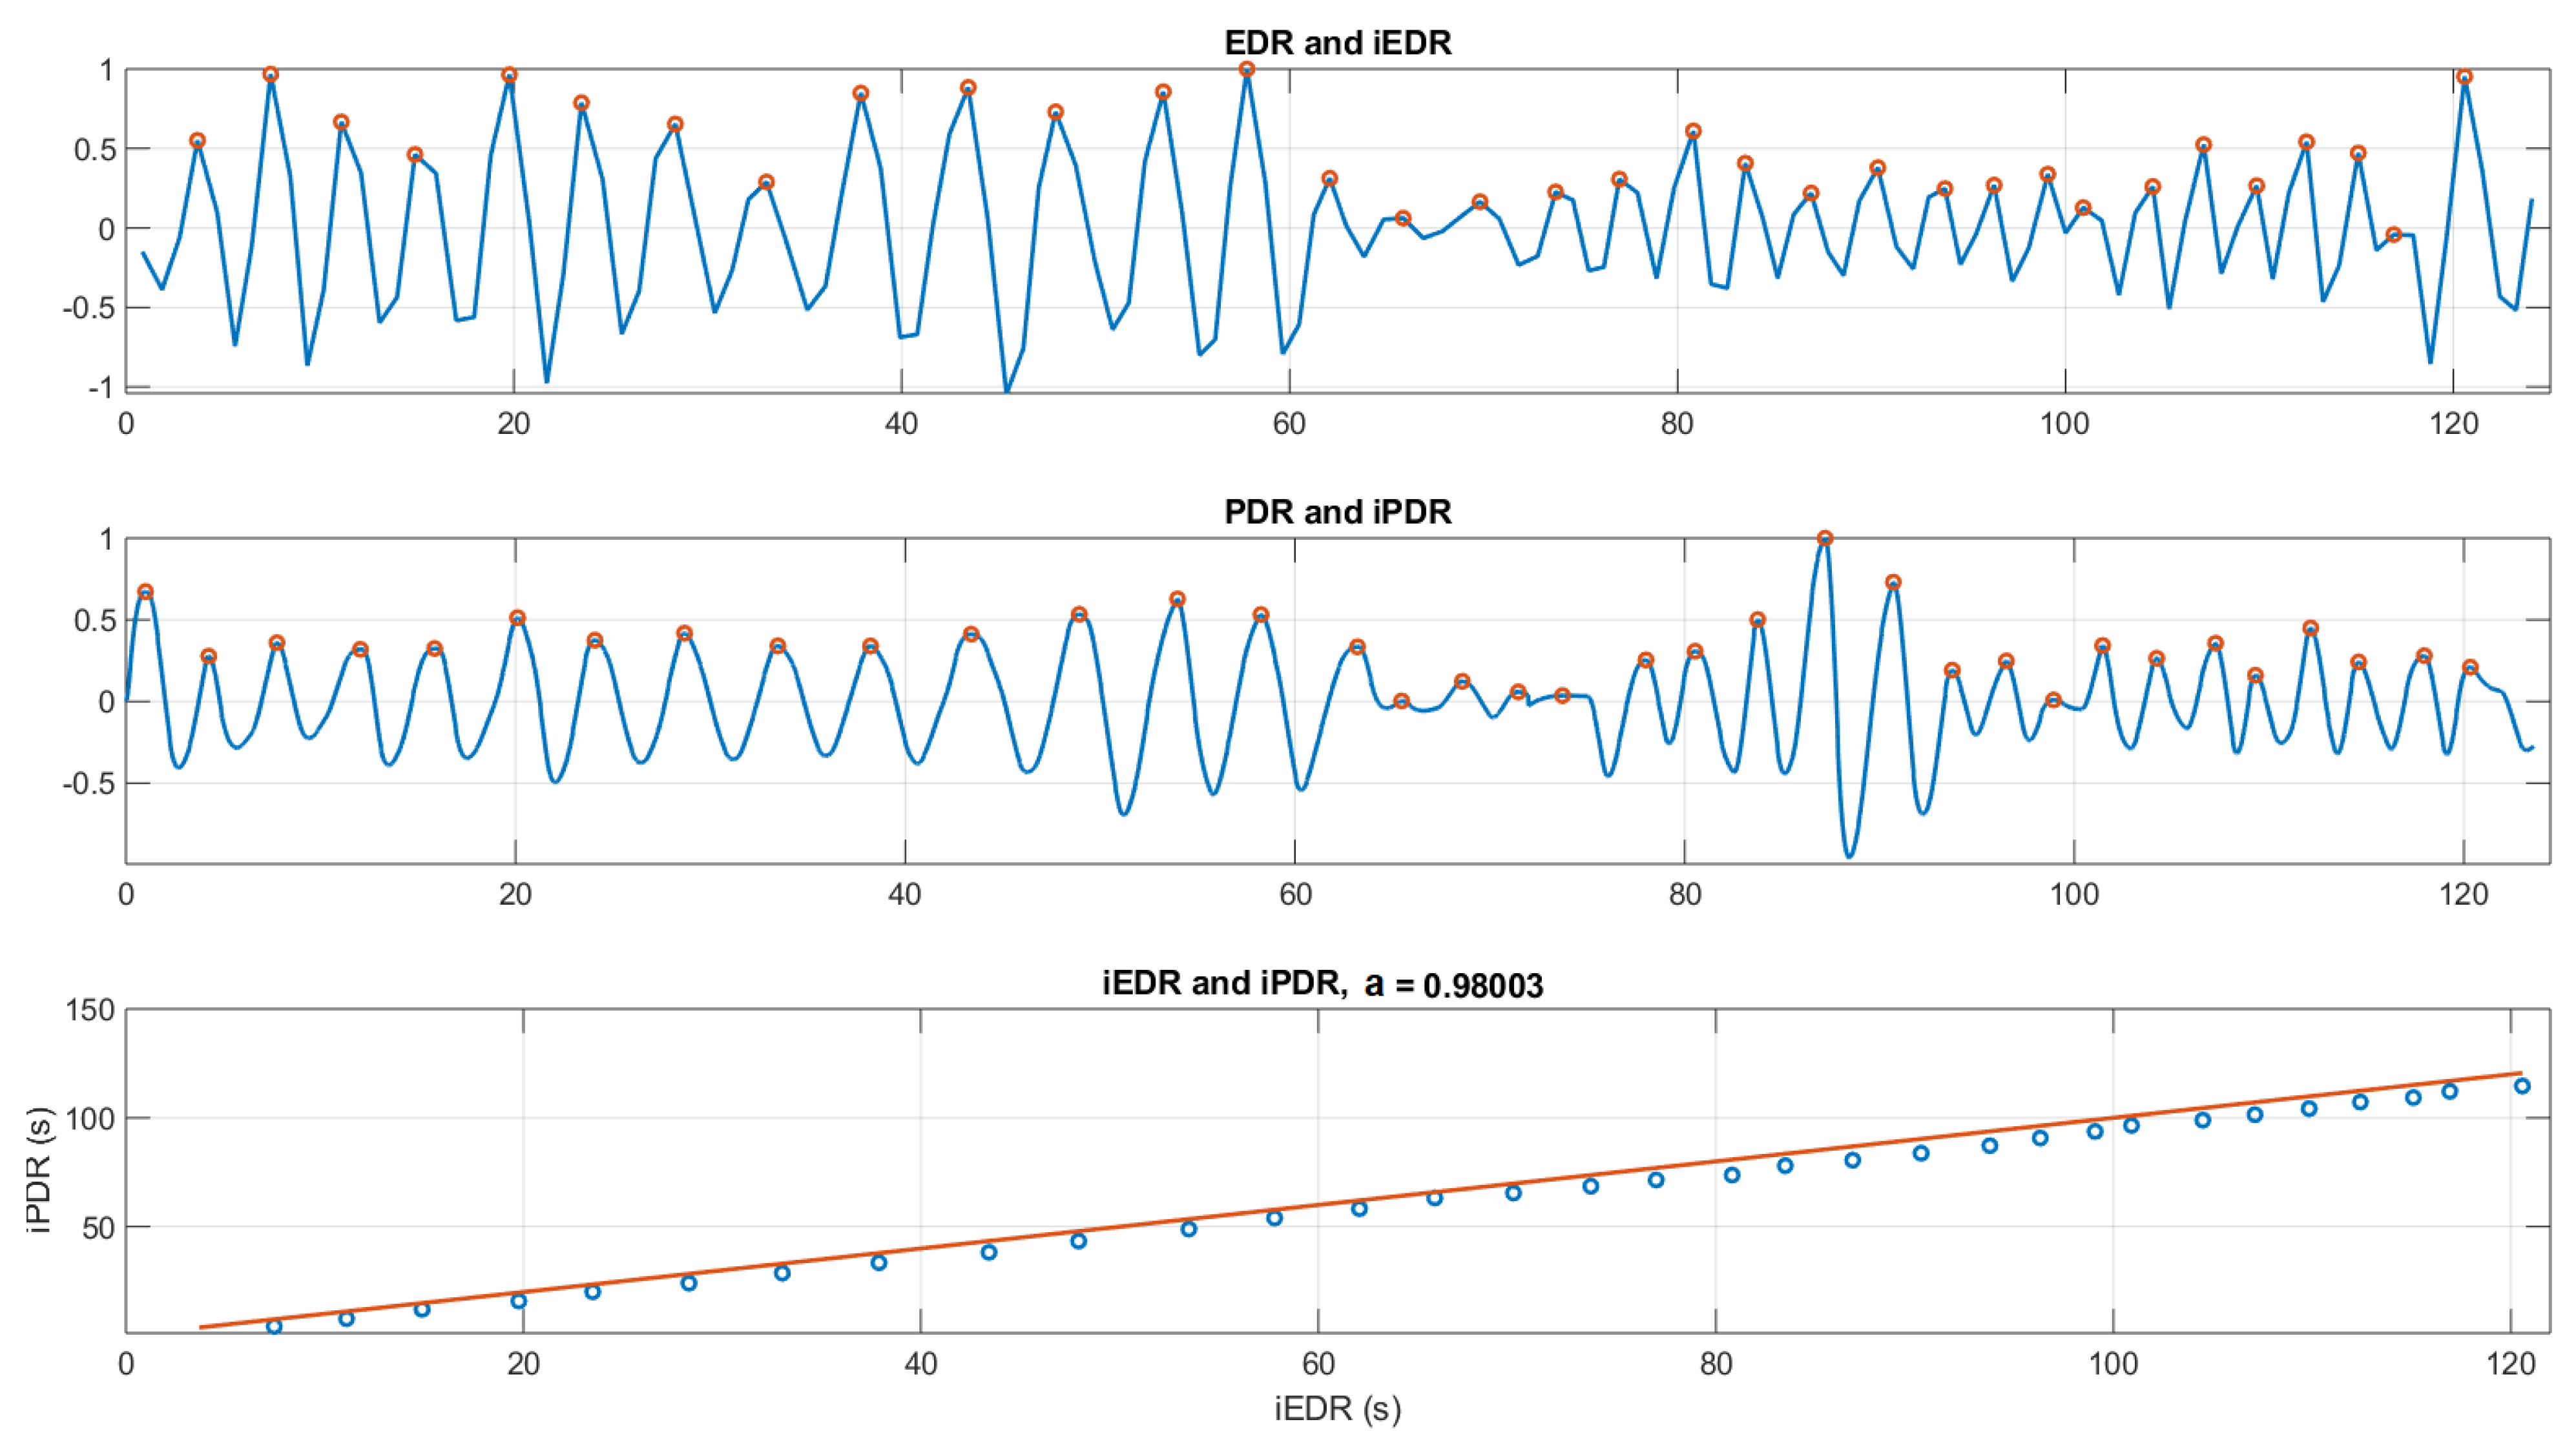
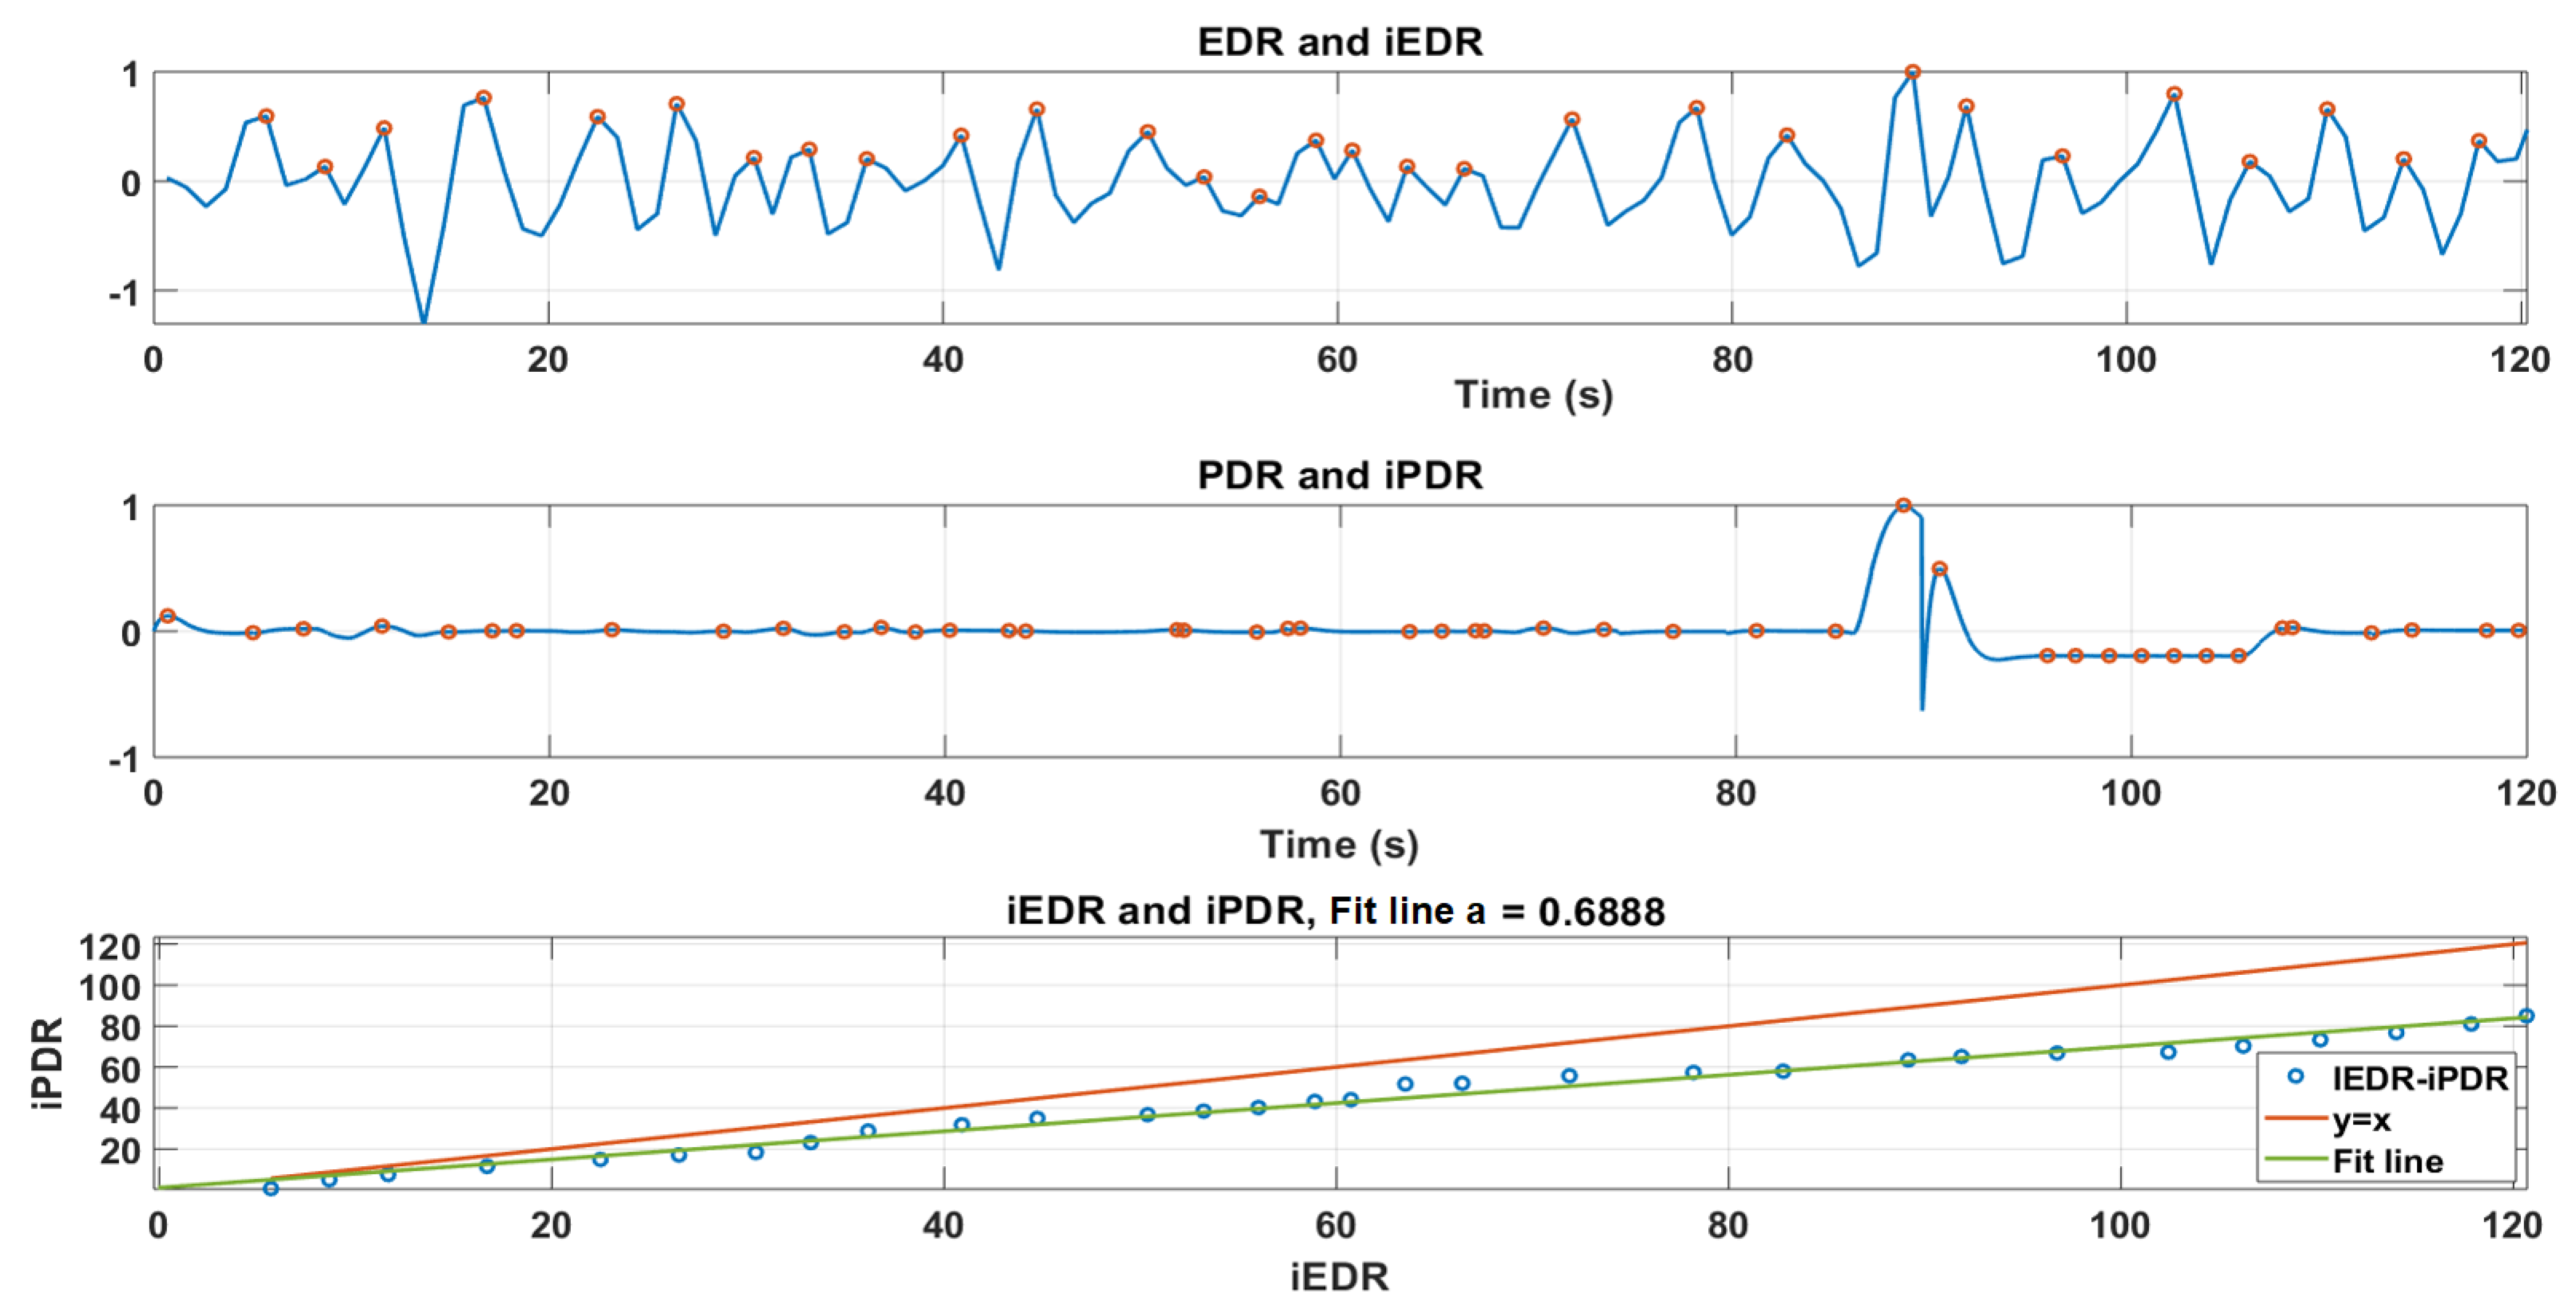
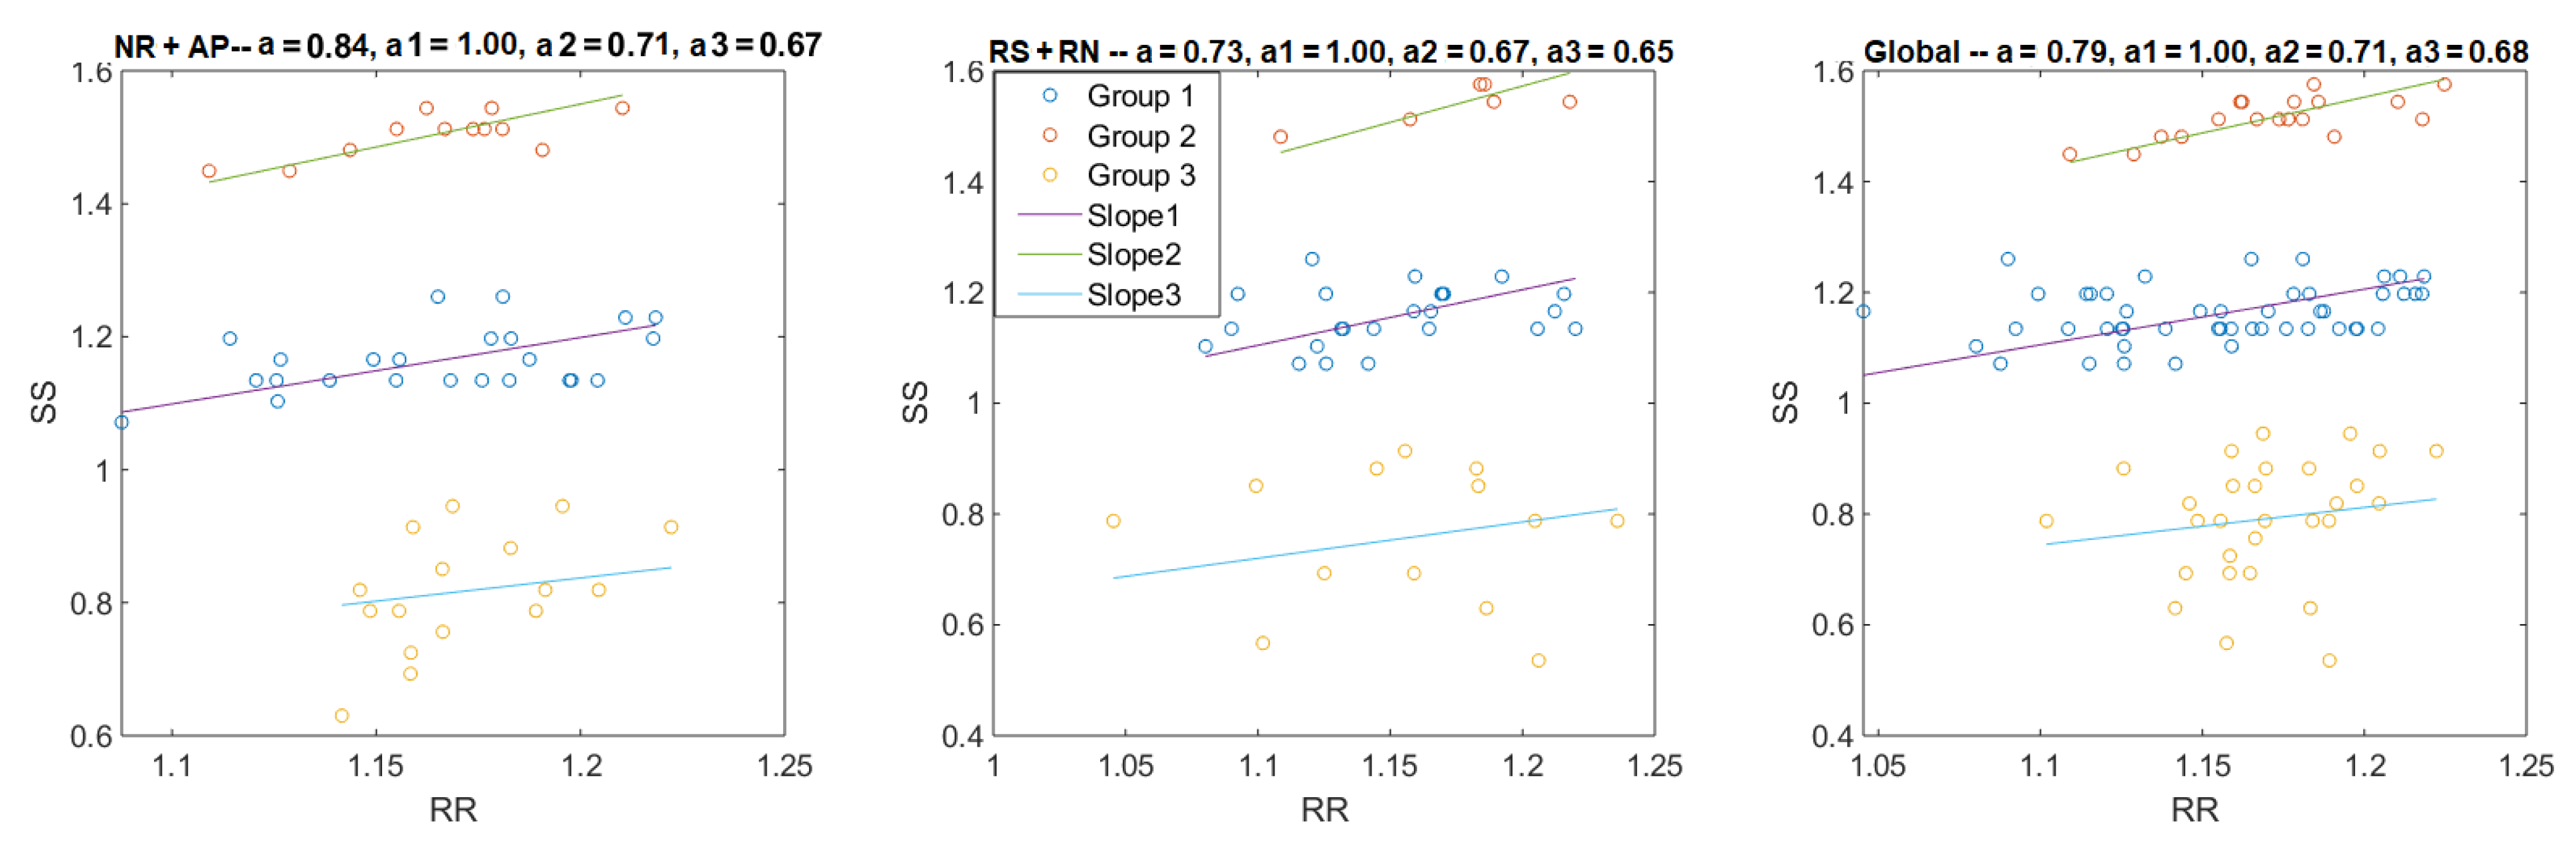
3.4.1. Correlation between PDR and EDR
3.4.2. Heart Beat-to-Beat Interval
4. Discussion
5. Conclusions
Author Contributions
Funding
Ethical Statement
Data Availability Statement
Conflicts of Interest
References
- Similowski, T.; Derenne, J.P. Stimulation phrénique implantée. Méd. Thér. 2001, 7, 457–469. [Google Scholar]
- Weese-Mayer, D.E.; Silvestri, J.M.; Kenny, A.S.; Ilbawi, M.N.; Hauptman, S.A.; Lipton, J.W.; Talonen, P.P.; Garcia, H.G.; Watt, J.W.; Exner, G.; et al. Diaphragm pacing with a quadripolar phrenic nerve electrode: An international study. PACE Pacing Clin. Electrophysiol. 1996, 19, 1311–1319. [Google Scholar] [CrossRef]
- Glenn, W.W.; Holcomb, W.G.; Gee, J.B.; Rath, R. Central hypoventilation; long-term ventilatory assistance by radiofrequency electrophrenic respiration. Ann. Surg. 1970, 172, 755–773. [Google Scholar] [CrossRef] [PubMed]
- Le Pimpec-Barthes, F.; Gonzalez-Bermejo, J.; Hubsch, J.P.; Duguet, A.; Morélot-Panzini, C.; Riquet, M.; Similowski, T. Intrathoracic phrenic pacing: A 10-year experience in France. J. Thorac. Cardiovasc. Surg. 2011, 142, 378–383. [Google Scholar] [CrossRef] [PubMed]
- Iber, C.; Ancoli-Israel, S.; Chesson, A.L.; Quan, S.F. The AASM Manual for the Scoring of Sleep and Associated Events: Rules, Terminology and Technical Specifications; American Academy of Sleep Medicine Westchester: Darien, IL, USA, 2007. [Google Scholar]
- DiMarco, A.F. Diaphragm Pacing. Clin. Chest Med. 2018, 39, 459–471. [Google Scholar] [CrossRef]
- Que, C.l.; Kolmaga, C.; Durand, L.G.; Kelly, S.M.; Macklem, P.T. Phonospirometry for noninvasive measurement of ventilation: Methodology and preliminary results. J. Appl. Physiol. 2002, 93, 1515–1526. [Google Scholar] [CrossRef] [PubMed]
- Corbishley, P.; Rodríguez-Villegas, E. Breathing detection: Towards a miniaturized, wearable, battery-operated monitoring system. IEEE Trans. Biomed. Eng. 2008, 55, 196–204. [Google Scholar] [CrossRef]
- Yadollahi, A.; Giannouli, E.; Moussavi, Z. Sleep apnea monitoring and diagnosis based on pulse oximetery and tracheal sound signals. Med. Biol. Eng. Comput. 2010, 48, 1087–1097. [Google Scholar] [CrossRef] [PubMed]
- Kalkbrenner, C.; Eichenlaub, M.; Rüdiger, S.; Kropf-Sanchen, C.; Rottbauer, W.; Brucher, R. Apnea and heart rate detection from tracheal body sounds for the diagnosis of sleep-related breathing disorders. Med. Biol. Eng. Comput. 2017, 56, 671–681. [Google Scholar] [CrossRef] [PubMed]
- Chuah, J.S.; Moussavi, Z. Automated detection of respiratory phases by acoustical means. In Proceedings of the 20th Annual International Conference of the IEEE Engineering in Medicine and Biology Society. Vol.20 Biomedical Engineering Towards the Year 2000 and Beyond (Cat. No.98CH36286), Hong Kong, China, 1 November 2001. [Google Scholar]
- Hult, P.; Fjallbrant, T.; Wranne, B.; Engdahl, O.; Ask, P. An improved bioacoustic method for monitoring of respiration. Technol. Health Care 2004, 12, 323–332. [Google Scholar] [CrossRef] [PubMed]
- Hult, P.; Fjallbrant, T.; Dahle, S.; Danielsson, P.; Ask, P. A method for respiration monitoring by the use of a bioacoustic signal. In Proceedings of the First International Conference on Advances in Medical Signal and Information Processing, Bristol, UK, 4–6 September 2000; IET: London, UK, 2000; Volume 2000, pp. 22–25. [Google Scholar] [CrossRef]
- Kalkbrenner, C.; Stark, P.; Kouemou, G.; Algorri, M.E.; Brucher, R. Sleep monitoring using body sounds and motion tracking. In Proceedings of the 2014 36th Annual International Conference of the IEEE Engineering in Medicine and Biology Society, Chicago, IL, USA, 26–30 August 2014; Volume 6000, pp. 6941–6944. [Google Scholar] [CrossRef]
- Kulkas, A.; Huupponen, E.; Virkkala, J.; Tenhunen, M.; Saastamoinen, A.; Rauhala, E.; Himanen, S.L. New tracheal sound feature for apnoea analysis. Med. Biol. Eng. Comput. 2009, 47, 405–412. [Google Scholar] [CrossRef] [PubMed]
- Lei, B.; Rahman, S.A.; Song, I. Content-based classification of breath sound with enhanced features. Neurocomputing 2014, 141, 139–147. [Google Scholar] [CrossRef]
- Muthusamy, P.D.; Sundaraj, K.; Abd Manap, N. Computerized acoustical techniques for respiratory flow-sound analysis: A systematic review. Artif. Intell. Rev. 2019, 53, 501–3574. [Google Scholar] [CrossRef]
- Schmidt, M.; Schumann, A.; Müller, J.; Bär, K.J.; Rose, G. ECG derived respiration: Comparison of time-domain approaches and application to altered breathing patterns of patients with schizophrenia. Physiol. Meas. 2017, 38, 601–615. [Google Scholar] [CrossRef] [PubMed]
- Martin, A.; Voix, J. In-Ear Audio Wearable: Measurement of Heart and Breathing Rates for Health and Safety Monitoring. IEEE Trans. Biomed. Eng. 2018, 65, 1256–1263. [Google Scholar] [CrossRef] [PubMed]
- White Noise Soundscapes. City Traffic White Noise |10 Hours| For Sleeping, Studying or to Block Out Noise. Available online: https://www.youtube.com/watch?v=8s5H76F3SIs (accessed on 25 December 2020).
- Lu, X.; Guiraud, D.; Renaux, S.; Similowski, T.; Azevedo, C. Breathing detection from tracheal sounds in both temporal and frequency domains in the context of phrenic nerve stimulation. In Proceedings of the 2019 41st Annual International Conference of the IEEE Engineering in Medicine and Biology Society (EMBC), Berlin, Germany, 23–27 July 2019; pp. 5473–5476. [Google Scholar] [CrossRef]
- Lu, X.; Guiraud, D.; Renaux, S.; Similowski, T.; Azevedo Coste, C.; Azevedo, C. Monitoring phrenic nerve stimulation-induced breathing via tracheal sounds. In Proceedings of the 2019 XXIII Annual Conference of the International Functional Electrical Stimulation Society (IFESS), Toronto, ON, Canada, 24–28 June 2019. [Google Scholar]
- Penzel, T.; Sabil, A.K. The use of tracheal sounds for the diagnosis of sleep apnoea. Breathe 2017, 13, e37–e45. [Google Scholar] [CrossRef] [PubMed]
- Liang, H.; Lukkarinen, S.; Hartimo, I. Heart sound segmentation algorithm based on heart sound envelogram. In Proceedings of the Computers in Cardiology, Lund, Sweden, 7–10 September 1997; Volume 24, pp. 105–108. [Google Scholar] [CrossRef]
- Plapous, C.; Marro, C.; Scalart, P. Improved signal-to-noise ratio estimation for speech enhancement. IEEE Trans. Audio Speech Lang. Process. 2006, 14, 2098–2108. [Google Scholar] [CrossRef]
- Ozkan, I.; Member, S.; Yilmaz, A.; Celebi, G. Improved Segmentation with Dynamic Threshold Adjustment for Phonocardiography Recordings. In Proceedings of the 2019 41st Annual International Conference of the IEEE Engineering in Medicine and Biology Society (EMBC), Berlin, Germany, 23–27 July 2019; pp. 6681–6684. [Google Scholar]


| State of | Explication | Conditions |
|---|---|---|
| 0 | Pause/apnea | |
| 1 | Inspiration/Expiration | |
| 2 | Speech/Snoring |
| State of | Explication | Conditions |
|---|---|---|
| 0 | Pause/apnea | |
| 1 | Inspiration/Expiration | |
| 2 | Speech/Snoring |
| State of | Explication | Conditions |
|---|---|---|
| −1 | expiration | |
| 1 | Inspiration | |
| 0 | Pause/apnea | s s |
| 2 | Speech/Snoring |
| Detection Domain | Median Comparison | p-Value |
|---|---|---|
| Temporal | Specificity | p = 0.0966 |
| sensitivity | p = 0.8829 | |
| Accuracy | p = 0.3638 | |
| Frequency | Specificity | p = 0.0088 * |
| sensitivity | p = 0.2032 | |
| Accuracy | p = 0.1219 | |
| Cardiac (PDR) | Specificity | p = 0.016 * |
| sensitivity | p = 0.7369 | |
| Accuracy | p = 0.0851 |
| Median Comparison | p-Value |
|---|---|
| Specificity | p = 0.2079 |
| sensitivity | p = 0.7354 |
| Accuracy | p = 1 |
| Median Comparison | Detection Domain | p-Value |
|---|---|---|
| Specificity | Temporal | p = 0.00889 * |
| Frequency | p = 0.01489 * | |
| Cardiac | p = 9.896 × 10 * | |
| Sensitivity | Temporal | p = 0.09933 |
| Frequency | p = 0.6348 | |
| Cardiac | p = 0.001801 * | |
| Accuracy | Temporal | p = 0.8417 |
| Frequency | p = 0.8028 | |
| Cardiac | p = 0.2079 |
Publisher’s Note: MDPI stays neutral with regard to jurisdictional claims in published maps and institutional affiliations. |
© 2020 by the authors. Licensee MDPI, Basel, Switzerland. This article is an open access article distributed under the terms and conditions of the Creative Commons Attribution (CC BY) license (http://creativecommons.org/licenses/by/4.0/).
Share and Cite
Lu, X.; Azevedo Coste, C.; Nierat, M.-C.; Renaux, S.; Similowski, T.; Guiraud, D. Respiratory Monitoring Based on Tracheal Sounds: Continuous Time-Frequency Processing of the Phonospirogram Combined with Phonocardiogram-Derived Respiration. Sensors 2021, 21, 99. https://doi.org/10.3390/s21010099
Lu X, Azevedo Coste C, Nierat M-C, Renaux S, Similowski T, Guiraud D. Respiratory Monitoring Based on Tracheal Sounds: Continuous Time-Frequency Processing of the Phonospirogram Combined with Phonocardiogram-Derived Respiration. Sensors. 2021; 21(1):99. https://doi.org/10.3390/s21010099
Chicago/Turabian StyleLu, Xinyue, Christine Azevedo Coste, Marie-Cécile Nierat, Serge Renaux, Thomas Similowski, and David Guiraud. 2021. "Respiratory Monitoring Based on Tracheal Sounds: Continuous Time-Frequency Processing of the Phonospirogram Combined with Phonocardiogram-Derived Respiration" Sensors 21, no. 1: 99. https://doi.org/10.3390/s21010099
APA StyleLu, X., Azevedo Coste, C., Nierat, M.-C., Renaux, S., Similowski, T., & Guiraud, D. (2021). Respiratory Monitoring Based on Tracheal Sounds: Continuous Time-Frequency Processing of the Phonospirogram Combined with Phonocardiogram-Derived Respiration. Sensors, 21(1), 99. https://doi.org/10.3390/s21010099