Noninvasive Monitoring of Dynamical Processes in Bruised Human Skin Using Diffuse Reflectance Spectroscopy and Pulsed Photothermal Radiometry


Abstract
1. Introduction
2. Materials and Methods
2.1. Human Volunteers
2.2. Experimental Procedures
2.3. Optical Model of Intact Skin
2.4. Optical Model of the Bruise
2.5. Numerical Modeling of Light-Tissue Interaction
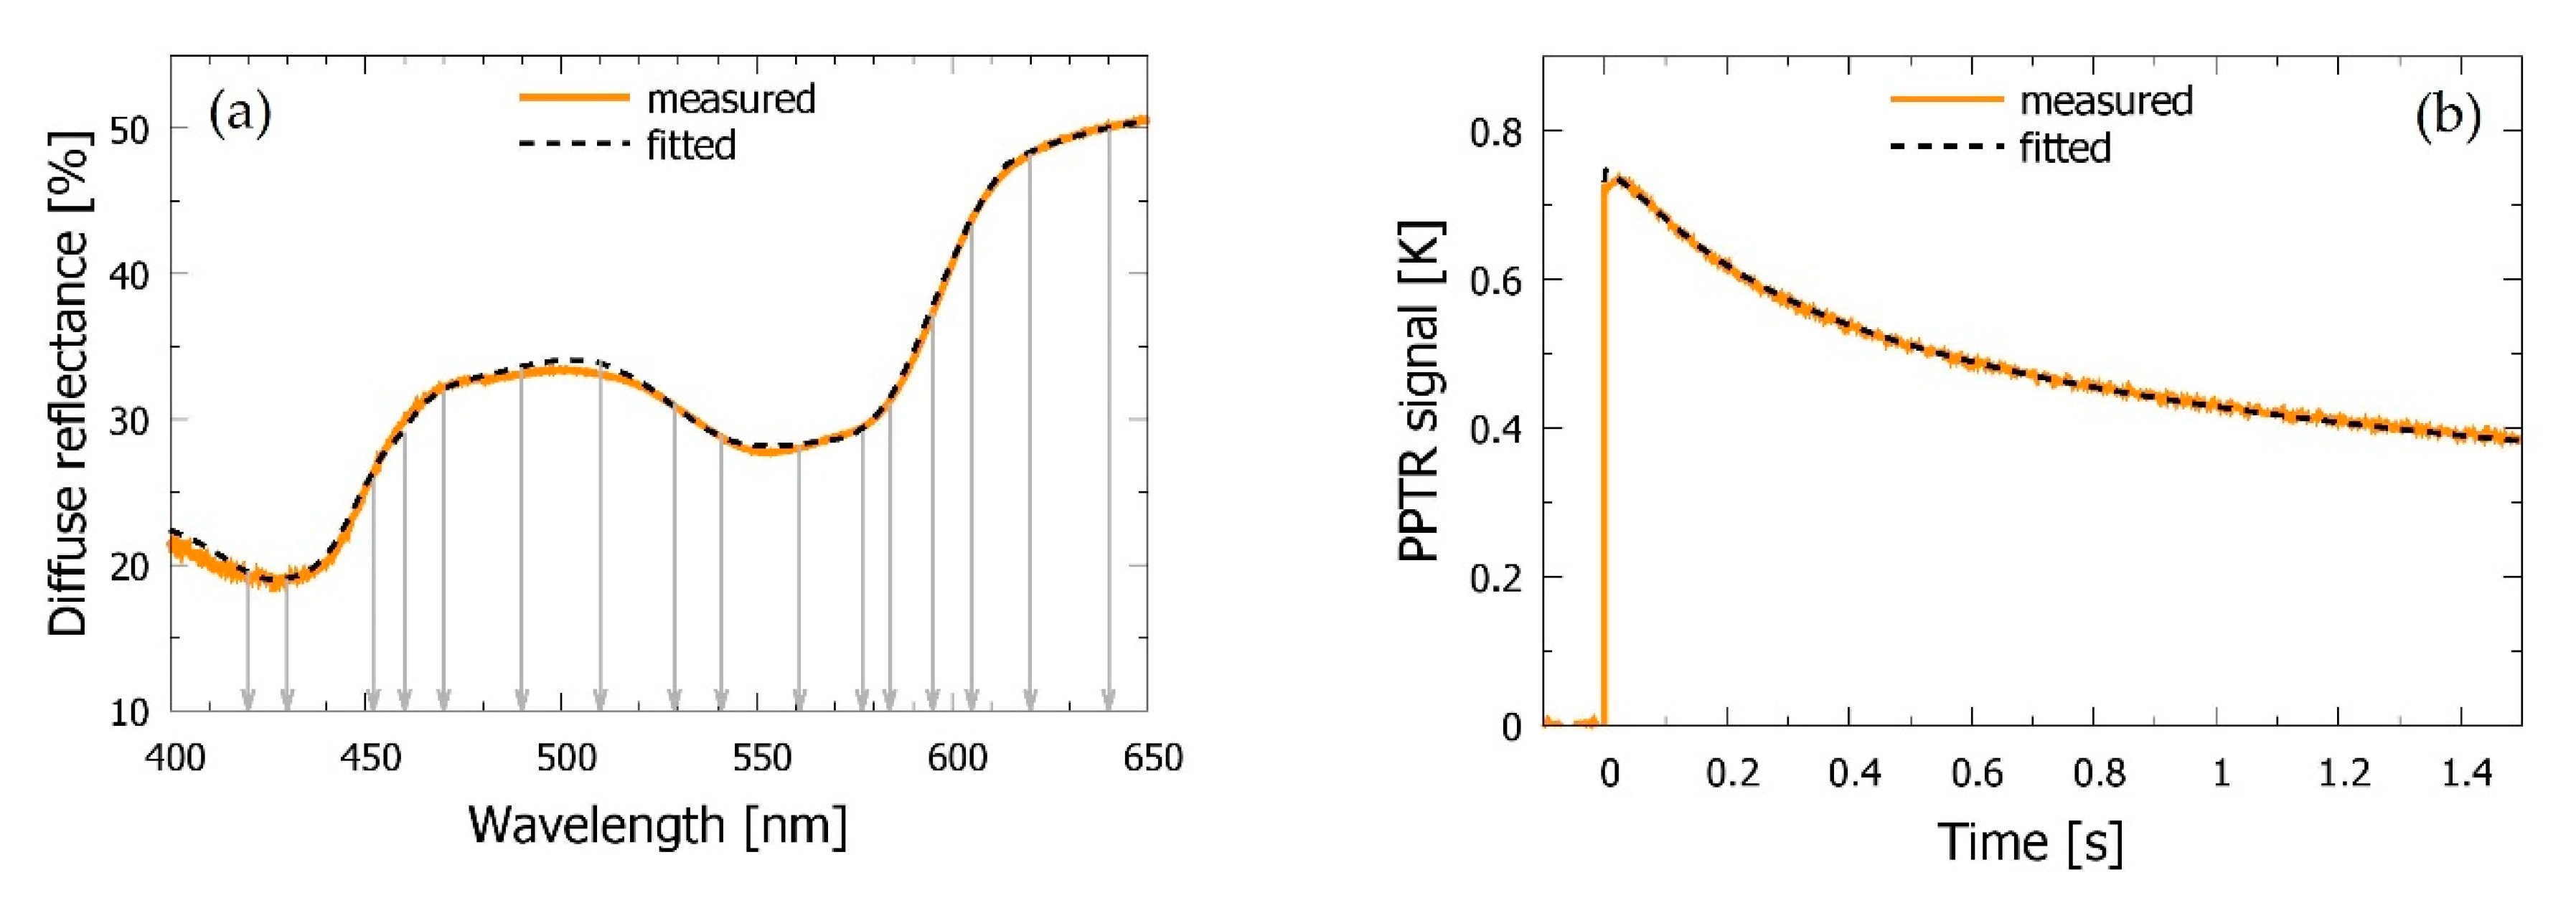
2.6. Assessment of Skin Properties by Inverse Monte Carlo Technique (IMC)
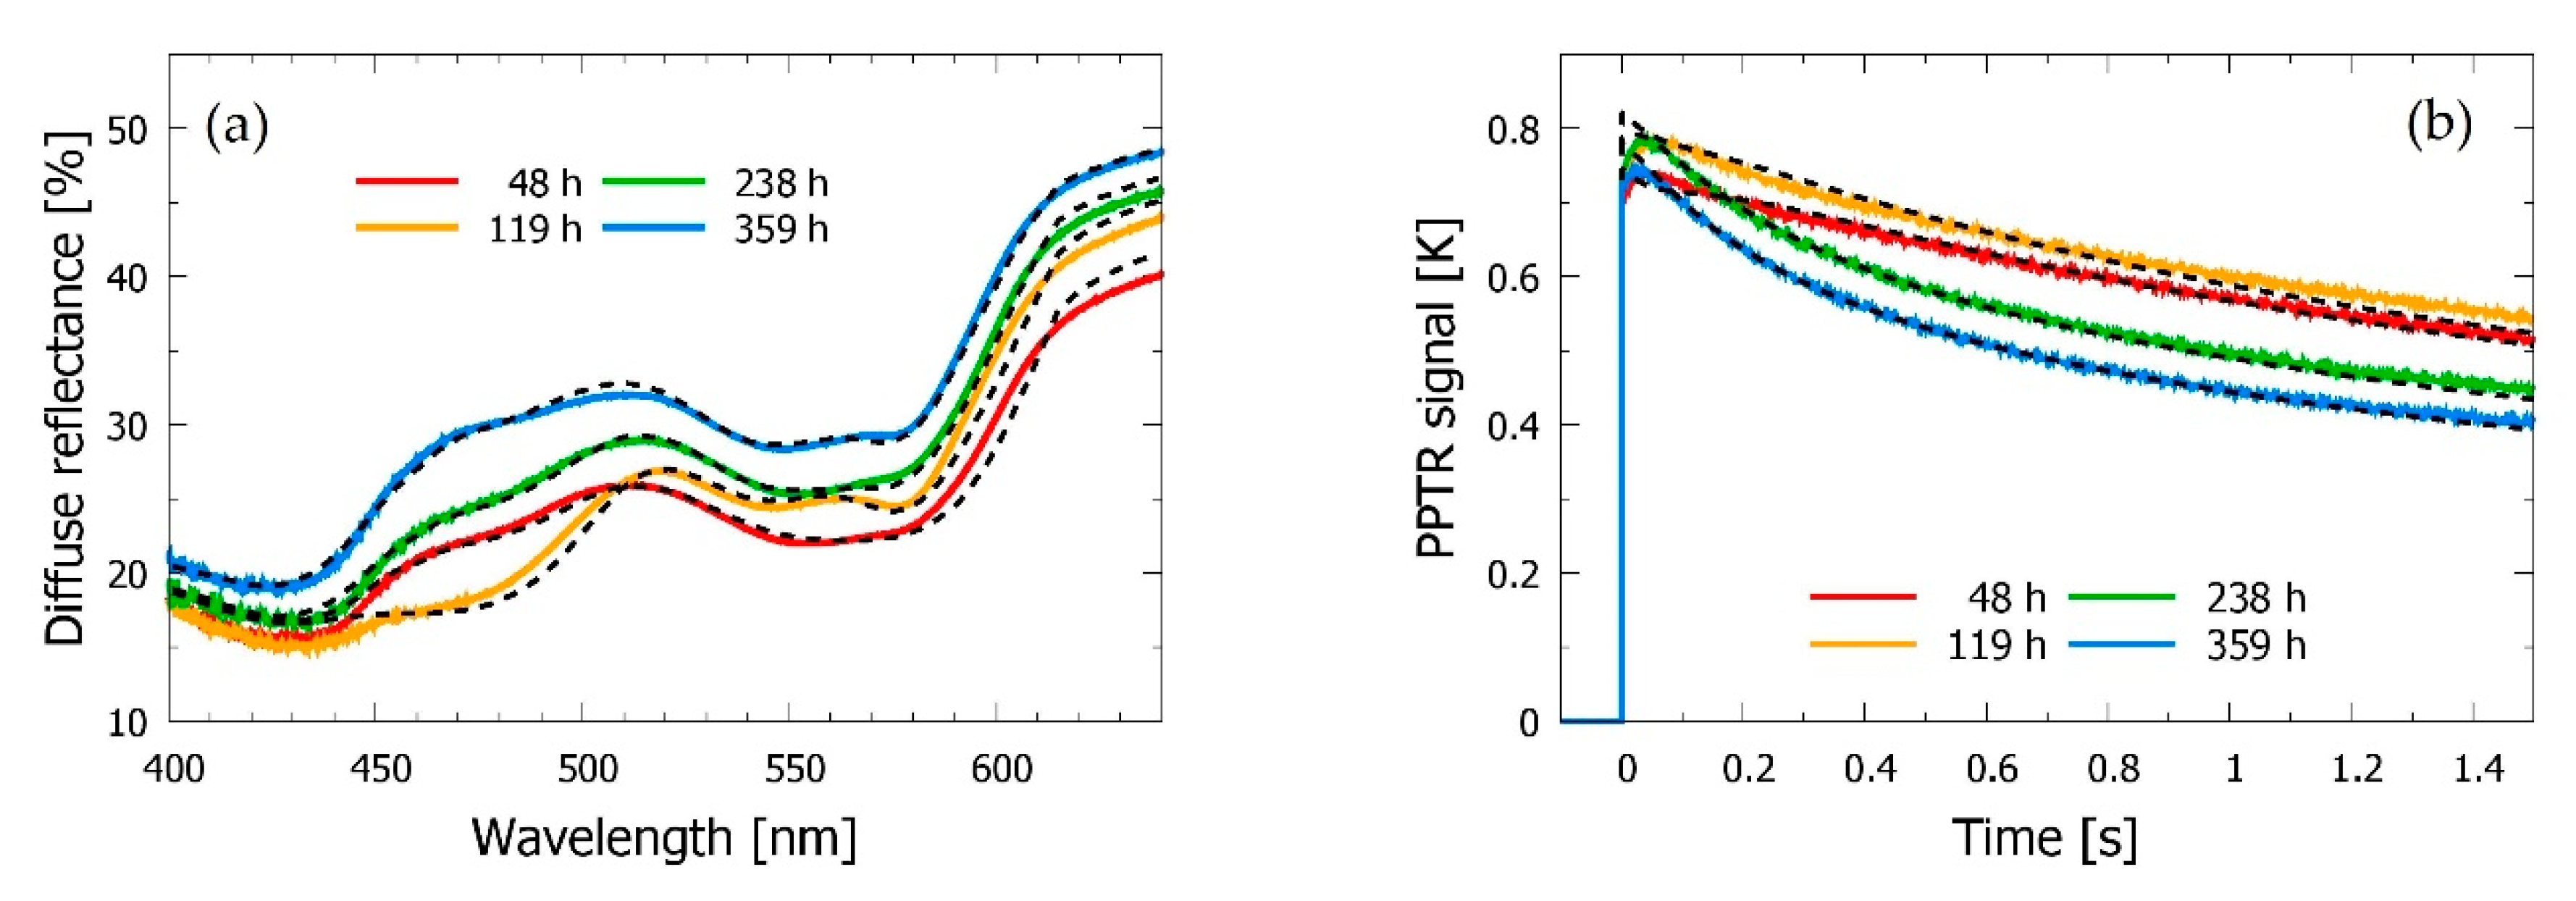
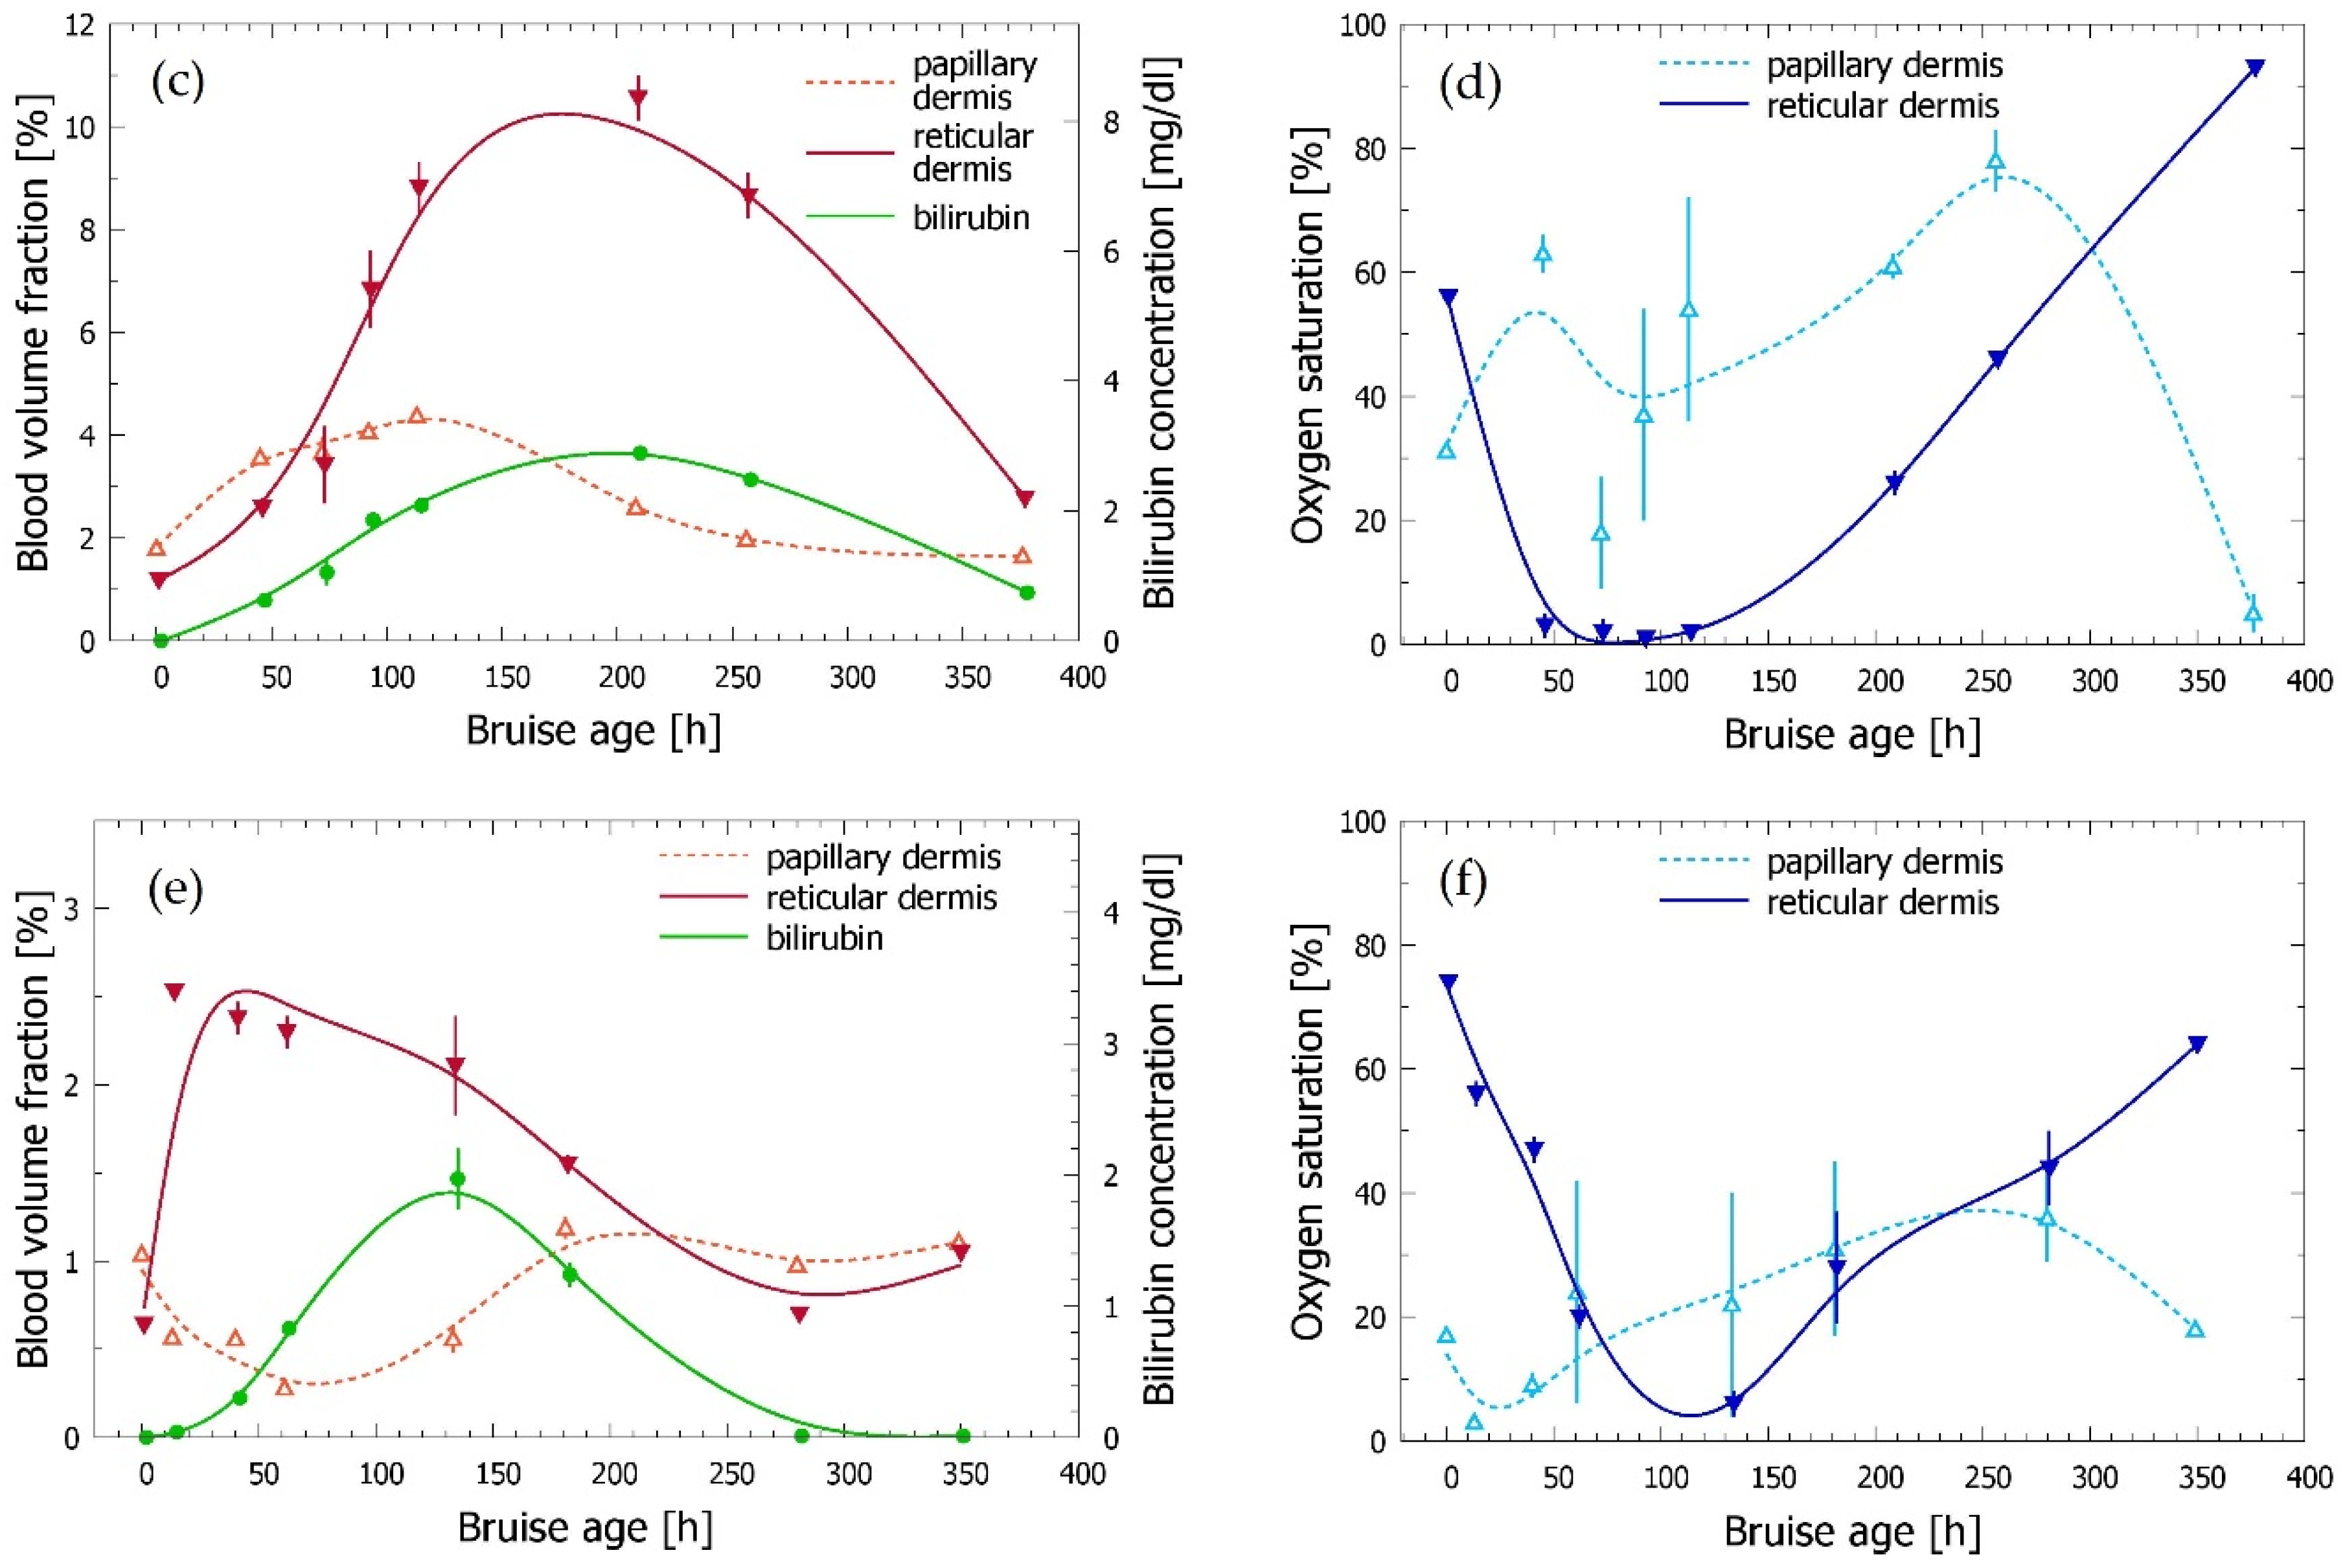
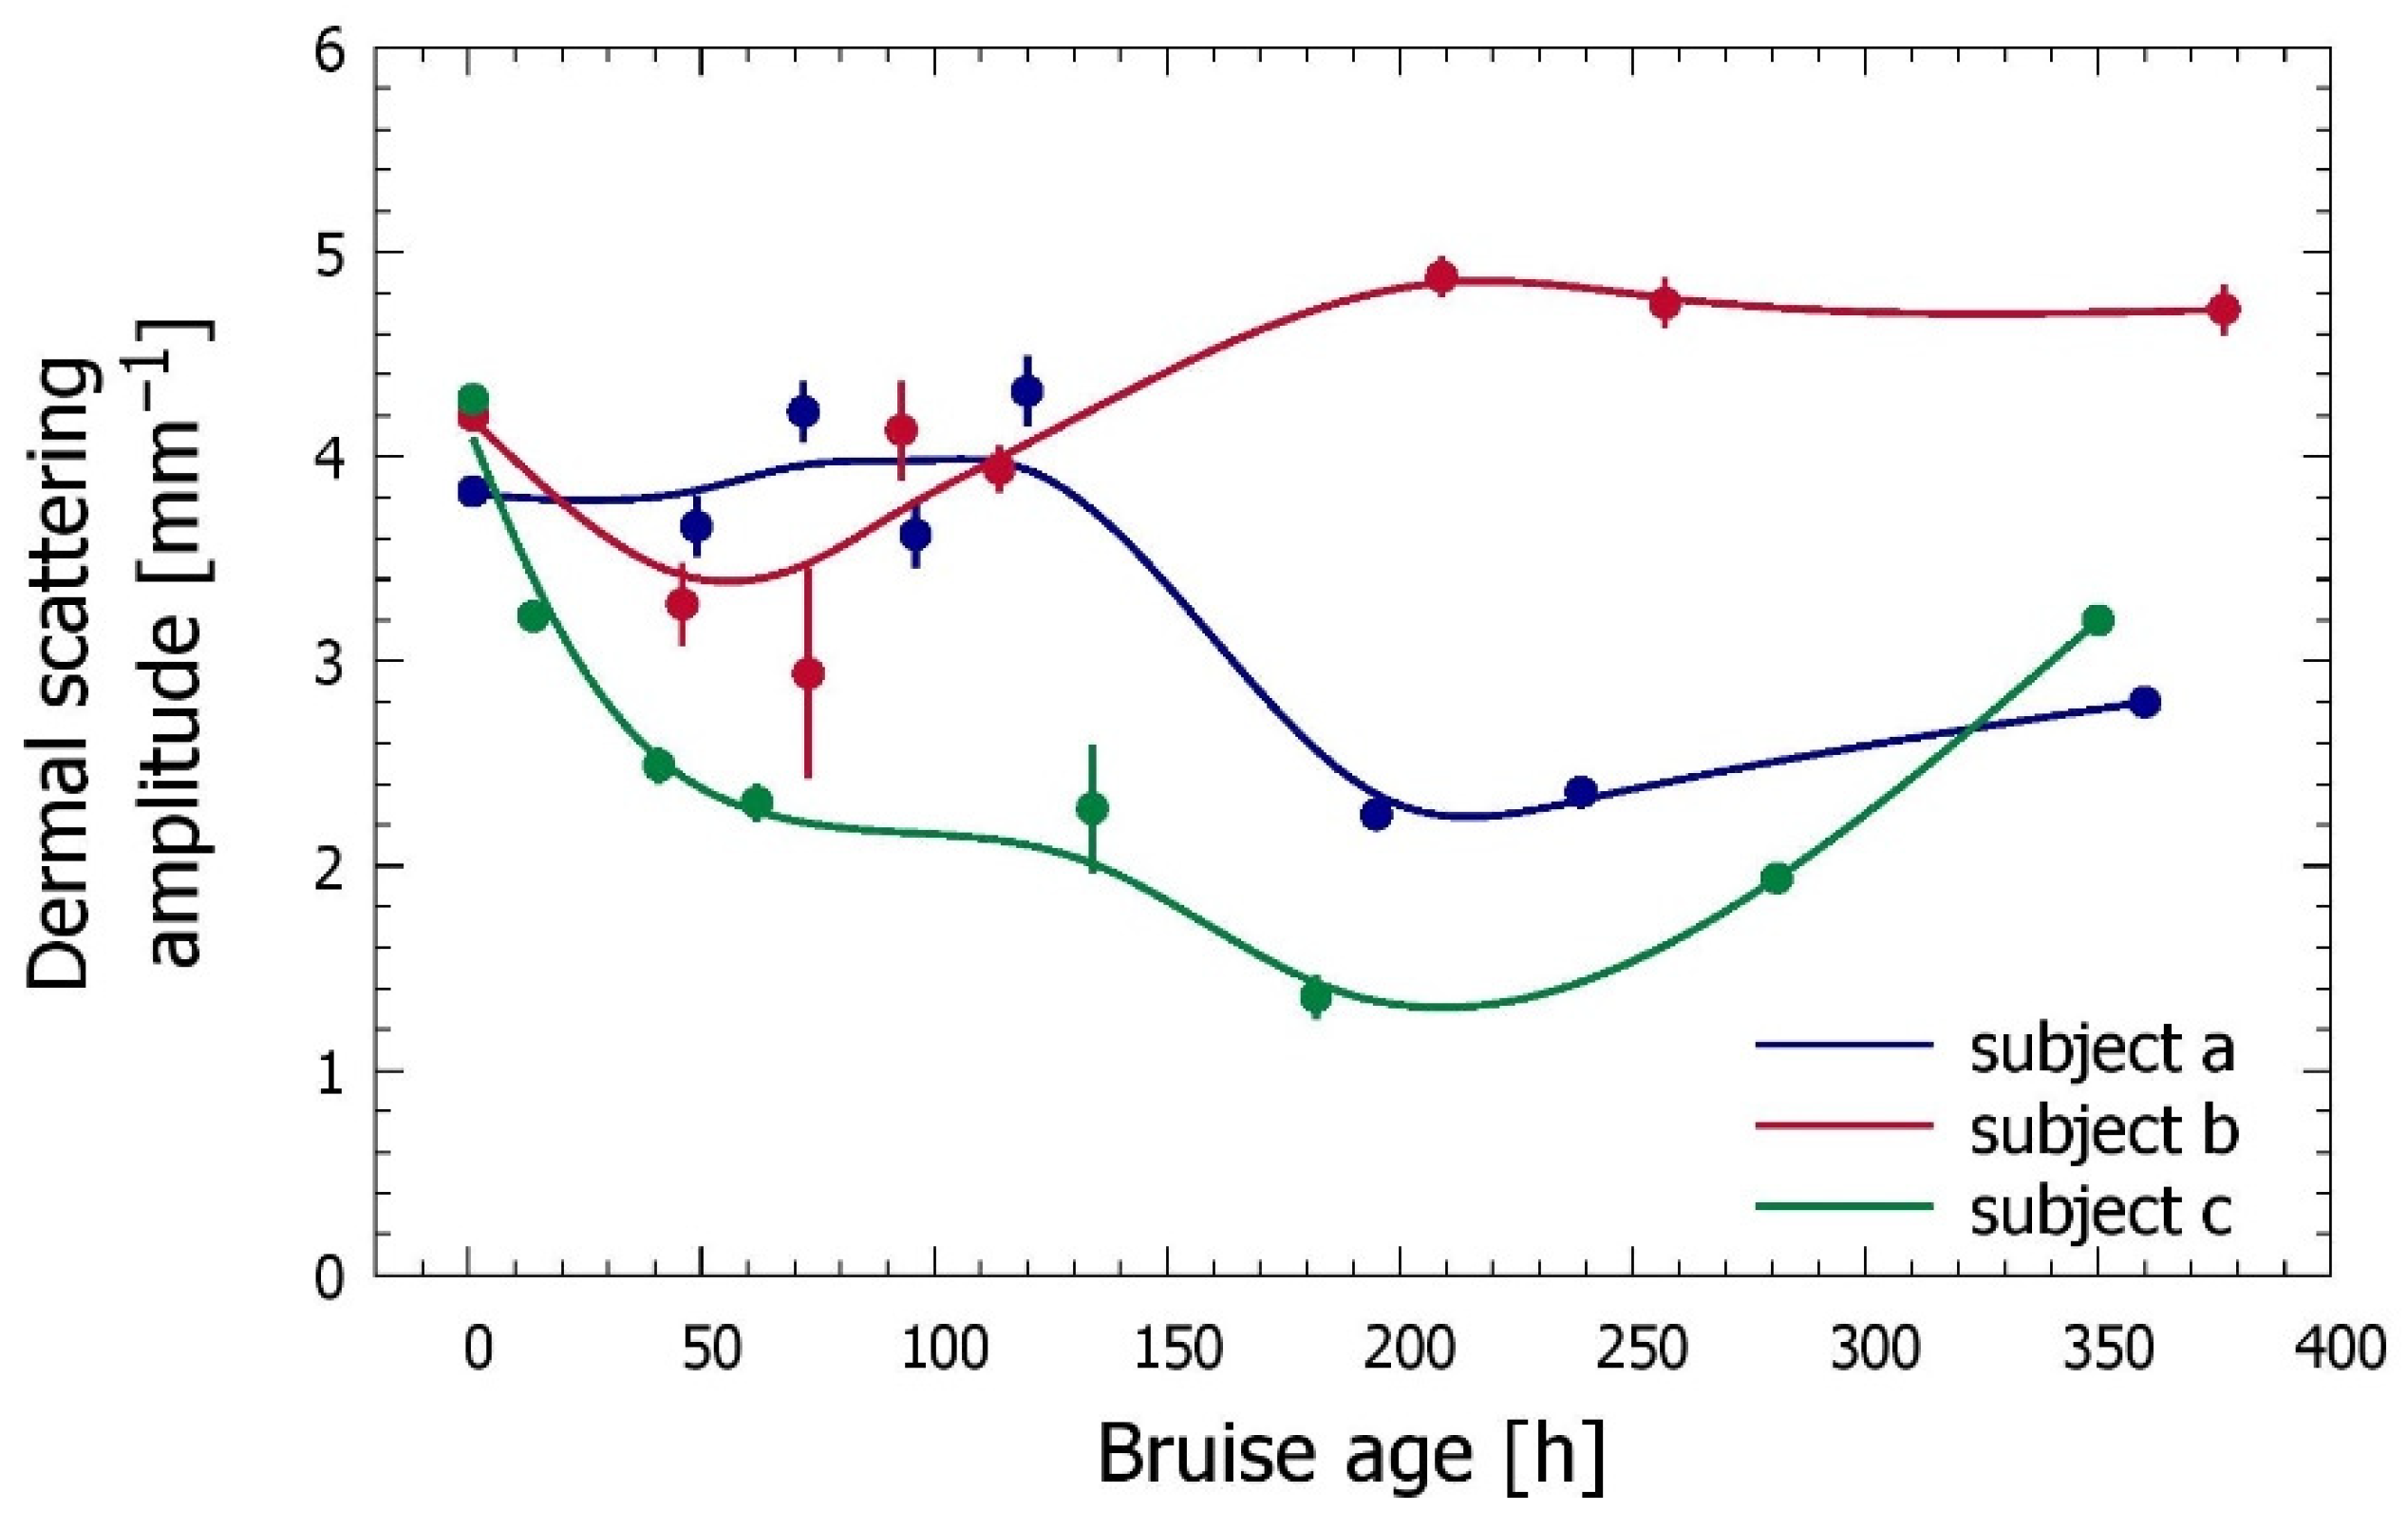
3. Results
3.1. Intact Skin
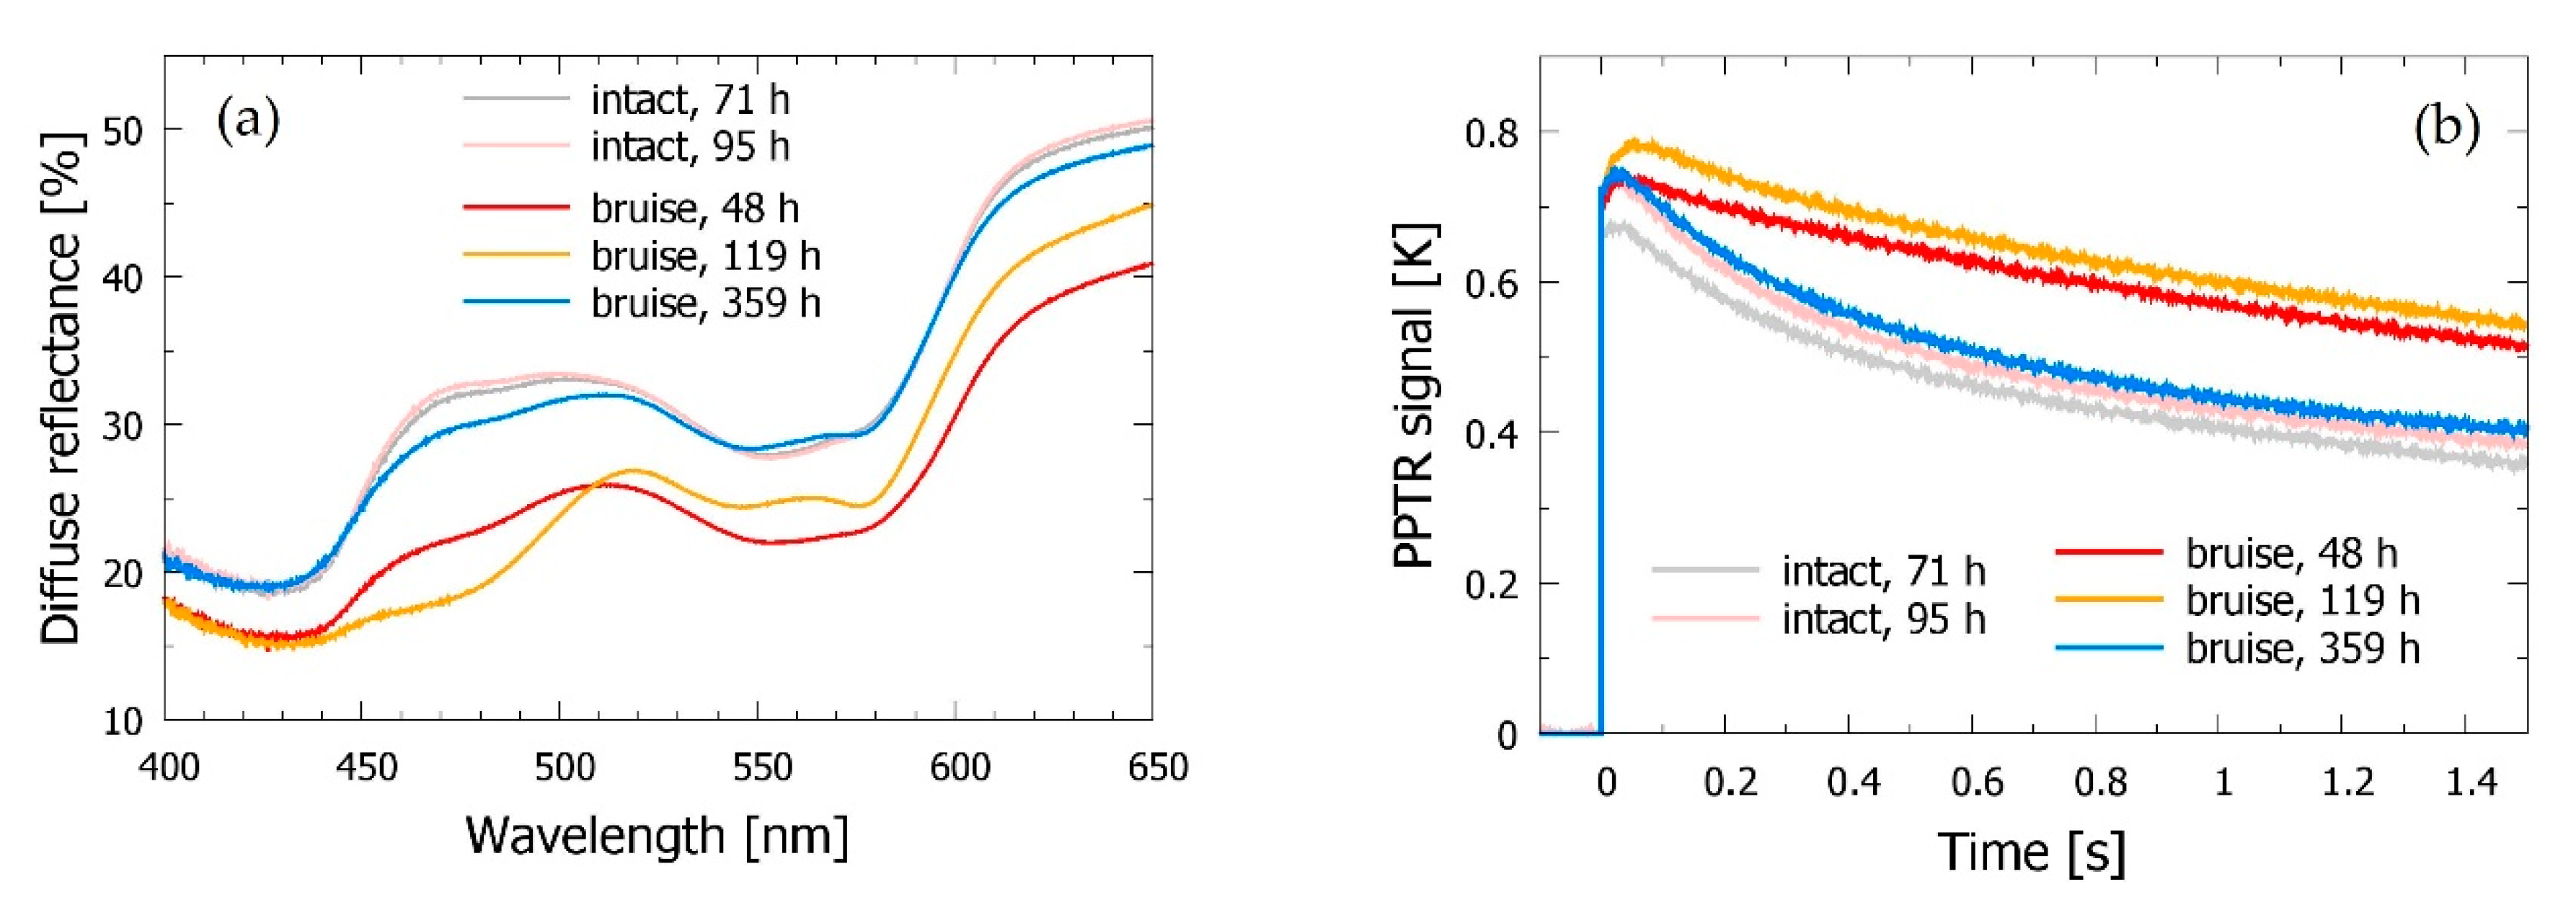
3.2. Bruised Skin
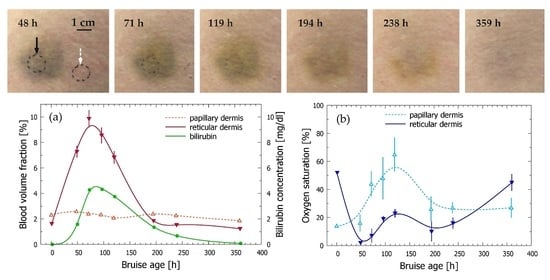
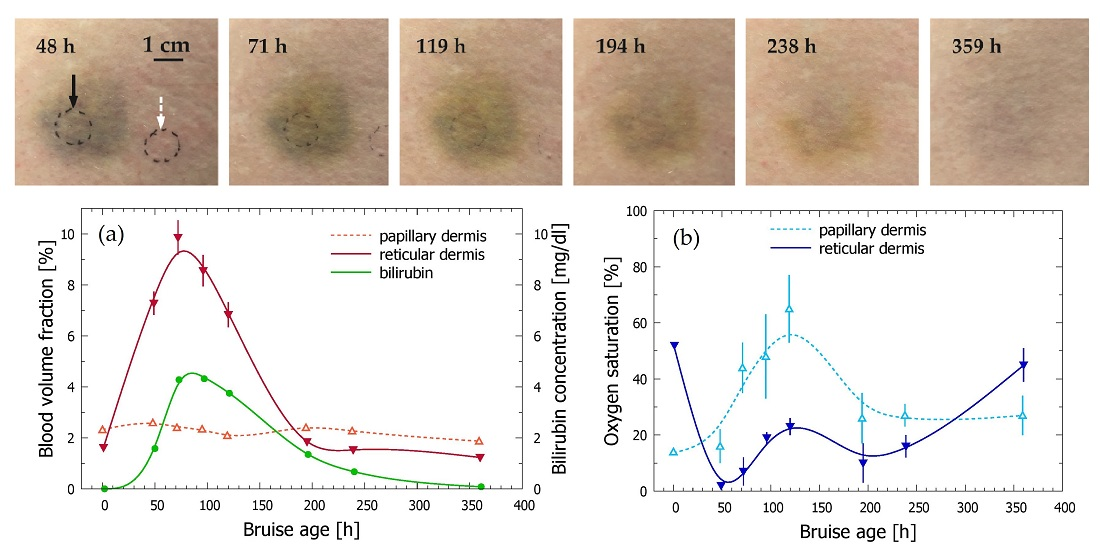
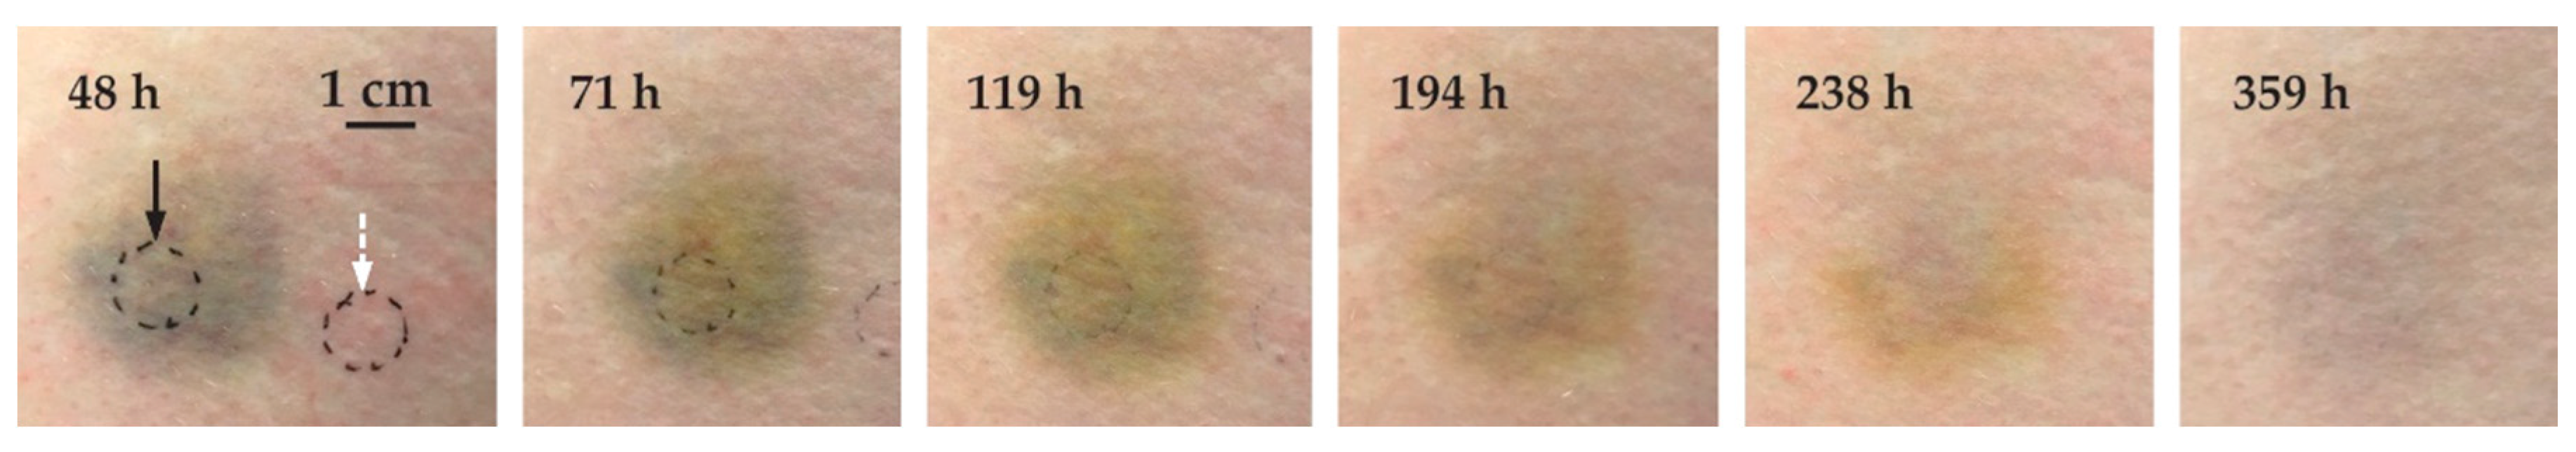
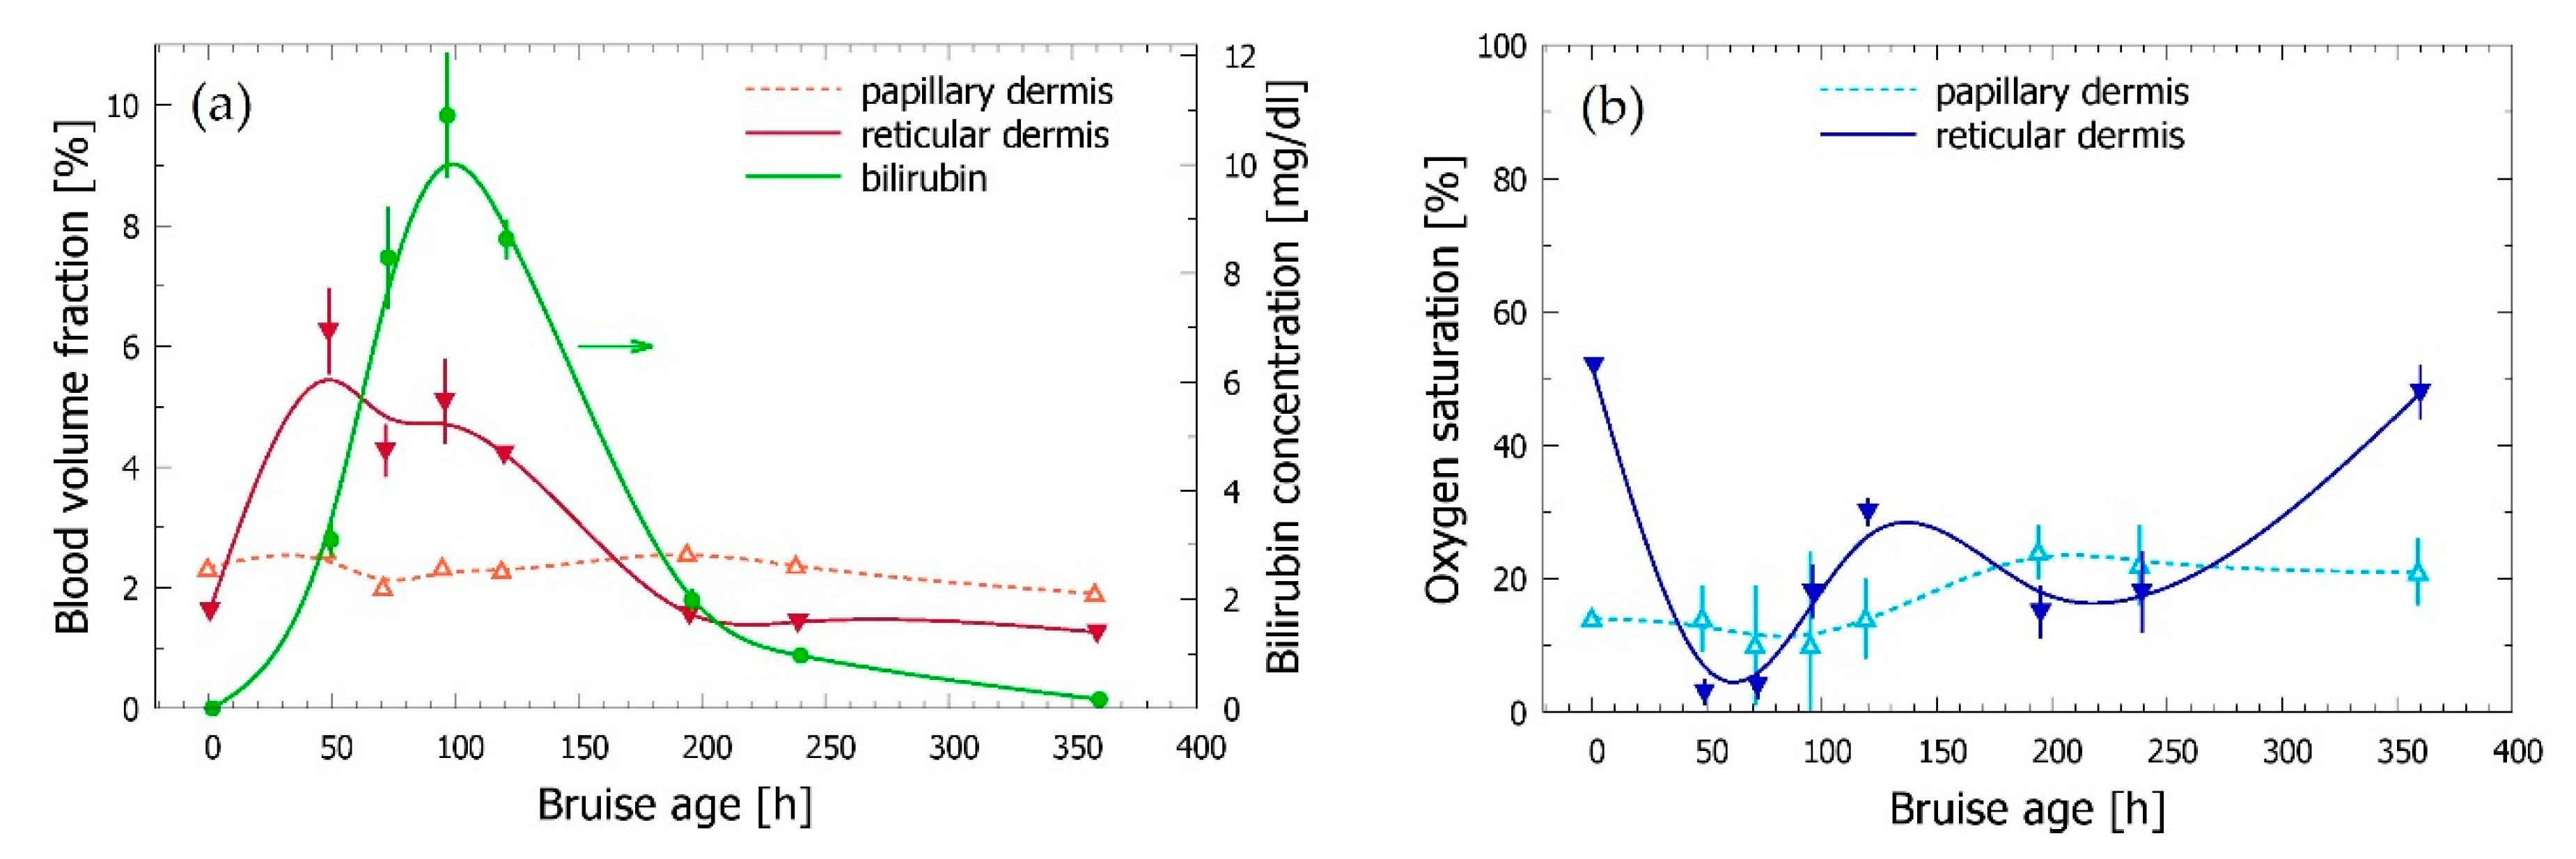
3.3. Time Evolution of the Bruise
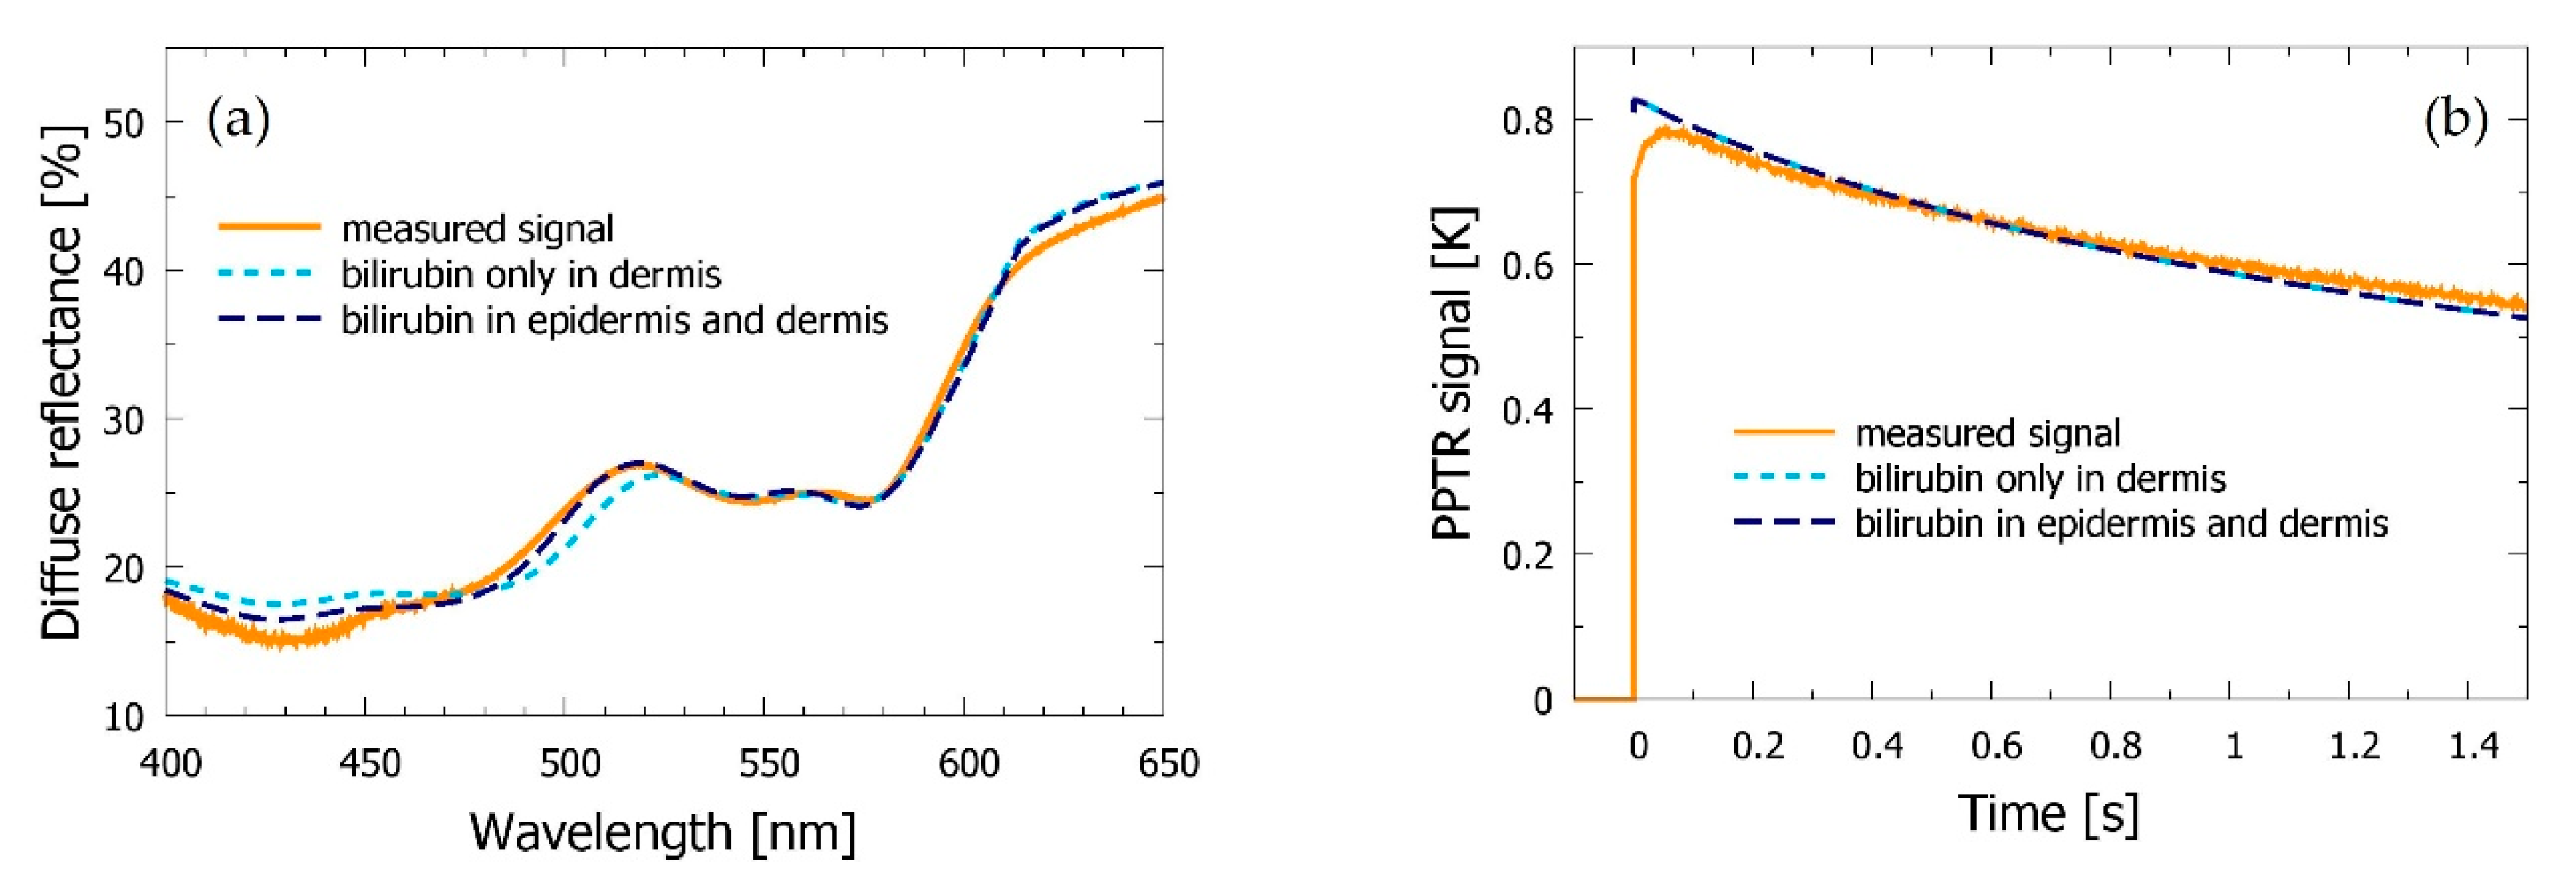
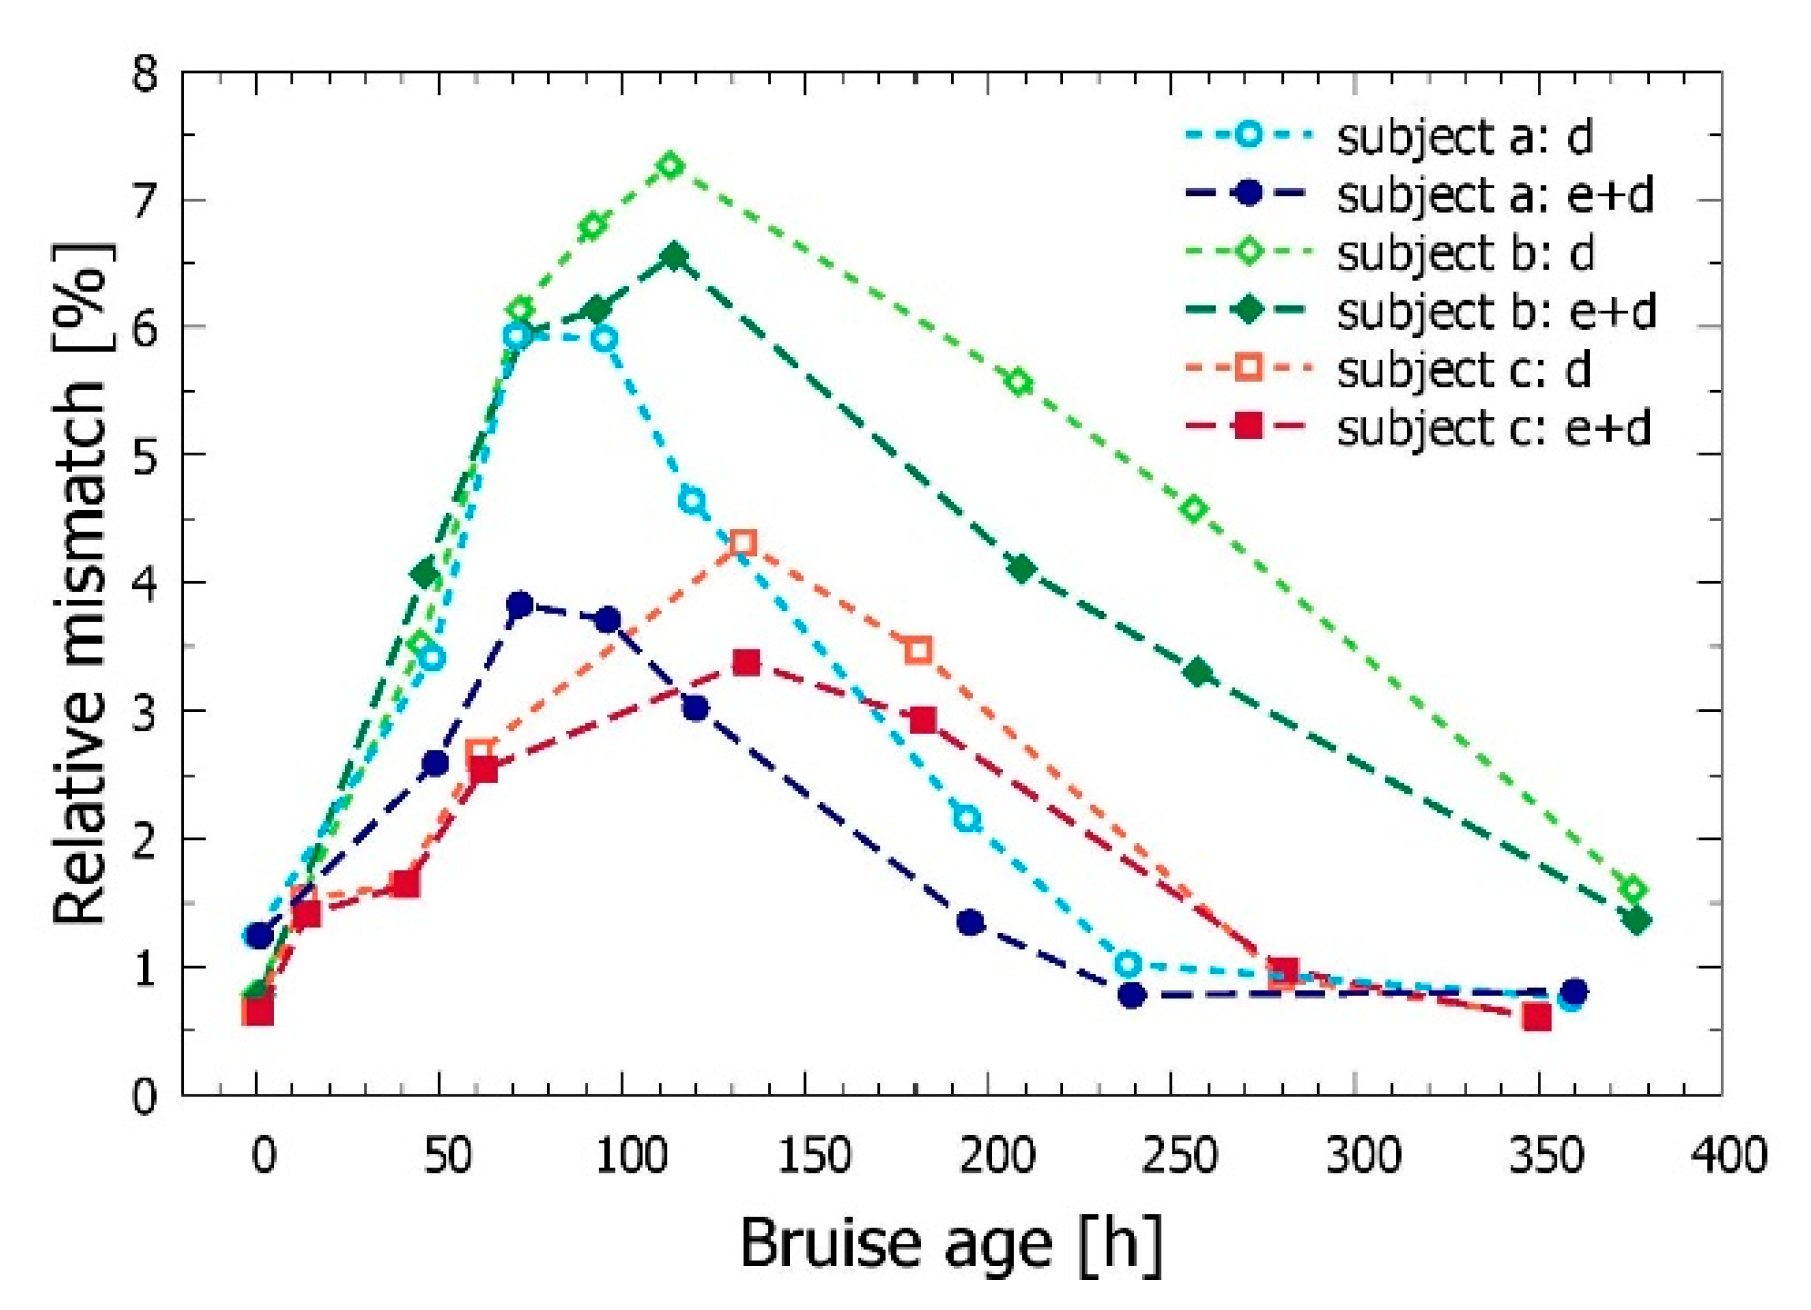
3.4. Bilirubin Allowed in Both Epidermis and Dermis
4. Discussion
5. Conclusions
Author Contributions
Funding
Institutional Review Board Statement
Informed Consent Statement
Data Availability Statement
Acknowledgments
Conflicts of Interest
References
- Langlois, N.; Gresham, G. The Ageing of Bruises: A Review and Study of the Colour Changes with Time. Forensic Sci. Int. 1991, 50, 227–238. [Google Scholar] [CrossRef]
- Stephenson, T.; Bialas, Y. Estimation of the Age of Bruising. Arch. Dis. Child. 1996, 74, 53–55. [Google Scholar] [CrossRef][Green Version]
- Grossman, S.; Johnston, A.; Vanezis, P.; Perrett, D. Can We Assess the Age of Bruises? An Attempt to Develop an Objective Technique. Med. Sci. Law 2011, 51, 170–176. [Google Scholar] [CrossRef]
- Scafide, K.N.; Sheridan, D.J.; Campbell, J.; DeLeon, V.B.; Hayat, M.J. Evaluating Change in Bruise Colorimetry and The Effect of Subject Characteristics Over Time. Forensic Sci. Med. Pathol. 2013, 9, 367–376. [Google Scholar] [CrossRef] [PubMed]
- Mesli, V.; Le Garff, E.; Marchand, E.; Labreuche, J.; Ramdane, N.; Maynou, C.; Delannoy, Y.; Hédouin, V. Determination of the Age of Bruises Using a Bilirubinometer. Forensic Sci. Int. 2019, 302, 109831. [Google Scholar] [CrossRef] [PubMed]
- Hughes, V.K.; Ellis, P.S.; Burt, T.; Langlois, N. The Practical Application of Reflectance Spectrophotometry for the Demonstration of Haemoglobin and its Degradation in Bruises. J. Clin. Pathol. 2004, 57, 355–359. [Google Scholar] [CrossRef]
- Randeberg, L.L.; Haugen, O.A.; Haaverstad, R.; Svaasand, L.O. A Novel Approach to Age Determination of Traumatic Injuries by Reflectance Spectroscopy. Lasers Surg. Med. 2006, 38, 277–289. [Google Scholar] [CrossRef]
- Kim, O.; McMurdy, J.; Lines, C.; Duffy, S.; Crawford, G.; Alber, M. Reflectance spectrometry of Normal and Bruised Human Skins: Experiments and modeling. Physiol. Meas. 2012, 33, 159–175. [Google Scholar] [CrossRef]
- Black, H.I.; Coupaud, S.; Nic Daéid, N.; Riches, P. On the Relationships between Applied Force, Photography Technique, and the Quantification of Bruise Appearance. Forensic Sci. Int. 2019, 305, 109998. [Google Scholar] [CrossRef]
- Tirado, J.; Mauricio, D. Bruise Dating Using Deep Learning. J. Forensic Sci. 2020. [Google Scholar] [CrossRef]
- Randeberg, L.L.; Larsen, E.L.P.; Svaasand, L.O. Characterization of Vascular Structures and Skin Bruises Using Hyperspectral Imaging, Image Analysis and Diffusion Theory. J. Biophotonics 2009, 3, 53–65. [Google Scholar] [CrossRef] [PubMed]
- Stam, B.; Van Gemert, M.J.C.; Van Leeuwen, T.G.; Teeuw, A.H.; Van Der Wal, A.C.; Aalders, M.C.G. Can Color Inhomogeneity of bruises be Used to Establish Their Age? J. Biophotonics 2011, 4, 759–767. [Google Scholar] [CrossRef]
- Bydlon, T.M.; Nachabe, R.; Ramanujam, N.; Sterenborg, H.J.C.M.; Hendriks, B.H.W. Chromophore Based Analyses of Steady-State Diffuse Reflectance Spectroscopy: Current Status and Perspectives for Clinical Adoption. J. Biophotonics 2014, 8, 9–24. [Google Scholar] [CrossRef] [PubMed]
- Vidovič, L.; Milanič, M.; Randeberg, L.L.; Majaron, B. Quantitative Characterization of Traumatic Bruises by Combined Pulsed Photothermal Radiometry and Diffuse Reflectance Spectroscopy. In Proceedings of the Photonic Therapeutics and Diagnostics XI, SPIE-Intl Soc Optical Eng, San Francisco, CA, USA, 26 February 2015; Volume 930307. [Google Scholar]
- Naglič, P.; Vidovič, L.; Milanič, M.; Randeberg, L.L.; Majaron, B. Suitability of Diffusion Approximation for an Inverse Analysis of Diffuse Reflectance Spectra from Human Skin In Vivo. OSA Contin. 2019, 2, 905–922. [Google Scholar] [CrossRef]
- Milanič, M.; Serša, I.; Majaron, B. A Spectrally composite Reconstruction Approach for Improved Resolution of Pulsed Photothermal Temperature Profiling in Water-Based Samples. Phys. Med. Biol. 2009, 54, 2829–2844. [Google Scholar] [CrossRef] [PubMed]
- Li, B.; Majaron, B.; Viator, J.A.; Milner, T.E.; Chen, Z.; Zhao, Y.; Ren, H.; Nelson, J.S. Accurate Measurement of Blood Vessel Depth in Port wine Stained Human Skin In Vivo Using Pulsed Photothermal Radiometry. J. Biomed. Opt. 2004, 9, 961–966. [Google Scholar] [CrossRef] [PubMed]
- Vidovič, L.; Milanič, M.; Majaron, B. Objective Characterization of Bruise Evolution Using Photothermal Depth Profiling and Monte Carlo Modeling. J. Biomed. Opt. 2015, 20, 017001. [Google Scholar] [CrossRef] [PubMed]
- Verdel, N.; Marin, A.; Milanič, M.; Majaron, B. Physiological and Structural Characterization of Human Skin In Vivo Using Combined Photothermal Radiometry and Diffuse Reflectance Spectroscopy. Biomed. Opt. Express 2019, 10, 944–960. [Google Scholar] [CrossRef]
- Verdel, N.; Lentsch, G.; Balu, M.; Tromberg, B.J.; Majaron, B. Noninvasive Assessment of Skin Structure by Combined Photothermal Radiometry and Optical Spectroscopy: Coregistration with Multiphoton Microscopy. Appl. Opt. 2018, 57, D117–D122. [Google Scholar] [CrossRef]
- Verdel, N.; Majaron, B. Objective Noninvasive Monitoring of Laser Tattoo Removal in a Human Volunteer: A Proof of Principle Study. In Proceedings of the Third International Conference Biophotonics Riga 2020, Riga, Latvia, 24–25 August 2020; Volume 11585. [Google Scholar]
- Marin, A.; Milanič, M.; Verdel, N.; Vidovič, L.; Majaron, B. Dynamics of Controllably Induced Bruises Assessed by Diffuse Reflectance Spectroscopy and Pulsed Photothermal Radiometry. In Proceedings of the SPIE BiOS, 2018, San Francisco CA, USA, 27 January–1 February 2018; Volume 10467. [Google Scholar]
- Marin, A.; Verdel, N.; Milanič, M.; Majaron, B. Influence of Healthy Skin Baseline on Bruise Dynamics Parameters as Assessed by Optical methods. In Proceedings of the European Conferences on Biomedical Optics, Munich, Germany, 21–25 June 2019; Volume 11075. [Google Scholar]
- Jacobi, U.; Weigmann, H.-J.; Ulrich, J.; Sterry, W.; Lademann, J. Estimation of the Relative Stratum Corneum Amount Removed by Tape Stripping. Ski. Res. Technol. 2005, 11, 91–96. [Google Scholar] [CrossRef]
- Vidovič, L.; Majaron, B. Elimination of Single-Beam Substitution Error in Diffuse Reflectance Measurements Using an Integrating Sphere. J. Biomed. Opt. 2014, 19, 27006. [Google Scholar] [CrossRef] [PubMed]
- Milanič, M.; Cenian, A.; Verdel, N.; Cenian, W.; Stergar, J.; Majaron, B. Temperature Depth Profiles Induced in Human Skin In Vivo Using Pulsed 975 nm Irradiation. Lasers Surg. Med. 2019, 51, 774–784. [Google Scholar] [CrossRef] [PubMed]
- ALIA. ANSI Z136 Standards. Available online: https://www.lia.org/resources/laser-safety-information/laser-safety-standards/ansi-z136-standards (accessed on 18 December 2020).
- Jacques, S.L. Optical Properties of Biological Tissues: A review. Phys. Med. Biol. 2013, 58, R37–R61. [Google Scholar] [CrossRef] [PubMed]
- Meinke, M.C.; Müller, G.; Helfmann, J.; Friebel, M. Empirical Model Functions to Calculate Hematocrit-Dependent Optical Properties of Human Blood. Appl. Opt. 2007, 46, 1742–1753. [Google Scholar] [CrossRef] [PubMed]
- Ermakov, I.V.; Ermakova, M.; Sharifzadeh, M.; Gorusupudi, A.; Farnsworth, K.; Bernstein, P.S.; Stookey, J.D.; Evans, J.; Arana, T.; Tao-Lew, L.; et al. Optical Assessment of Skin Carotenoid Status as a Biomarker of Vegetable and Fruit Intake. Arch. Biochem. Biophys. 2018, 646, 46–54. [Google Scholar] [CrossRef] [PubMed]
- Simpsonyz, C.R.; Kohlyx, M.; Essenpreisk, M.; Cope, M. Near-Infrared Optical Properties of In Vivo Human Skin and Subcutaneous Tissues Measured Using the Monte Carlo Inversion Technique. Phys. Med. Biol. 1998, 43, 2465–2478. [Google Scholar] [CrossRef]
- Bashkatov, A.N.A.; Genina, E.I.; Kochubey, V.; Tuchin, V.V. Optical Properties of Human Skin, Subcutaneous and Mucous Tissues in the Wavelength Range from 400 to 2000 nm. J. Phys. D: Appl. Phys. 2005, 38, 2543–2555. [Google Scholar] [CrossRef]
- Langlois, N.E.I. The Science Behind the Quest to Determine the Age of Bruises—A Review of the English Language Literature. Forensic Sci. Med. Pathol. 2007, 3, 241–251. [Google Scholar] [CrossRef]
- Marin, A.; Verdel, N.; Majaron, B. Hemodynamics in Traumatic Bruises Assessed by Diffuse Reflectance Spectroscopy and Photothermal Radiometry. In Proceedings of the SPIE BiOS, San Francisco, CA, USA, 1–2 February 2020. [Google Scholar] [CrossRef]
- Wang, L.; Jacques, S.L.; Zheng, L. MCML—Monte Carlo Modeling of Light Transport in Multi-Layered Tissues. Comput. Methods Programs Biomed. 1995, 47, 131–146. [Google Scholar] [CrossRef]
- Alerstam, E.; Lo, W.C.Y.; Han, T.D.; Rose, J.; Andersson-Engels, S.; Lilge, L. Next-Generation Acceleration and Code Optimization for Light Transport in Turbid Media Using GPUs. Biomed. Opt. Express 2010, 1, 658–675. [Google Scholar] [CrossRef]
- Nedelec, B.; Forget, N.J.; Hurtubise, T.; Cimino, S.; De Muszka, F.; Legault, A.; Liu, W.L.; Oliveira, A.C.M.T.G.; Calva, V.A.; Correa, J. Skin Characteristics: Normative Data for Elasticity, Erythema, Melanin, and Thickness at 16 Different Anatomical Locations. Ski. Res. Technol. 2015, 22, 263–275. [Google Scholar] [CrossRef] [PubMed]
- McMurdy, J.W.; Duffy, S.; Crawford, G.P. Monitoring Bruise Age Using Visible Diffuse Reflectance Spectroscopy. In Proceedings of the SPIE BiOS, San Jose, CA, USA, 20–25 January 2007. [Google Scholar]
- Yajima, Y.; Funayama, M. Spectrophotometric and Tristimulus Analysis of the Colors of Subcutaneous Bleeding in Living Persons. Forensic Sci. Int. 2006, 156, 131–137. [Google Scholar] [CrossRef] [PubMed]
- Bissett, D. Anatomy and Biochemistry of Skin. In Transdermal Delivery of Drugs; Kydonieus, A.F., Berner, B., Eds.; CRC Press Inc.: Boca Raton, FL, USA, 1987; Volume I, p. 160. [Google Scholar]
- Andrews, S.N.; Jeong, E.; Prausnitz, M.R. Transdermal Delivery of Molecules is Limited by Full Epidermis, Not Just Stratum Corneum. Pharm. Res. 2013, 30, 1099–1109. [Google Scholar] [CrossRef] [PubMed]
- Kapoor, C.L.; Murti, C.R.K.; Bajpai, P.C. Uptake and Release of Bilirubin by Skin. Biochem. J. 1973, 136, 35–43. [Google Scholar] [CrossRef] [PubMed]
- Duckworth, M.G.; Caspall, J.J.; Iv, R.L.M.; Kong, L.; Yi, D.; Sprigle, S.H. Bruise Chromophore Concentrations Over Time. Med. Imaging 2008, 6915, 69152. [Google Scholar] [CrossRef]
- Tseng, S.-H.; Hsu, C.-K.; Lee, J.Y.-Y.; Tzeng, S.-Y.; Chen, W.-R.; Liaw, Y.-K. Noninvasive Evaluation of Collagen and Hemoglobin Contents and Scattering Property of In Vivo Keloid Scars and Normal Skin Using Diffuse Reflectance Spectroscopy: Pilot study. J. Biomed. Opt. 2012, 17, 0770051–07700511. [Google Scholar] [CrossRef] [PubMed][Green Version]
- Walløe, L. Arterio-venous Anastomoses in the Human Skin and Their Role in Temperature Control. Temperature 2016, 3, 92–103. [Google Scholar] [CrossRef] [PubMed]
- Jeney, V.; Eaton, J.W.; Balla, G.; Balla, J. Natural History of the Bruise: Formation, Elimination, and Biological Effects of Oxidized Hemoglobin. Oxidative Med. Cell. Longev. 2013, 2013, 1–9. [Google Scholar] [CrossRef]
- Randeberg, L.L.; Skallerud, B.H.; Langlois, N.E.; Haugen, O.A.; Svaasand, L.O.; Gemert, M.J. The Optics of Bruising. In Optical-Thermal Response of Laser-Irradiated Tissue; Springer Science and Business Media LLC: Berlin/Heidelberg, Germany, 2010; pp. 825–858. [Google Scholar]
- Abdy, N.A.; Martinez, R.; Chea, I.; Boczar, B.; Nuño, T.; Woolridge, D. A Pilot Study Demonstrating the Efficacy of Transcutaneous Bilirubin Meters to Quantitatively Differentiate Contusions from Congenital Dermal Melanocytosis. Child Abus. Negl. 2018, 80, 108–112. [Google Scholar] [CrossRef]
- Roggan, A.; Friebel, M.; Dörschel, K.; Hahn, A.; Müller, G. Optical Properties of Circulating Human Blood in the Wavelength Range 400–2500 nm. J. Biomed. Opt. 1999, 4, 36–46. [Google Scholar] [CrossRef]
- Yokokawa, T.; Nishidate, I. Evaluation of Light Scattering Properties and Chromophore Concentrations in Skin Tissue Based on Diffuse Reflectance Signals at Isosbestic Wavelengths of Hemoglobin. Opt. Rev. 2016, 23, 332–339. [Google Scholar] [CrossRef]
- Bashkatov, A.N.; Berezin, K.V.; Dvoretskiy, K.N.; Chernavina, M.L.; Genina, E.A.; Genin, V.D.; Kochubey, V.I.; Lazareva, E.N.; Pravdin, A.B.; Shvachkina, M.E.; et al. Measurement of Tissue Optical Properties in the Context of Tissue Optical Clearing. J. Biomed. Opt. 2018, 23, 091416. [Google Scholar] [CrossRef] [PubMed]
- Nagarajan, U.; Christopher, J.G.; Chandrasekaran, B.; Jonnalagadda, R.R.; Balachandran, U.N.; Kohsaku, K. Studies on the Molecular Significance in the Interaction of Bilirubin with Collagen. Int. J. Biol. Macromol. 2013, 61, 404–410. [Google Scholar] [CrossRef] [PubMed]
- Parai, J.L.; Milroy, C.M. Histological Aging of Bruising: A Historical and Ongoing Challenge. Acad. Forensic Pathol. 2015, 5, 266–272. [Google Scholar] [CrossRef]
- Zherebtsov, E.; Dremin, V.; Popov, A.; Doronin, A.; Kurakina, D.; Kirillin, M.Y.; Meglinski, I.; Bykov, A. Hyperspectral Imaging of Human Skin Aided by Artificial Neural Networks. Biomed. Opt. Express 2019, 10, 3545–3559. [Google Scholar] [CrossRef]
- Verdel, N.; Tanevski, J.; Džeroski, S.; Majaron, B. Predictive Model for the Quantitative Analysis of Human Skin Using Photothermal Radiometry and Diffuse Reflectance Spectroscopy. Biomed. Opt. Express 2020, 11, 1679–1696. [Google Scholar] [CrossRef]


| Code | Subject: Gender | Age | Anatomic Location | Cause of Trauma | Measurement Times |
|---|---|---|---|---|---|
| a | female | 29 y | thigh, bellow the hip | hit into a table | 48–359 h |
| b | male | 30 y | outer side of the thigh | off-piste skiing | 45–376 h |
| c | female | 29 y | upper forearm | roller derby | 13–349 h |
| Thickness | Absorbers | Scattering | |||
|---|---|---|---|---|---|
| subject a | |||||
| epidermis | depi = 0.08 mm | m = 0.5% | aepi= 9.3 ± 0.2 mm–1 | ||
| bepi = 0 | pepi= 1.7 | ||||
| dermis | dpap = 0.18 ± 0.01 mm | bpap = 2.4% | 2.3% | ader= 3.8 ± 0.1 mm–1pder= 1.6 | |
| Spap = 10 ± 1% | 18 ± 2% | ||||
| dret = 0.76 ± 0.02 mm | bret = 1.6% | 1.7% | |||
| Sret = 55 ± 1% | 50 ± 1% | ||||
| cβ = 1.7 ± 0.2 mg/L | |||||
| subcutis | – | – | A = 0.3 | ||
| subject b | |||||
| epidermis | depi= 0.10 mm | m = 0.4% | aepi= 7.7 ± 0.2 mm–1 | ||
| bepi = 0 | pepi= 1.7 | ||||
| dermis | dpap = 0.14 ± 0.01 mm | bpap = 1.9% | 1.7% | 1.8% | ader = 4.2 ± 0.1 mm–1pder = 1.5 |
| Spap= 38 ± 1% | 34 ± 1% | 22 ± 1% | |||
| dret = 1.02 ± 0.02 mm | bret = 1.2% | 1.3% | 1.0% | ||
| Sret= 52 ± 1% | 42 ± 1% | 76 ± 1% | |||
| cβ = 1.1 ± 0.2 mg/L | |||||
| subcutis | – | – | A = 0.4 | ||
| subject c | |||||
| epidermis | depi = 0.07 mm | m = 0.4% | aepi= 9.7 ± 0.2 mm–1 | ||
| bepi = 0 | pepi = 1.4 | ||||
| dermis | dpap = 0.17 mm | bpap = 1.0% | 1.1% | ader= 4.3 ± 0.1 mm–1pder = 1.9 | |
| Spap = 12 ± 1% | 23 ± 1% | ||||
| dret = 0.70 ± 0.02 mm | bret = 0.6% | 0.7% | |||
| Sret = 90 ± 1% | 58 ± 1% | ||||
| cβ = 1.0 ± 0.2 mg/L | |||||
| subcutis | – | – | A = 0.3 | ||
Publisher’s Note: MDPI stays neutral with regard to jurisdictional claims in published maps and institutional affiliations. |
© 2021 by the authors. Licensee MDPI, Basel, Switzerland. This article is an open access article distributed under the terms and conditions of the Creative Commons Attribution (CC BY) license (http://creativecommons.org/licenses/by/4.0/).
Share and Cite
Marin, A.; Verdel, N.; Milanič, M.; Majaron, B. Noninvasive Monitoring of Dynamical Processes in Bruised Human Skin Using Diffuse Reflectance Spectroscopy and Pulsed Photothermal Radiometry. Sensors 2021, 21, 302. https://doi.org/10.3390/s21010302
Marin A, Verdel N, Milanič M, Majaron B. Noninvasive Monitoring of Dynamical Processes in Bruised Human Skin Using Diffuse Reflectance Spectroscopy and Pulsed Photothermal Radiometry. Sensors. 2021; 21(1):302. https://doi.org/10.3390/s21010302
Chicago/Turabian StyleMarin, Ana, Nina Verdel, Matija Milanič, and Boris Majaron. 2021. "Noninvasive Monitoring of Dynamical Processes in Bruised Human Skin Using Diffuse Reflectance Spectroscopy and Pulsed Photothermal Radiometry" Sensors 21, no. 1: 302. https://doi.org/10.3390/s21010302
APA StyleMarin, A., Verdel, N., Milanič, M., & Majaron, B. (2021). Noninvasive Monitoring of Dynamical Processes in Bruised Human Skin Using Diffuse Reflectance Spectroscopy and Pulsed Photothermal Radiometry. Sensors, 21(1), 302. https://doi.org/10.3390/s21010302