Individualised Responsible Artificial Intelligence for Home-Based Rehabilitation


Abstract
1. Introduction
- Unbiased AI: A significant body of work has contributed to methods for bias-free machine learning (ML) models [15,16,17]. We aim to follow state-of-the-art bias reduction approaches [18] in our proposed rehabilitation support approach based on designing an appropriate and balanced training dataset that would remove bias due to class under-representation.
- Explainable AI: There has been strong research interest in the field of explainable AI (XAI) in recent years [19]. However, these approaches are mostly focused on the social aspect (user response to XAI) [11], or the implications of manipulating inputs to generate false negative or false positive responses [20].
- Interpretable AI: Interpretable and justifiable outcomes of AI require transparency of the ML model as well as the model’s decisions and behaviours [21]. Current EU regulation allows for individuals to enquire about AI decisions [22]. However, regulation is not well defined for the design and development of such models, particularly in the medical applications domain [23]. Moreover, accountability and transparency are strongly interlinked with interpretability [17].
- Methodological steps to produce a new synthetic dataset based on statistical clinical results reported in the literature for training ML algorithms to avoid bias and ensure fairness in autonomous system outcomes (Section 3.1.2);
- A novel hybrid ML algorithm to meet the individualisation, interpretability, and ART design considerations while maintaining a low computational footprint (Section 4);
- Interpretability of the designed solution, including feature importance for a patient-centric individualised, responsible home-based rehabilitation support (Section 4.1);
2. Literature Review of ART AI and Its Applicability to Home-Based Rehabilitation Systems
ART Design Considerations
- 1.
- avoid bias and prejudice in training data, or make biases clear to user population;
- 2.
- ethical principles embedded into AI development;
- 3.
- interdisciplinary teams are crucial;
- 4.
- transparent data provenance (input, output);
- 5.
- lay people need to understand AI decisions;
- 6.
- decision justification.
3. Methodology
3.1. Training Dataset Design
3.1.1. Experimental Dataset
- 1.
- Test completion time (seconds)
- 2.
- Age (years)
- 3.
- Height (meters)
- 4.
- Weight (kg)
- 5.
- Body mass index (BMI) (kg/m calculated using Equation (1))
- 6.
- Sex (male/female)
3.1.2. Synthetic Dataset
- 1.
- To meet the requirements of [6] for transferability and co-morbidity diagnosis, the underlying reason being the development of co-morbidity for stroke survivors and early diagnosis/warning to carers;
- 2.
- To improve variance and bias of our experimental dataset;
- 3.
- To improve accuracy of our model;
- 4.
- To include a wider range of height, weight, age and BMI that is representative of the wider population that is dischared to home-based rehabilitaiton directly impacting bias;
- 5.
- To improve believability by sourcing information from medical journals, where a larger cohorts of geriatric subjects and patients have participated in experiments;
- 6.
- To improve objectivity by including information from experiments with participants diagnosed to have the medical conditions that can be developed as co-morbidities, such as Parkinson’s and dementia.
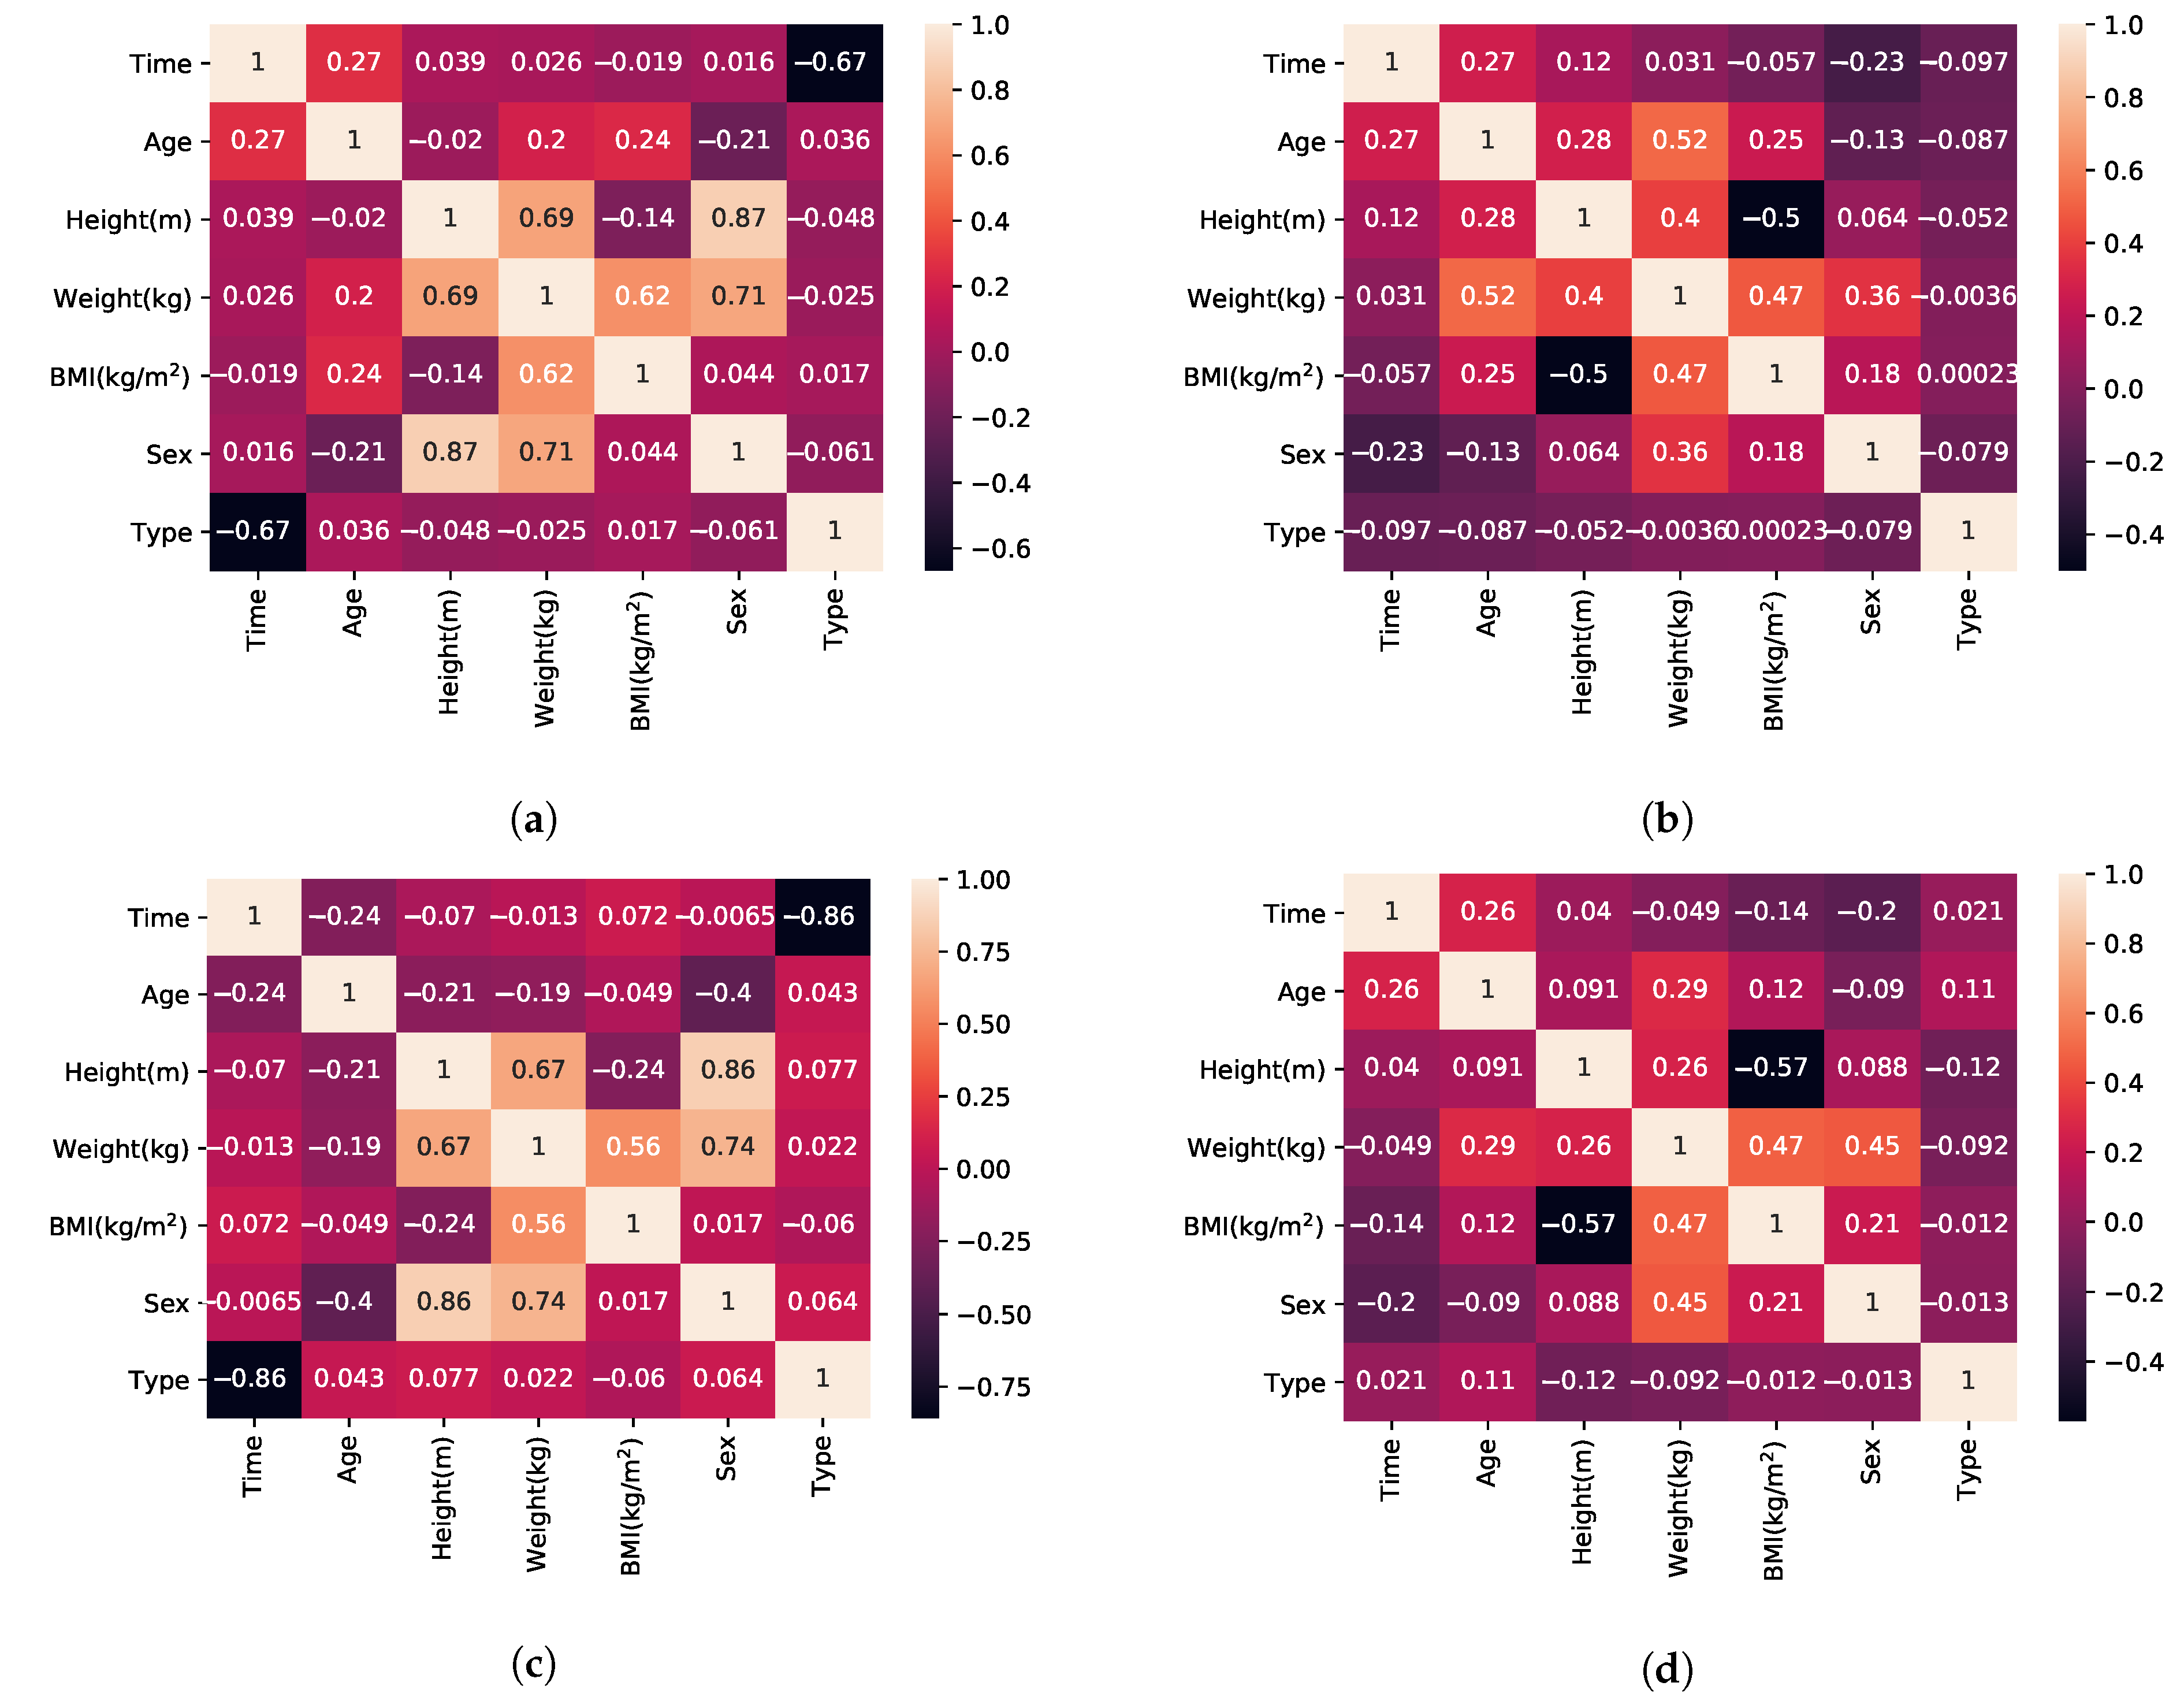
- BMI, by definition, has a linear relationship to weight (Equation (1)).
- According to [58] female subjects perform faster than male subjects in TUG, which is a superset of activities in relation to FTSTS.
- Sex and weight also have a relationship that is linear in regards to the mean weight value of the population with higher variance (wide standard deviation causing overlap between the two populations) [84].
- Height is calculated using Equation (1) after the pair {BMI, weight} has been established.
- Sex and age have no correlation (observation supported by our experimental dataset and the mean age value reported for each sex in each of the included publications).
| Algorithm 1 Generate features for n datapoints of Class x. |
|
3.2. Evaluation of ML Methods for Supervised Classification
4. Hybrid ML Approach for Individualised ART-Driven Rehabilitation
| Algorithm 2: Hybrid learning method |
|
- The test starts and does not complete, possible indication of fall.
- Noise and unexpected sensor inputs, possible misuse, sensor faults or multiple users interfering with the test.
- Improvement rate is too high and prediction deviates significantly from baseline, possible indication of user forcing himself (herself) to achieve the goal faster.
- Negative improvement is consistently reported, possible deterioration of user condition.
4.1. ART AI Design Approach
- 1.
- Bias of the experimental dataset, in terms of the female/male balance, is mitigated using SMOTE and balanced data between female/male participants through the synthetic dataset. Biases in the remaining features (e.g., age, height, weight) were also addressed as a result of the SMOTE method and the wide variety of sources used in the synthetic dataset;
- 2.
- 3.
- 4.
- data provenance both in terms of input and output is transparent to the user and published at the edge node using open protocols. Both k-NN and XGBoost are categorised as transparent by [26] and all the generated model information is also included in the model output. However, for security reasons, only authorised users can view and access both input and output information (system login functionality [1]);
- 5.
- 6.
- decisions are justified both through the probability results, the person’s rate of improvement and the model’s selection process. Results are available to the user.
5. Evaluation and Results
6. Discussion
7. Conclusions
Future Work
Author Contributions
Funding
Conflicts of Interest
References
- Vourganas, I.; Stankovic, V.; Stankovic, L.; Michala, A.L. Evaluation of home-based rehabilitation sensing systems with respect to standardised clinical tests. Sensors 2020, 20, 26. [Google Scholar] [CrossRef]
- Age, U. Briefing: Health and Care of Older People in England 2017; Age UK: London, UK, 2017. [Google Scholar]
- Pickrell, M.; Bongers, B.; van den Hoven, E. Understanding persuasion and motivation in interactive stroke rehabilitation. In Proceedings of the International Conference on Persuasive Technology, Chicago, IL, USA, 3–5 June 2015; pp. 15–26. [Google Scholar]
- Szeto, A. Rehabilitation engineering and assistive technology. In Introduction to Biomedical Engineering; Elsevier: Amsterdam, The Netherlands, 2005; pp. 211–254. [Google Scholar]
- Sugavanam, T.; Mead, G.; Bulley, C.; Donaghy, M.; van Wijck, F. The effects and experiences of goal setting in stroke rehabilitation–a systematic review. Disabil. Rehabil. 2013, 35, 177–190. [Google Scholar] [CrossRef] [PubMed]
- Vourganas, I.; Stankovic, V.; Stankovic, L.; Kerr, A. Factors that contribute to the use of stroke self-rehabilitation technologies: A review. JMIR Biomed. Eng. 2019, 4, e13732. [Google Scholar] [CrossRef]
- Sambasivan, N.; Holbrook, J. Toward responsible AI for the next billion users. Interactions 2019, 26, 68–71. [Google Scholar] [CrossRef]
- Tubella, A.A.; Theodorou, A.; Dignum, V.; Dignum, F. Governance by glass-box: Implementing transparent moral bounds for AI behaviour. arXiv 2019, arXiv:1905.04994. [Google Scholar]
- Bryson, J.; Winfield, A. Standardizing ethical design for artificial intelligence and autonomous systems. Computer 2017, 50, 116–119. [Google Scholar] [CrossRef]
- Lepri, B.; Oliver, N.; Letouzé, E.; Pentland, A.; Vinck, P. Fair, transparent, and accountable algorithmic decision-making processes. Philos. Technol. 2018, 31, 611–627. [Google Scholar] [CrossRef]
- Doshi-Velez, F.; Kim, B. Towards a rigorous science of interpretable machine learning. arXiv 2017, arXiv:1702.08608. [Google Scholar]
- Dignum, V. Responsible Artificial Intelligence: Designing AI for Human Values; Daffodil International University: Dhaka, Bangladesh, 2017; Volume 25. [Google Scholar]
- Jobin, A.; Ienca, M.; Vayena, E. The global landscape of AI ethics guidelines. Nat. Mach. Intell. 2019, 1, 389–399. [Google Scholar] [CrossRef]
- Rao, A.; Palaci, F.; Chow, W. A Practical Guide to Responsible Artificial Intelligence (AI); Technical Report; PwC: London, UK, 2019. [Google Scholar]
- Choudhary, A. Decoding the Black Box: An Important Introduction to Interpretable Machine Learning Models in Python; Analytics Vidhya: Gurgaon, India, 2019. [Google Scholar]
- Mehrabi, N.; Morstatter, F.; Saxena, N.; Lerman, K.; Galstyan, A. A survey on bias and fairness in machine learning. arXiv 2019, arXiv:1908.09635. [Google Scholar]
- Gunning, D.; Aha, D.W. DARPA’s Explainable Artificial Intelligence Program. AI Mag. 2019, 40, 44–58. [Google Scholar] [CrossRef]
- The Centre for Data Ethics and Innovation. Review into Bias in Algorithmic Decision-Making. Interim Review; Technical Report; UK Government: London, UK, 2019.
- Adadi, A.; Berrada, M. Peeking inside the black-box: A survey on Explainable Artificial Intelligence (XAI). IEEE Access 2018, 6, 52138–52160. [Google Scholar] [CrossRef]
- Moosavi-Dezfooli, S.M.; Fawzi, A.; Frossard, P. DeepFool: A simple and accurate method to fool deep neural networks. arXiv 2015, arXiv:1511.04599. [Google Scholar]
- Leslie, D. Understanding artificial intelligence ethics and safety: A guide for the responsible design and implementation of AI systems in the public sector. arXiv 2019, arXiv:1906.05684. [Google Scholar]
- Vollmer, N. Article 25 EU General Data Protection Regulation (EU-GDPR). Retrieved January 2017, 15, 2018. [Google Scholar]
- Rockall, A. From hype to hope to hard work: Developing responsible AI for radiology. Clin. Radiol. 2020, 75, 1–2. [Google Scholar] [CrossRef] [PubMed]
- Tjoa, E.; Guan, C. A survey on explainable artificial intelligence (XAI): Towards medical XAI. arXiv 2019, arXiv:1907.07374. [Google Scholar]
- Lahav, O.; Mastronarde, N.; van der Schaar, M. What is interpretable? Using machine learning to design interpretable decision-support systems. arXiv 2018, arXiv:1811.10799. [Google Scholar]
- Arrieta, A.B.; Díaz-Rodríguez, N.; Del Ser, J.; Bennetot, A.; Tabik, S.; Barbado, A.; García, S.; Gil-López, S.; Molina, D.; Benjamins, R.; et al. Explainable Artificial Intelligence (XAI): Concepts, taxonomies, opportunities and challenges toward responsible AI. Inf. Fusion 2020, 58, 82–115. [Google Scholar] [CrossRef]
- Cassens, J.; Wegener, R. Ambient Explanations: Ambient Intelligence and Explainable AI. In Proceedings of the European Conference on Ambient Intelligence, Rome, Italy, 13–15 November 2019; pp. 370–376. [Google Scholar]
- Pauly, O. Random Forests for Medical Applications. Ph.D. Thesis, Technische Universität München, München, Germany, 2012. [Google Scholar]
- Kazienko, P.; Lughofer, E.; Trawinski, B. Editorial on the special issue “Hybrid and ensemble techniques in soft computing: Recent advances and emerging trends”. Soft Comput. 2015, 19, 3353–3355. [Google Scholar] [CrossRef]
- Yin, P.Y.; Tsai, C.C.; Day, R.F.; Tung, C.Y.; Bhanu, B. Ensemble learning of model hyperparameters and spatiotemporal data for calibration of low-cost PM2. 5 sensors. Math. Biosci. Eng. MBE 2019, 16, 6858–6873. [Google Scholar] [CrossRef] [PubMed]
- Chen, T.; Guestrin, C. Xgboost: A scalable tree boosting system. In Proceedings of the 22nd ACM Sigkdd International Conference on Knowledge Discovery and Data Mining, San Francisco, USA, 13–17 August 2016; pp. 785–794. [Google Scholar]
- Shenoy, M.V. Sensor Information Processing for Wearable IoT Devices. In Principles of Internet of Things (IoT) Ecosystem: Insight Paradigm; Springer: Berlin/Heidelberg, Germany, 2020; pp. 177–200. [Google Scholar]
- Norris, D.J. Predictions using CNNs and MLPs for medical research. In Machine Learning with the Raspberry Pi; Springer: Berlin/Heidelberg, Germany, 2020; pp. 453–500. [Google Scholar]
- Aveleira-Mata, J.; Alaiz-Moreton, H. Functional Prototype for Intrusion Detection System Oriented to Intelligent IoT Models. In Proceedings of the International Symposium on Ambient Intelligence, Rome, Italy, 13–15 November 2019; pp. 179–186. [Google Scholar]
- Xiao, P.; Cheng, S.; Stankovic, V.; Vukobratovic, D. Averaging is probably not the optimum way of aggregating parameters in federated learning. Entropy 2020, 22, 314. [Google Scholar] [CrossRef] [PubMed]
- Stojić, A.; Stanić, N.; Vuković, G.; Stanišić, S.; Perišić, M.; Šoštarić, A.; Lazić, L. Explainable extreme gradient boosting tree-based prediction of toluene, ethylbenzene and xylene wet deposition. Sci. Total Environ. 2019, 653, 140–147. [Google Scholar] [CrossRef] [PubMed]
- Sharma, N.; Juneja, A. Extreme Gradient Boosting with Squared Logistic Loss Function. In Machine Intelligence and Signal Analysis; Springer: Berlin/Heidelberg, Germany, 2019; pp. 313–322. [Google Scholar]
- Feng, L.; Li, Y.; Wang, Y.; Du, Q. Estimating hourly and continuous ground-level PM2.5 concentrations using an ensemble learning algorithm: The ST-stacking model. Atmos. Environ. 2020, 223, 117242. [Google Scholar] [CrossRef]
- Silva, J.; Madureira, J.; Tonelo, C.; Baltazar, D.; Silva, C.; Martins, A.; Alcobia, C.; Sousa, I. Comparing machine learning approaches for fall risk assessment. In Proceedings of the 10th International Conference on Bio-inspired Systems and Signal Processing, Porto, Portugal, 21–23 February 2017; Volume 5, pp. 223–230. [Google Scholar]
- Acorn, E.; Dipsis, N.; Pincus, T.; Stathis, K. Sit-to-Stand Movement Recognition Using Kinect. In Proceedings of the International Symposium on Statistical Learning and Data Sciences, Egham, UK, 20–23 April 2015; pp. 179–192. [Google Scholar]
- Hellmers, S.; Fudickar, S.; Lau, S.; Elgert, L.; Diekmann, R.; Bauer, J.M.; Hein, A. Measurement of the Chair Rise Performance of Older People Based on Force Plates and IMUs. Sensors 2019, 19, 1370. [Google Scholar] [CrossRef]
- Dignum, V. Ethics in artificial intelligence: Introduction to the special issue. Ethics Inf. Technol. 2018, 20, 1–3. [Google Scholar] [CrossRef]
- Taylor, S.; Boniface, M.; Pickering, B.; Anderson, M.; Danks, D.; Følstad, A.; Leese, M.; Müller, V.; Sorell, T.; Winfield, A.; et al. Responsible AI–Key themes, concerns & recommendations for European research and innovation. Zenodo 2018. [Google Scholar] [CrossRef]
- Laranjeiro, N.; Soydemir, S.N.; Bernardino, J. A survey on data quality: Classifying poor data. In Proceedings of the 2015 IEEE 21st Pacific rim international symposium on dependable computing (PRDC), Zhangjiajie, China, 18–20 November 2015; pp. 179–188. [Google Scholar]
- Shirley Ryan Ability Lab. Timed Up and Go. Available online: https://www.sralab.org/rehabilitation-measures/timed-and-go (accessed on 25 November 2019).
- Shirley Ryan Ability Lab. Five Times Sit to Stand. Available online: https://www.sralab.org/rehabilitation-measures/five-times-sit-stand-test (accessed on 25 November 2019).
- Covington, P.; Adams, J.; Sargin, E. Deep neural networks for youtube recommendations. In Proceedings of the 10th ACM Conference on Recommender Systems, Boston, MA, USA, 15–19 September 2016; pp. 191–198. [Google Scholar]
- Grus, J. Data Science from Scratch: First Principles with Python; O’Reilly Media: Newton, MA, USA, 2019. [Google Scholar]
- Chawla, N.V.; Bowyer, K.W.; Hall, L.O.; Kegelmeyer, W.P. SMOTE: Synthetic minority over-sampling technique. J. Artif. Intell. Res. 2002, 16, 321–357. [Google Scholar] [CrossRef]
- Jordon, J.; Yoon, J.; van der Schaar, M. Measuring the quality of synthetic data for use in competitions. arXiv 2018, arXiv:1806.11345. [Google Scholar]
- Goncalves, A.; Ray, P.; Soper, B.; Stevens, J.; Coyle, L.; Sales, A.P. Generation and evaluation of synthetic patient data. BMC Med. Res. Methodol. 2020, 20, 1–40. [Google Scholar] [CrossRef]
- Benaim, A.R.; Almog, R.; Gorelik, Y.; Hochberg, I.; Nassar, L.; Mashiach, T.; Khamaisi, M.; Lurie, Y.; Azzam, Z.S.; Khoury, J.; et al. Analyzing Medical Research Results Based on Synthetic Data and Their Relation to Real Data Results: Systematic Comparison From Five Observational Studies. JMIR Med. Inform. 2020, 8, e16492. [Google Scholar] [CrossRef]
- Boonstra, M.; Malefijt, M.D.W.; Verdonschot, N. How to quantify knee function after total knee arthroplasty? Knee 2008, 15, 390–395. [Google Scholar] [CrossRef] [PubMed]
- Brooks, D.; Davis, A.M.; Naglie, G. Validity of 3 physical performance measures in inpatient geriatric rehabilitation. Arch. Phys. Med. Rehabil. 2006, 87, 105–110. [Google Scholar] [CrossRef] [PubMed]
- Brusse, K.J.; Zimdars, S.; Zalewski, K.R.; Steffen, T.M. Testing functional performance in people with Parkinson disease. Phys. Ther. 2005, 85, 134–141. [Google Scholar] [CrossRef] [PubMed]
- Chen, H.; Zheng, X.; Huang, H.; Liu, C.; Wan, Q.; Shang, S. The effects of a home-based exercise intervention on elderly patients with knee osteoarthritis: A quasi-experimental study. BMC Musculoskelet. Disord. 2019, 20, 160. [Google Scholar] [CrossRef] [PubMed]
- Dal Bello-Haas, V.; Klassen, L.; Sheppard, M.S.; Metcalfe, A. Psychometric properties of activity, self-efficacy, and quality-of-life measures in individuals with Parkinson disease. Physiother. Can. 2011, 63, 47–57. [Google Scholar] [CrossRef] [PubMed]
- Flansbjer, U.B.; Holmbäck, A.M.; Downham, D.; Patten, C.; Lexell, J. Reliability of gait performance tests in men and women with hemiparesis after stroke. J. Rehabil. Med. 2005, 37, 75–82. [Google Scholar] [PubMed]
- Foreman, K.B.; Addison, O.; Kim, H.S.; Dibble, L.E. Testing balance and fall risk in persons with Parkinson disease, an argument for ecologically valid testing. Park. Relat. Disord. 2011, 17, 166–171. [Google Scholar] [CrossRef] [PubMed]
- Gill-Body, K.M.; Beninato, M.; Krebs, D.E. Relationship among balance impairments, functional performance, and disability in people with peripheral vestibular hypofunction. Phys. Ther. 2000, 80, 748–758. [Google Scholar] [CrossRef]
- Katz-Leurer, M.; Rotem, H.; Lewitus, H.; Keren, O.; Meyer, S. Functional balance tests for children with traumatic brain injury: Within-session reliability. Pediatr. Phys. Ther. 2008, 20, 254–258. [Google Scholar] [CrossRef]
- Kennedy, D.M.; Stratford, P.W.; Wessel, J.; Gollish, J.D.; Penney, D. Assessing stability and change of four performance measures: A longitudinal study evaluating outcome following total hip and knee arthroplasty. BMC Musculoskelet. Disord. 2005, 6, 3. [Google Scholar] [CrossRef]
- Knorr, S.; Brouwer, B.; Garland, S.J. Validity of the Community Balance and Mobility Scale in community-dwelling persons after stroke. Arch. Phys. Med. Rehabil. 2010, 91, 890–896. [Google Scholar] [CrossRef]
- Lemay, J.; Nadeau, S. Standing balance assessment in ASIA D paraplegic and tetraplegic participants: Concurrent validity of the Berg Balance Scale. Spinal Cord. 2010, 48, 245–250. [Google Scholar] [CrossRef]
- Maly, M.; Costigan, P.; Olney, S. Contribution of psychosocial and mechanical variables to mobility outcome measures in knee OA. Phys. Ther. 2005, 85, 1318–1328. [Google Scholar] [CrossRef]
- Ries, J.D.; Echternach, J.L.; Nof, L.; Gagnon Blodgett, M. Test-retest reliability and minimal detectable change scores for the timed “up & go” test, the six-minute walk test, and gait speed in people with Alzheimer disease. Phys. Ther. 2009, 89, 569–579. [Google Scholar]
- Sabirli, F.; Paker, N.; Bugdayci, D. The relationship between Knee Injury and Osteoarthritis Outcome Score (KOOS) and Timed Up and Go test in patients with symptomatic knee osteoarthritis. Rheumatol. Int. 2013, 33, 2691–2694. [Google Scholar] [CrossRef]
- Steffen, T.M.; Hacker, T.A.; Mollinger, L. Age-and gender-related test performance in community-dwelling elderly people: Six-Minute Walk Test, Berg Balance Scale, Timed Up & Go Test, and gait speeds. Phys. Ther. 2002, 82, 128–137. [Google Scholar]
- Wright, A.A.; Cook, C.E.; Baxter, G.D.; Dockerty, J.D.; Abbott, J.H. A comparison of 3 methodological approaches to defining major clinically important improvement of 4 performance measures in patients with hip osteoarthritis. J. Orthop. Sport. Phys. Ther. 2011, 41, 319–327. [Google Scholar] [CrossRef]
- Beninato, M.; Portney, L.G.; Sullivan, P.E. Using the International Classification of Functioning, Disability and Health as a framework to examine the association between falls and clinical assessment tools in people with stroke. Phys. Ther. 2009, 89, 816–825. [Google Scholar] [CrossRef]
- Bohannon, R.W.; Shove, M.E.; Barreca, S.R.; Masters, L.M.; Sigouin, C.S. Five-repetition sit-to-stand test performance by community-dwelling adults: A preliminary investigation of times, determinants, and relationship with self-reported physical performance. Isokinet. Exerc. Sci. 2007, 15, 77–81. [Google Scholar] [CrossRef]
- Christiansen, C.L.; Stevens-Lapsley, J.E. Weight-bearing asymmetry in relation to measures of impairment and functional mobility for people with knee osteoarthritis. Arch. Phys. Med. Rehabil. 2010, 91, 1524–1528. [Google Scholar] [CrossRef] [PubMed]
- Duncan, R.P.; Leddy, A.L.; Earhart, G.M. Five times sit-to-stand test performance in Parkinson’s disease. Arch. Phys. Med. Rehabil. 2011, 92, 1431–1436. [Google Scholar] [CrossRef] [PubMed]
- Lin, Y.C.; Davey, R.C.; Cochrane, T. Tests for physical function of the elderly with knee and hip osteoarthritis. Scand. J. Med. Sci. Sports 2001, 11, 280–286. [Google Scholar] [CrossRef] [PubMed]
- Lord, S.R.; Murray, S.M.; Chapman, K.; Munro, B.; Tiedemann, A. Sit-to-Stand Performance Depends on Sensation, Speed, Balance, and Psychological Status in Addition to Strength in Older People. J. Gerontol. Ser. A 2002, 57, M539–M543. [Google Scholar] [CrossRef] [PubMed]
- Mong, Y.; Teo, T.W.; Ng, S.S. 5-repetition sit-to-stand test in subjects with chronic stroke: Reliability and validity. Arch. Phys. Med. Rehabil. 2010, 91, 407–413. [Google Scholar] [CrossRef]
- Paul, S.S.; Canning, C.G.; Sherrington, C.; Fung, V.S. Reproducibility of measures of leg muscle power, leg muscle strength, postural sway and mobility in people with Parkinson’s disease. Gait Posture 2012, 36, 639–642. [Google Scholar] [CrossRef]
- Piva, S.R.; Teixeira, P.E.; Almeida, G.J.; Gil, A.B.; DiGioia, A.M., III; Levison, T.J.; Fitzgerald, G.K. Contribution of hip abductor strength to physical function in patients with total knee arthroplasty. Phys. Ther. 2011, 91, 225–233. [Google Scholar] [CrossRef]
- Tiedemann, A.; Shimada, H.; Sherrington, C.; Murray, S.; Lord, S. The comparative ability of eight functional mobility tests for predicting falls in community-dwelling older people. Age Ageing 2008, 37, 430–435. [Google Scholar] [CrossRef]
- Whitney, S.L.; Wrisley, D.M.; Marchetti, G.F.; Gee, M.A.; Redfern, M.S.; Furman, J.M. Clinical measurement of sit-to-stand performance in people with balance disorders: Validity of data for the Five-Times-Sit-to-Stand Test. Phys. Ther. 2005, 85, 1034–1045. [Google Scholar] [CrossRef]
- Bohannon, R.W. Reference Values for the Five-Repetition Sit-to-Stand Test: A Descriptive Meta-Analysis of Data from Elders. Percept. Mot. Skills 2006, 103, 215–222. [Google Scholar] [CrossRef]
- Brandkvist, M.; Bjørngaard, J.H.; Ødegård, R.A.; Åsvold, B.O.; Sund, E.R.; Vie, G.Å. Quantifying the impact of genes on body mass index during the obesity epidemic: Longitudinal findings from the HUNT Study. BMJ 2019, 366, l4067. [Google Scholar] [CrossRef]
- Calculator.net. BMI Calculator: BMI Chart for Adults. Available online: https://www.calculator.net/bmi-calculator.html (accessed on 24 July 2020).
- Fryar, C.; Kruszon-Moran, D.; Gu, Q.; Ogden, C. Mean Body Weight, Height, Waist Circumference, and Body Mass Index among Adults: United States, 1999–2000 through 2015–2016; National Health Statistics Reports No. 122; National Center for Health Statistics: Hyattsville, MD, USA, 2018; Available online: https://www.cdc.gov/nchs/data/nhsr/nhsr122-508.pdf (accessed on 1 August 2020).
- Xing, Y.; Weng, J.; Wang, Y.; Sui, L.; Shan, Y.; Wang, Y. An In-depth Comparison of Compilers for Deep Neural Networks on Hardware. In Proceedings of the 2019 IEEE International Conference on Embedded Software and Systems (ICESS), Las Vegas, NV, USA, 2–3 June 2019; pp. 1–8. [Google Scholar]
- Memon, N.; Patel, S.B.; Patel, D.P. Comparative Analysis of Artificial Neural Network and XGBoost Algorithm for PolSAR Image Classification. In Proceedings of the International Conference on Pattern Recognition and Machine Intelligence, Tezpur, India, 17–20 December 2019; pp. 452–460. [Google Scholar]
- Stein, R.A.; Jaques, P.A.; Valiati, J.F. An analysis of hierarchical text classification using word embeddings. Inf. Sci. 2019, 471, 216–232. [Google Scholar] [CrossRef]
- Chakraborty, D.; Elzarka, H. Advanced machine learning techniques for building performance simulation: A comparative analysis. J. Build. Perform. Simul. 2019, 12, 193–207. [Google Scholar] [CrossRef]
- Kane, F. Hands-on Data Science and Python Machine Learning; Packt Publishing Ltd.: Birmingham, UK, 2017. [Google Scholar]
- Ashley, R.A.; Parmeter, C.F. Sensitivity Analysis of an OLS Multiple Regression Inference with Respect to Possible Linear Endogeneity in the Explanatory Variables, for Both Modest and for Extremely Large Samples. Econometrics 2020, 8, 11. [Google Scholar] [CrossRef]
- Wong, T.T.; Yeh, P.Y. Reliable accuracy estimates from k-fold cross validation. IEEE Trans. Knowl. Data Eng. 2019, 32, 1586–1594. [Google Scholar] [CrossRef]
- Haley, M.R. K-fold cross validation performance comparisons of six naive portfolio selection rules: How naive can you be and still have successful out-of-sample portfolio performance? Ann. Financ. 2017, 13, 341–353. [Google Scholar] [CrossRef]
- Pedregosa, F.; Varoquaux, G.; Gramfort, A.; Michel, V.; Thirion, B.; Grisel, O.; Blondel, M.; Prettenhofer, P.; Weiss, R.; Dubourg, V.; et al. Scikit-learn: Machine learning in Python. J. Mach. Learn. Res. 2011, 12, 2825–2830. [Google Scholar]
- Soares, E.; Angelov, P. Fair-by-design explainable models for prediction of recidivism. arXiv 2019, arXiv:1910.02043. [Google Scholar]
- Abdul, A.; Vermeulen, J.; Wang, D.; Lim, B.Y.; Kankanhalli, M. Trends and trajectories for explainable, accountable and intelligible systems: An hci research agenda. In Proceedings of the 2018 CHI Conference on Human Factors in Computing Systems, Montreal, QC, Canada, 21–26 April 2018; pp. 1–18. [Google Scholar]


| Model | TUG Experiment | TUG Synthetic | FTSTS Experiment | FTSTS Synthetic |
|---|---|---|---|---|
| SVM | 0.3099 | 0.3921 | 0.9778 | 0.3625 |
| Regression | 0.35 | 0.0605 | 1 | 0.0705 |
| k-NN (k = 5) | 0.475 | 0.7006 | 0.6917 | 0.6791 |
| XGboost before hyperparam tuning | 0.4600 | 0.7667 | 0.9778 | 0.7827 |
| XGboost after hyperparam tuning | 0.65 | 0.8006 | 1 | 0.7965 |
| Model | TUG Experiment | TUG Synthetic | FTSTS Experiment | FTSTS Synthetic |
|---|---|---|---|---|
| xgb 5-f | 0.625 | 0.6052 | 0.7 | 0.577 |
| knn 5-f | 0.45 | 0.5932 | 0.7 | 0.5930 |
| hybrid 5-f | 0.5789 | 1 | 1 | 1 |
| Metric | TUG Experiment | TUG Synthetic | FTSTS Experiment | FTSTS Synthetic |
|---|---|---|---|---|
| Sensitivity | 0.33 | 0.9 | 1 | 0.87 |
| Specificity | 0.78 | 0.94 | 1 | 1 |
| Precision | 0.78 | 0.94 | 1 | 1 |
| f score | 0.47 | 0.92 | 1 | 0.93 |
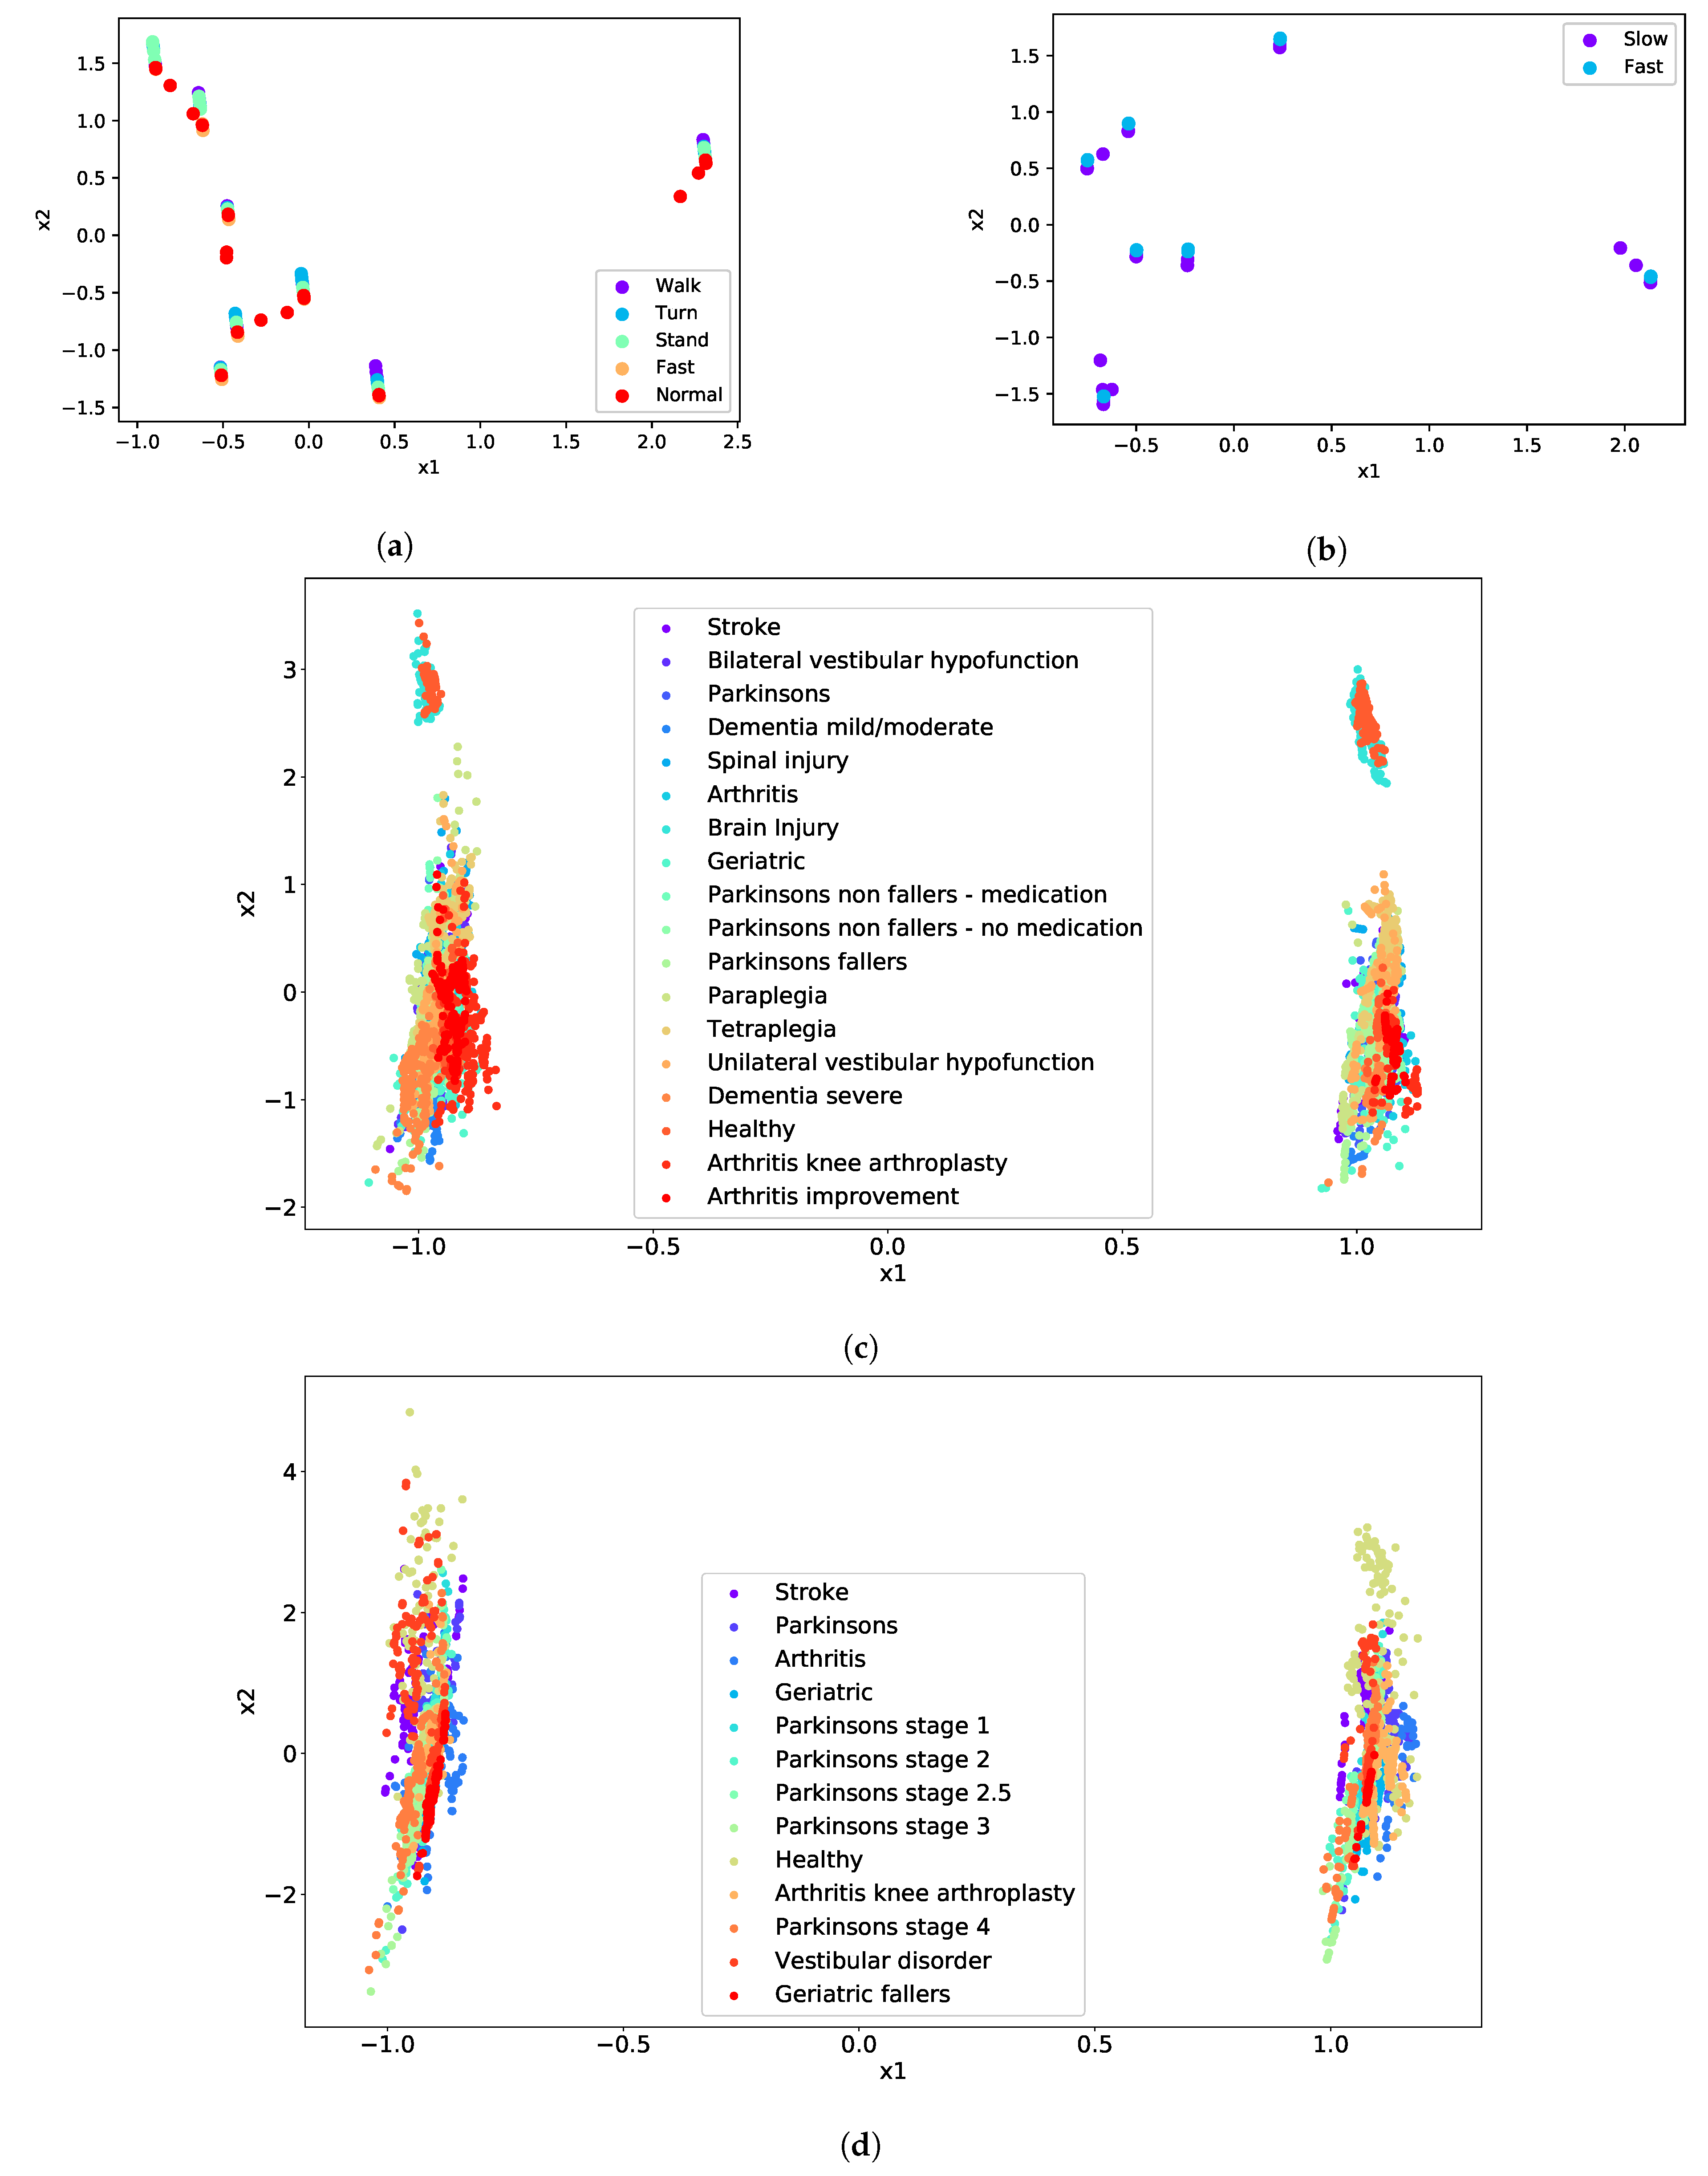
| Test | Cluster | Condition |
|---|---|---|
| TUG | Difficulty to Walk | Geriatric |
| Difficulty to Turn | Paraplegia | |
| Difficulty to Stand | Dementia severe | |
| Normal | Arthritis | |
| Fast | Unilateral vestibular hypofunction | |
| FTSTS | Difficulty | Vestibular disorder |
| Fast | Parkinson’s stage 4 |
Publisher’s Note: MDPI stays neutral with regard to jurisdictional claims in published maps and institutional affiliations. |
© 2020 by the authors. Licensee MDPI, Basel, Switzerland. This article is an open access article distributed under the terms and conditions of the Creative Commons Attribution (CC BY) license (http://creativecommons.org/licenses/by/4.0/).
Share and Cite
Vourganas, I.; Stankovic, V.; Stankovic, L. Individualised Responsible Artificial Intelligence for Home-Based Rehabilitation. Sensors 2021, 21, 2. https://doi.org/10.3390/s21010002
Vourganas I, Stankovic V, Stankovic L. Individualised Responsible Artificial Intelligence for Home-Based Rehabilitation. Sensors. 2021; 21(1):2. https://doi.org/10.3390/s21010002
Chicago/Turabian StyleVourganas, Ioannis, Vladimir Stankovic, and Lina Stankovic. 2021. "Individualised Responsible Artificial Intelligence for Home-Based Rehabilitation" Sensors 21, no. 1: 2. https://doi.org/10.3390/s21010002
APA StyleVourganas, I., Stankovic, V., & Stankovic, L. (2021). Individualised Responsible Artificial Intelligence for Home-Based Rehabilitation. Sensors, 21(1), 2. https://doi.org/10.3390/s21010002