Identifying Informal Settlements Using Contourlet Assisted Deep Learning


Abstract
1. Introduction
2. Related Work
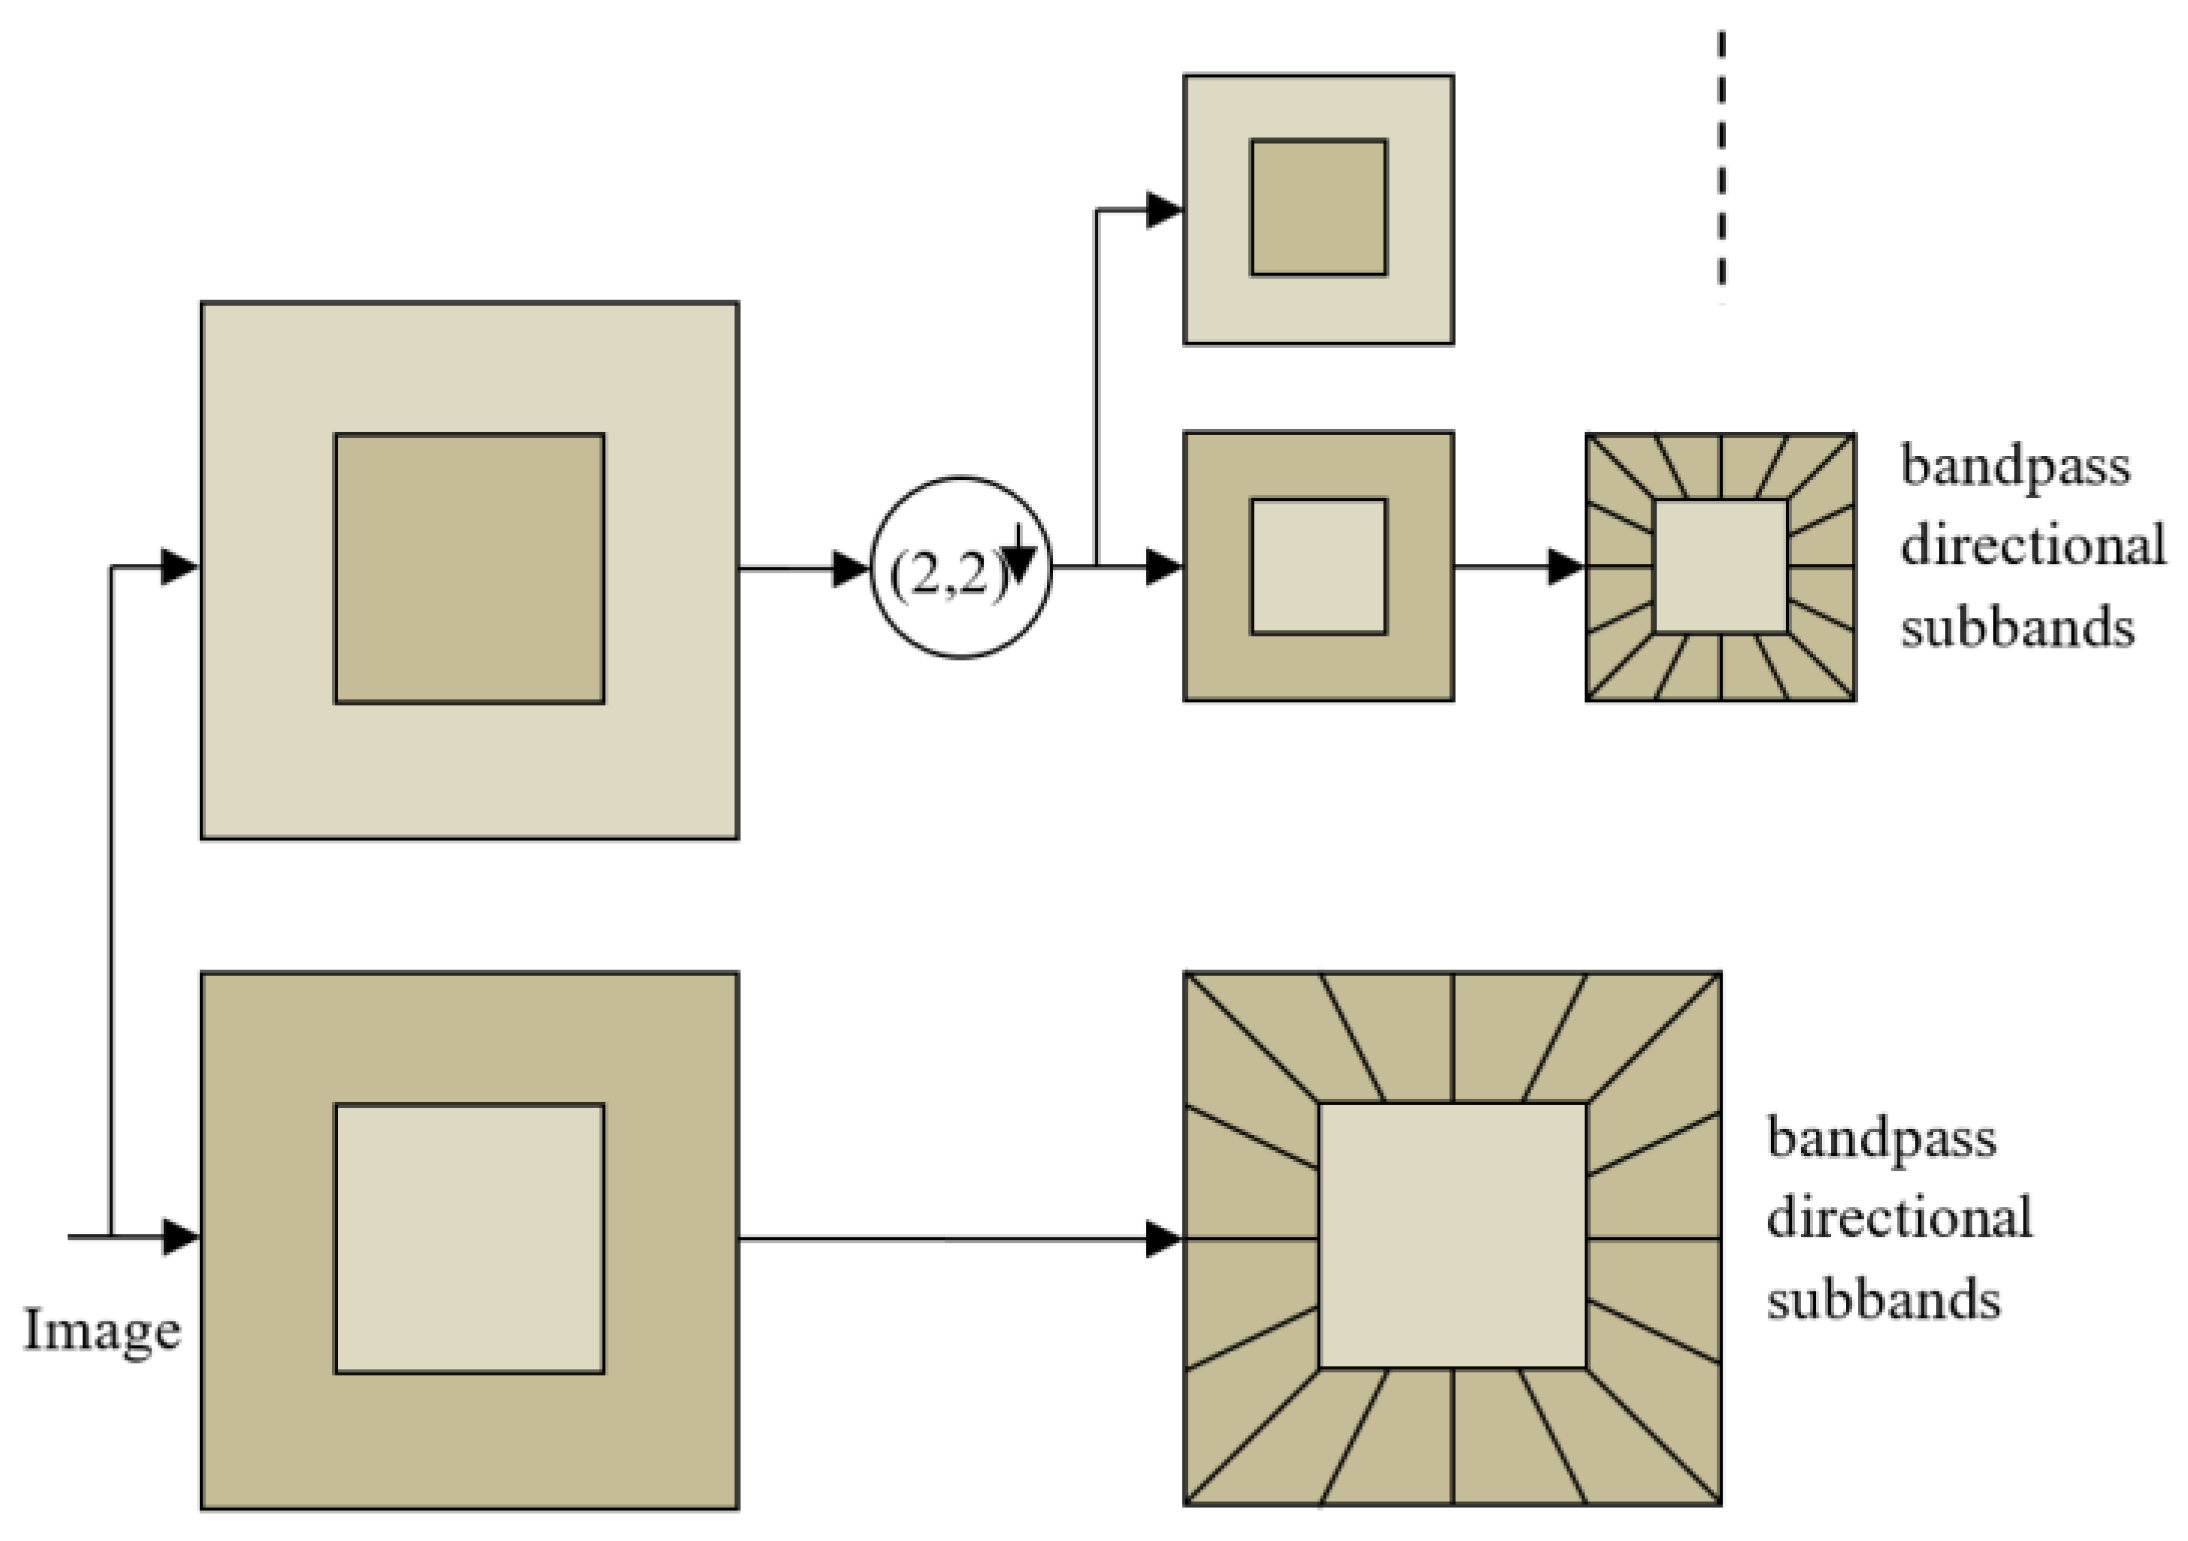
3. Essential Concept—Contourlet Based MRA
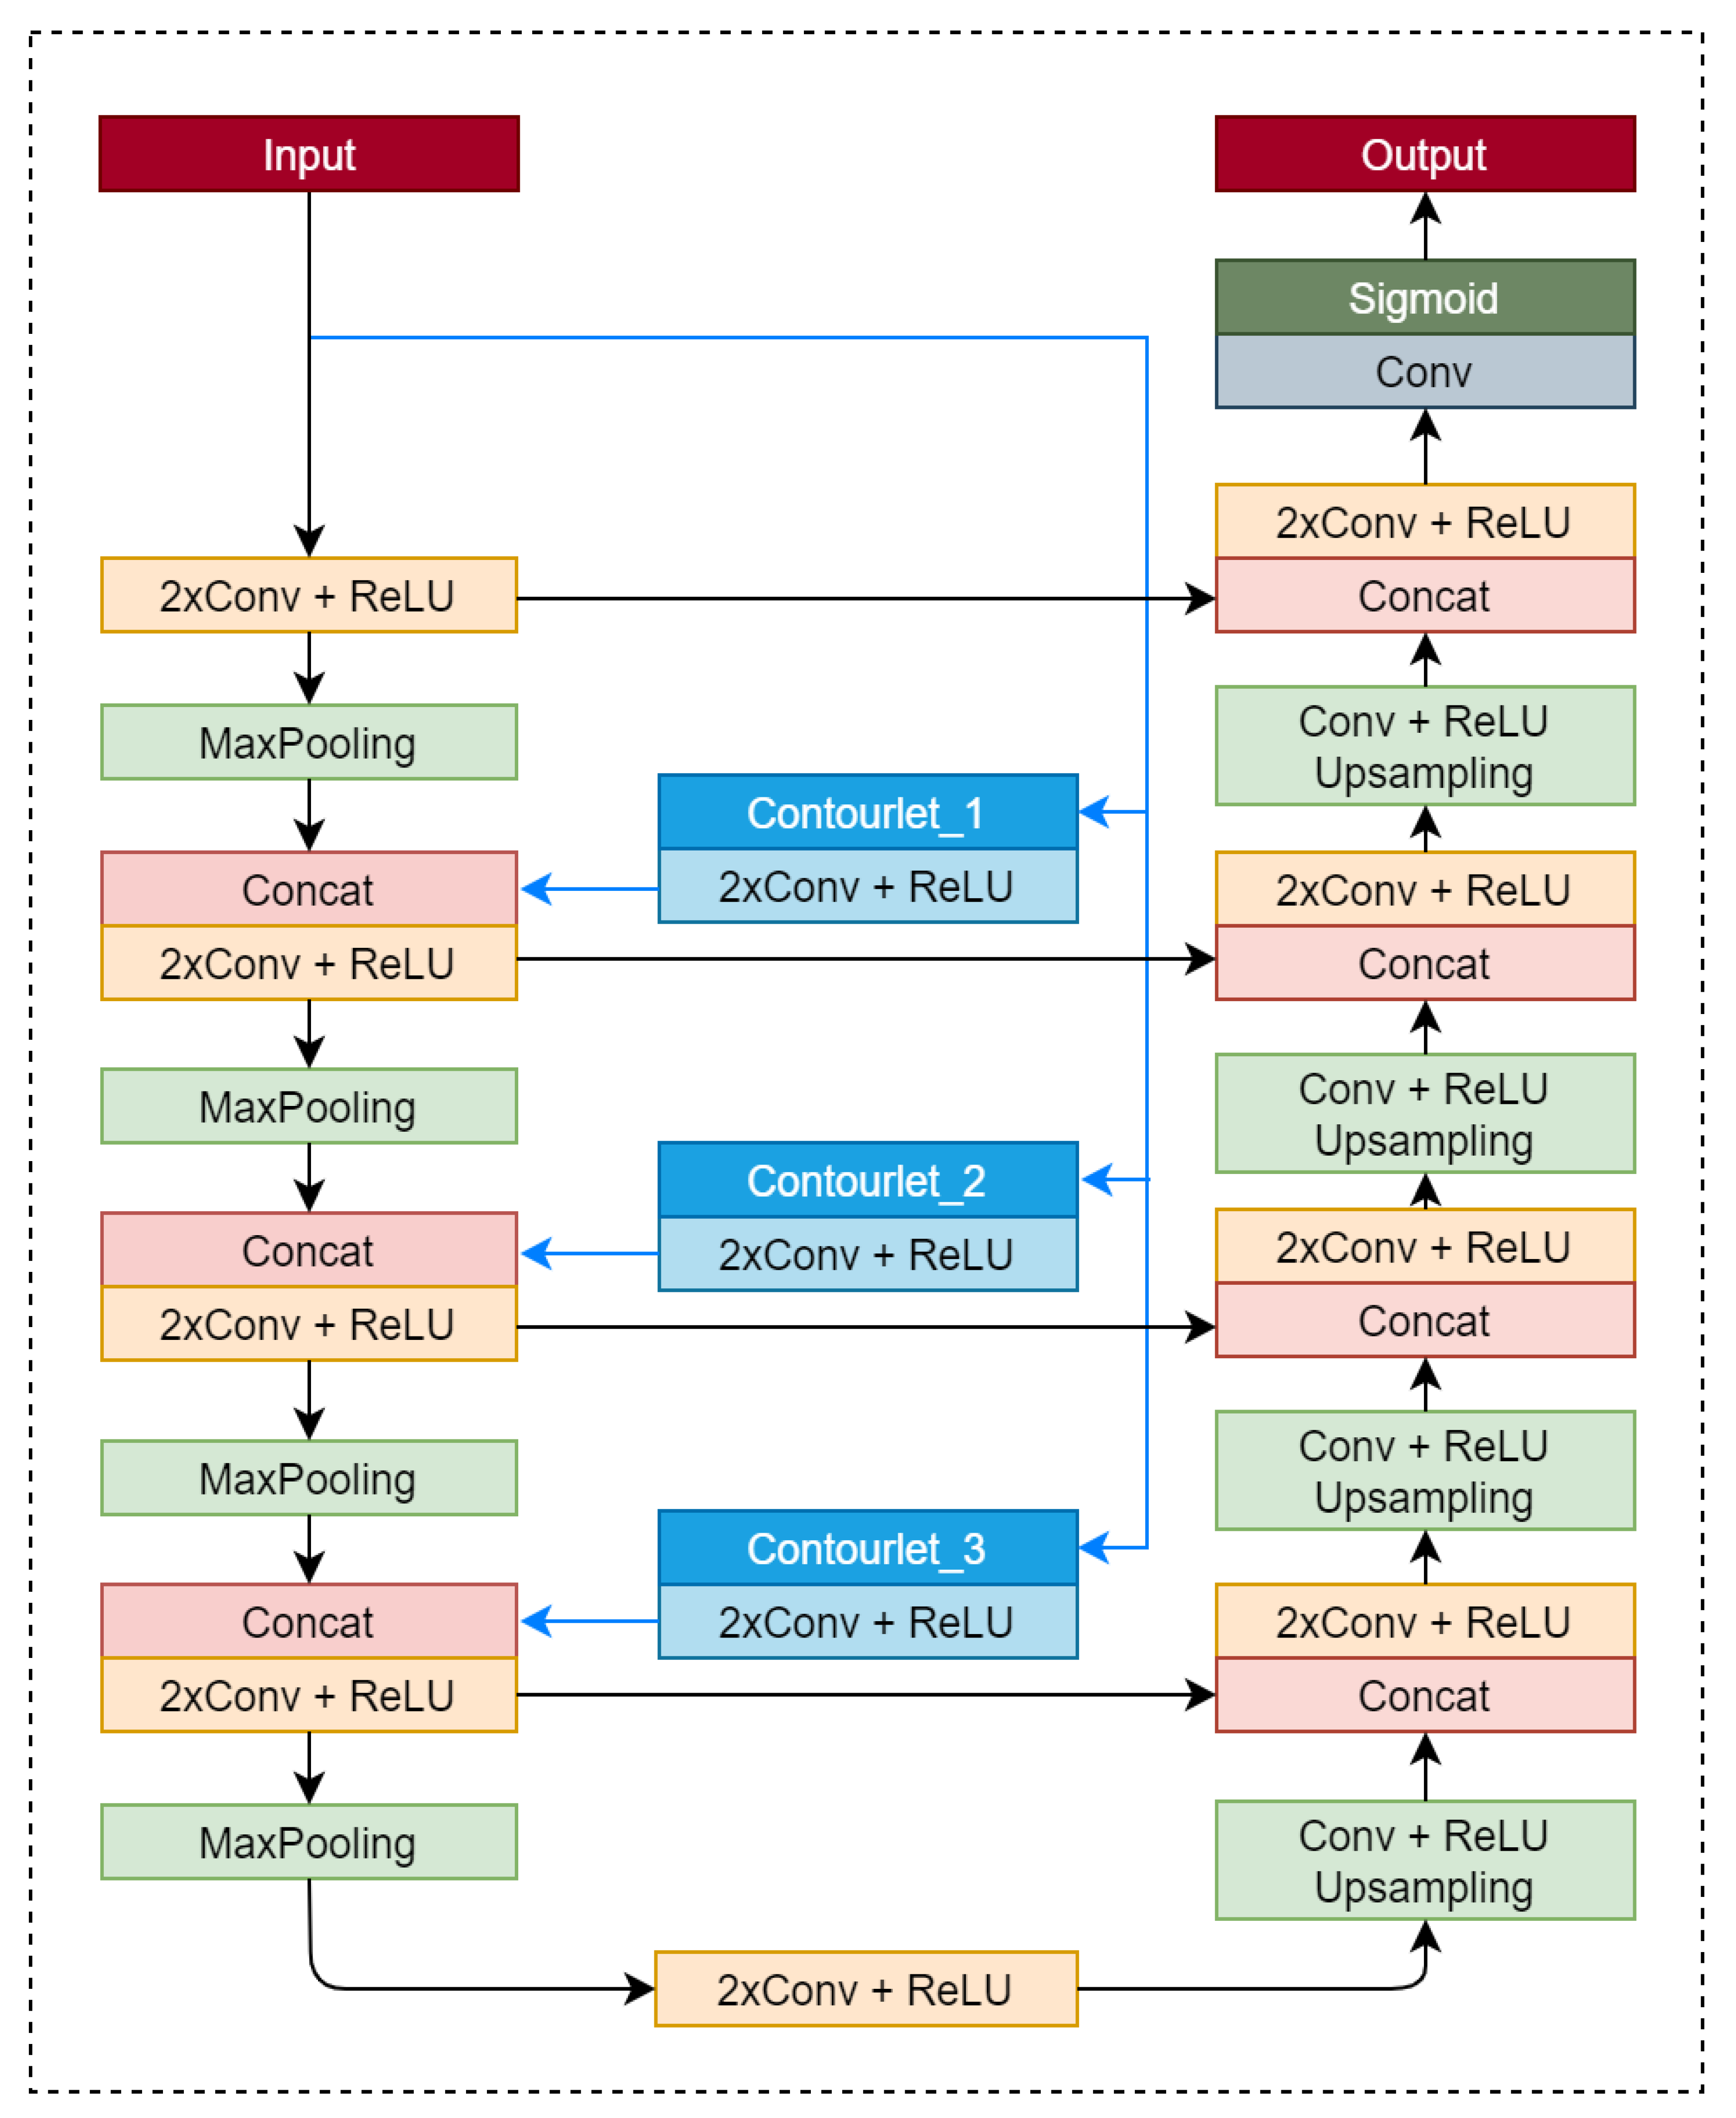
4. Proposed Method
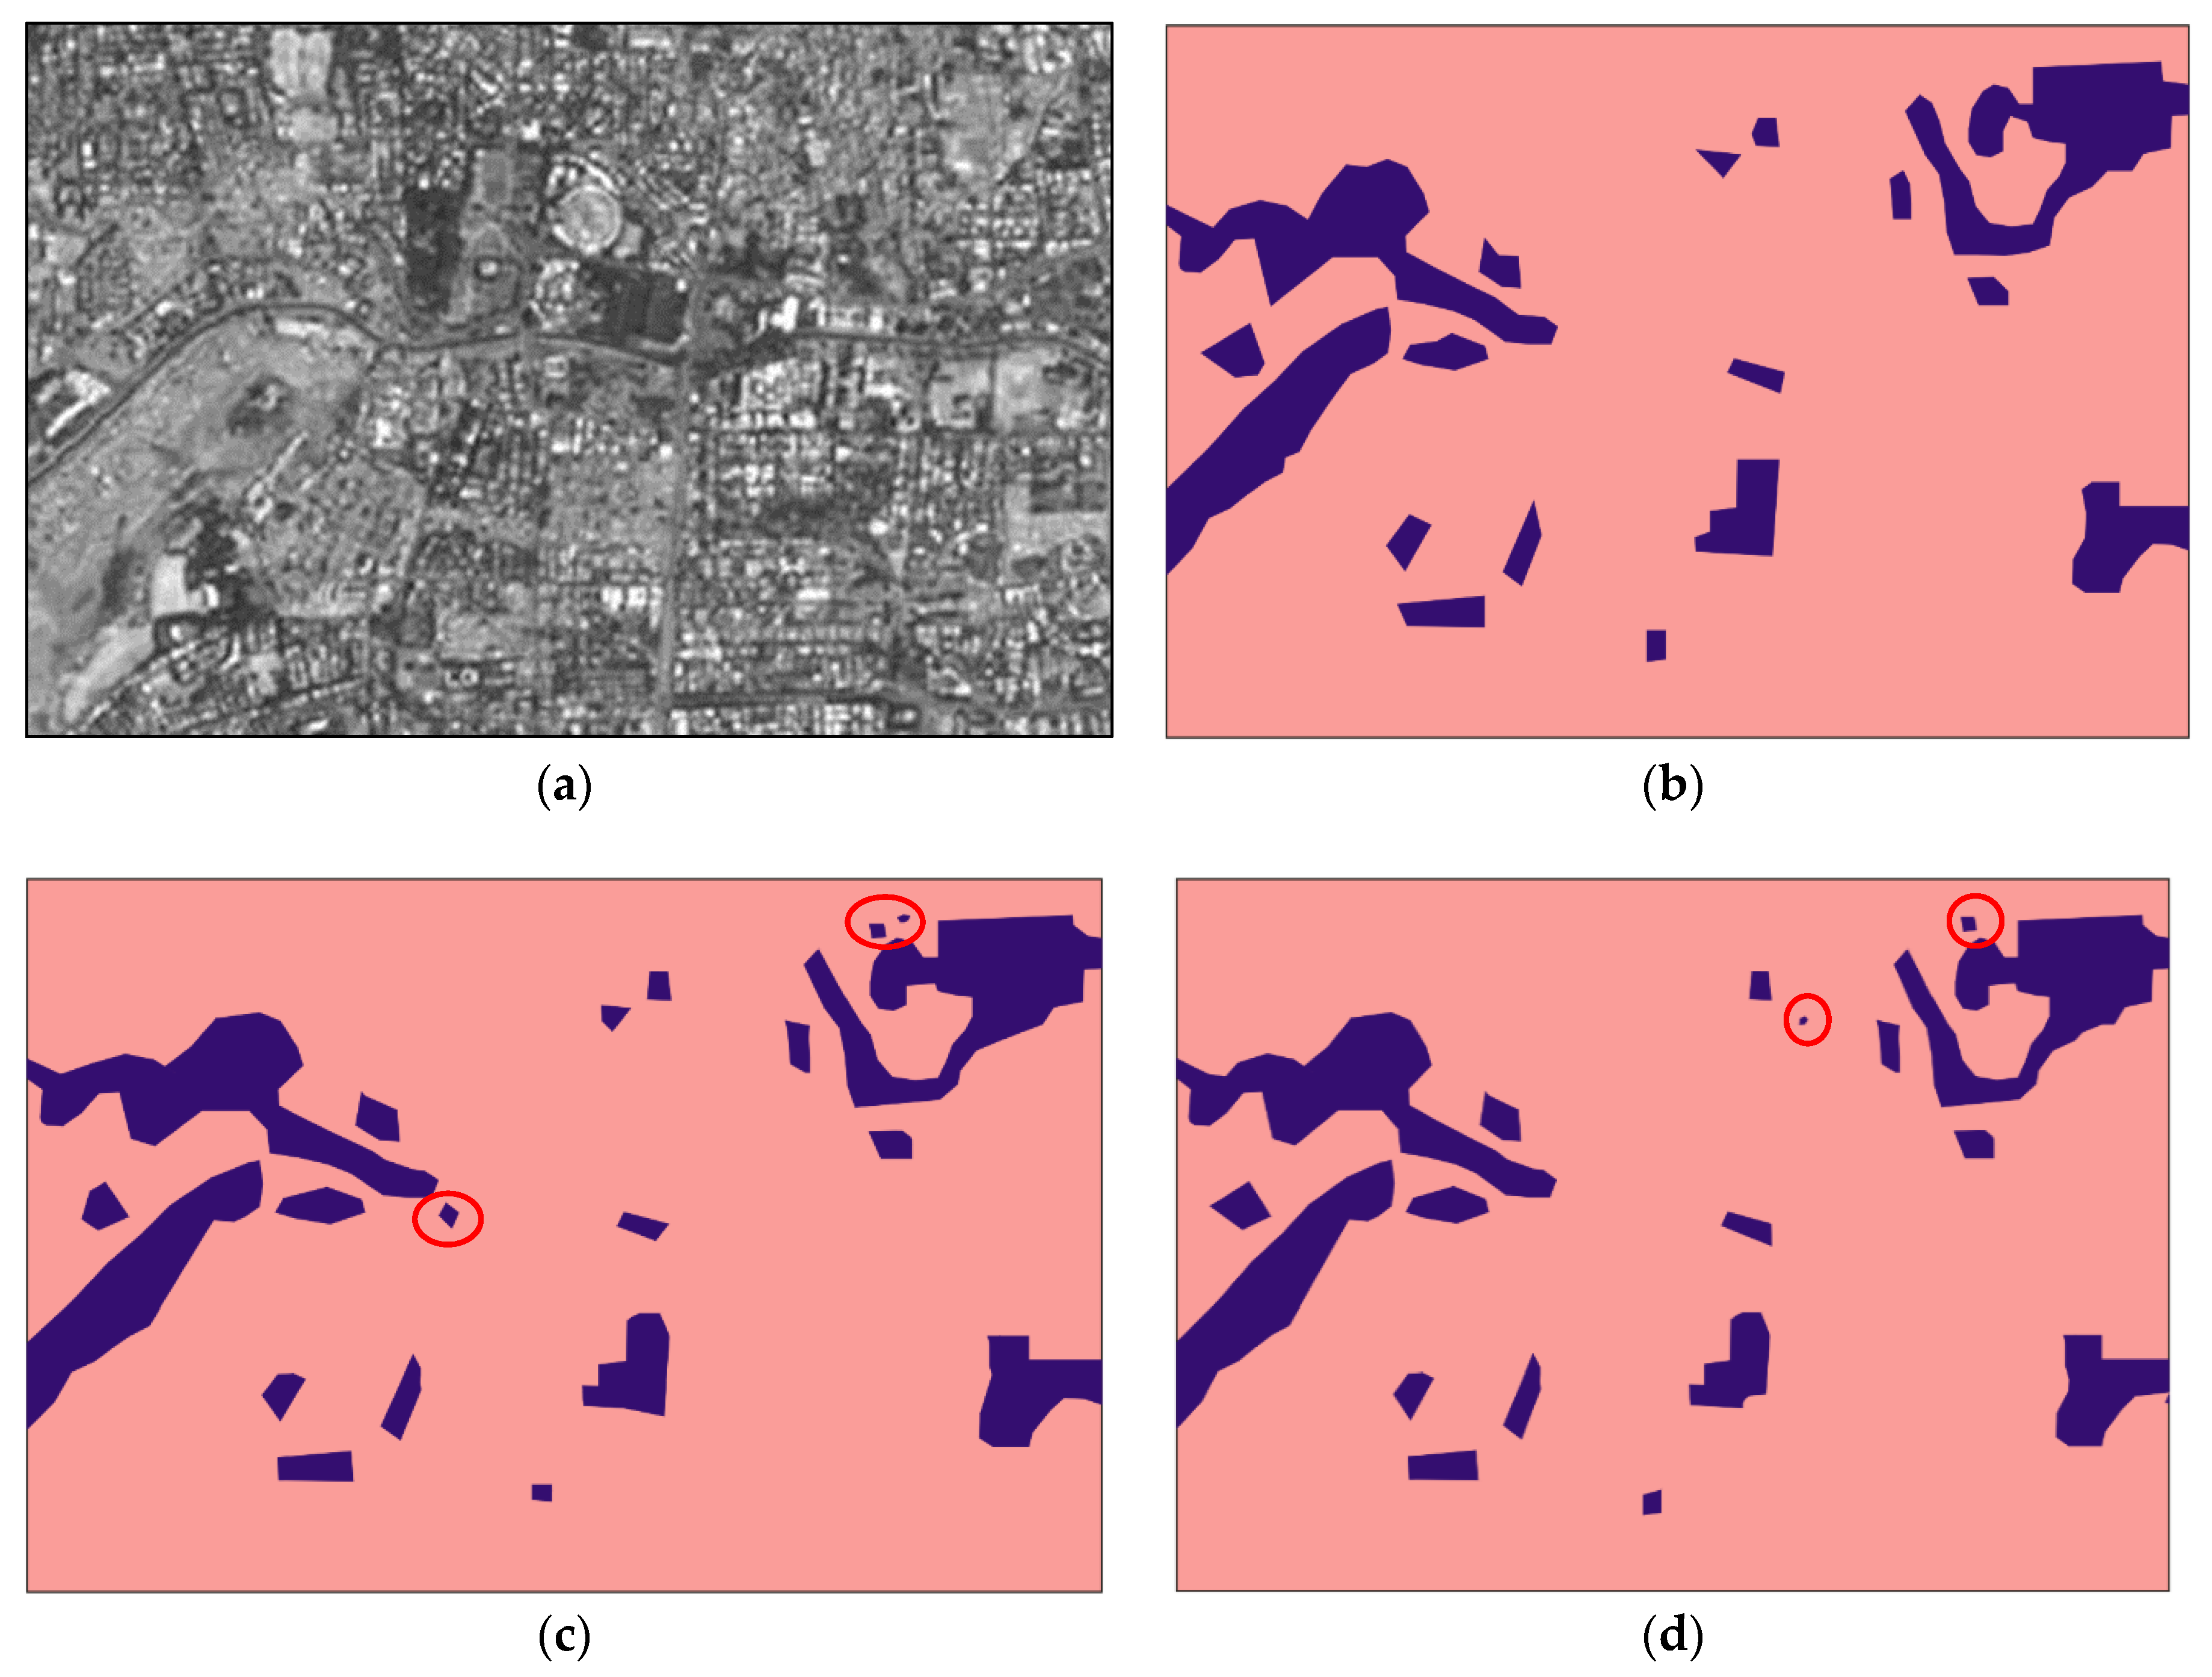
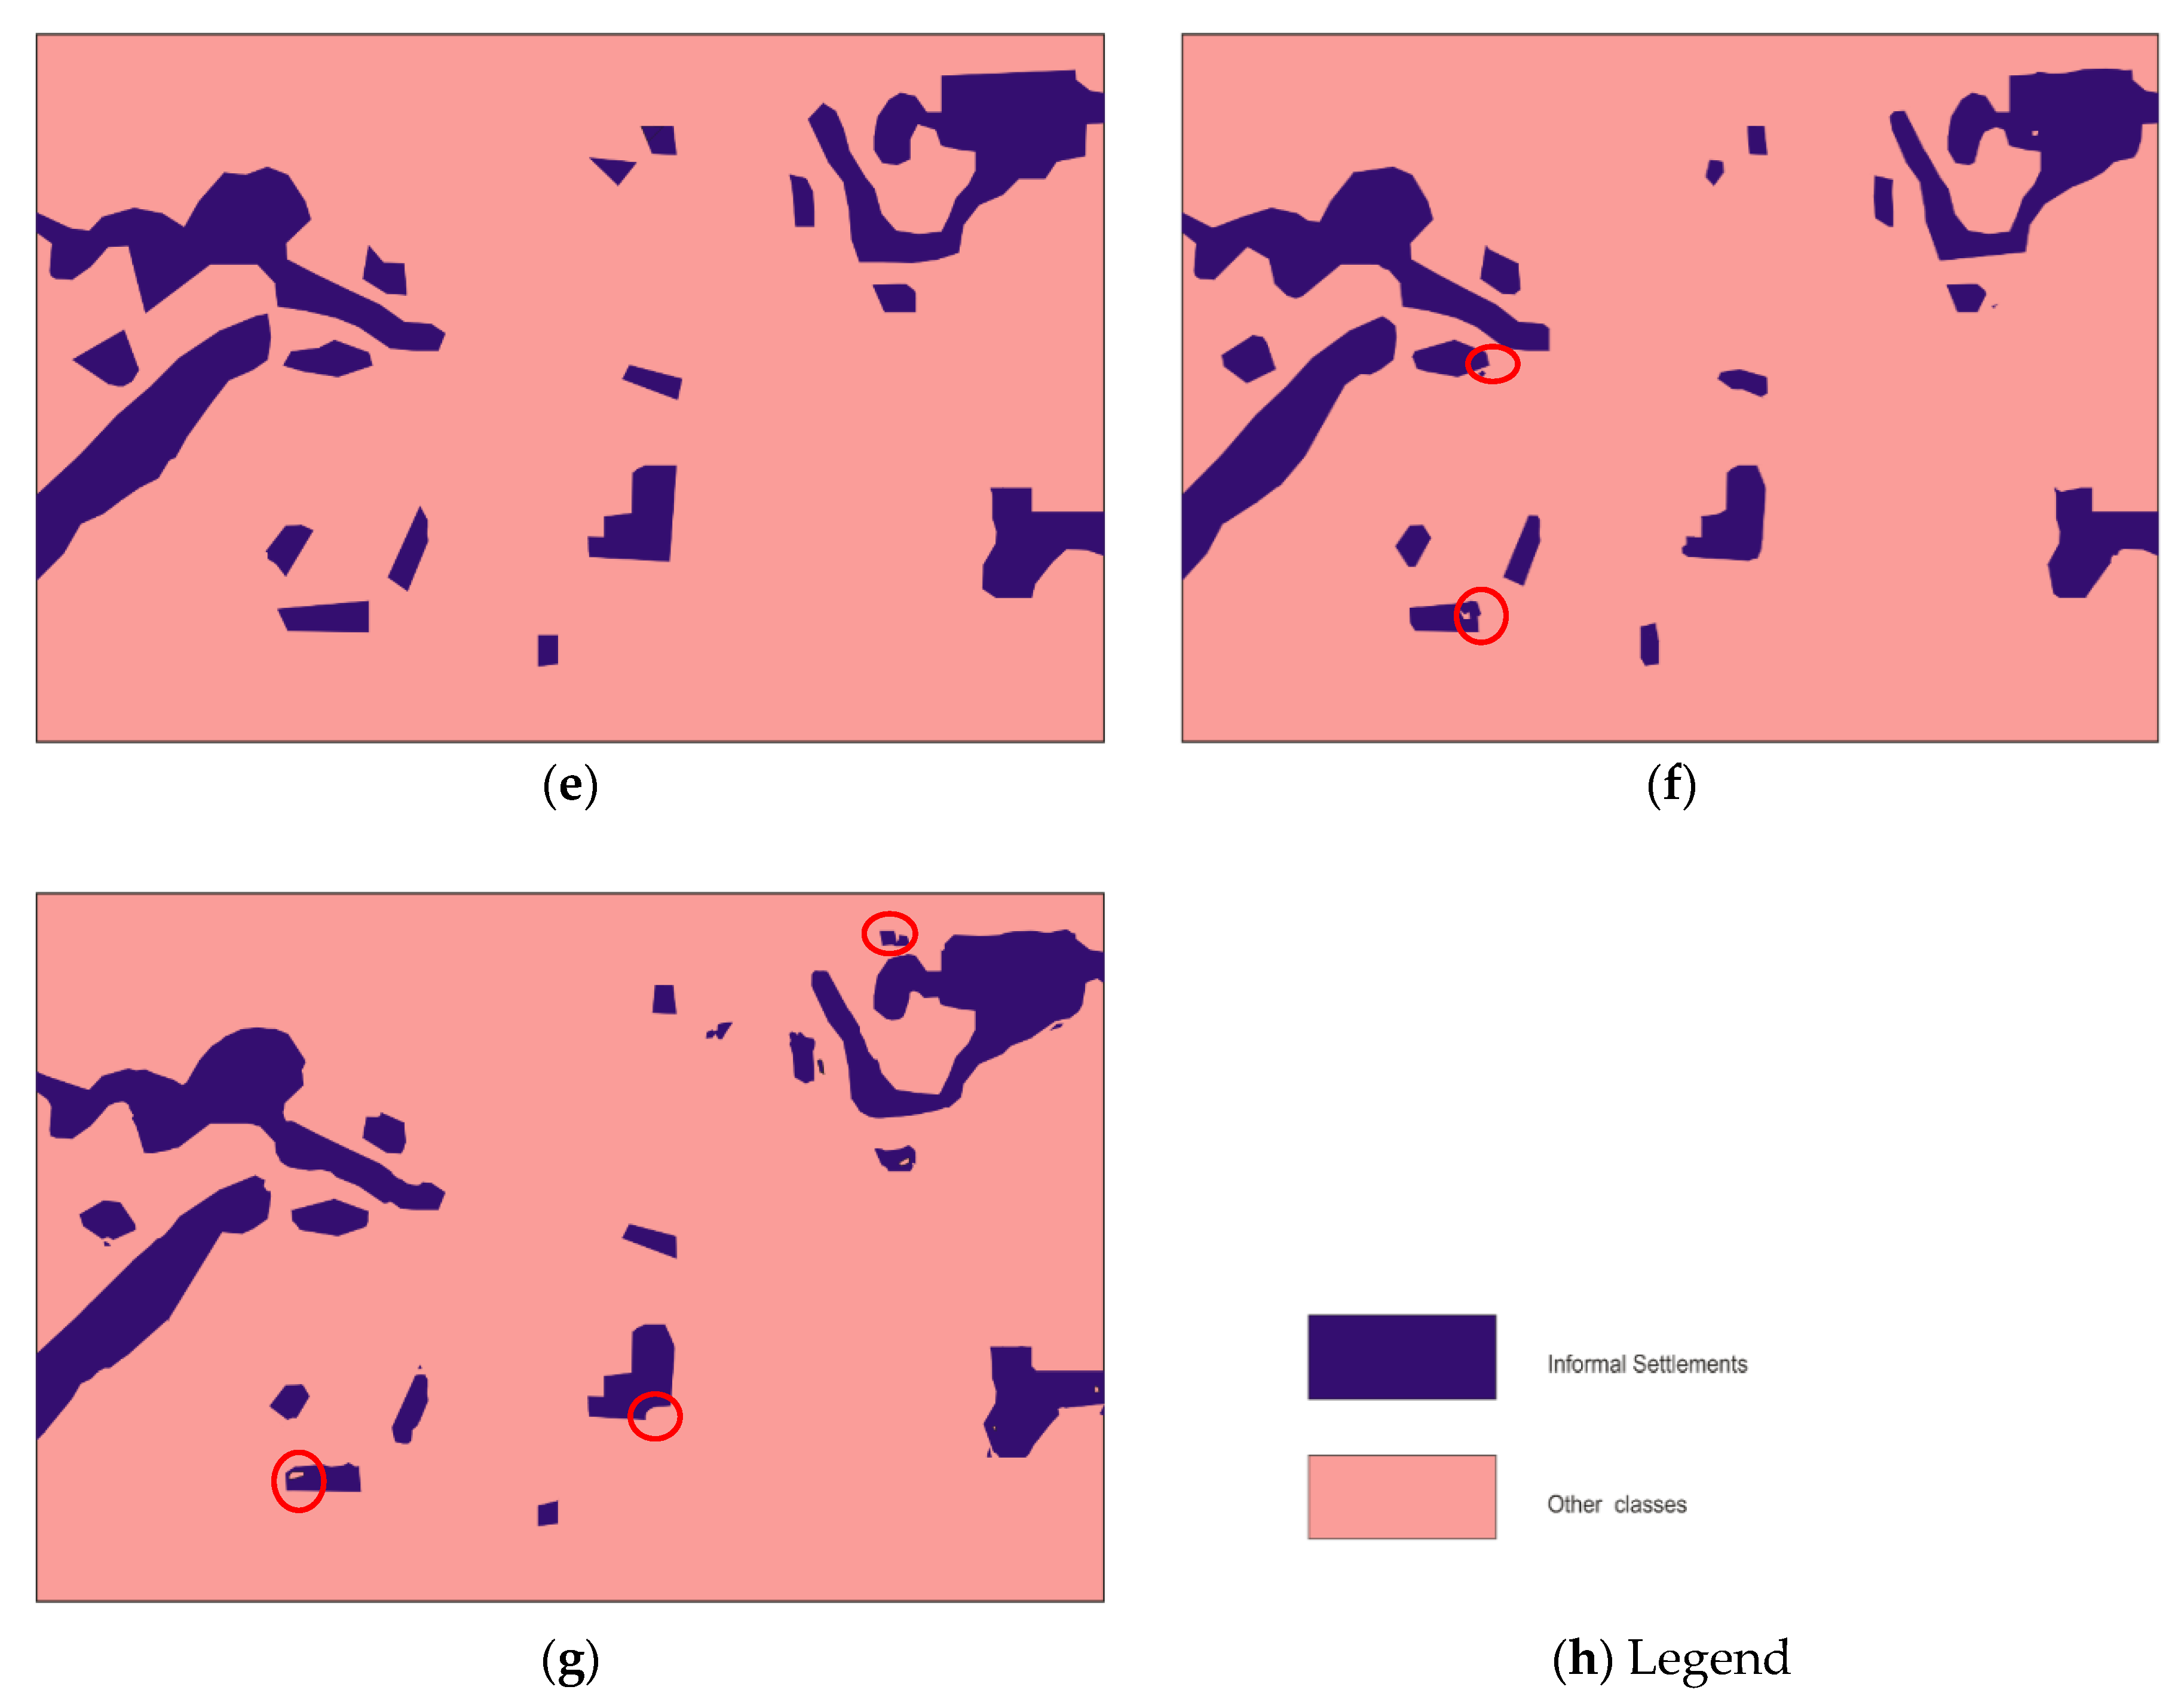
5. Results
5.1. Dataset
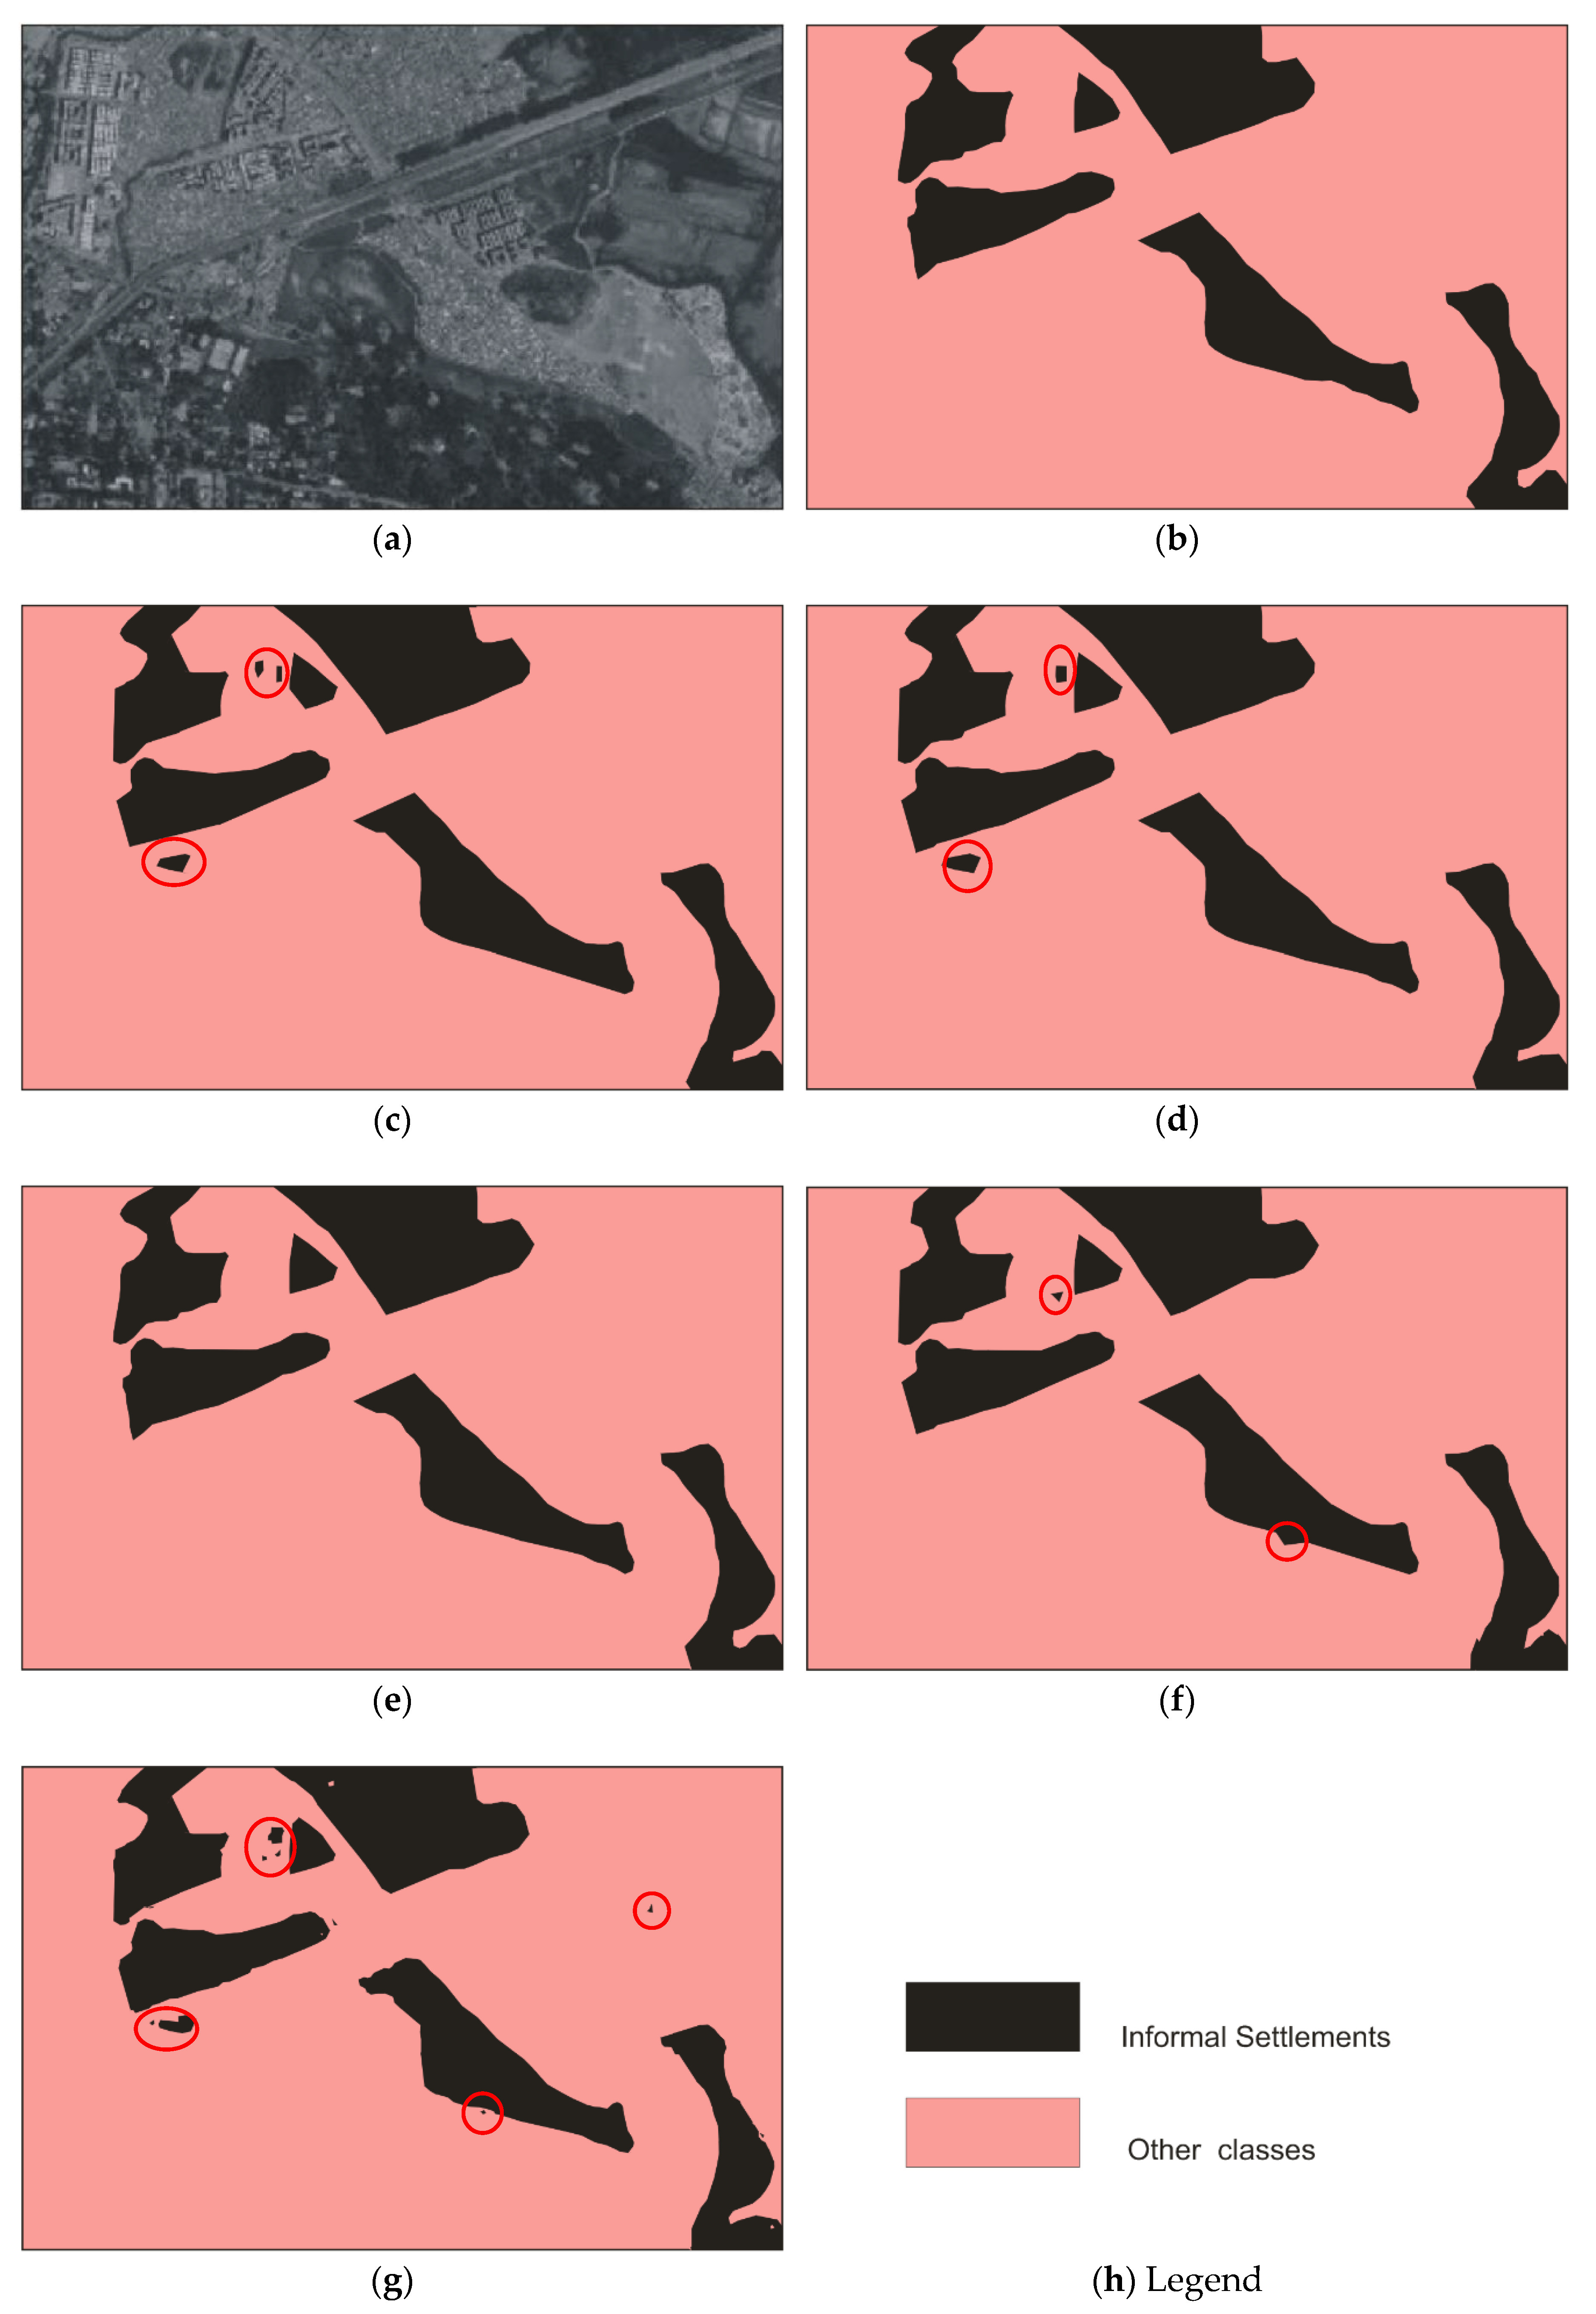
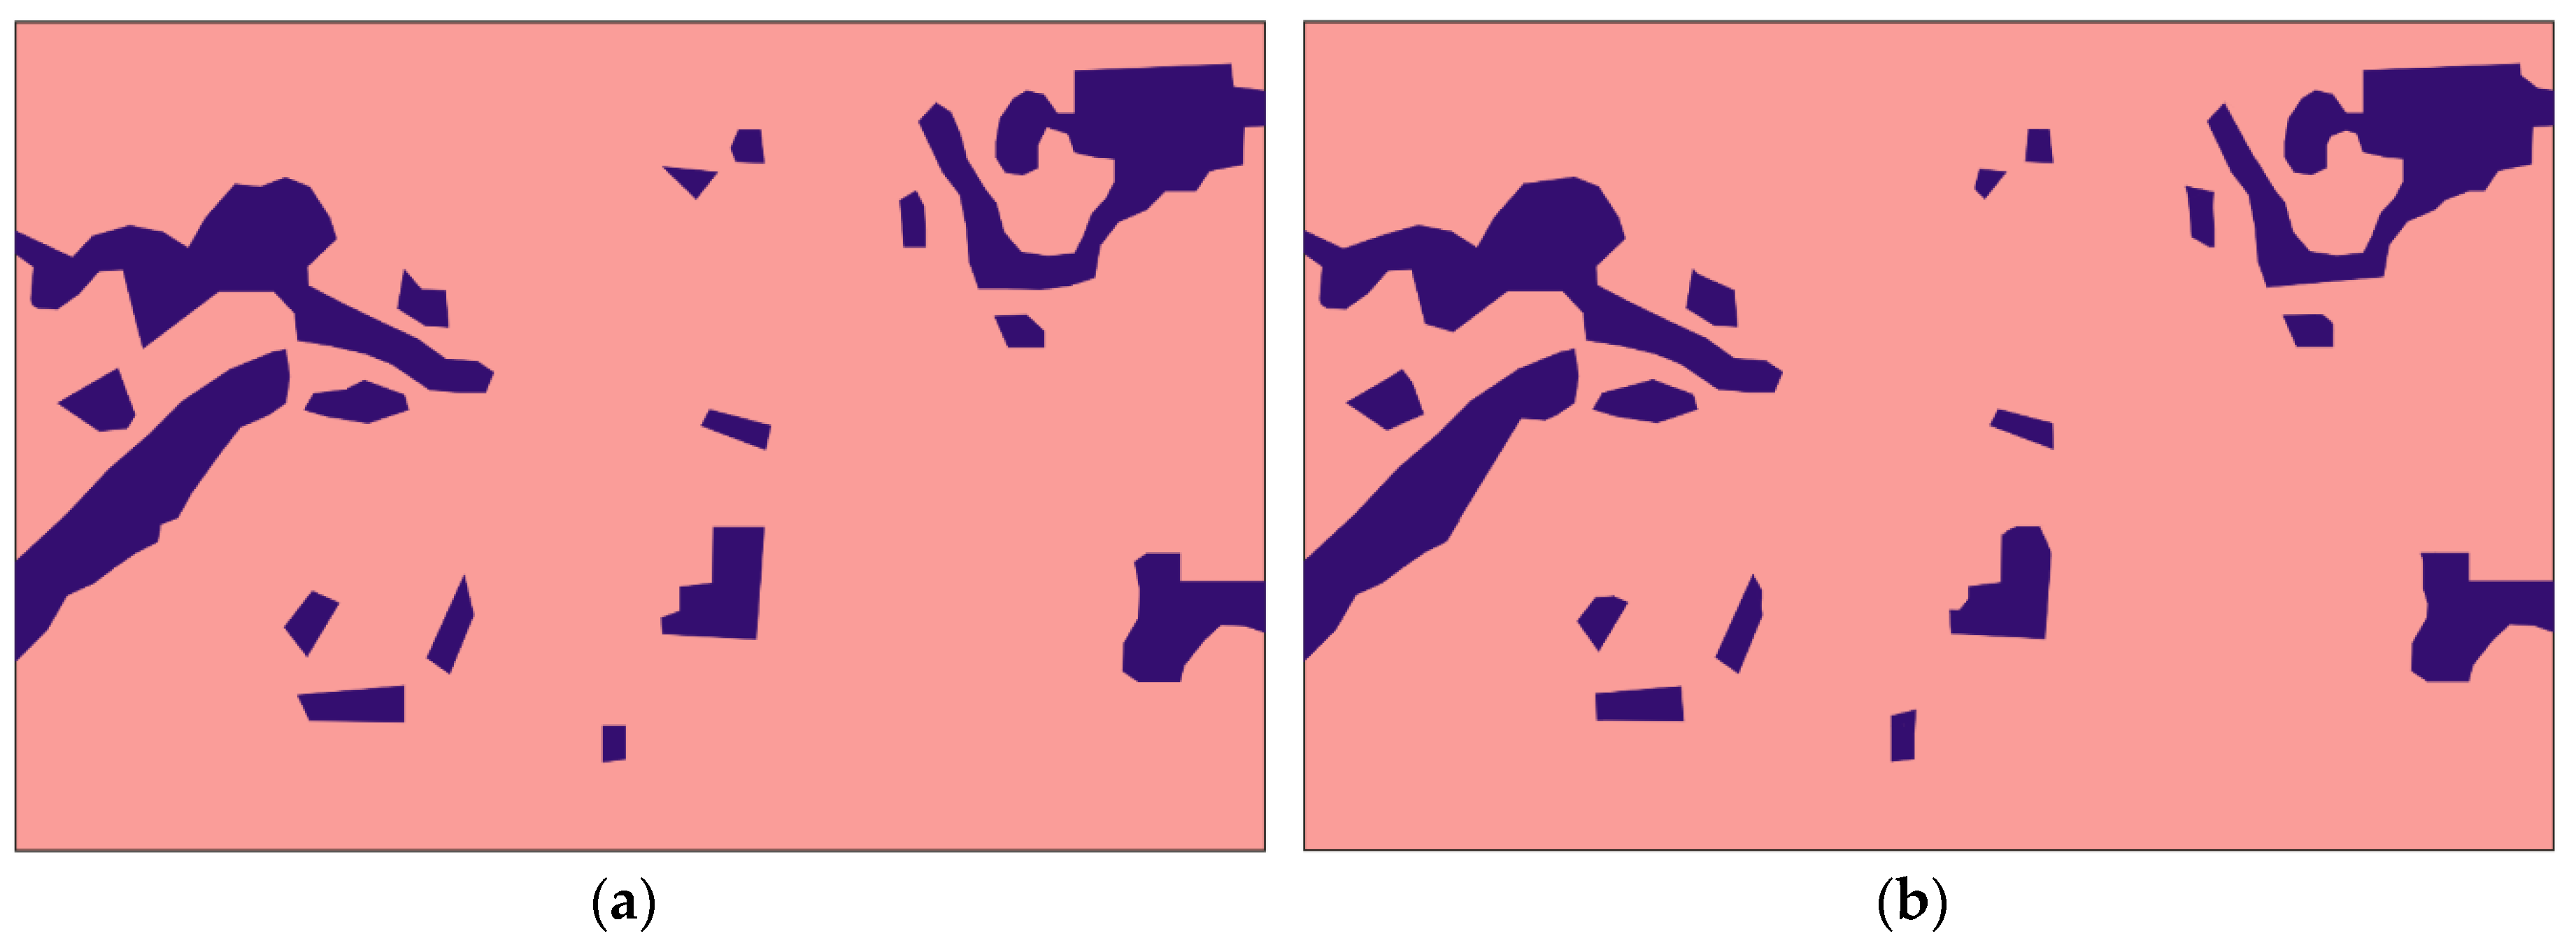
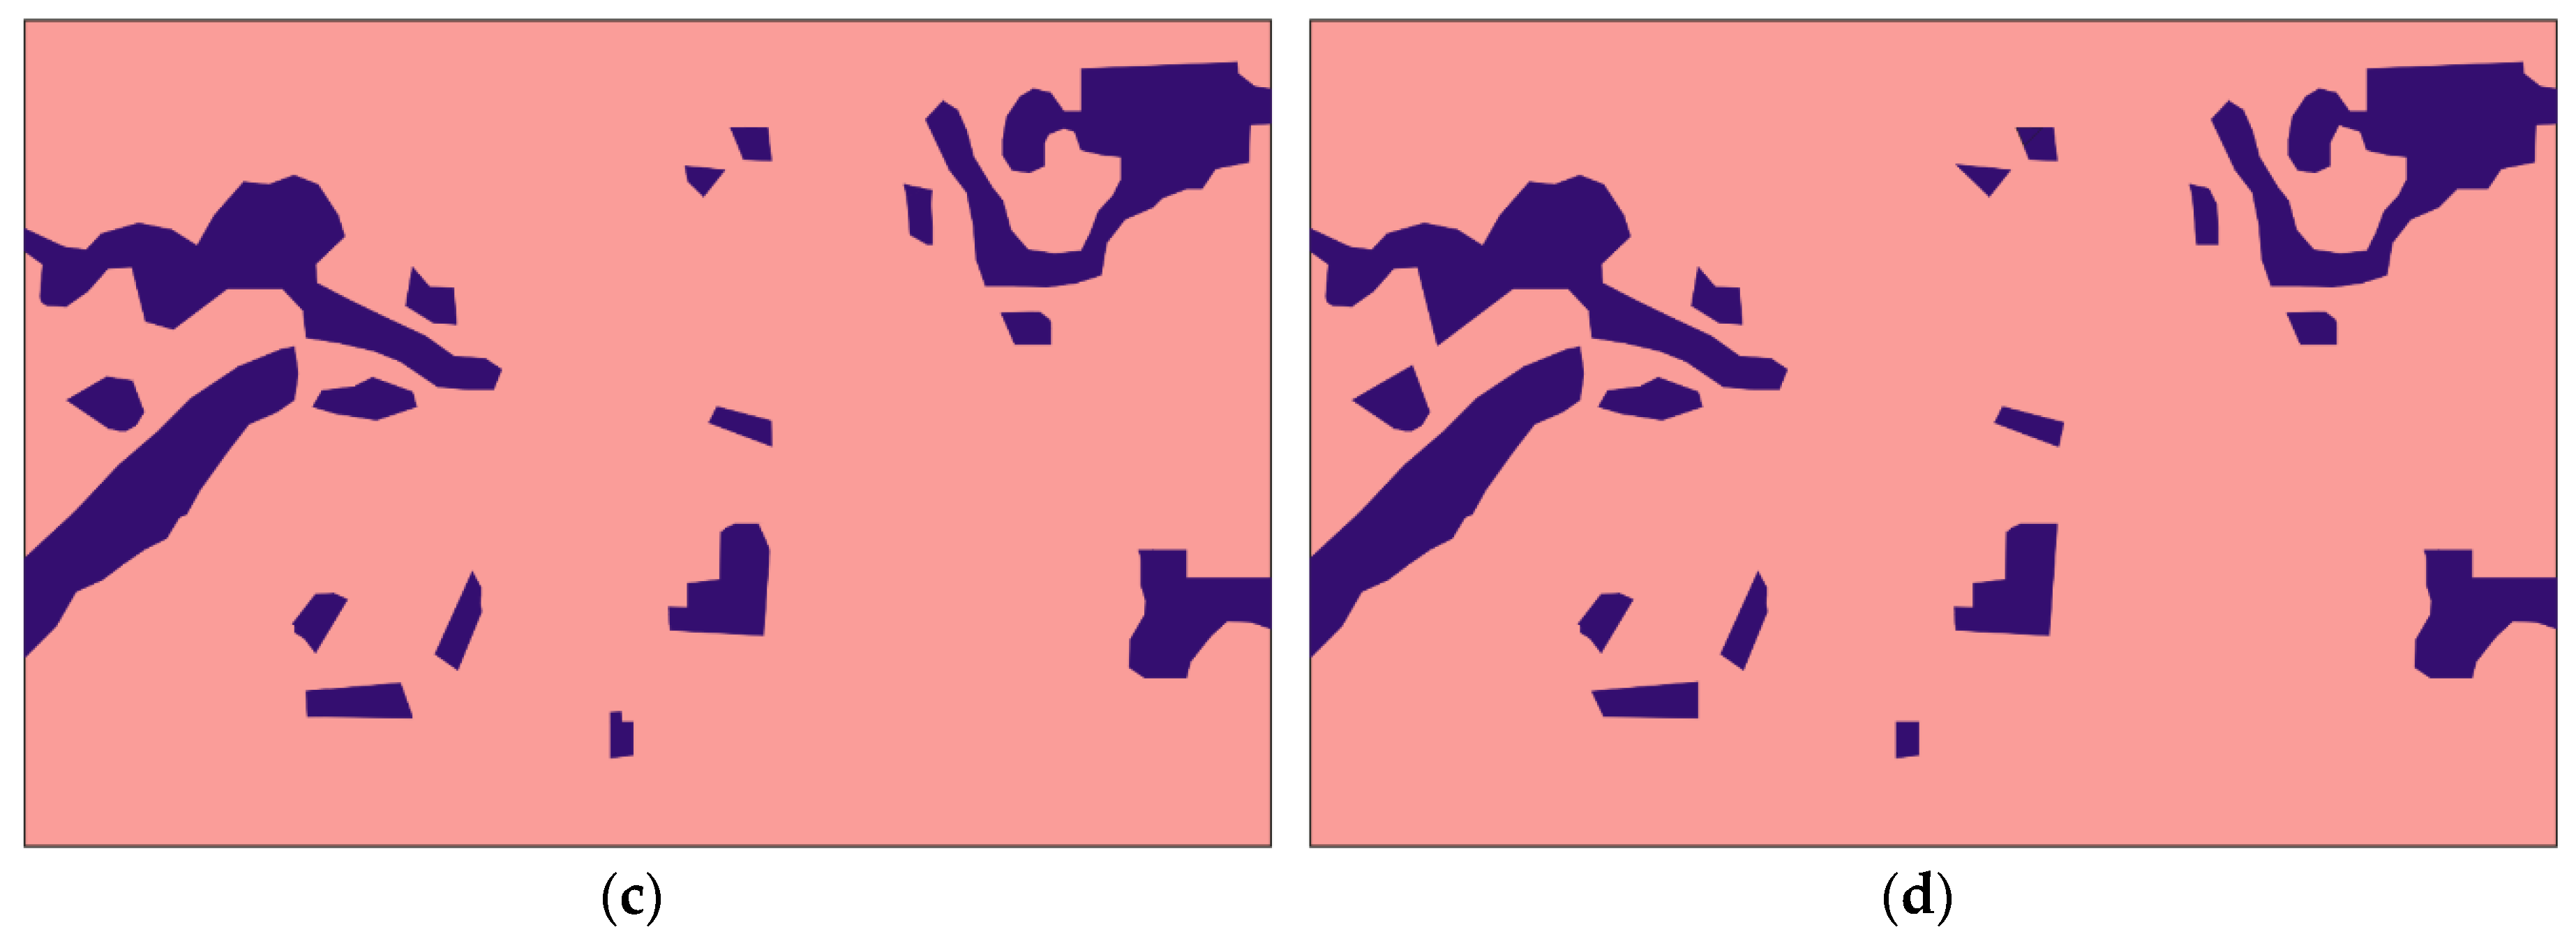
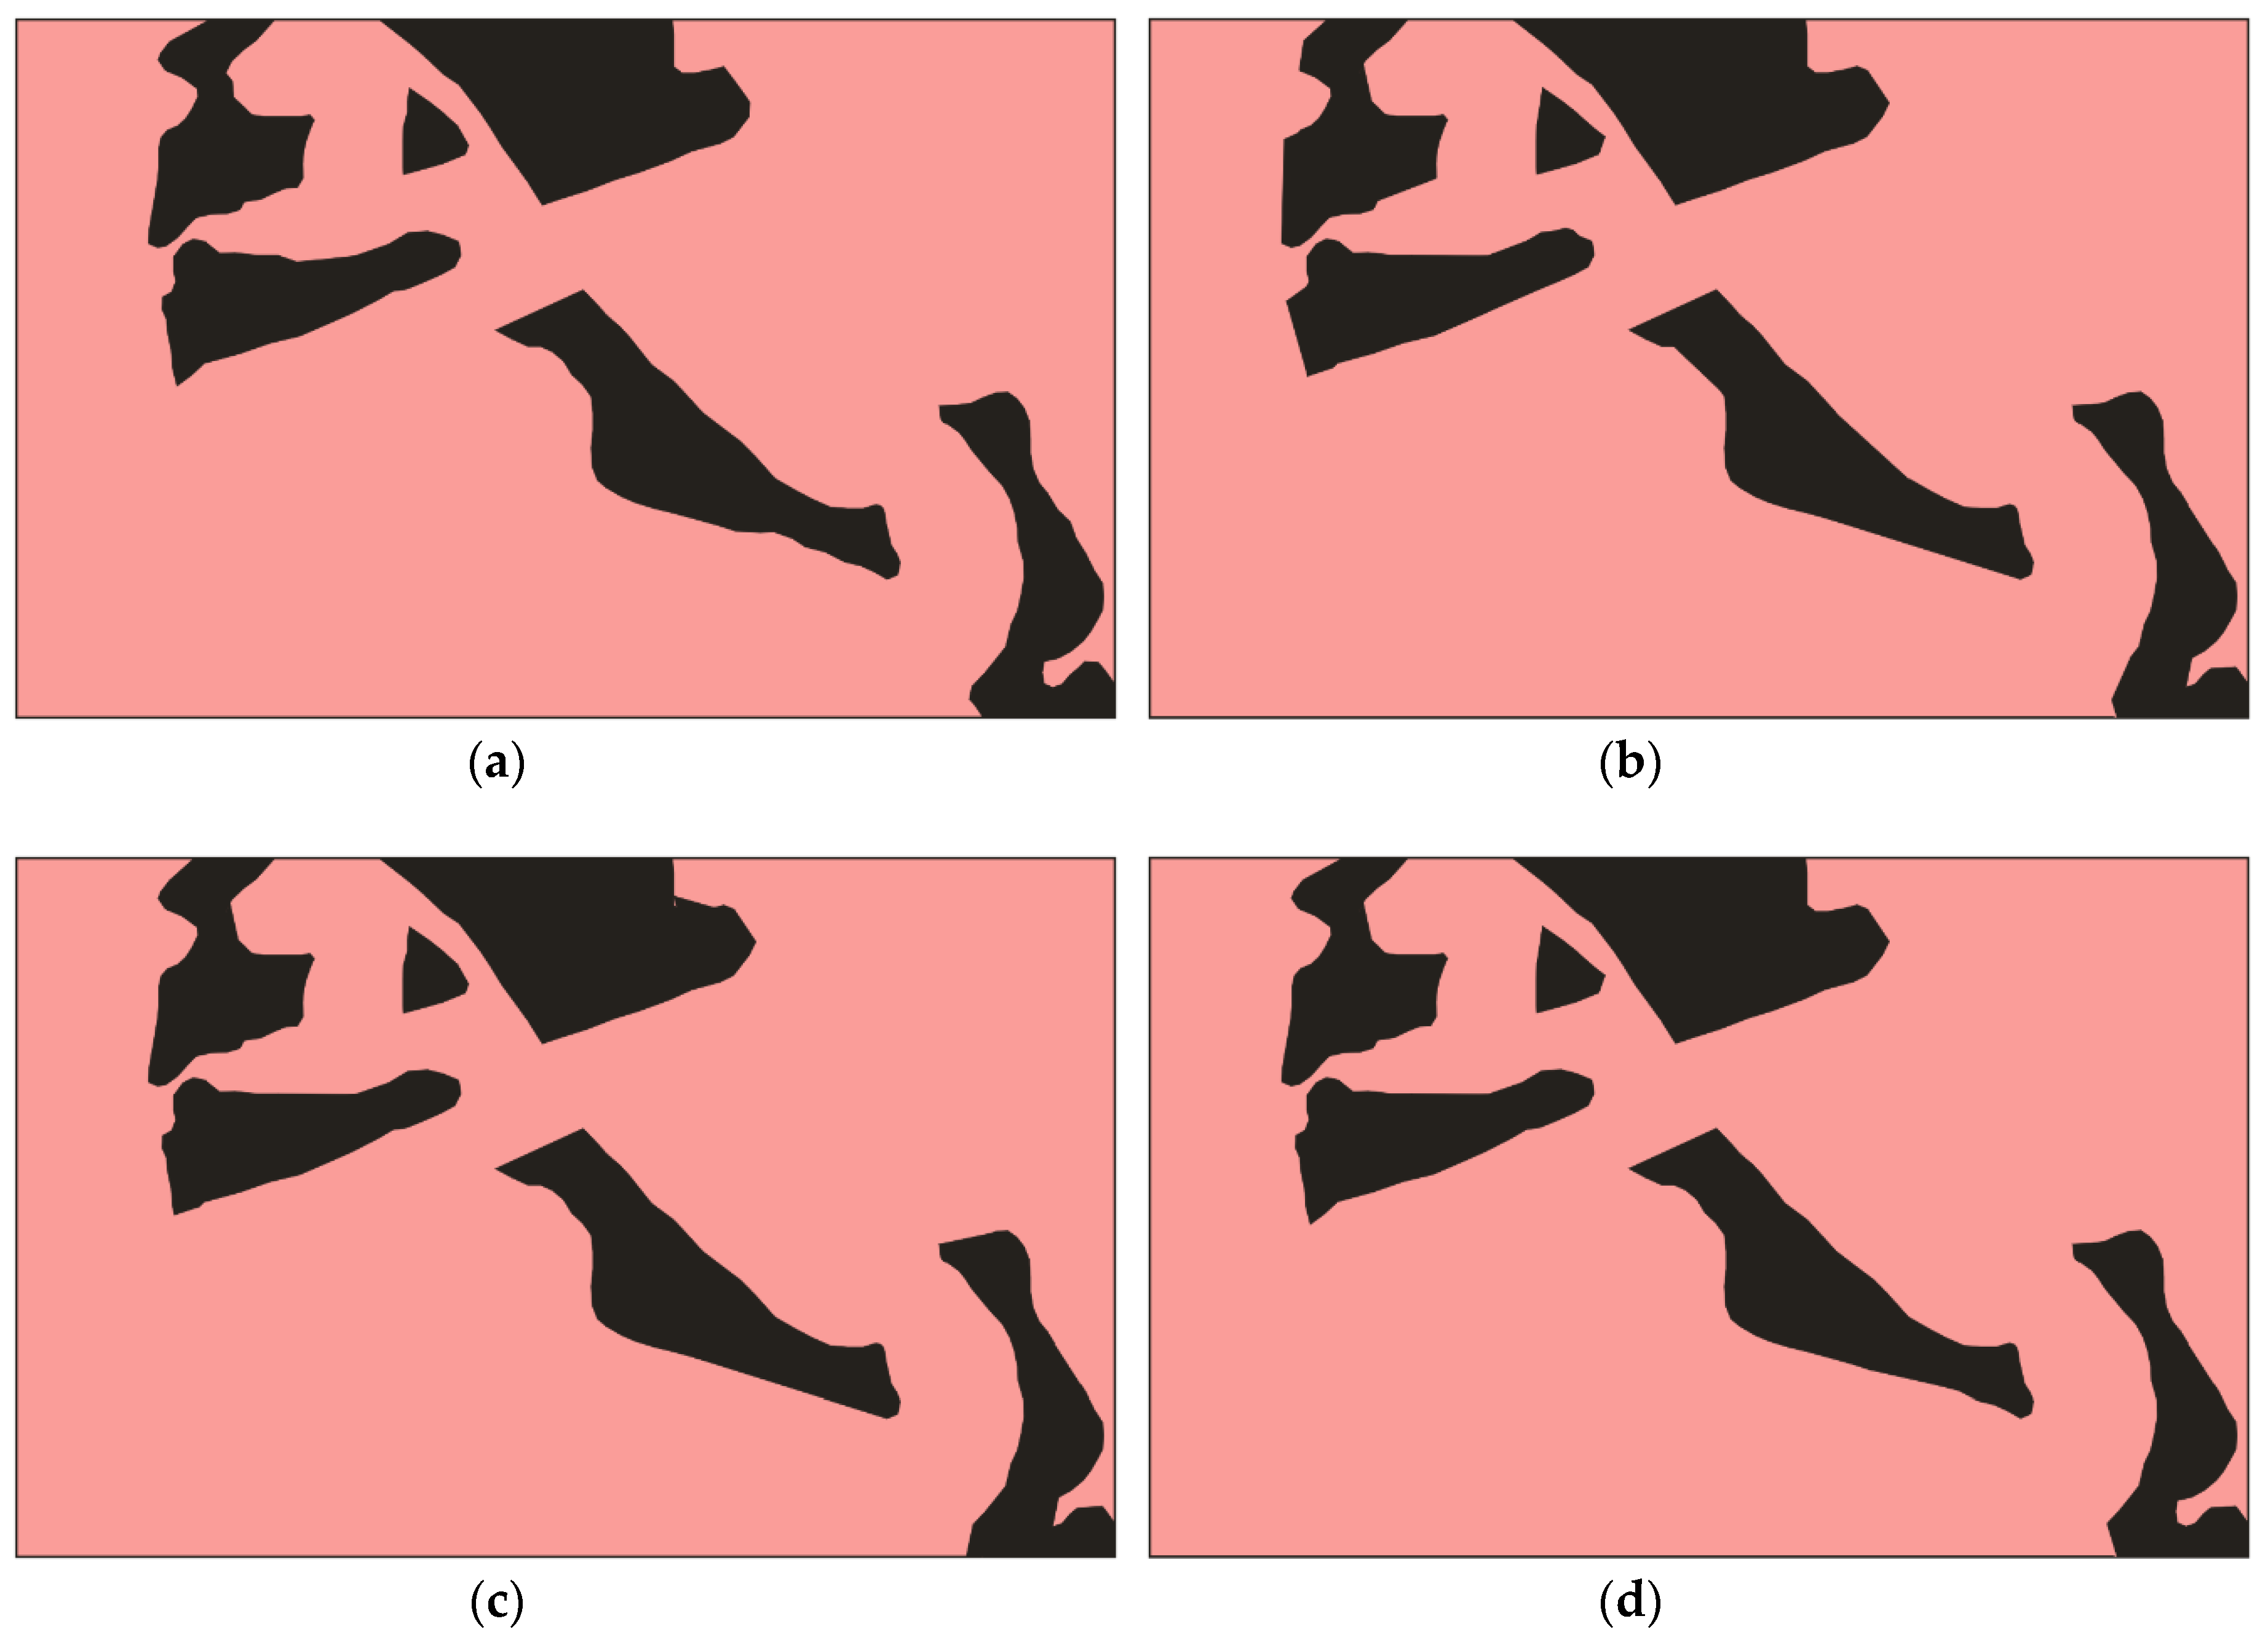
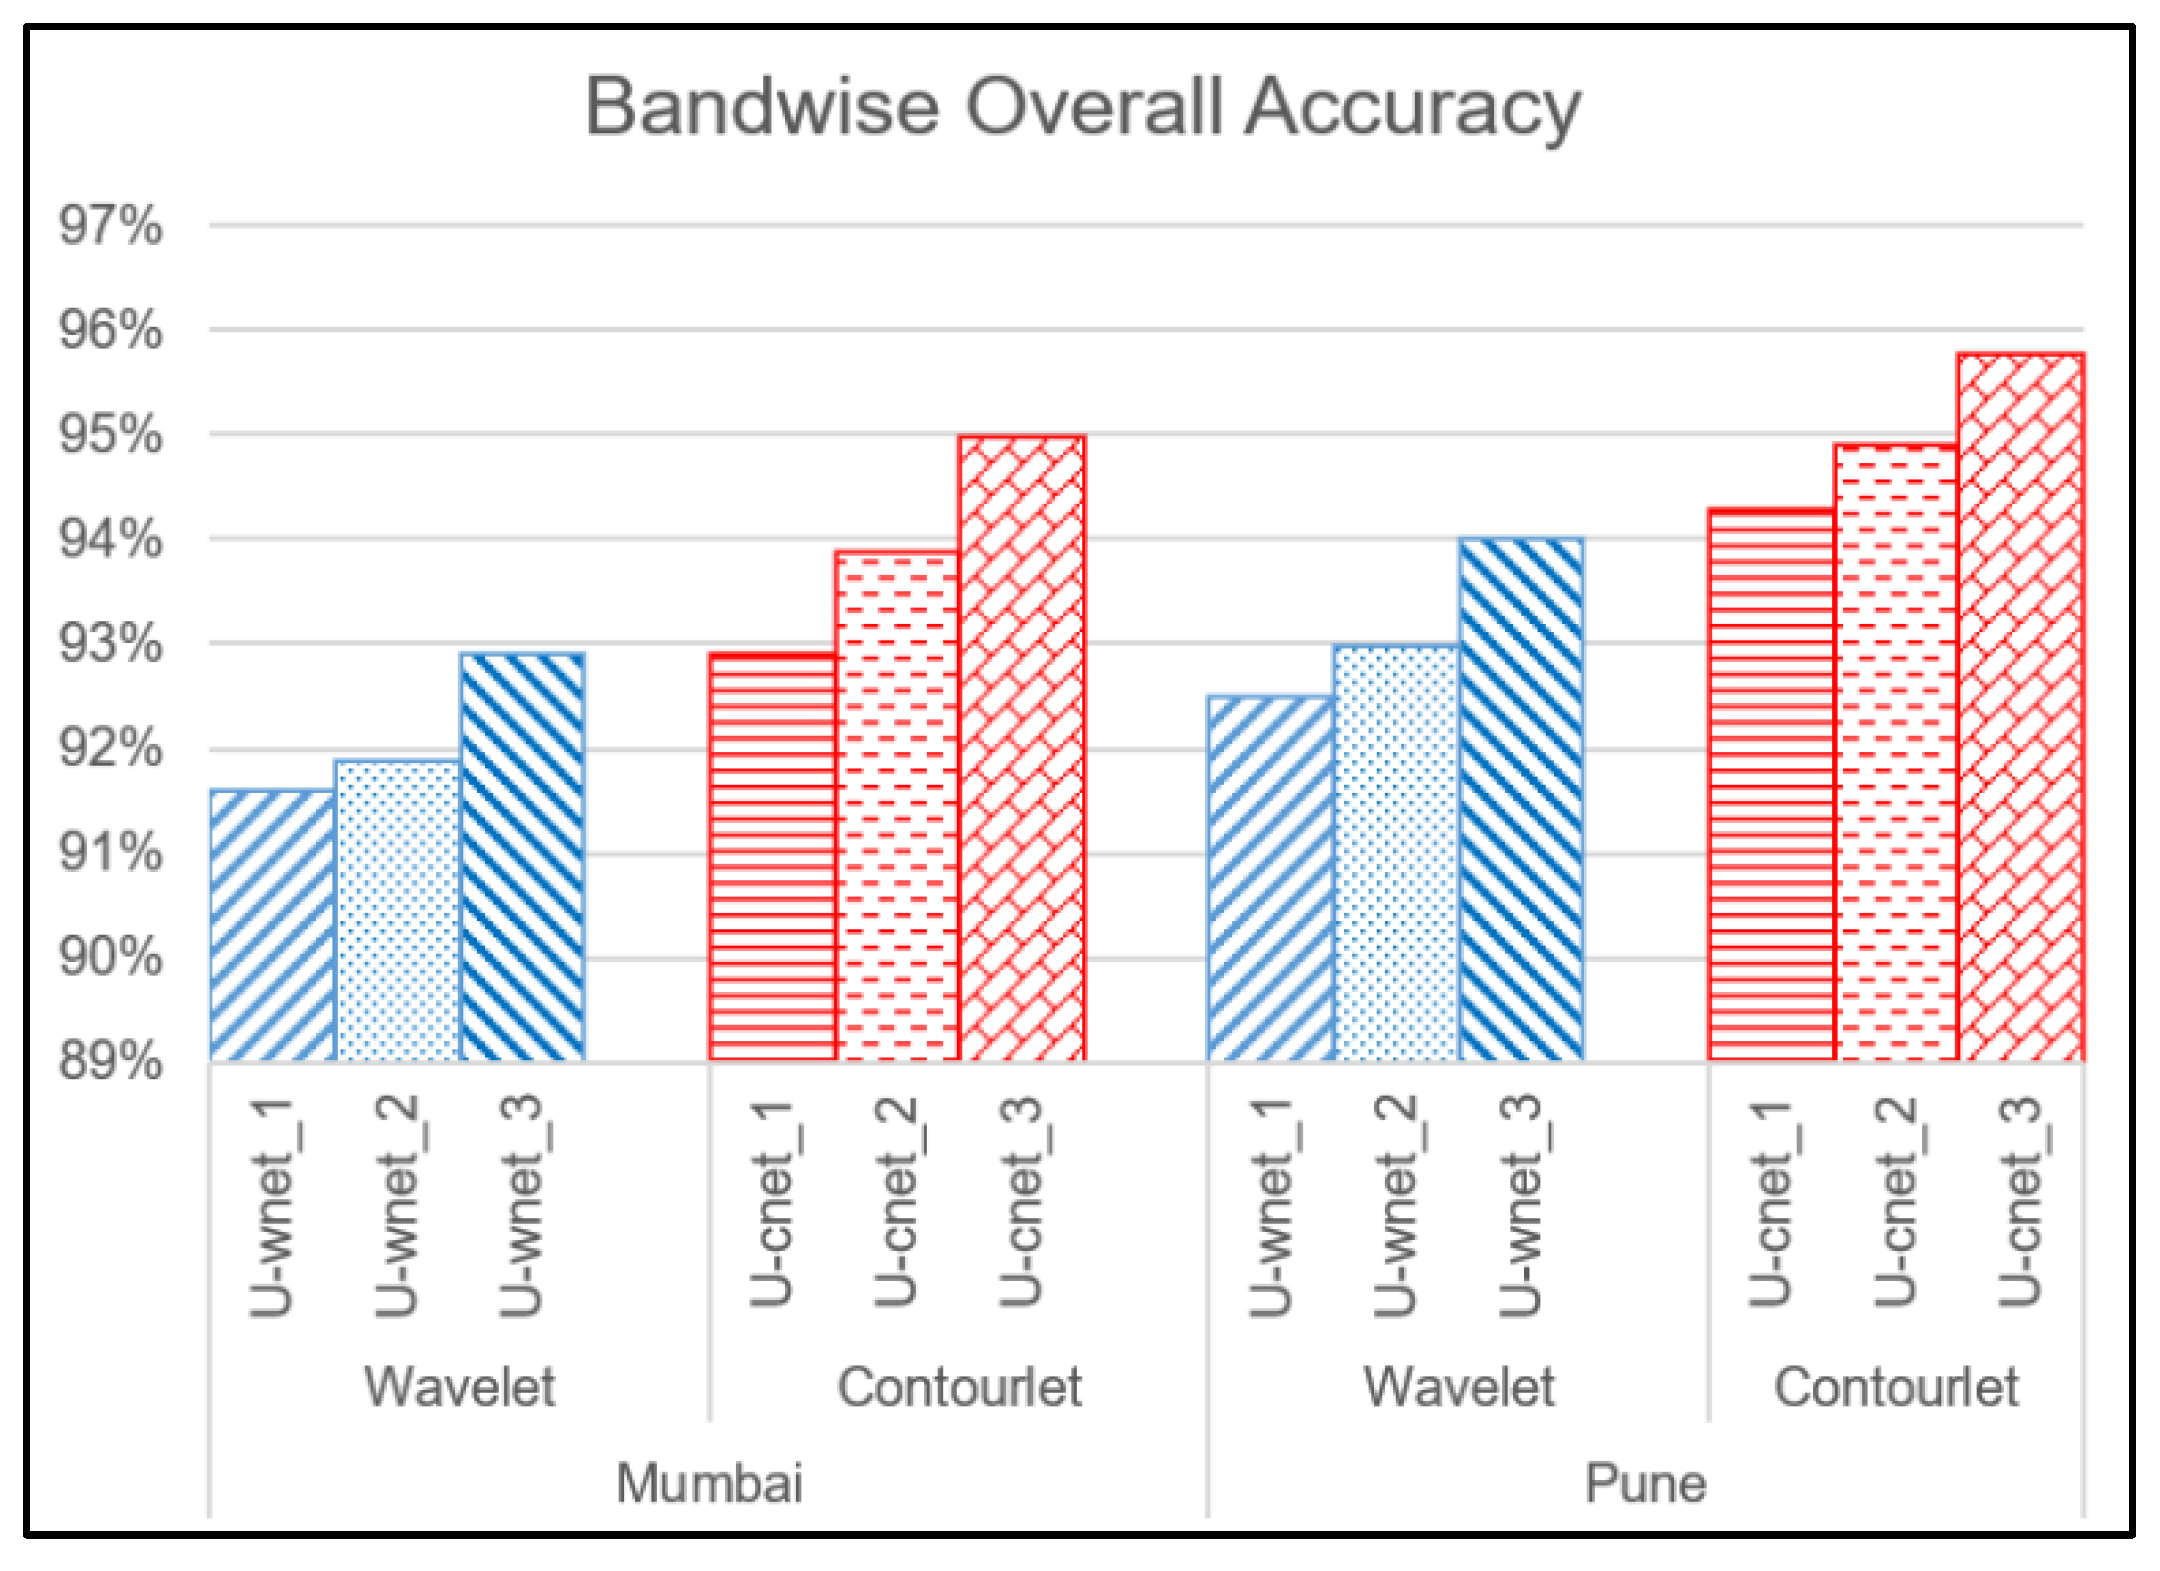
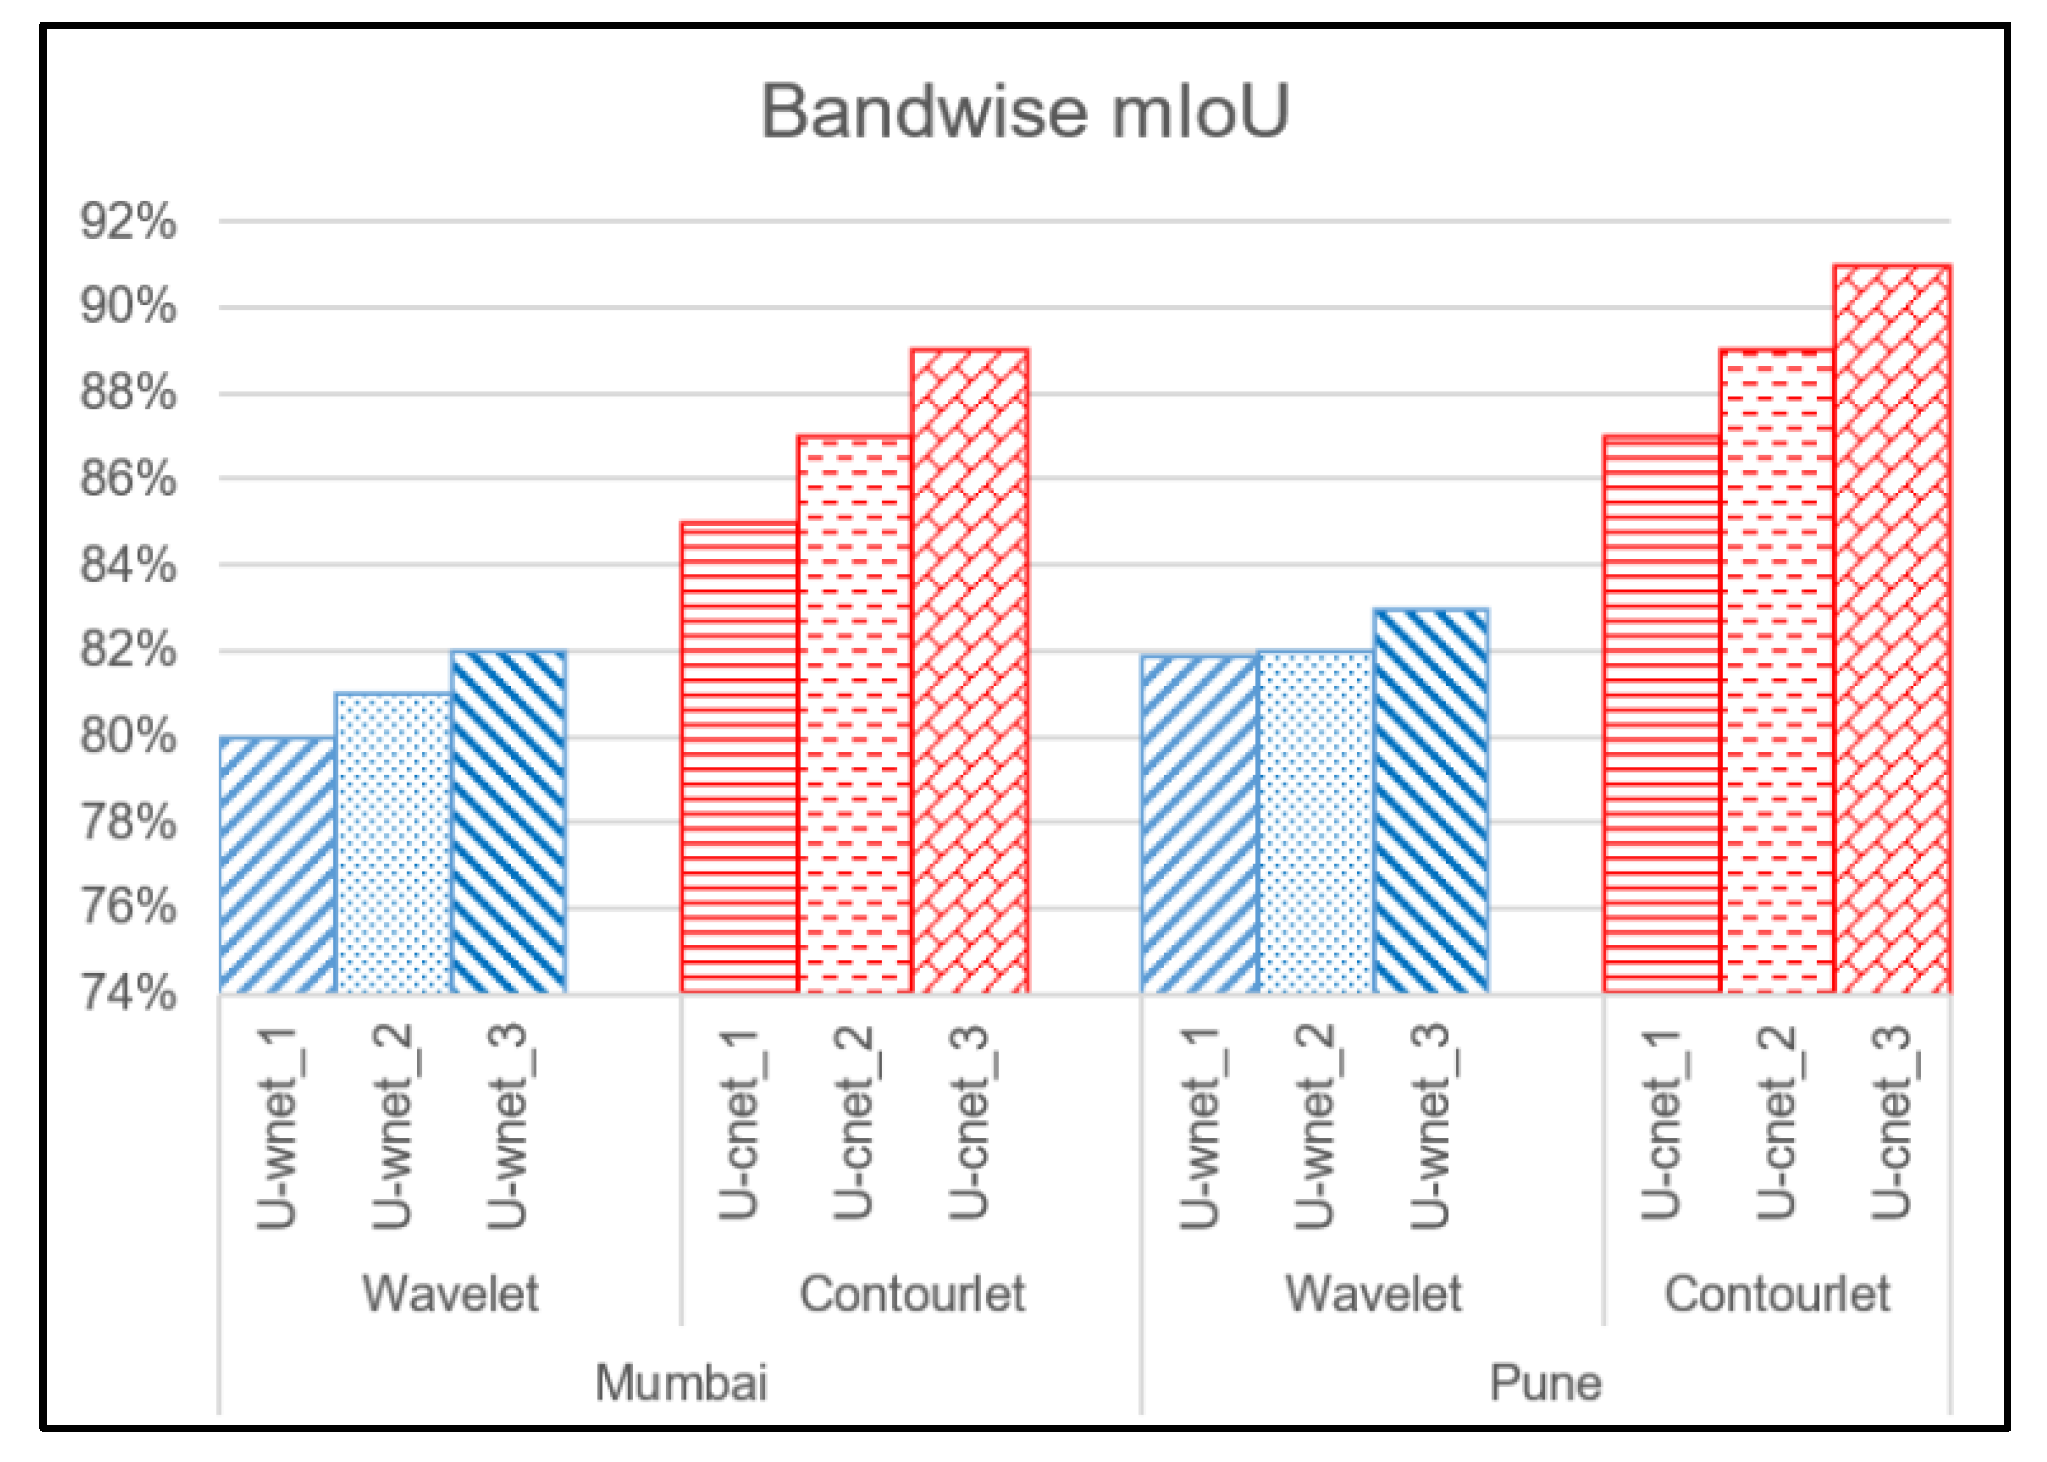
5.2. Implementation and Results
- Correctness (C1) = TP/(TP + FP);
- Completeness (C2) = TP/(TP + FN);
- F-score = 2.C1.C2/(C1 + C2).
6. Discussion
- U-cnet_1: Original Image + contourlet subbands at first level of decomposition;
- U-cnet_2: Original Image + contourlet subbands at first and second levels of decomposition;
- U-cnet_3: Original Image + contourlet subbands at first, second, and third levels of decomposition.
7. Conclusions
Author Contributions
Funding
Acknowledgments
Conflicts of Interest
References
- DESA, UN. United Nations Department of Economic and Social Affairs/Population Division (2009b): World Population Prospects: The 2008 Revision. 2010. Available online: http://esa.un.org/unpp (accessed on 10 December 2019).
- UN. World Urbanization Prospects. The 2009 Revision; Population Division, Department of Economic and Social Affairs, United Nations Secretariat: New York, NY, USA, 2009.
- Mason, S.O.; Baltsavias, E.P.; Bishop, I. Spatial decision support systems for the management of informal settlements. Comput. Environ. Urban Syst. 1997, 21, 189–208. [Google Scholar] [CrossRef]
- Taubenböck, H.; Kraff, N.J. The physical face of slums: A structural comparison of slums in Mumbai, India, based on remotely sensed data. J. Hous. Built Environ. 2014, 29, 15–38. [Google Scholar] [CrossRef]
- Kuffer, M.; Barros, J.; Sliuzas, R.V. The development of a morphological unplanned settlement index using very-high-resolution (VHR) imagery. Comput. Environ. Urban Syst. 2014, 48, 138–152. [Google Scholar] [CrossRef]
- Owen, K.K.; Wong, D.W. An approach to differentiate informal settlements using spectral, texture, geomorphology and road accessibility metrics. Appl. Geogr. 2013, 38, 107–118. [Google Scholar] [CrossRef]
- Hofmann, P.; Strobl, J.; Blaschke, T.; Kux, H. Detecting informal settlements from QuickBird data in Rio de Janeiro using an object based approach. In Object-Based Image Analysis; Springer: Berlin/Heidelberg, Germany, 2008; pp. 531–553. [Google Scholar]
- Kohli, D.; Warwadekar, P.; Kerle, N.; Sliuzas, R.; Stein, A. Transferability of object-oriented image analysis methods for slum identification. Remote Sens. 2013, 5, 4209–4228. [Google Scholar] [CrossRef]
- Jain, S. Use of IKONOS satellite data to identify informal settlements in Dehradun, India. Int. J. Remote Sens. 2007, 28, 3227–3233. [Google Scholar] [CrossRef]
- Kit, O.; Lüdeke, M.; Reckien, D. Texture-based identification of urban slums in Hyderabad, India using remote sensing data. Appl. Geogr. 2012, 32, 660–667. [Google Scholar] [CrossRef]
- Konstantinidis, D.; Stathaki, T.; Argyriou, V.; Grammalidis, N. Building Detection Using Enhanced HOG–LBP Features and Region Refinement Processes. IEEE J. Sel. Top. Appl. Earth Obs. Remote Sens. 2017, 10, 888–905. [Google Scholar] [CrossRef]
- Liu, F.; Jiao, L.; Hou, B.; Yang, S. POL-SAR Image Classification Based on Wishart DBN and Local Spatial Information. IEEE Trans. Geosci. Remote Sens. 2016, 54, 3292–3308. [Google Scholar] [CrossRef]
- Munyati, C.; Motholo, G.L. Inferring urban household socioeconomic conditions in Mafikeng, South Africa, using high spatial resolution satellite imagery. Urban Plan. Transp. Res. 2014, 2, 57–71. [Google Scholar] [CrossRef]
- Ansari, R.A.; Buddhiraju, K.M.; Bhattacharya, A. Textural classification of remotely sensed images using multiresolution techniques. Geocarto Int. 2019, 1–23. [Google Scholar] [CrossRef]
- Vatsavai, R.R.; Bhaduri, B.; Graesser, J. Complex settlement pattern extraction with multi-instance learning. In Proceedings of the Joint Urban Remote Sensing Event 2013, Sao Paulo, Brazil, 21–23 April 2013; pp. 246–249. [Google Scholar]
- Engstrom, R.; Sandborn, A.; Yu, Q.; Burgdorfer, J.; Stow, D.; Weeks, J.; Graesser, J. Mapping slums using spatial features in Accra, Ghana. In Proceedings of the 2015 Joint Urban Remote Sensing Event (JURSE), Lausanne, Switzerland, 30 March–1 April 2015; pp. 1–4. [Google Scholar]
- Huang, X.; Liu, H.; Zhang, L. Spatiotemporal detection and analysis of urban villages in mega city regions of China using high-resolution remotely sensed imagery. IEEE Trans. Geosci. Remote Sens. 2015, 53, 3639–3657. [Google Scholar] [CrossRef]
- Regniers, O.; Bombrun, L.; Lafon, V.; Germain, C. Supervised classification of very high resolution optical images using wavelet-based textural features. IEEE Trans. Geosci. Remote Sens. 2016, 54, 3722–3735. [Google Scholar] [CrossRef]
- Huang, Y.; De Bortoli, V.; Zhou, F.; Gilles, J. Review of wavelet-based unsupervised texture segmentation, advantage of adaptive wavelets. IET Image Process. 2018, 12, 1626–1638. [Google Scholar] [CrossRef]
- Ansari, R.A.; Buddhiraju, K.M. Textural segmentation of remotely sensed images using multiresolution analysis for slum area identification. Eur. J. Remote Sens. 2019, 52 (Suppl. 2), 74–88. [Google Scholar] [CrossRef]
- Beyond Wavelets; Welland, G., Ed.; Academic Press: New York, NY, USA, 2003; Volume 10. [Google Scholar]
- Ansari, R.A.; Buddhiraju, K.M. Noise Filtering in High-Resolution Satellite Images Using Composite Multiresolution Transforms. PFG—J. Photogramm. Remote Sens. Geoinf. Sci. 2018, 86, 249–261. [Google Scholar] [CrossRef]
- Arivazhagan, S.; Ganesan, L. Texture segmentation using wavelet transform. Pattern Recognit. Lett. 2003, 24, 3197–3203. [Google Scholar] [CrossRef]
- Do, M.N.; Vetterli, M. The contourlet transform: An efficient directional multiresolution image representation. IEEE Trans. Image Process. 2005, 14, 2091–2106. [Google Scholar] [CrossRef]
- Zhang, Q.; Wang, Y.; Liu, Q.; Liu, X.; Wang, W. CNN based suburban building detection using monocular high resolution Google Earth images. In Proceedings of the 2016 IEEE International Geoscience and Remote Sensing Symposium (IGARSS), Beijing, China, 10–15 July 2016; pp. 661–664. [Google Scholar]
- Zhang, L.; Zhang, L.; Du, B. Deep learning for remote sensing data: A technical tutorial on the state of the art. IEEE Geosci. Remote Sens. Mag. 2016, 4, 22–40. [Google Scholar] [CrossRef]
- Zhou, B.; Lapedriza, A.; Xiao, J.; Torralba, A.; Oliva, A. Learning deep features for scene recognition using places database. In Proceedings of the 2014 Neural Information Processing Systems Conference (NIPS), Montreal, QC, Canada, 8–11 December 2014; pp. 487–495. [Google Scholar]
- Wilkinson, G.G. Results and implications of a study of fifteen years of satellite image classification experiments. IEEE Trans. Geosci. Remote Sens. 2005, 43, 433–440. [Google Scholar] [CrossRef]
- Ren, Y.; Zhu, C.; Xiao, S. Deformable faster r-cnn with aggregating multi-layer features for partially occluded object detection in optical remote sensing images. Remote Sens. 2018, 10, 1470. [Google Scholar] [CrossRef]
- Zhang, W.; Wang, S.; Thachan, S.; Chen, J.; Qian, Y. Deconv R-CNN for small object detection on remote sensing images. In Proceedings of the IGARSS 2018-IEEE International Geoscience and Remote Sensing Symposium, Valencia, Spain, 22–27 July 2018; pp. 2483–2486. [Google Scholar]
- Ren, S.; He, K.; Girshick, R.; Sun, J. Faster R-CNN: Towards real-time object detection with region proposal networks. IEEE Trans. Pattern Anal. Mach. Intell. 2017, 39, 1137–1149. [Google Scholar] [CrossRef] [PubMed]
- Zhong, Y.; Fei, F.; Liu, Y.; Zhao, B.; Jiao, H.; Zhang, L. SatCNN: Satellite image dataset classification using agile convolutional neural networks. Remote Sens. Lett. 2017, 8, 136–145. [Google Scholar] [CrossRef]
- Liu, Q.; Hang, R.; Song, H.; Li, Z. Learning multiscale deep features for high-resolution satellite image scene classification. IEEE Trans. Geosci. Remote Sens. 2017, 56, 117–126. [Google Scholar] [CrossRef]
- Pelletier, C.; Webb, G.I.; Petitjean, F. Temporal convolutional neural network for the classification of satellite image time series. Remote Sens. 2019, 11, 523. [Google Scholar] [CrossRef]
- Helber, P.; Bischke, B.; Dengel, A.; Borth, D. Eurosat: A novel dataset and deep learning benchmark for land use and land cover classification. IEEE J. Sel. Top. Appl. Earth Obs. Remote. Sens. 2019, 12, 2217–2226. [Google Scholar] [CrossRef]
- Vakalopoulou, M.; Karantzalos, K.; Komodakis, N.; Paragios, N. Building detection in very high resolution multispectral data with deep learning features. In Proceedings of the Geoscience and Remote Sensing Symposium (IGARSS), Milan, Italy, 26–31 July 2015; pp. 1873–1876. [Google Scholar]
- Audebert, N.; Boulch, A.; Randrianarivo, H.; Le Saux, B.; Ferecatu, M.; Lefèvre, S.; Marlet, R. Deep learning for urban remote sensing. In Proceedings of the Urban Remote Sensing Event (JURSE), Dubai, UAE, 6–8 March 2017; pp. 1–4. [Google Scholar]
- Huang, H.; He, R.; Sun, Z.; Tan, T. Wavelet-srnet: A wavelet-based cnn for multi-scale face super resolution. In Proceedings of the IEEE International Conference on Computer Vision, Venice, Italy, 22–29 October 2017; pp. 1689–1697. [Google Scholar]
- Liu, P.; Zhang, H.; Zhang, K.; Lin, L.; Zuo, W. Multi-level wavelet-CNN for image restoration. In Proceedings of the IEEE Conference on Computer Vision and Pattern Recognition Workshops, Salt Lake City, UT, USA, 19–21 June 2018; pp. 773–782. [Google Scholar]
- De Silva, D.D.N.; Fernando, S.; Piyatilake, I.T.S.; Karunarathne, A.V.S. Wavelet based edge feature enhancement for convolutional neural networks. In Eleventh International Conference on Machine Vision (ICMV 2018); International Society for Optics and Photonics: Munich, Germany, 2019; Volume 11041, p. 110412R. [Google Scholar]
- Laban, N.; Abdellatif, B.; Ebied, H.M.; Shedeed, H.A.; Tolba, M.F. Multiscale Satellite Image Classification Using Deep Learning Approach. In Machine Learning and Data Mining in Aerospace Technology; Springer: Cham, Switzerland, 2020; pp. 165–186. [Google Scholar]
- Farabet, C.; Couprie, C.; Najman, L.; Lecun, Y. Learning Hierarchical Features for Scene Labeling. IEEE Trans. Pattern Anal. Mach. Intell. 2012, 35, 1915–1929. [Google Scholar] [CrossRef]
- Mullissa, A.G.; Persello, C.; Tolpekin, V. Fully Convolutional Networks for Multi-Temporal SAR Image Classification. In Proceedings of the IGARSS 2018 IEEE International Geoscience and Remote Sensing Symposium, Valencia, Spain, 22–27 July 2018; pp. 6635–6638. [Google Scholar]
- Maggiori, E.; Tarabalka, Y.; Charpiat, G.; Alliez, P. Convolutional Neural Networks for Large-Scale Remote-Sensing Image Classification. IEEE Trans. Geosci. Remote Sens. 2017, 55, 645–657. [Google Scholar] [CrossRef]
- Audebert, N.; Saux, B.L.; Lefèvre, S. Semantic Segmentation of Earth Observation Data Using Multimodal and Multi-scale Deep Networks. In Proceedings of the Computer Vision—ACCV 2016, Taipei, Taiwan, 20–24 November 2016; pp. 180–196. [Google Scholar]
- Marmanis, D.; Schindler, K.; Wegner, J.D.; Galliani, S.; Datcu, M.; Stilla, U. Classification With an Edge: Improving Semantic Image Segmentation with Boundary Detection. arXiv 2016, arXiv:1612.01337. [Google Scholar] [CrossRef]
- Dosovitskiy, A.; Fischer, P.; Ilg, E.; Hausser, P.; Hazirbas, C.; Golkov, V.; van der Smagt, P.; Cremers, D.; Brox, T. Flownet: Learning optical flow with convolutional networks. In Proceedings of the IEEE International Conference on Computer Vision, Santiago, Chile, 7–13 December 2015; pp. 2758–2766. [Google Scholar]
- Marmanis, D.; Wegner, J.D.; Galliani, S.; Schindler, K.; Datcu, M.; Stilla, U. Semantic Segmentation of Aerial Images with an Ensemble of CNSS. ISPRS Ann. Photogramm. Remote Sens. Spat. Inf. Sci. 2016, 3, 473–480. [Google Scholar] [CrossRef]
- Sherrah, J. Fully Convolutional Networks for Dense Semantic Labelling of High-Resolution Aerial Imagery. arXiv 2016, arXiv:1606.02585. [Google Scholar]
- Fu, G.; Liu, C.; Zhou, R.; Sun, T.; Zhang, Q. Classification for High Resolution Remote Sensing Imagery Using a Fully Convolutional Network. Remote Sens. 2017, 9, 498. [Google Scholar] [CrossRef]
- Ronneberger, O.; Fischer, P.; Brox, T. U-Net: Convolutional networks for biomedical image segmentation. In Proceedings of the Medical Image Computing and Computer Assisted Intervention (MICCAI), Munich, Germany, 5–9 October 2015; pp. 234–241. [Google Scholar]
- He, K.; Zhang, X.; Ren, S.; Sun, J. Deep Residual Learning for Image Recognition. In Proceedings of the IEEE Conference on Computer Vision and Pattern Recognition (CVPR), Las Vegas, NV, USA, 26 June–1 July 2016; pp. 770–778. [Google Scholar]
- Long, J.; Shelhamer, E.; Darrell, T. Fully convolutional networks for semantic segmentation. In Proceedings of the 2015 IEEE Conference on Computer Vision and Pattern Recognition (CVPR), Boston, MA, USA, 7–12 June 2013; pp. 3431–3440. [Google Scholar]
- Deng, W.; Liu, H.; Xu, J.; Zhao, H.; Song, Y. An improved quantum-inspired differential evolution algorithm for deep belief network. IEEE Trans. Instrum. Meas. 2020. [Google Scholar] [CrossRef]
- Deng, W.; Li, W.; Yang, X.H. A novel hybrid optimization algorithm of computational intelligence techniques for highway passenger volume prediction. Expert Syst. Appl. 2011, 38, 4198–4205. [Google Scholar] [CrossRef]


| Model | Mumbai City Image | Pune City Image | ||||||||
|---|---|---|---|---|---|---|---|---|---|---|
| C1 | C2 | FS | OA | mIoU | C1 | C2 | FS | OA | mIoU | |
| U-net | 0.9021 | 0.8812 | 0.8915 | 0.9194 | 0.79 | 0.9198 | 0.8878 | 0.9035 | 0.9202 | 0.81 |
| U-wnet | 0.9201 | 0.8902 | 0.9049 | 0.9290 | 0.82 | 0.9367 | 0.9018 | 0.9189 | 0.9401 | 0.83 |
| U-cnet | 0.9345 | 0.9101 | 0.9221 | 0.9498 | 0.89 | 0.9501 | 0.9198 | 0.9347 | 0.9578 | 0.91 |
| WTex [20] | 0.8135 | 0.8010 | 0.8072 | 0.8228 | 0.72 | 0.8247 | 0.8192 | 0.8219 | 0.8402 | 0.74 |
| CTex [20] | 0.9187 | 0.8992 | 0.9088 | 0.9201 | 0.82 | 0.9102 | 0.8994 | 0.9047 | 0.9224 | 0.81 |
© 2020 by the authors. Licensee MDPI, Basel, Switzerland. This article is an open access article distributed under the terms and conditions of the Creative Commons Attribution (CC BY) license (http://creativecommons.org/licenses/by/4.0/).
Share and Cite
Ansari, R.A.; Malhotra, R.; Buddhiraju, K.M. Identifying Informal Settlements Using Contourlet Assisted Deep Learning. Sensors 2020, 20, 2733. https://doi.org/10.3390/s20092733
Ansari RA, Malhotra R, Buddhiraju KM. Identifying Informal Settlements Using Contourlet Assisted Deep Learning. Sensors. 2020; 20(9):2733. https://doi.org/10.3390/s20092733
Chicago/Turabian StyleAnsari, Rizwan Ahmed, Rakesh Malhotra, and Krishna Mohan Buddhiraju. 2020. "Identifying Informal Settlements Using Contourlet Assisted Deep Learning" Sensors 20, no. 9: 2733. https://doi.org/10.3390/s20092733
APA StyleAnsari, R. A., Malhotra, R., & Buddhiraju, K. M. (2020). Identifying Informal Settlements Using Contourlet Assisted Deep Learning. Sensors, 20(9), 2733. https://doi.org/10.3390/s20092733