4.1. Binary Class Experiment Results for KDD99
Table 9 depicts that false positive rate and true positive rate scores were 0.6% and 99.10%, respectively, for a normal class. Similarly, for the anomaly class, false positive and true positive scores were 0.9 and 99.40%, respectively. For normal class, the number of correctly detected packets was 28,934, and 271 packets were detected incorrectly as anomaly packets. In addition, for the anomaly class, 118,238 packets were correctly detected while 759 packets were incorrectly detected as normal packets. From
Table 10, we can see that precision for normal was class 97.40%, Recall score for normal class was 99.10%, and F1-Score was 98.30%, respectively. Likewise, for anomaly class, Precision and Recall scores were 99.80% and 99.40%, respectively. F1-Score for anomaly class was 99.60%. The ROC Area for both normal and anomaly class were 99.90%, respectively.
Table 11 depicts that, for normal class, the number of correctly detected packets is 28,934, and 271 packets were detected incorrectly as anomaly packets. Similarly, for anomaly class, 118,238 packets were correctly detected, while 759 packets were incorrectly detected as normal packets. From
Table 12, we can see that precision for normal was class 97.40%, Recall score for normal class is 99.10%, and F1-Score was 98.30%, respectively. Similarly, for anomaly class, Precision and Recall scores were 99.80% and 99.40%, respectively. F1-Score for anomaly class was 99.60%. The ROC Area for both normal and anomaly class was 99.90%, respectively.
Table 13 indicate that, out of 148,202 instances, 147,314 instances were classified correctly with the accuracy of 99.80%. False Positive Rate and True Positive Rate score were 0.6% and 99.20%, respectively, for a normal class. Similarly, for anomaly class, False Positive and True Positive score were 0.98 and 99.40%, respectively. For normal class, the number of correctly detected packets were 28,975, and 230 packets were detected incorrectly as anomaly packets. Likewise, for the anomaly class, 118,339 packets were correctly detected, while 658 packets were incorrectly detected as normal packets. From
Table 14, precision for normal class is 97.80%, recall score for normal class is 99.20%, and F1-Score was 98.50%, respectively. In addition, for anomaly class precision and recall scores were 99.80% and 99.40%, respectively. F1-score for anomaly class was 99.60%. The ROC Area for both normal and anomaly class was 99.80% and 100%, respectively.
As shown in
Table 15, correctly detected normal and anomaly packets were 28,838 and 118,225, respectively. In addition, 367 packets were wrongly classified as anomaly, but, actually, it was normal packets. Similarly, 772 packets were anomaly, but it was detected as normal packets.
According to
Table 16, using the Bagging j48 classifier, the false positive rate and true positive rate scores are 0.6% and 98.70%, respectively, for a normal class. Similarly, for the anomaly class, false positive and true Positive scores were 1.30% and 99.40%, respectively, using a j48 classifier.
Table 17 depicts a Bagging random forest classifier detects 28,994 packets correctly as normal packets and 118,318 packets as anomaly packets. In addition, 211 packets are detected as anomaly packets, but, actually, they are normal packets and 679 packets were detected as normal packets, but, actually, they were anomaly packets.
For Bagging random forest classifier precision, recall, and F1- score for the normal class are 97.70%, 99.30%, and 98.50%, respectively. Similarly, for Bagging random forest, anomaly class precision is 99.80%, the recall is 99.40%, and F1-score is 99.60%, respectively. using Bagging random forest normal class, False Positive Rate was 0.60% and, for anomaly, False Positive Rate was 0.90%. True Positive score for Bagging random forest normal class was 99.10% and, for anomaly, 99.40%, respectively, as shown in
Table 18As shown in
Table 19, correctly detected normal and anomaly packets are 29,010 and 118,299, respectively. In addition, 195 packets are wrongly classified as anomaly, but, actually, they are normal packets. Similarly, 698 packets were an anomaly, but they are detected as normal packets. False Positive and True positive scores for normal are 0.60% and 99.30%, respectively. Similarly, for anomaly class, False Positive and True positive scores are 0.70% and 99.40%, respectively, as shown in
Table 20. For reptree Bagging normal class, precision score is 97.70%; recall and F1-Scores are 99.30% and 98.50%, respectively. For Bagging reptree, anomaly class precision score is 99.80%, recall score is 99.40%, and F1-Score was 99.60%, respectively, as shown in
Table 20.
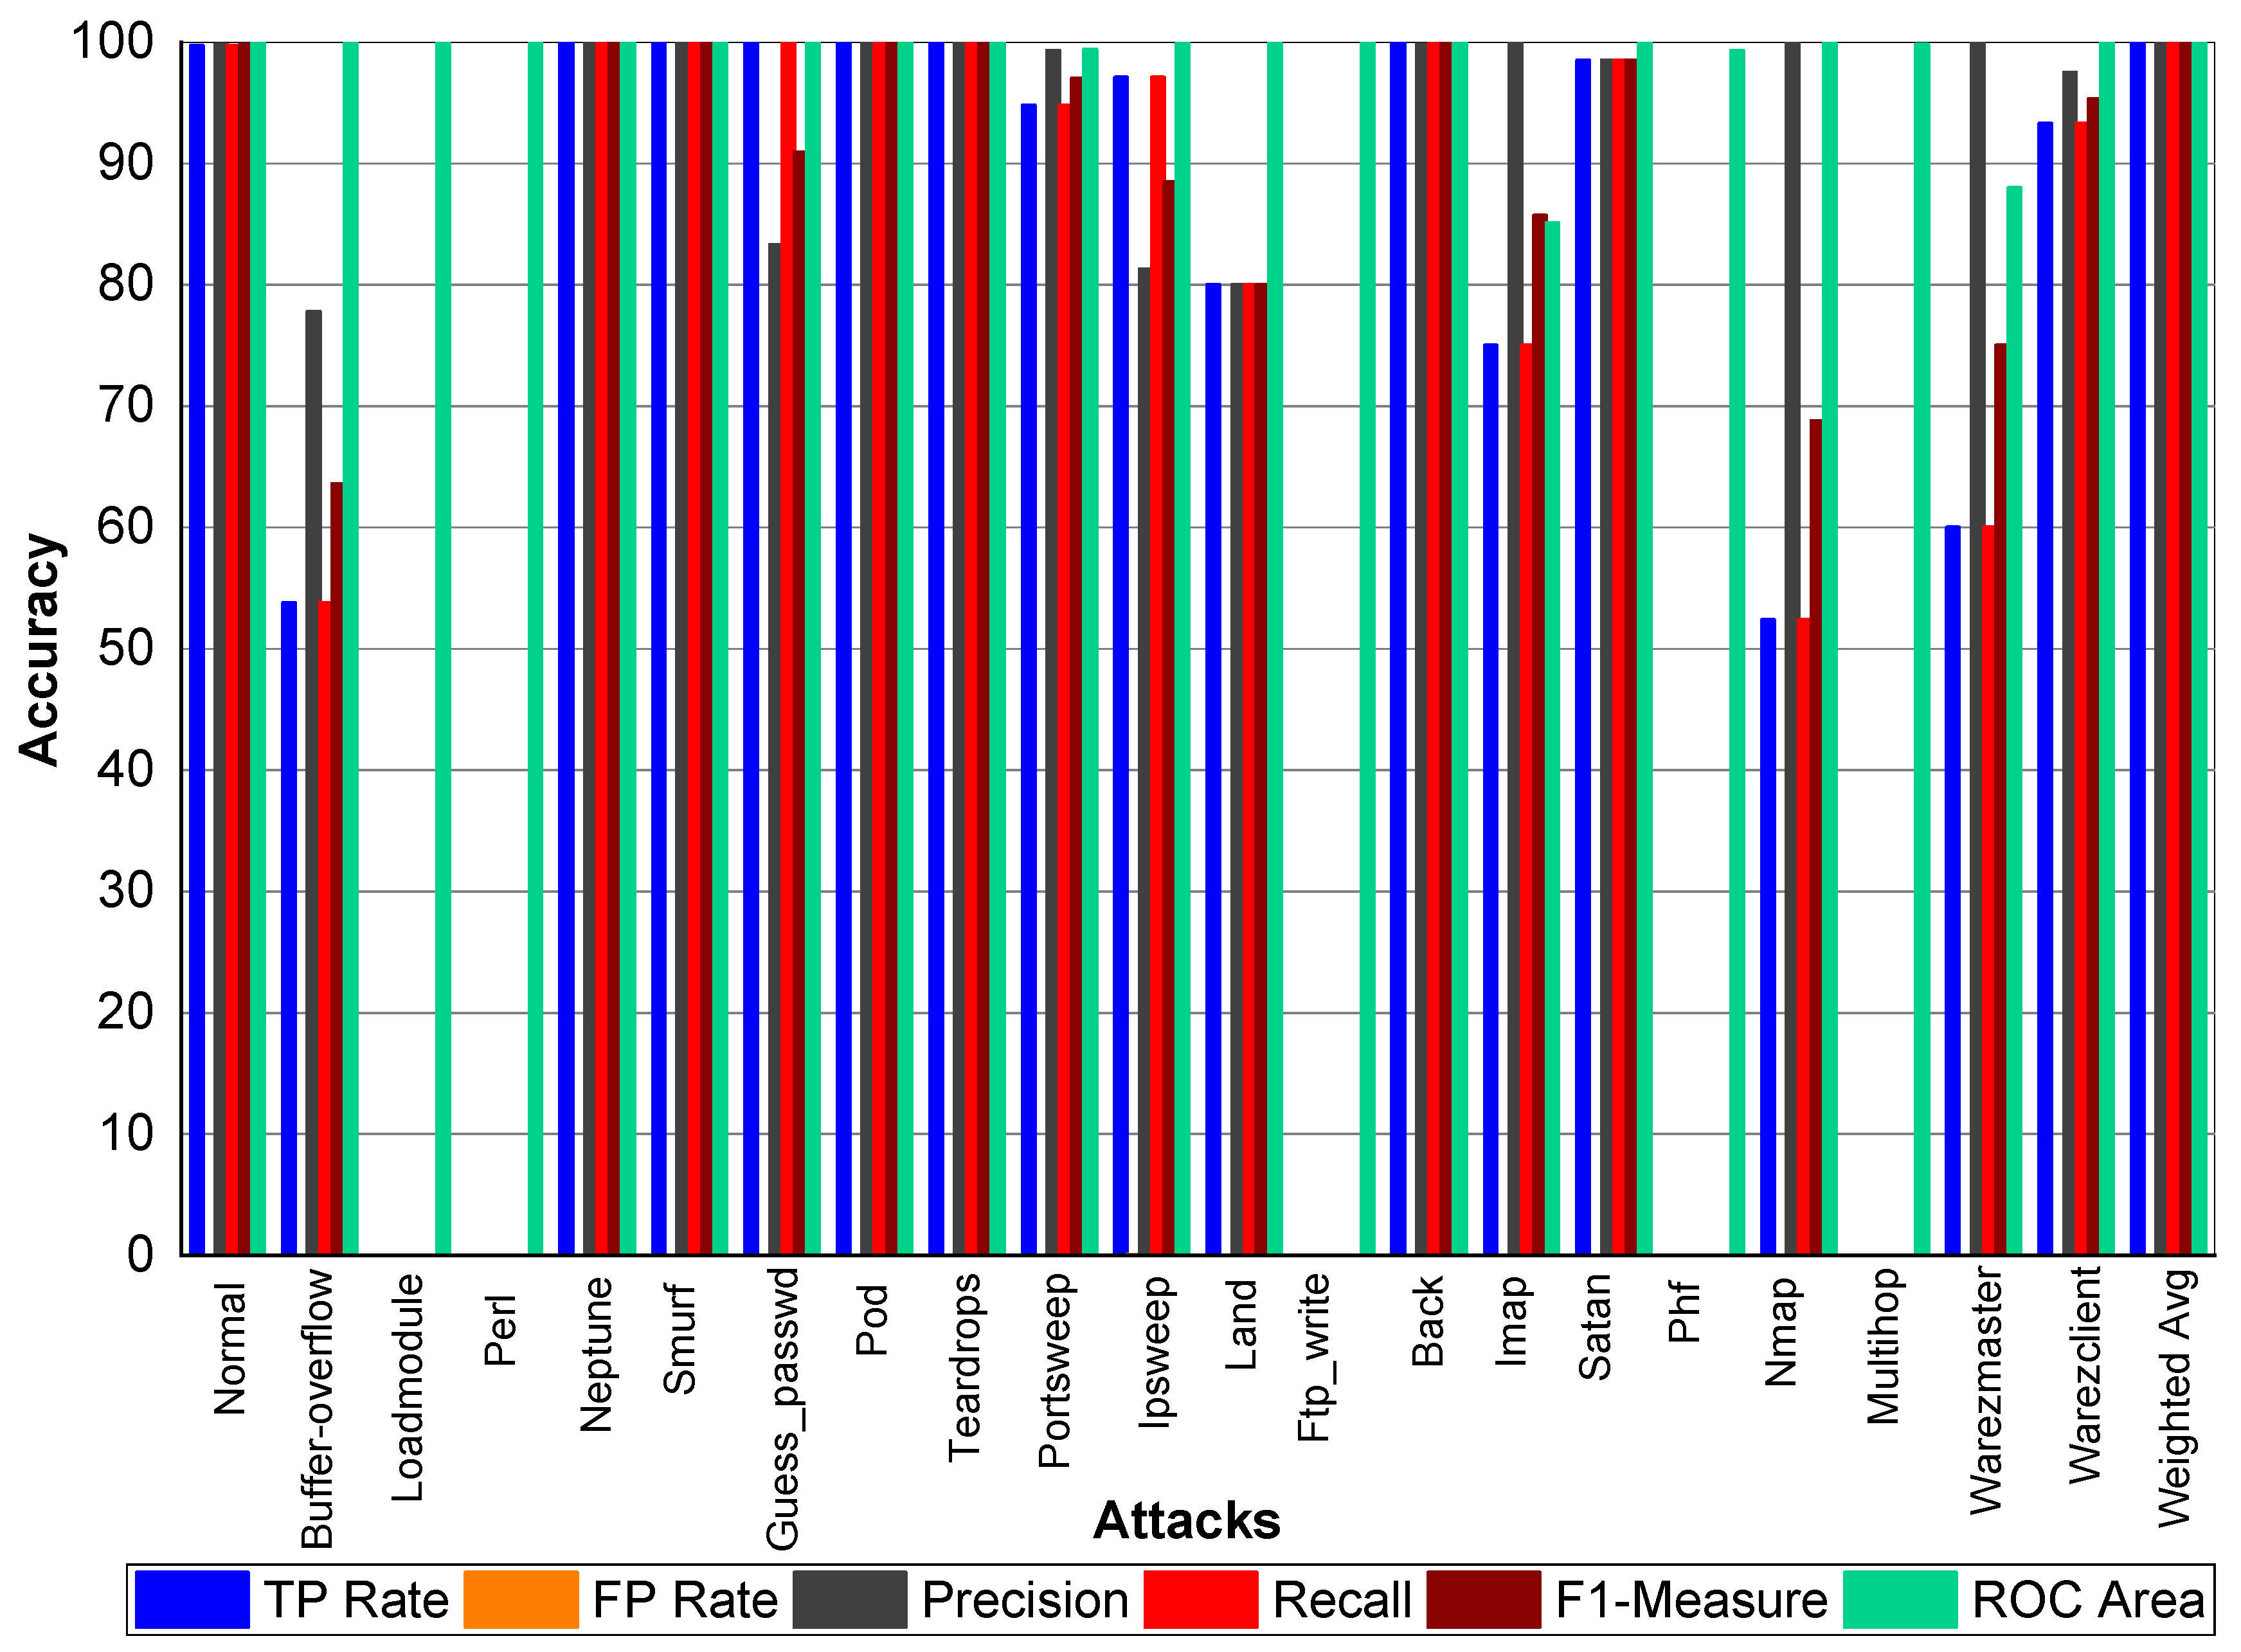
Table 21 and
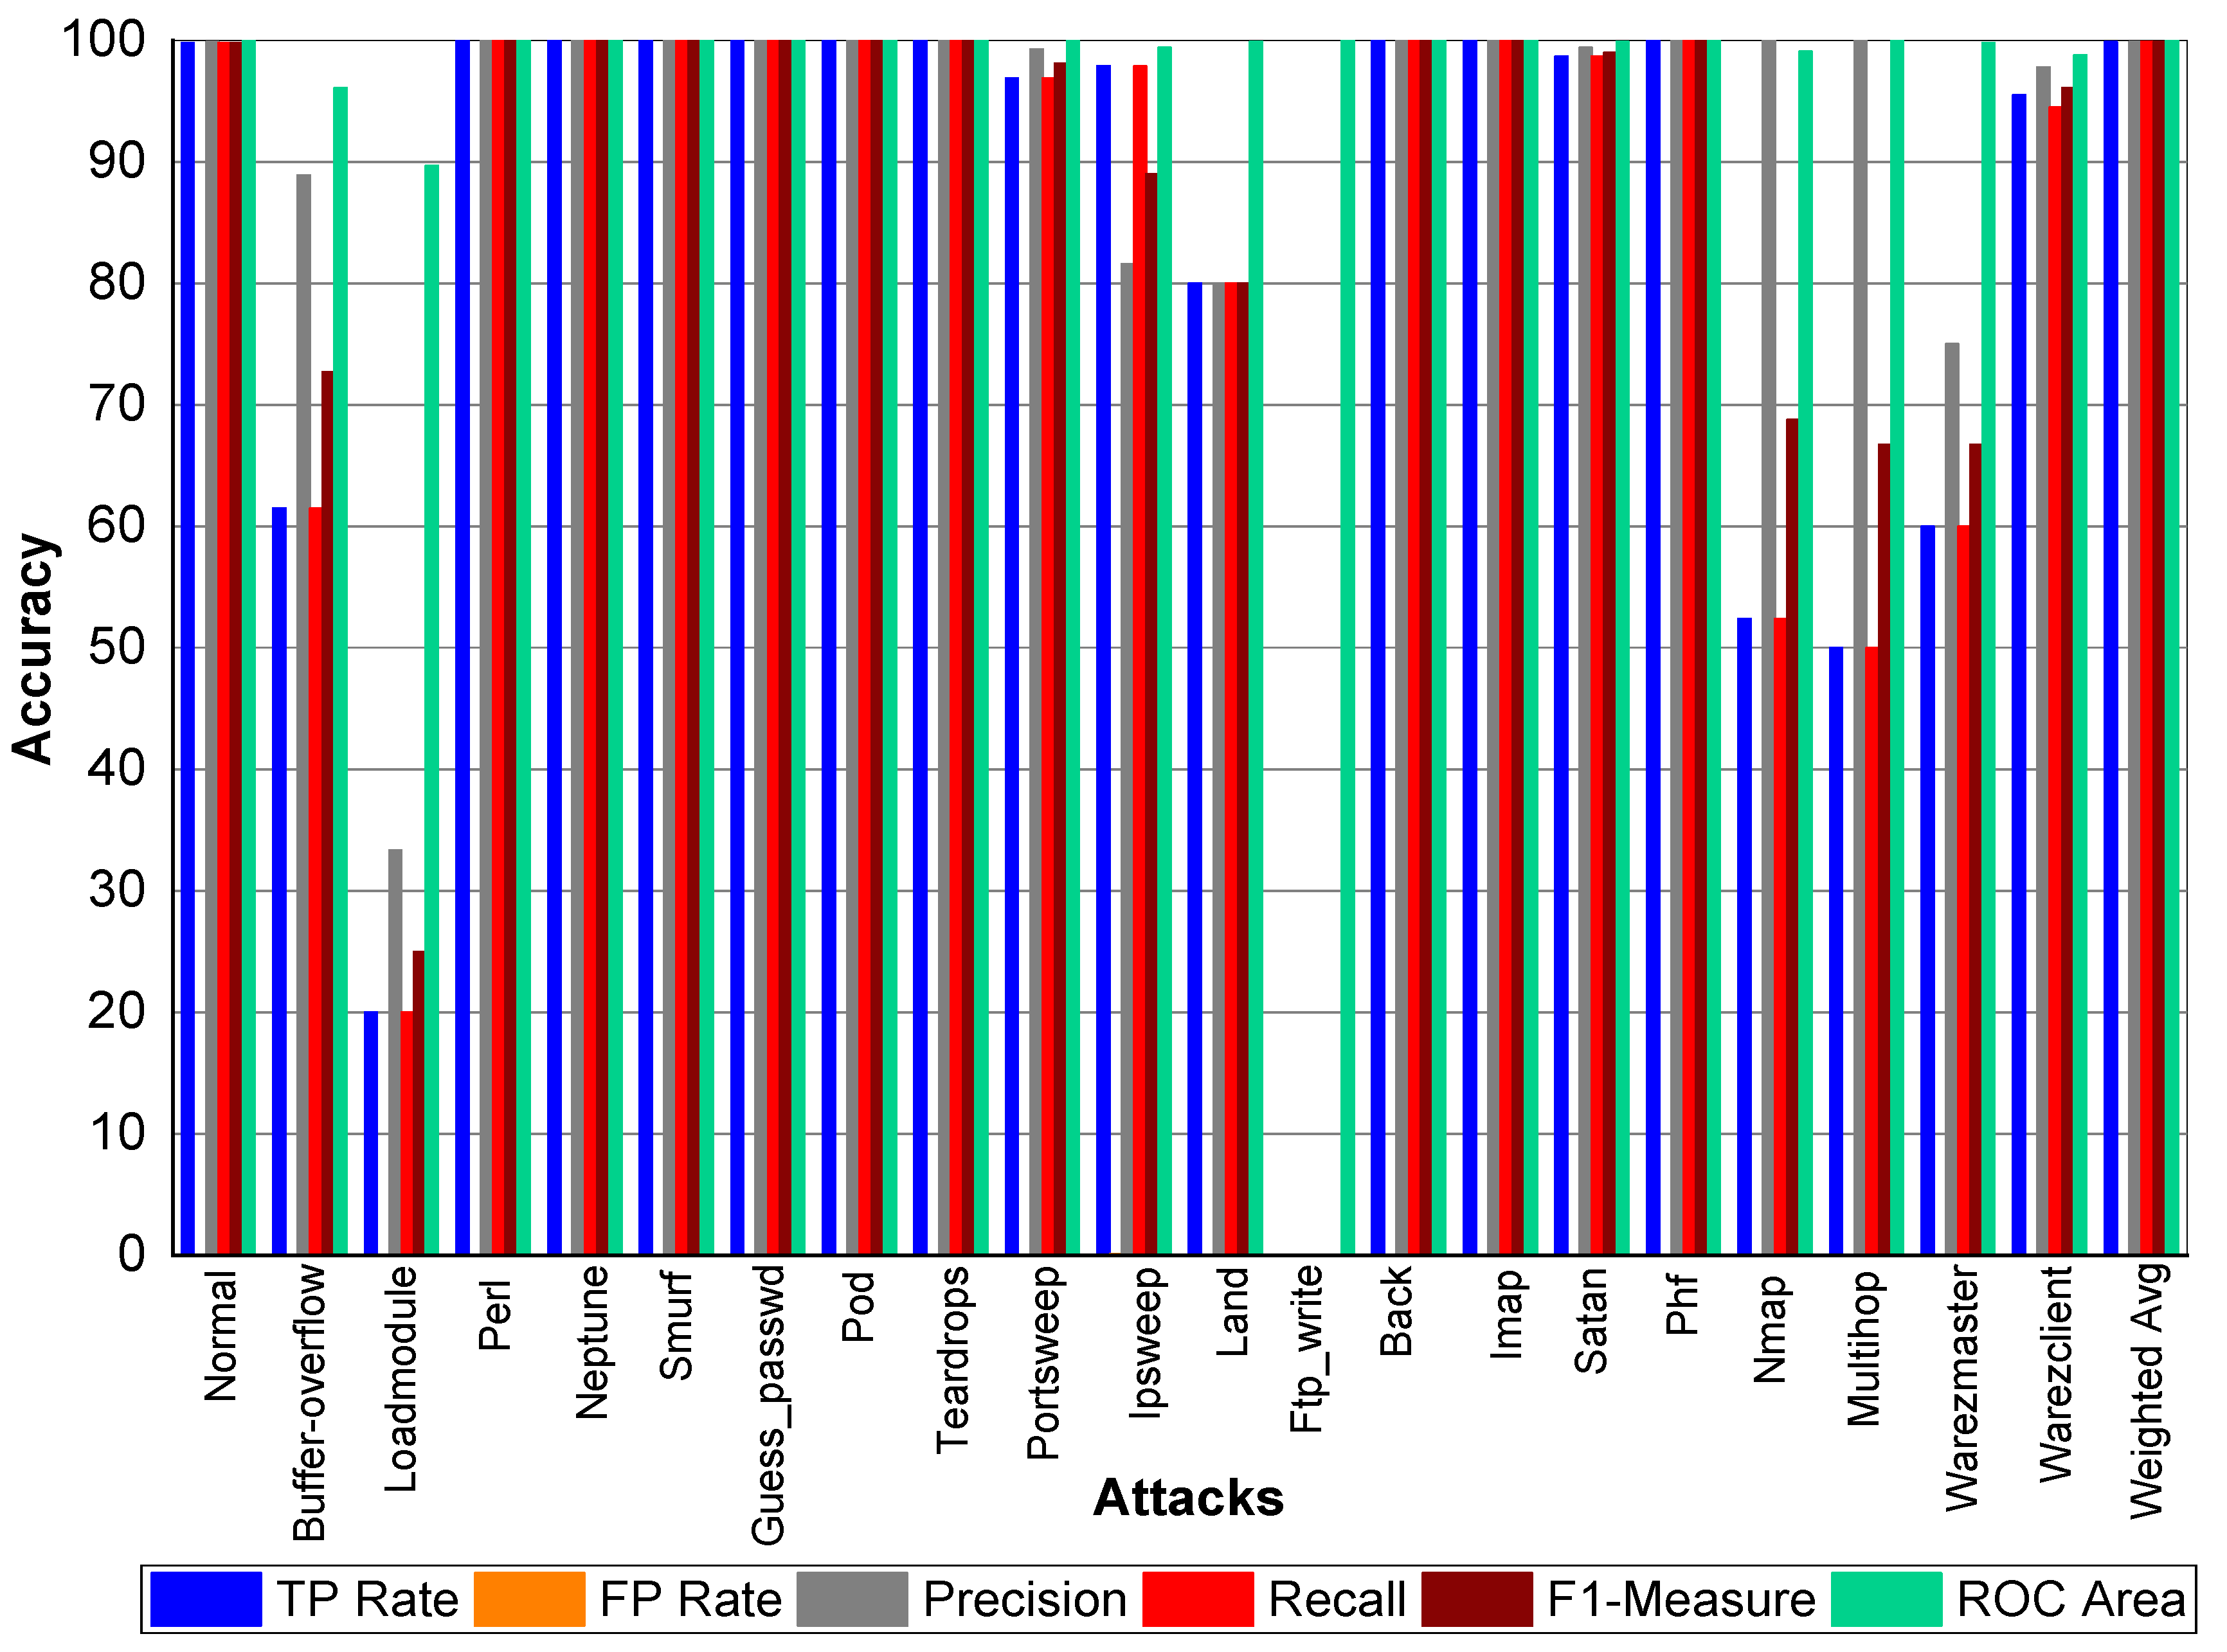
Figure 3 indicate that Perl, Neptune, Smurf, Guess_passwd, Pod, Teardrop, and Lad attacks have 100% TP Rate. Only three attacks Loadmodule, Ftp_write, Phf have a very low TP Rate. The weighted average TP Rate is 99.90 overall. The FP Rate for all attacks are very low. Normal packets achieve 99.80% precision, Loadmodule, Neptune, Smurf, Teardrop, Portsweep, Imap, and Warezmaster achieved 100% precision, respectively. Guess_passwd achieved 93.80% precision, and Portsweep achieved 95.30% precision. Ipsweep and Land achieved 81.60% and 83.30% precision, respectively. Perl and Multihop achieved 33.33% precision, respectively. Back, Satan, and Warezclient achieved 99.80%, 99.10%, and 97.10% Precision, respectively. Perl, Neptune, Smurf, Guess_passwd, and Pod achieved 100% recall. Teardrop and Land also achieved 100% recall, respectively. Normal, Guess_passwd, Portsweep, Ipsweep, Back, Satan, and Warezclient achieved more than 90% F1-score on average. Neptune, Smurf, Pod, and Teardrop achieved a 100% F1-score, respectively. Buffer overflow, Loadmodule, Ipsweep, Nmap, and Warezclient achieved more than 99% average ROC. Multihop and Warezclient achieved 81.70% and 71.70% ROC, respectively. All other attacks achieved 100% ROC, respectively.
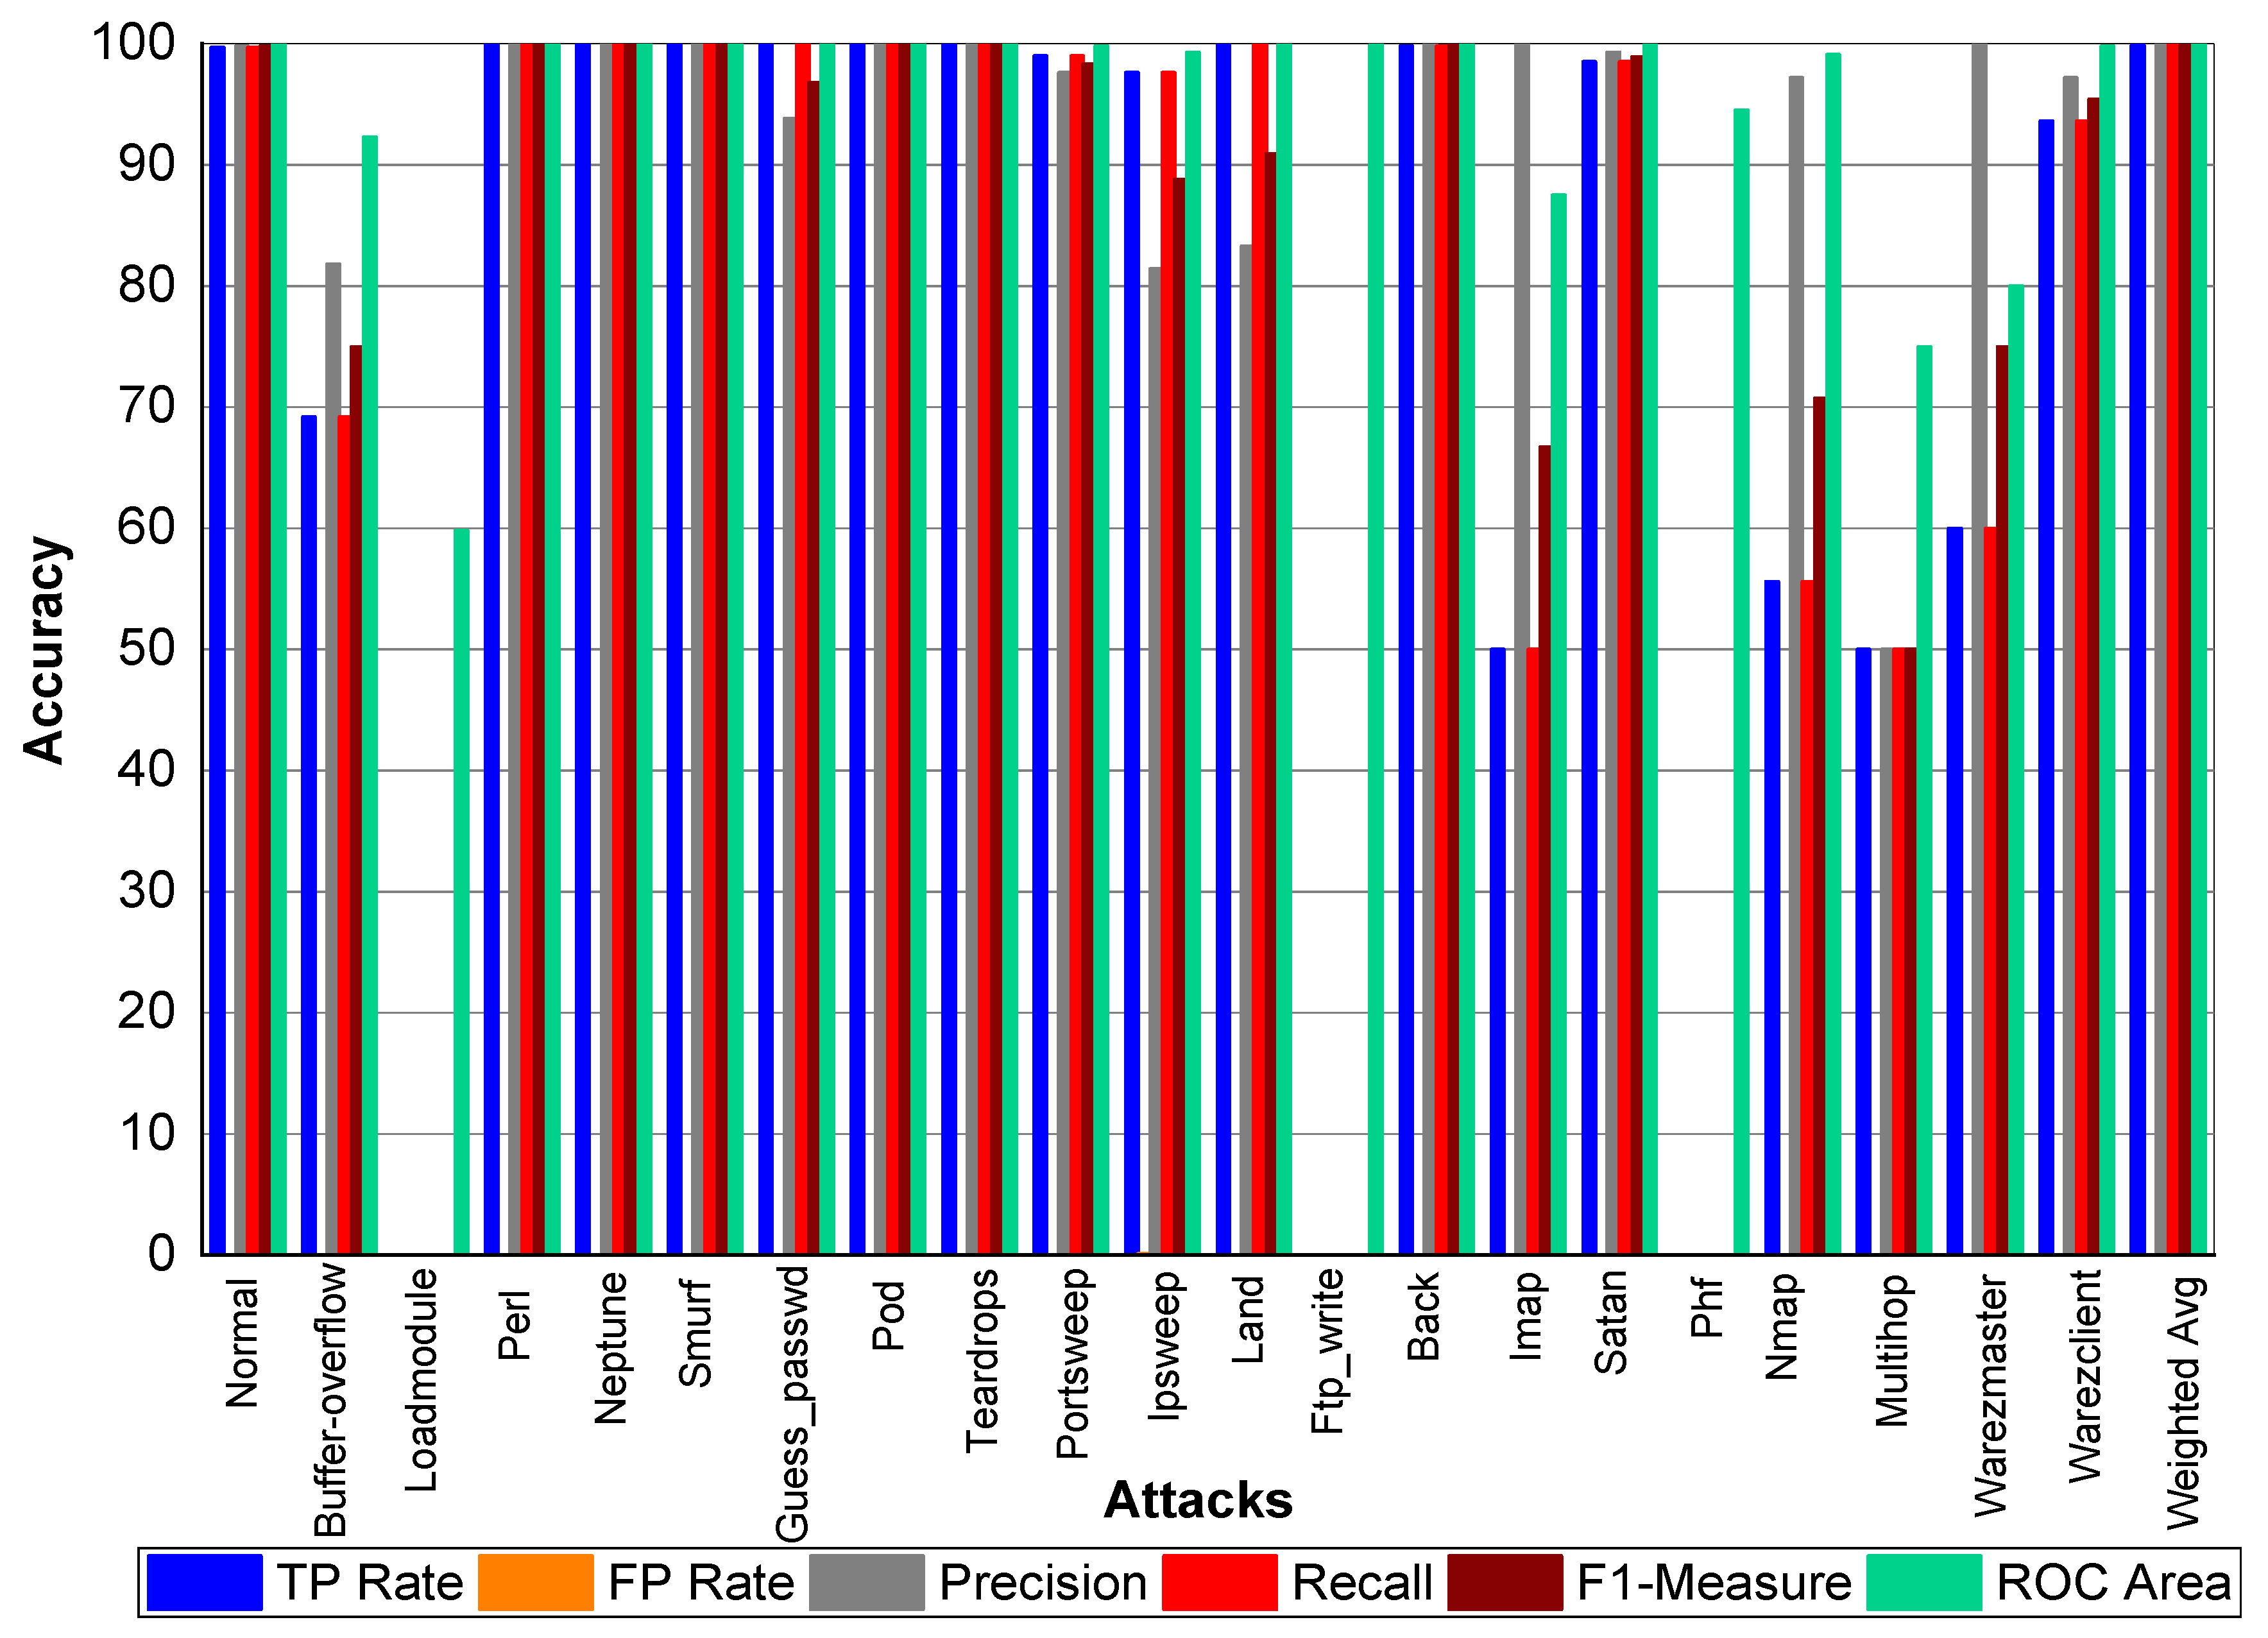
TP and FP Rate for normal class are 99.8% and 0%, respectively. Precision, recall, and F1-score for a normal class was 99.90%. Similarly, Perl, Neptune, Smurf, Guess_passwd, Pod, Teardrop, Back, Imap, and Phf achieved 100% precision, recall, F1-score, TP Rate, and ROC area, respectively. Buffer_overflow achieved 61.50% TP Rate, 88.90% precision, 61.50% recall, 72.70% F1-Measure, and 96.10% ROC area. Loadmodule attack achieved a 20% FP Rate and 20% recall. Precision and F1-Measure for Loadmodule were 33.33% and 25.00%, respectively. Portsweep achieved a 96.90% FP Rate and recall, respectively. Precision and F1-Measure for Portsweep were 99.30% and 98.10%, respectively. Warezclient, Warezmaster, Multihop, Nmap, and Satan also performed very well in terms of precision, recall, and F1-Measure—as shown in
Table 22 and
Figure 4.
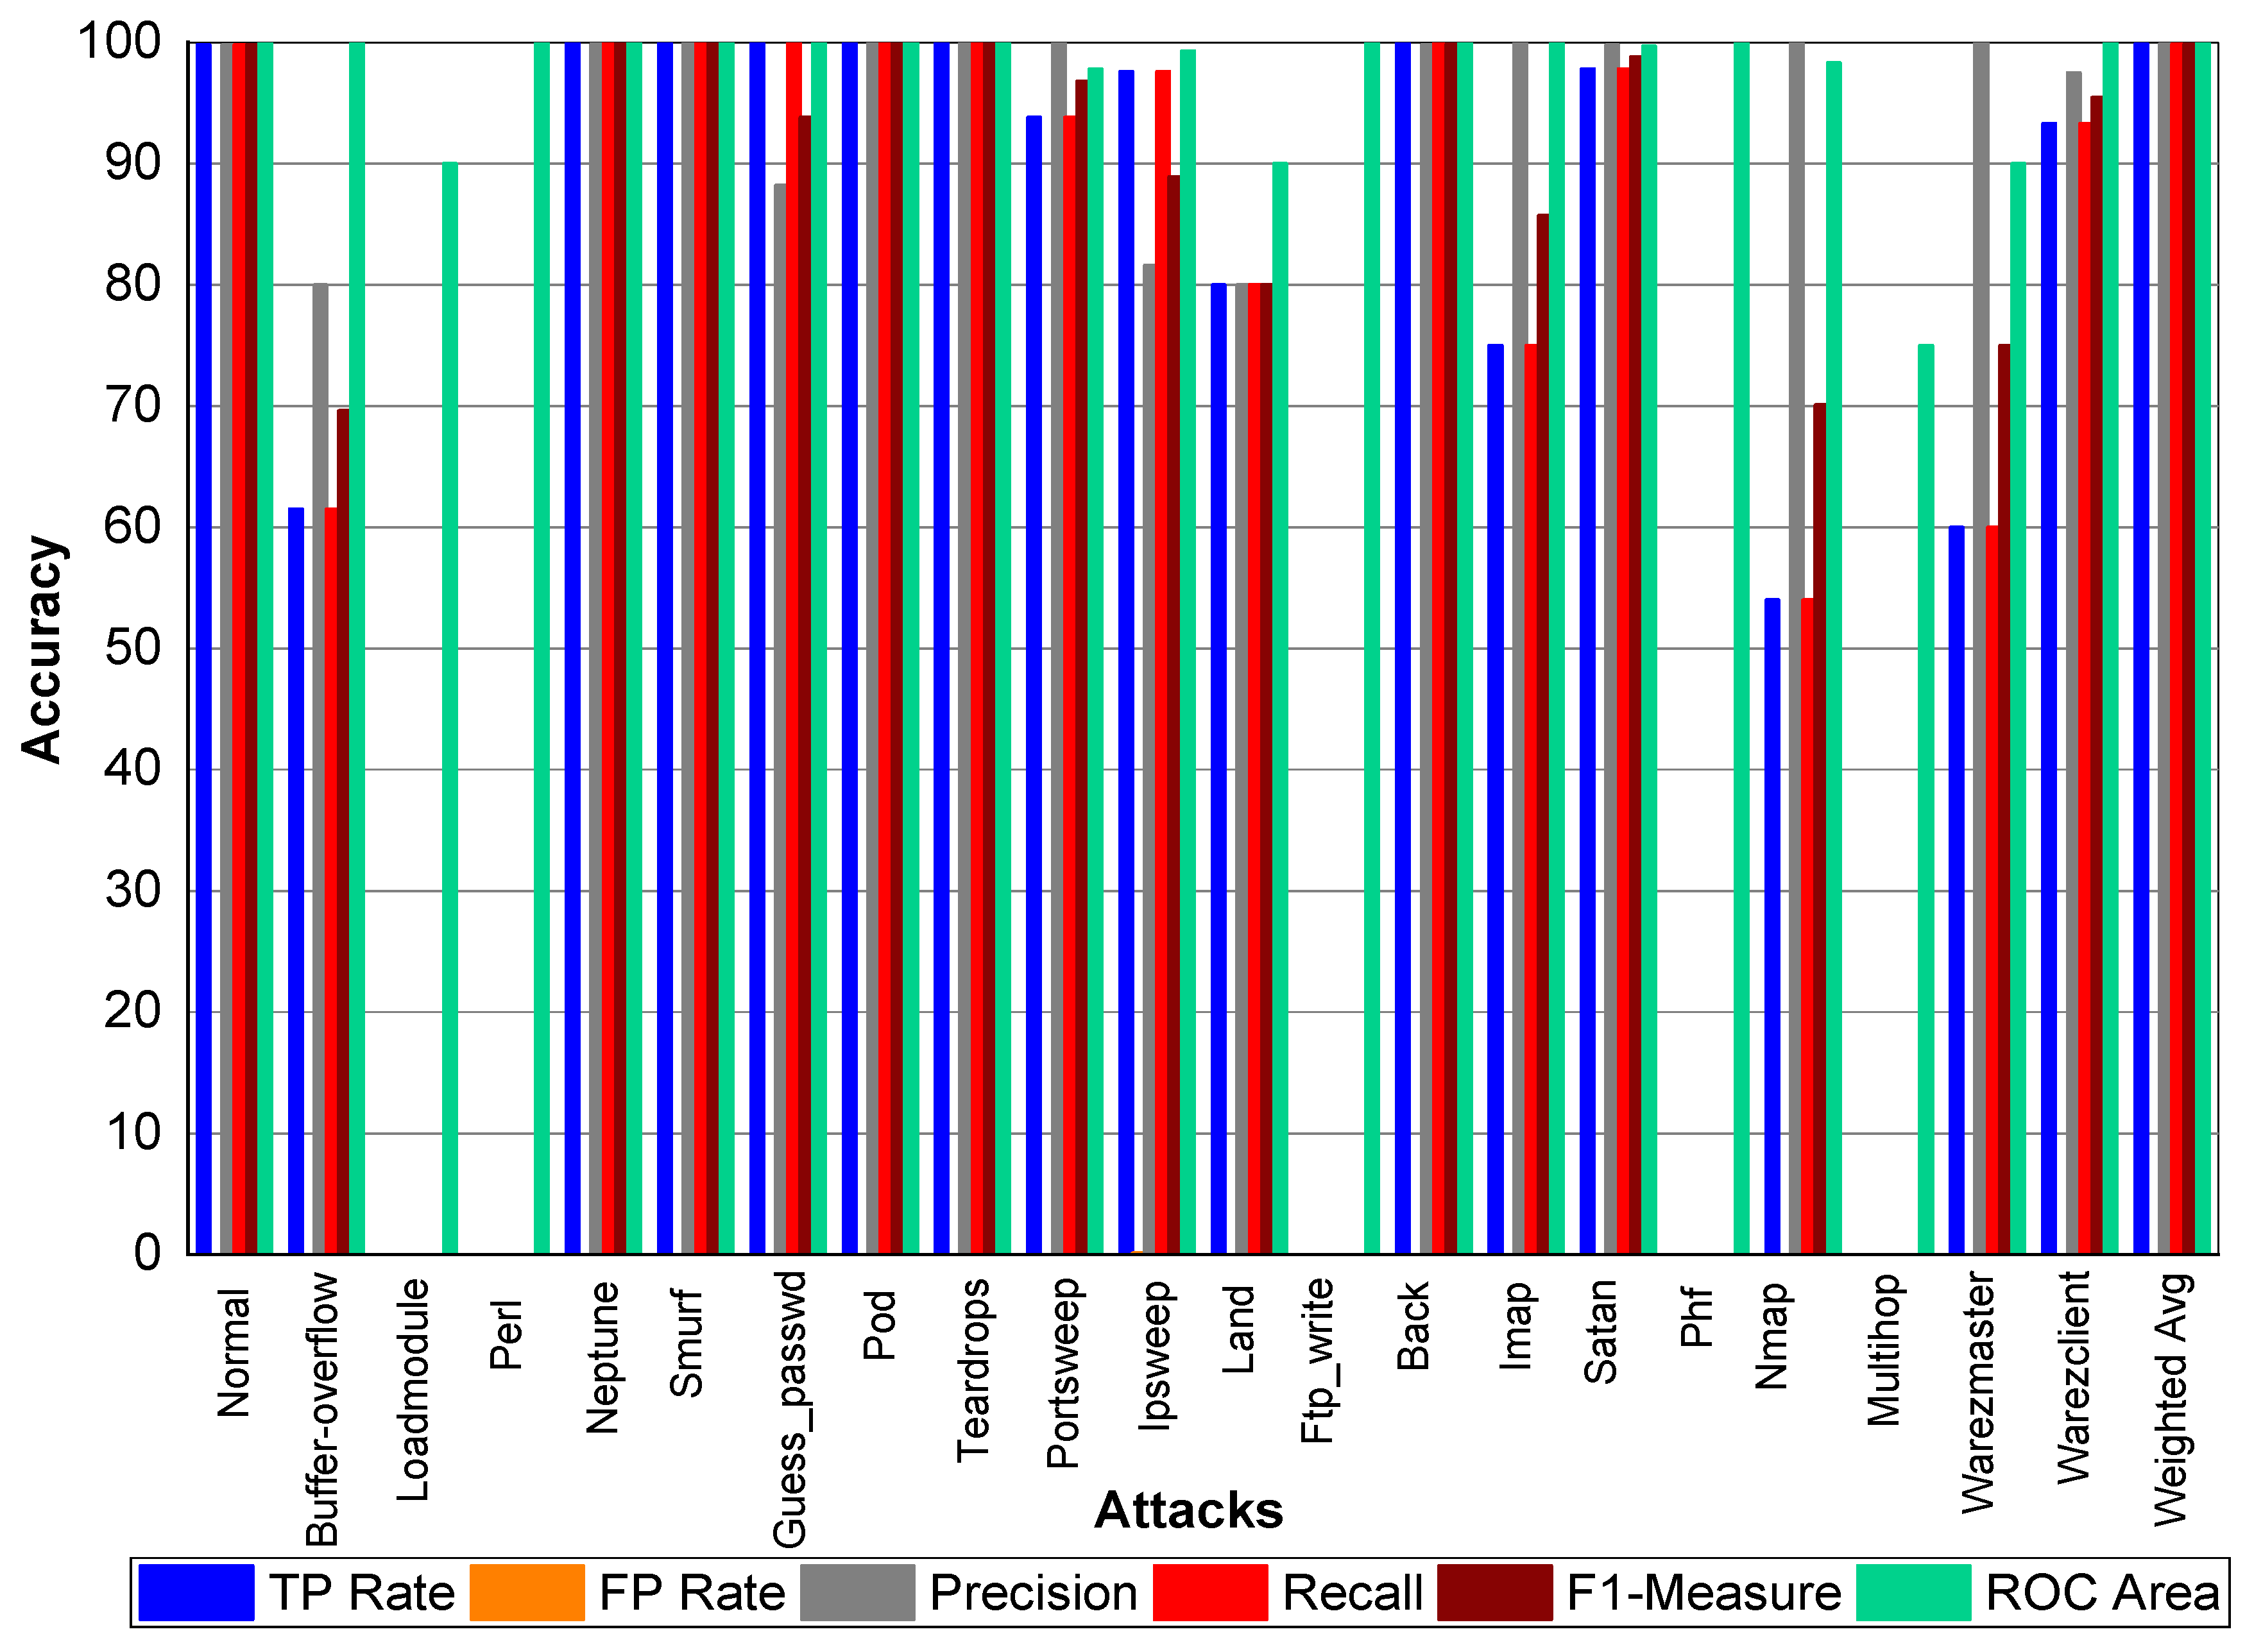
From
Table 23 and
Figure 5, we can conclude that Normal class achieved 99.80% precision, 99.70% recall, and 99.80% F1-Measure, respectively. Loadmodule, Ftp_write, Phf, and Multihop achieved very low results. Perl, Neptune, Smurf, Guess-passwd, Pod, teardrop, and Back achieved 100% TP Rate, precision, recall, and F1-Measures, respectively. Buffer-overflow, Portsweep, Ipsweep, Land, Imap, Satan, Nmap, Warezmaster, and Warezclient also performed well and achieved on average 90% precision, recall, and F1-Measure, respectively. From
Table 24 and
Figure 6, we can conclude that Normal class achieved 99.80% precision, 99.70% recall, and 99.80% F1-Measure, respectively. Loadmodule, Ftp_write, and Phf achieved very low results. Perl, Neptune, Smurf, Guess-passwd, Pod, teardrop, and Land achieved 100% TP Rate, precision, recall, and F1-Measures, respectively. Buffer-overflow, Portsweep, Ipsweep, Back, Imap, Satan, Nmap, Warezmaster, and Warezclient also performed well and achieved on average 90% precision, recall, and F1-Measure, respectively. From
Table 25 and
Figure 7, we can conclude that Normal class achieved 99.80% precision, recall, and F1-Measure, respectively. Similarly, Buffer-overflow achieved 61.50% recall and TP Rate, 80% recall, and 69.69% F1-Measure, respectively. Loadmodule, Perl, Phf, and Multihop achieved very low results. Neptune, Smurf, Guess-passwd, Pod, teardrop, and Imap achieved 100% TP Rate, precision, recall, and F1-Measures, respectively. Buffer-overflow, Portsweep, Ipsweep, Land, Imap, Satan, Nmap, Warezmaster, and Warezclient also performed well and achieved on average 90% precision, recall and F1-Measure, respectively.
Table 26 and
Figure 8 depict that Normal class achieved 99.80% precision, 99.70% recall, and 99.80% F1-Measure, respectively. Loadmodule, Ftp_write and Phf achieved very low results. Perl, Neptune, Smurf, Guess-passwd, Pod, teardrop, and Land achieved 100% TP Rate, precision, recall, and F1-Measures, respectively. Buffer-overflow, Portsweep, Ipsweep, Back, Imap, Satan, Nmap, Warezmaster, and Warezclient also performed well and achieved on average 90% precision, recall, and F1-Measure, respectively.
4.2. Binary Class Experiment Results for NSLKDD
Table 27 indicates that 44,481 packets are used for testing and 44,026 packets are detected correctly as normal and anomaly packets, and 455 packets were incorrectly detected; the accuracy of Adaboost J48 was 98.97%.
In
Table 28, TP rate for both normal and anomaly was 99.10% and 98.90%, respectively, while FR rate for normal packets was 1.10% and, for anomaly packets, it was 0.90%, respectively. Precision, recall, and F1-Score for normal packets was 99.00%, 99.10%, and 99.00%, respectively. Similarly, for anomaly packets, the precision score was 99.00%, recall score was 98.90%, and F1-Score was 98.90%, respectively. The ROC area was 99.90%, respectively, for both normal and anomaly packets.
Table 29 indicates that 44,481 packets were used for testing and 44,072 packets were detected correctly as normal and anomaly packets, and 409 packets were incorrectly detected; the accuracy of Adaboost random forest was 99.08%. TP rate for both normal and anomaly was 99.00% and 99.20%, respectively. FR rate for normal packets was 0.8% and, for anomaly packets, it was 1.00%. Precision, recall, and F1-score for normal packets were 99.30%, 99.00%, and 99.10%, respectively. Likewise, for anomaly packets, precision score was 98.90%, recall score was 99.20%, and F1-Score was 99.00%, respectively. The ROC area was 99.80%, respectively, for both normal and anomaly packets as shown in
Table 30.
Table 31 indicates that 44,481 packets were used for testing and 44,028 packets were detected correctly as normal and anomaly packets, and 453 packets were incorrectly detected; the accuracy of Adaboost reptree was 98.98%. The TP rate for both normal and anomaly was 98.70% and 99.30% respectively. The FR rate for normal packets was 0.70% and, for anomaly packets, it was 1.30%. Precision, recall, and F1-score for normal packets was 99.40%, 98.70%, and 99.00%, respectively. On the other hand, for anomaly packets, precision score was 99.30%, recall score was 99.30%, and F1-Score was 98.90%, respectively. The ROC area was 99.90%, respectively, for both normal and anomaly packets, as shown in
Table 32.
Table 33 indicates that 44,481 packets were used for testing and 44,039 packets were detected correctly as normal and anomaly packets, and 442 packets were incorrectly detected; the accuracy of Bagging j48 was 99.00%. TP rate for both normal and anomaly was 99.10% and 98.90%, respectively. FR rate for normal packets was 1.10% and, for anomaly packets, it was 0.90%, respectively. Precision, recall, and F1-score for normal packets was 99.00%, 99.10%, and 99.00%, respectively. Similarly, for anomaly packets, precision score was 99.00%, recall score was 98.90%, and F1-Score was 99.00%, respectively. The ROC area was 99.90%, respectively, for both normal and anomaly packets as shown in
Table 34.
Table 35 indicates that 44,481 packets were used for testing and 44,072 packets were detected correctly as normal and anomaly packets, and 409 packets were incorrectly detected; the accuracy of Bagging random forest was 99.08%. TP rate for both normal and anomaly was 99.20% and 99.10%, respectively. FR rate for normal packets was 0.90%, and, for anomaly packets, it was 0.80%, respectively. Precision, recall, and F1-Score for normal packets was 99.10%, 99.10%, and 99.10%, respectively. Similarly, for anomaly packets, precision score was 99.10%, recall score was 99.10%, and F1-Score was 99.10%, respectively. The ROC area was 99.90%, respectively, for both normal and anomaly packets, as shown in
Table 36.
Table 37 indicates that 44,481 packets were used for testing, and 44,072 packets were detected correctly as normal and anomaly packets, and 409 packets were incorrectly detected; the accuracy of Bagging random forest was 99.08%. TP rate for both normal and anomaly was 99.00% and 98.90%, respectively. FR rate for normal packets was 1.10%, and, for anomaly packets, it was 1.00%, respectively. Precision, recall, and F1-score for normal packets was 99.00%, 99.00%, and 99.00%, respectively. Similarly, for anomaly packets, precision score was 98.90%, recall score was 98.90%, and F1-Score was 98.90%, respectively. The ROC area was 99.90%, respectively, for both normal and anomaly packets, as shown in
Table 38.
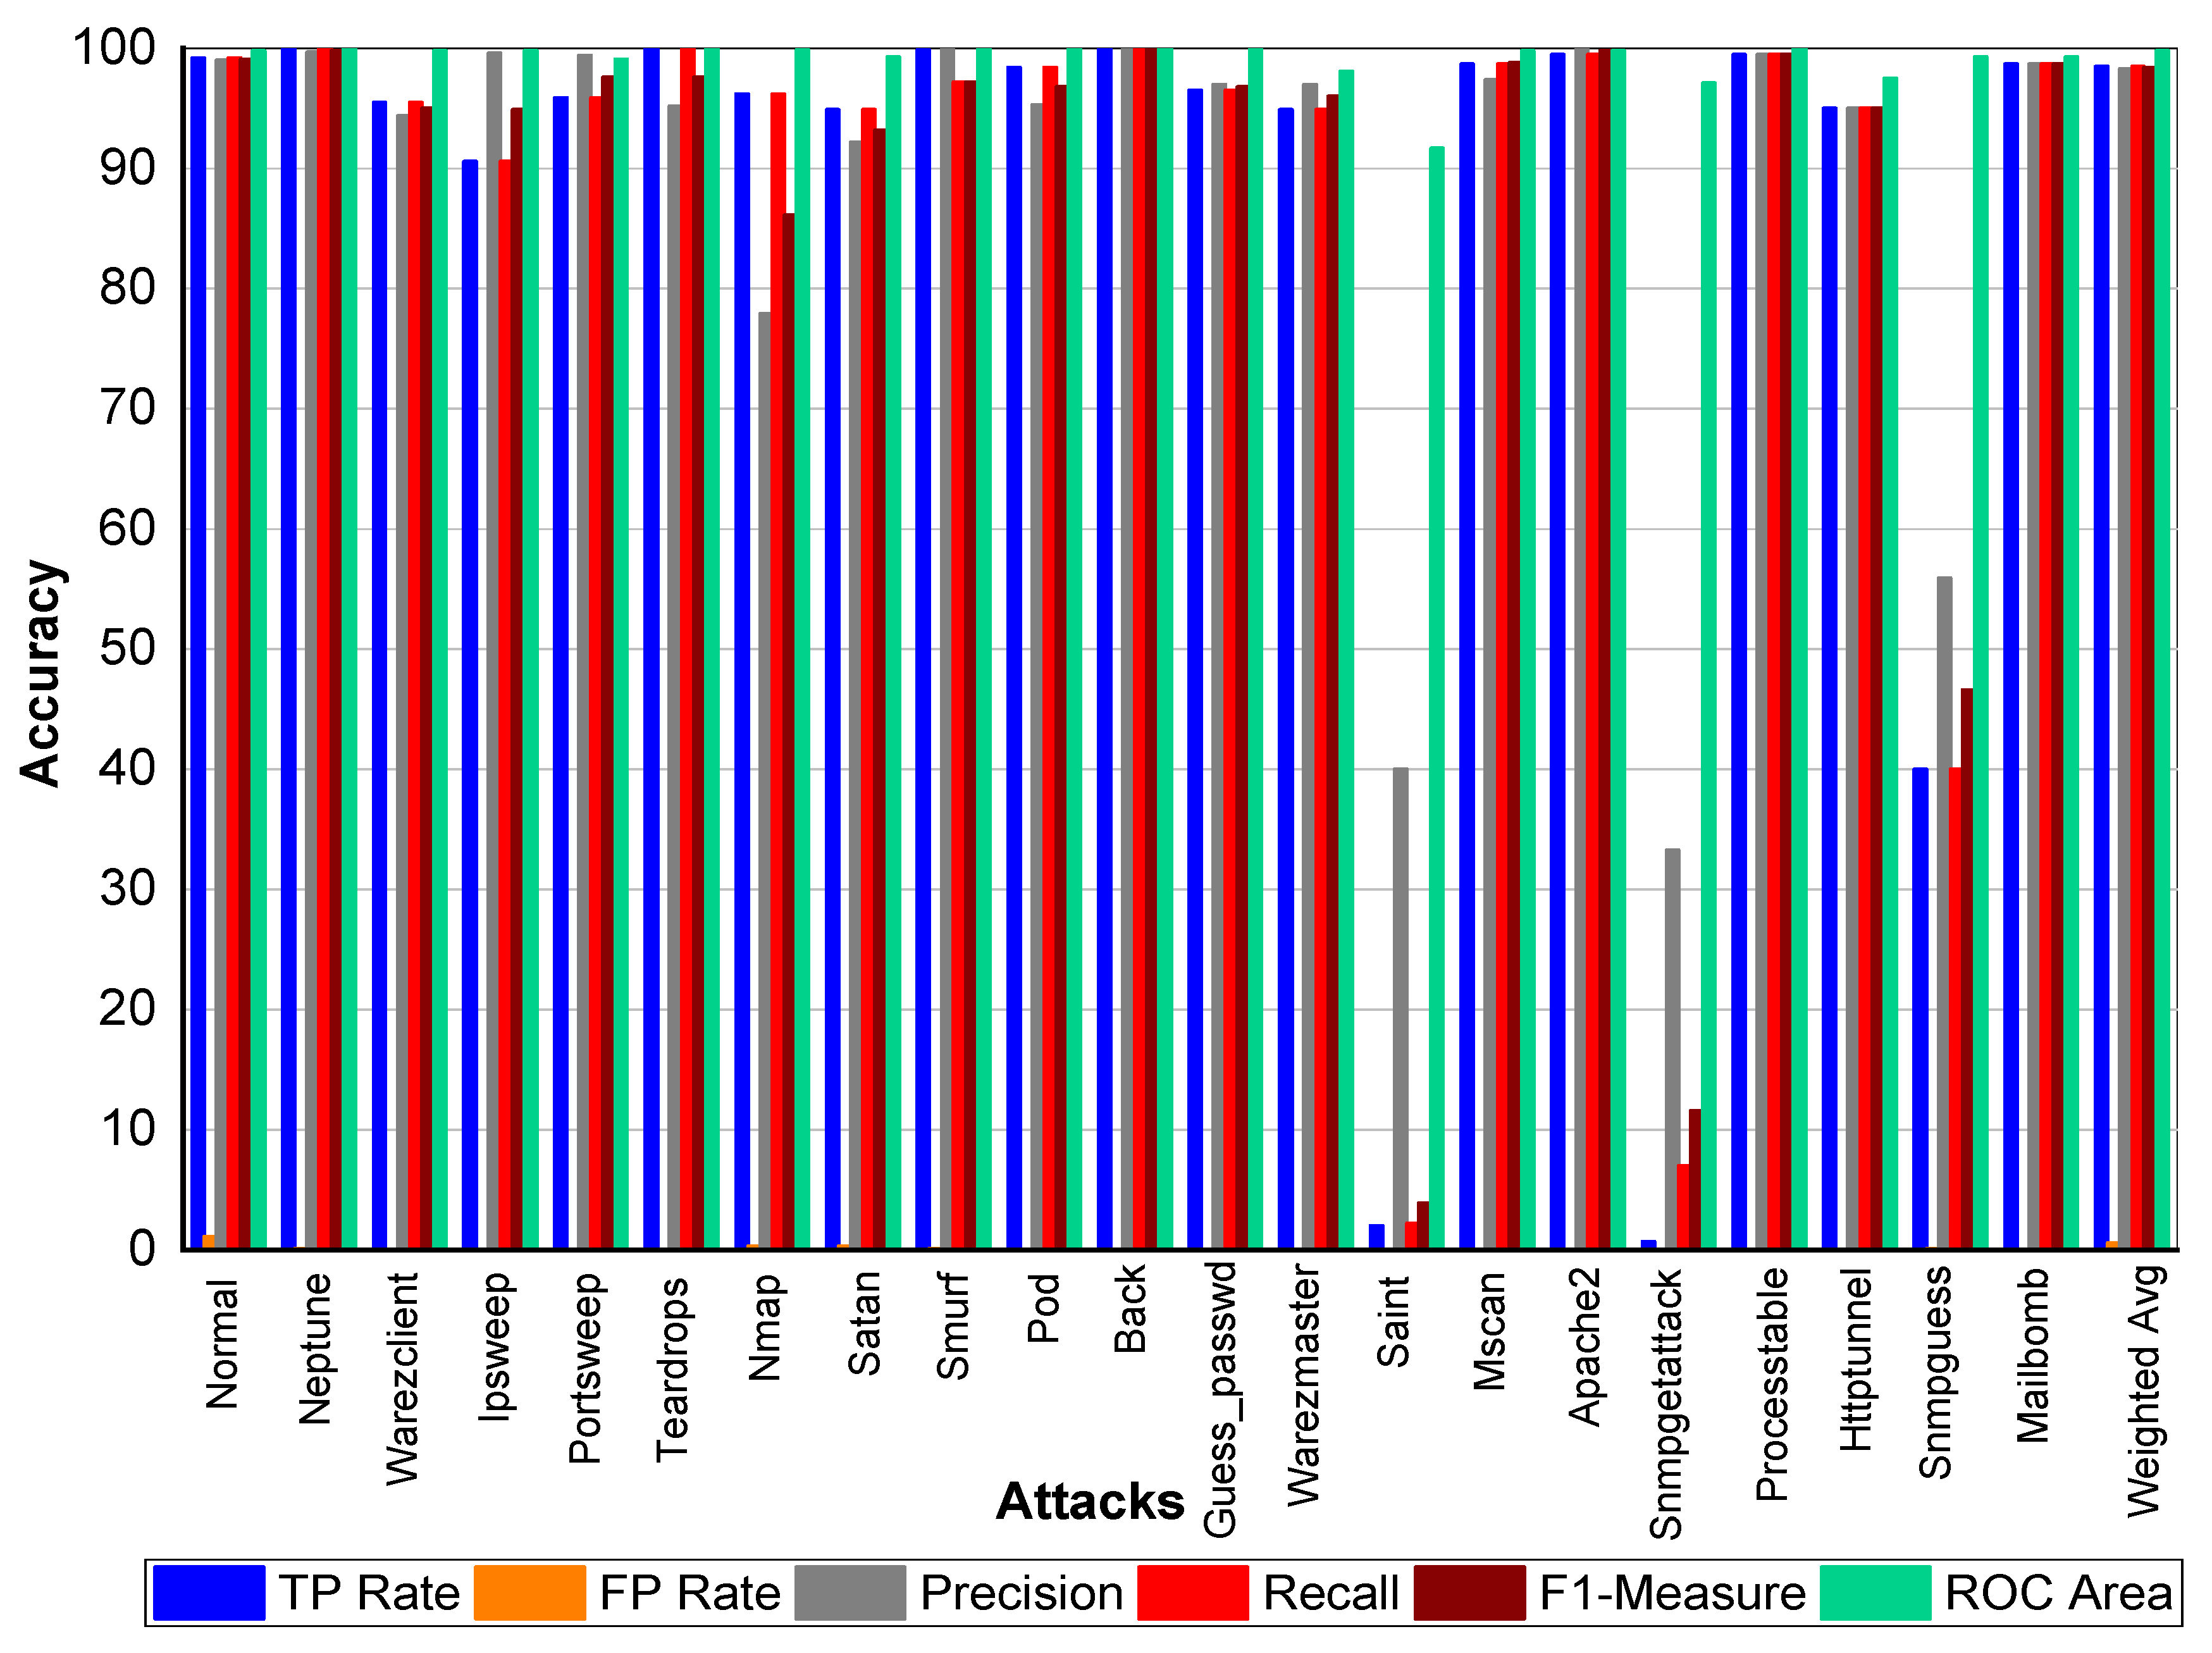
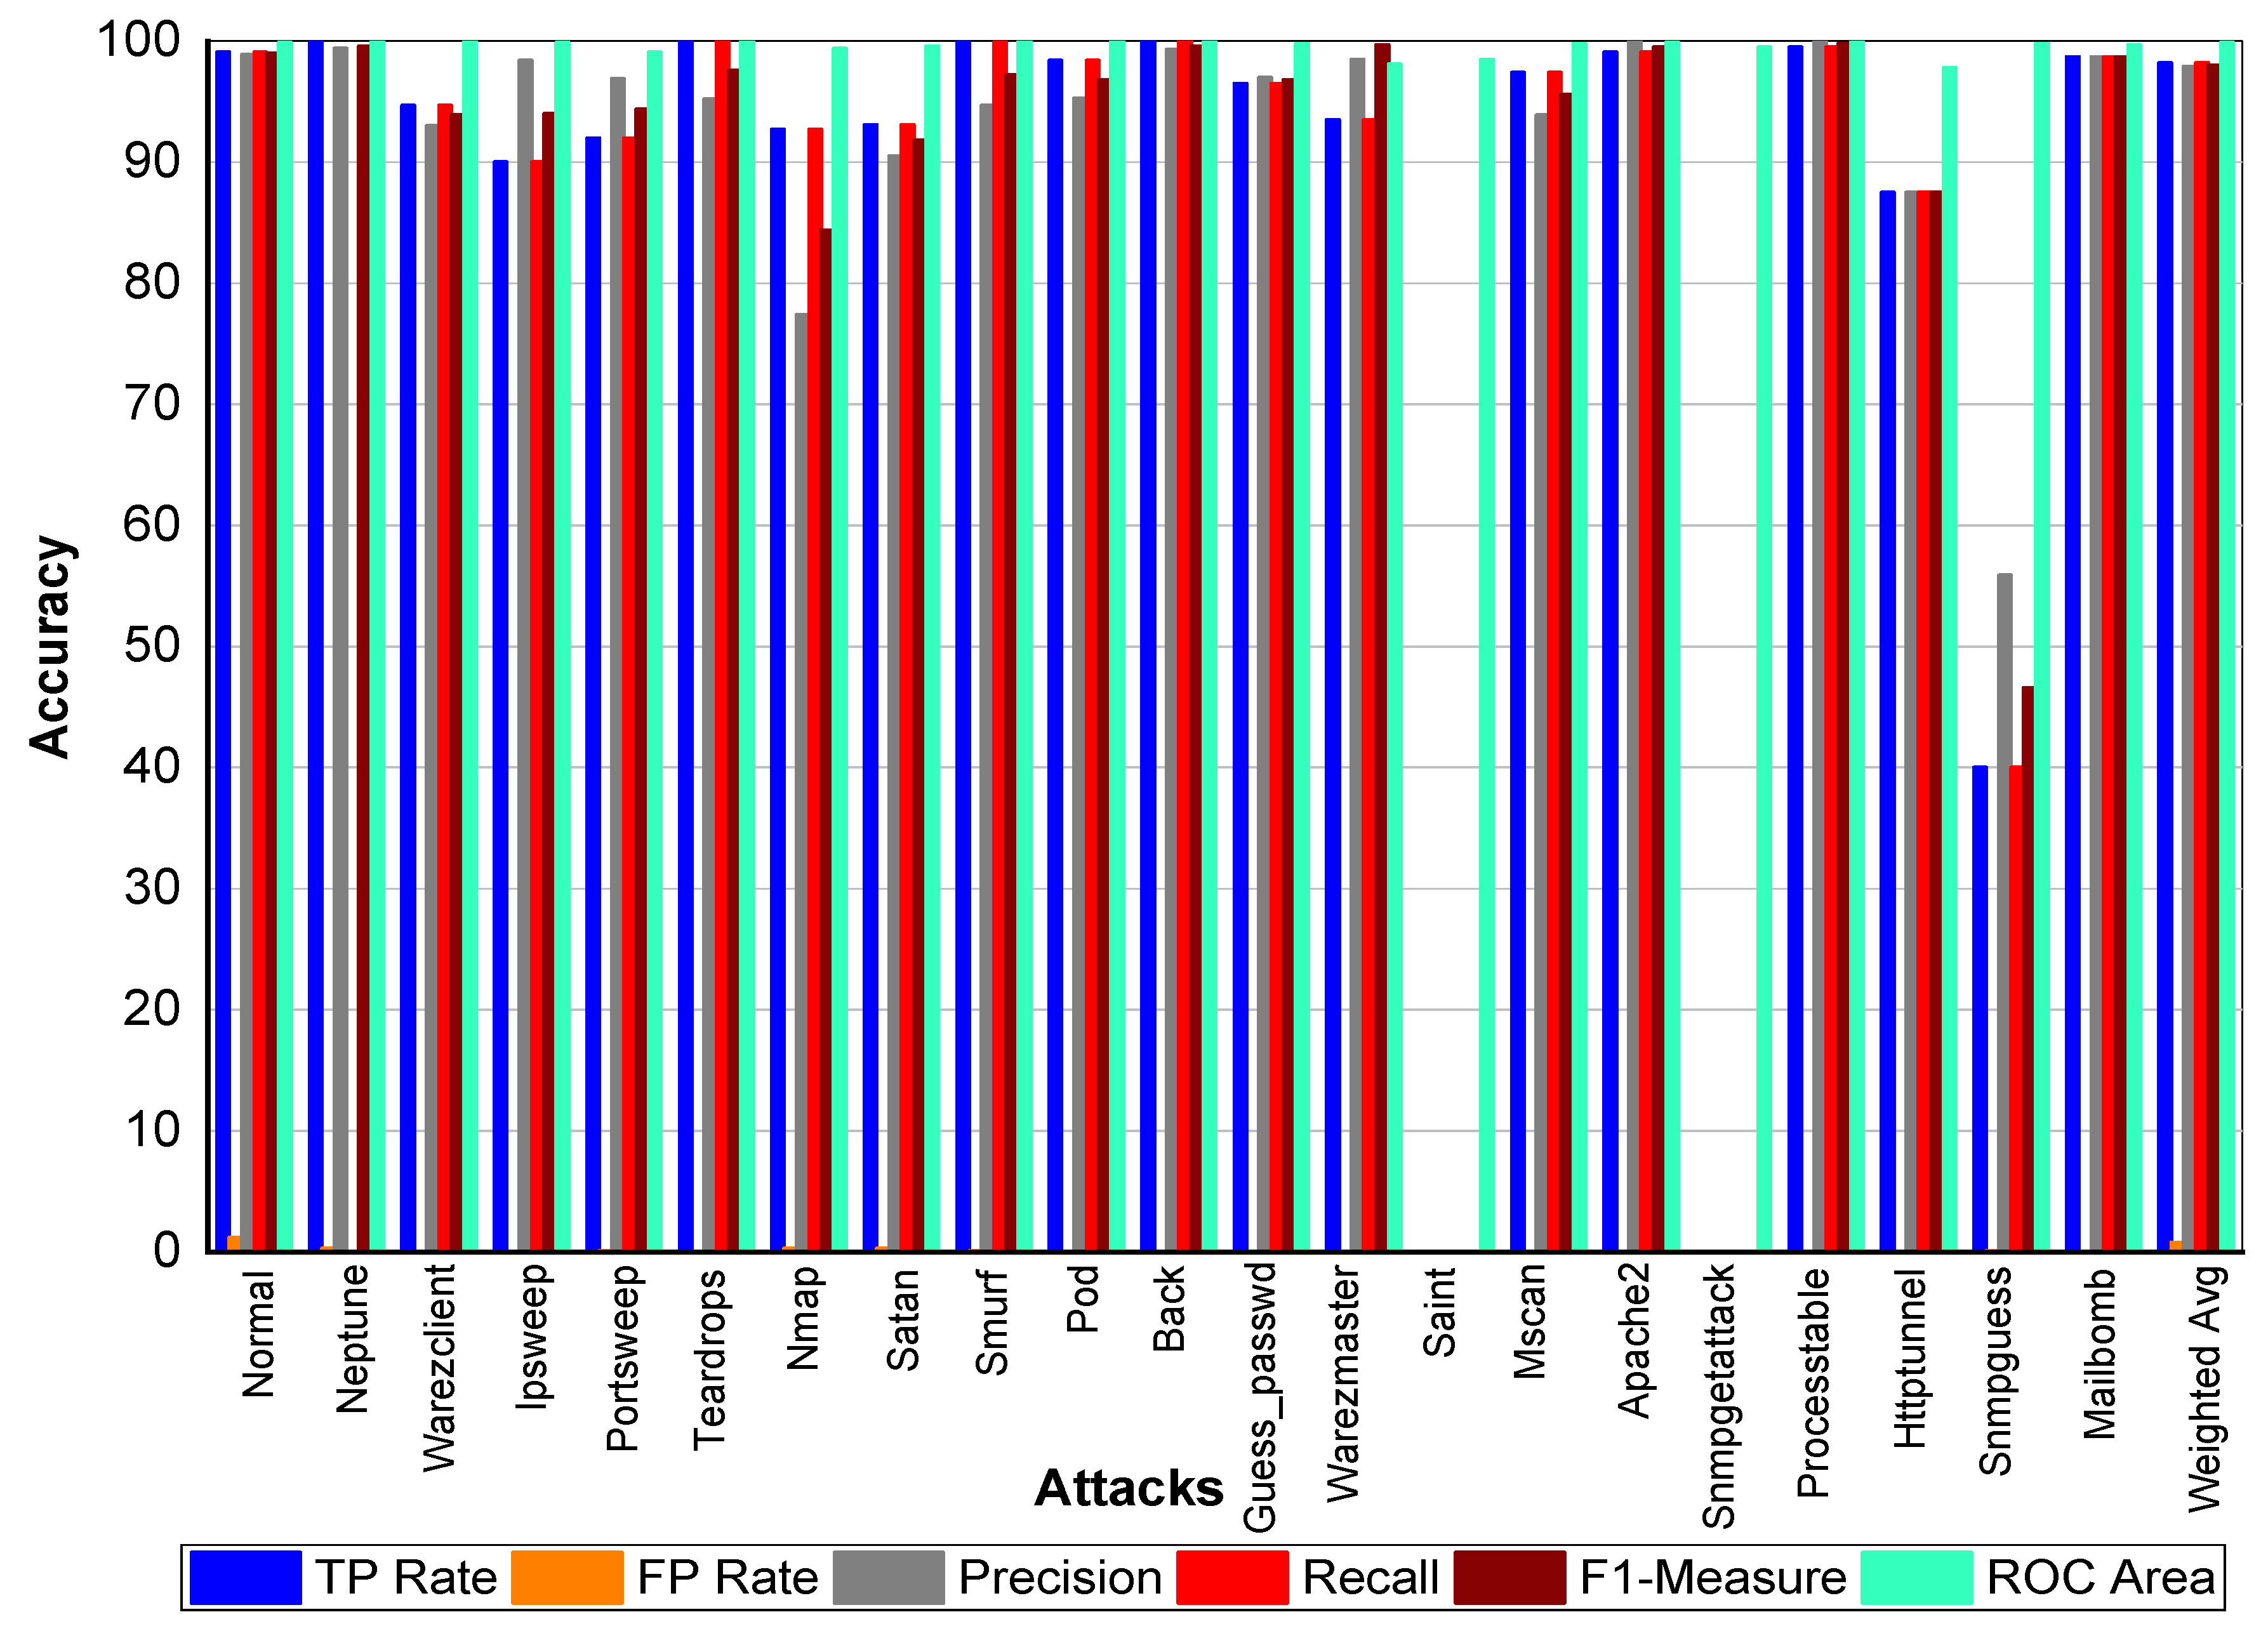
From
Table 39 and
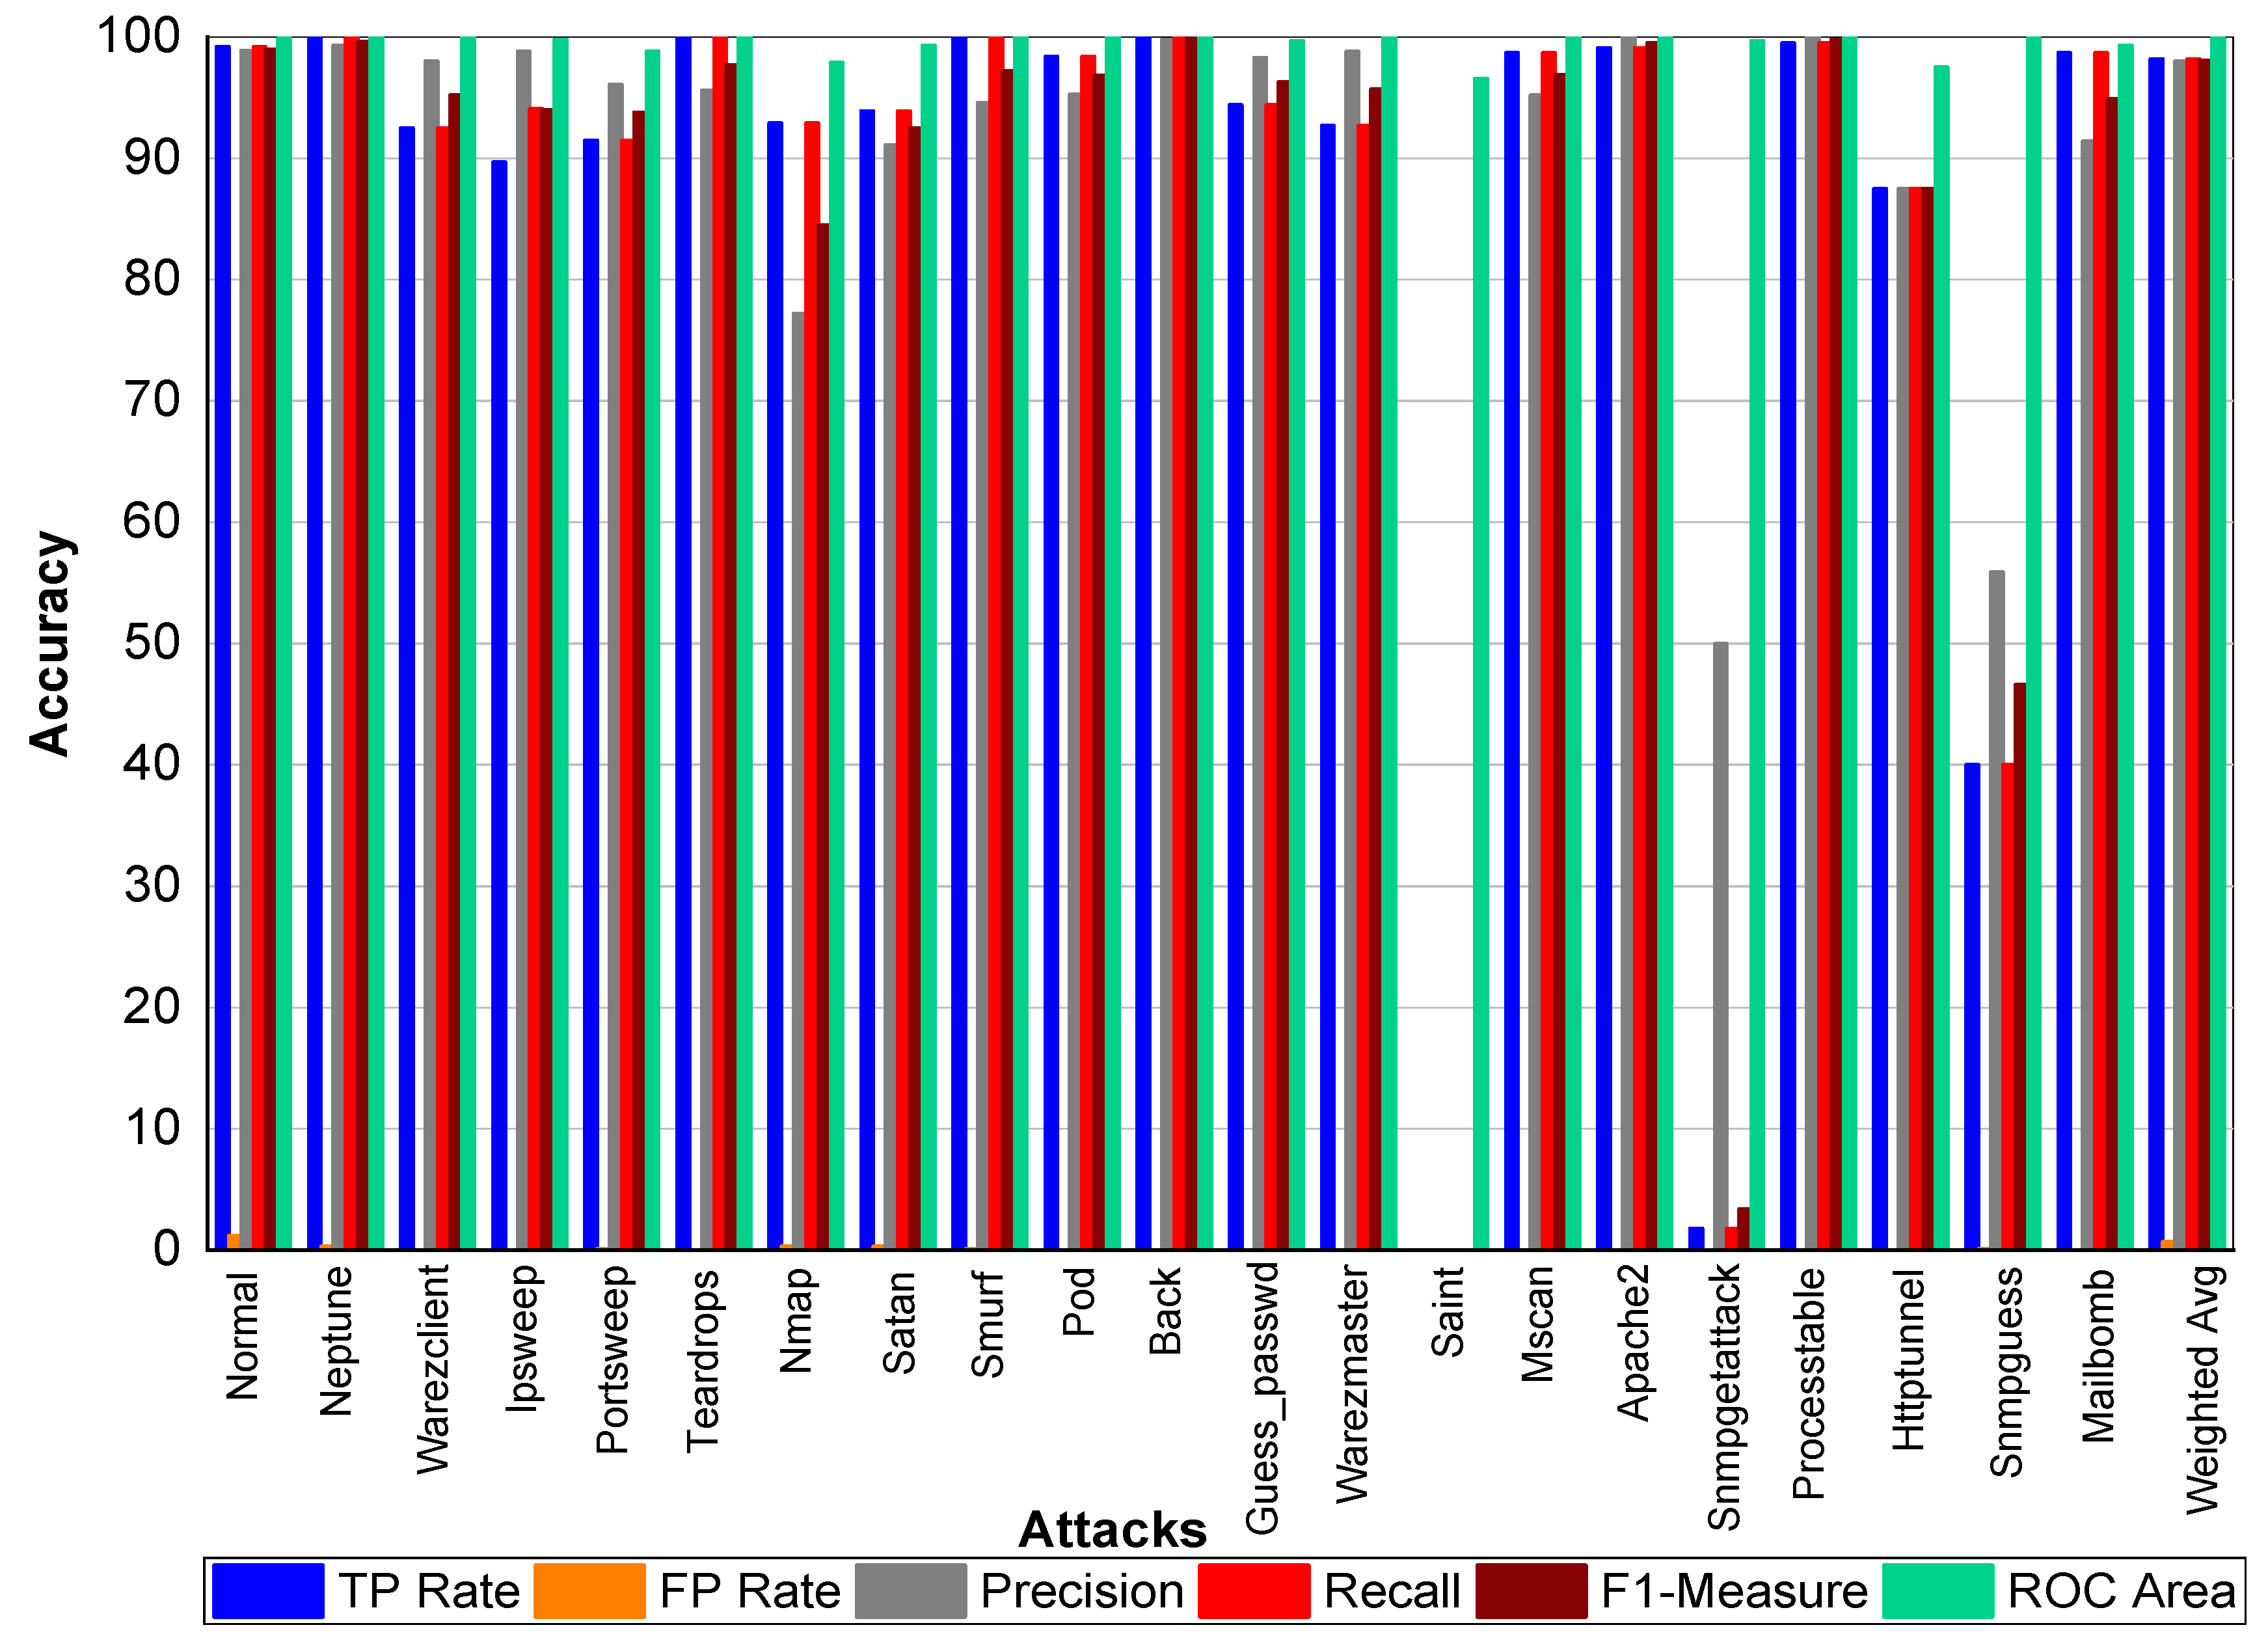
Figure 9, we can conclude that Normal class achieved 99.80% precision, recall, and F1-Measure, respectively. Neptune class achieved 99.90% precision, 100% recall, and 99.90% F1-Measure, respectively. Similarly, Warezclient achieved 95.60%, 90.20%, and 92.80% precision, recall, and F1-Measure, respectively. On the other hand, Ipsweep achieved 99.50%, 90.50%, and 94.80% precision, recall, and F1-Measure, respectively. Portsweep achieved above 97% precision, recall, and F1-Measure, respectively. Teardrop achieved 96.30%, 100%, 98.10% precision, recall, and F1-Measure, respectively. For Nmap precision, recall and F1-Measure scores were 78.20%, 96.20%, and 86.30%, respectively. Satan, Smurf, and Pod achieved on average 90% precision, recall, and F1-Measure, respectively. Back attack achieved 100% recall while 99.80% and 99.90% precision and F1-Measure, respectively. Guess_passwd achieved 96.50%, 96.80%, and 96.70% precision, recall, and F1-Measure, respectively. Saint, Snmpgetattack, and Snmpguess attack didn’t perform well. Warezmaster, Mscan, Apache 2, Processtable, Httptunnel, and Mailbomb also achieved promising results for precision, recall, F1-Measure, and for TP Rate as well.
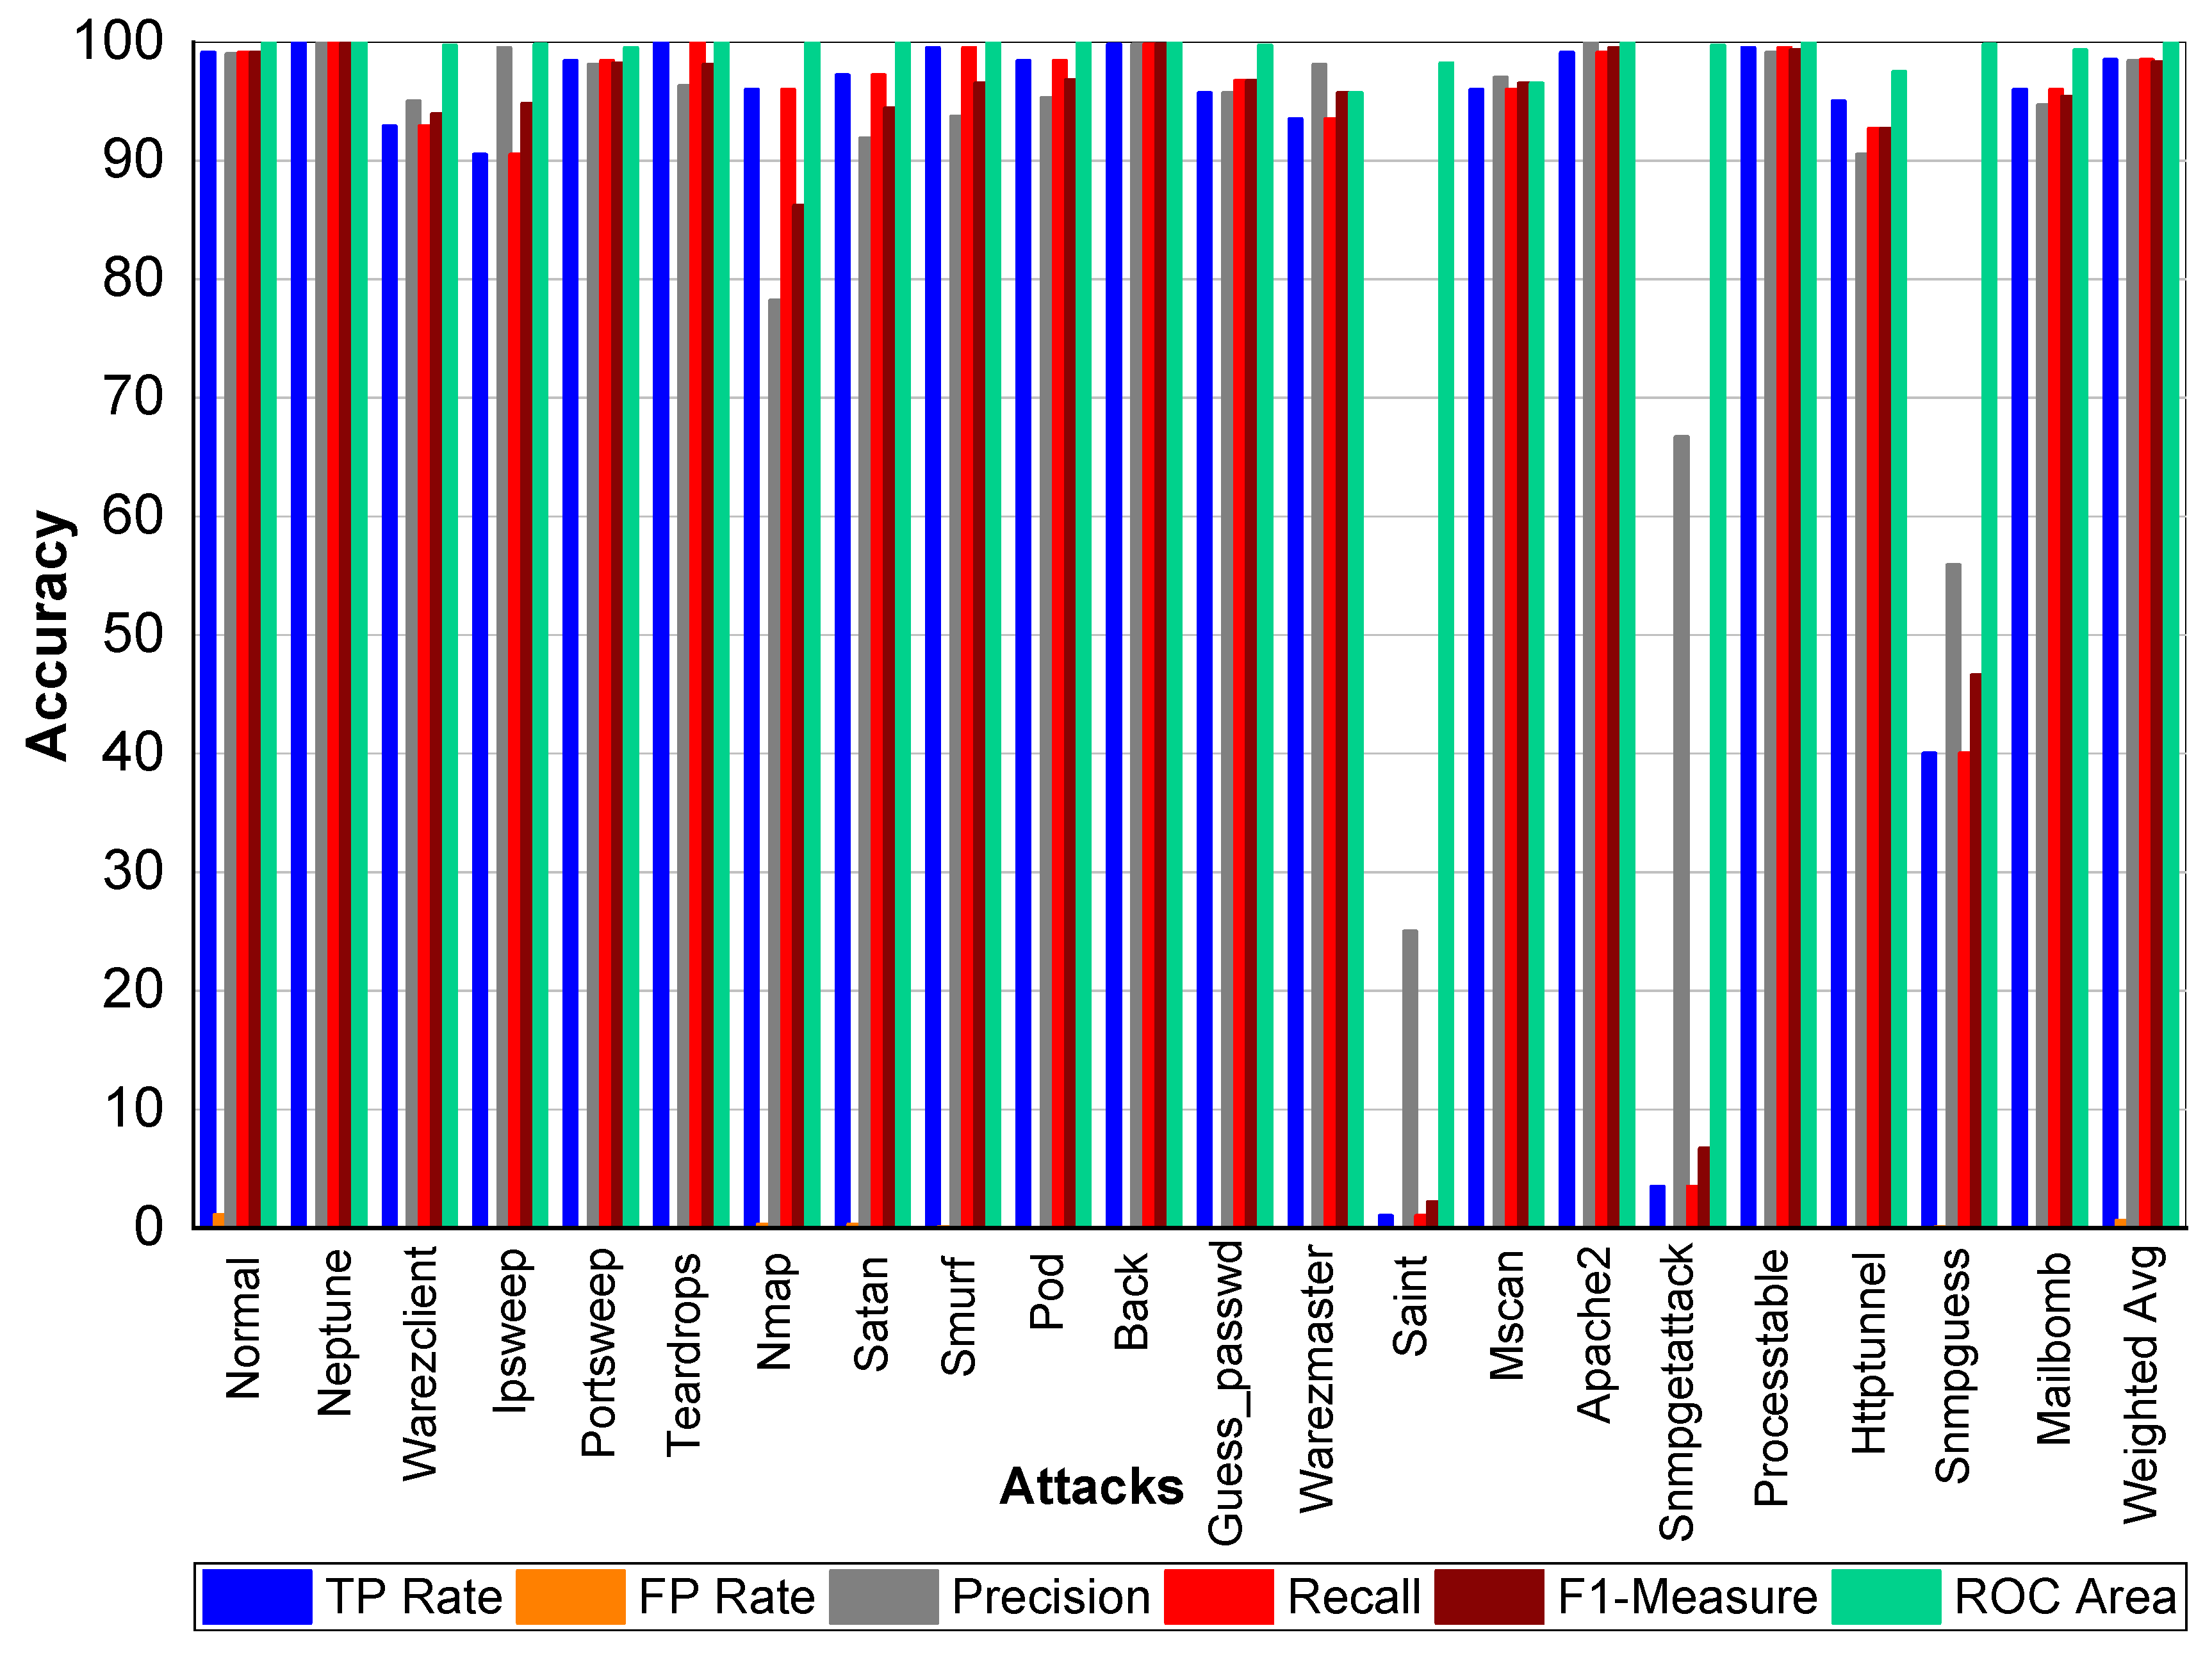
From
Table 40 and
Figure 10, we can conclude that Normal class achieved 99.00% precision, 99.20% recall, and 99.10% F1-Measure, respectively. Neptune class achieved 99.70% precision, 100% recall, and 99.80% F1-Measure, respectively. Similarly, Warezclient achieved 94.40%, 95.50%, and 95% precision, recall, and F1-Measure, respectively. Likewise, Ipsweep achieved 99.60%, 90.60%, and 94.90% precision, recall, and F1-Measure, respectively. Portsweep achieved above 97% precision, recall, and F1-Measure, respectively. Teardrop achieved 95.20%, 100%, 97.60% precision, recall, and F1-Measure, respectively. For Nmap precision, recall, and F1-Measure scores were 77.90%, 96.20%, and 86.10%, respectively. Satan, Smurf, and Pod achieved on average 90% precision, recall, and F1-Measure, respectively. Back attack achieved 100% recall, precision, and F1-Measure, respectively. Guess_passwd achieved 97%, 96.50%, and 96.80% precision, recall, and F1-Measure, respectively. Saint, Snmpgetattack, and Snmpguess performed well. Warezmaster, Mscan, Apache2, Processtable, Httptunnel, and Mailbomb also achieved promising results for precision, Recall, F1-Measure, and for TP Rate as well.
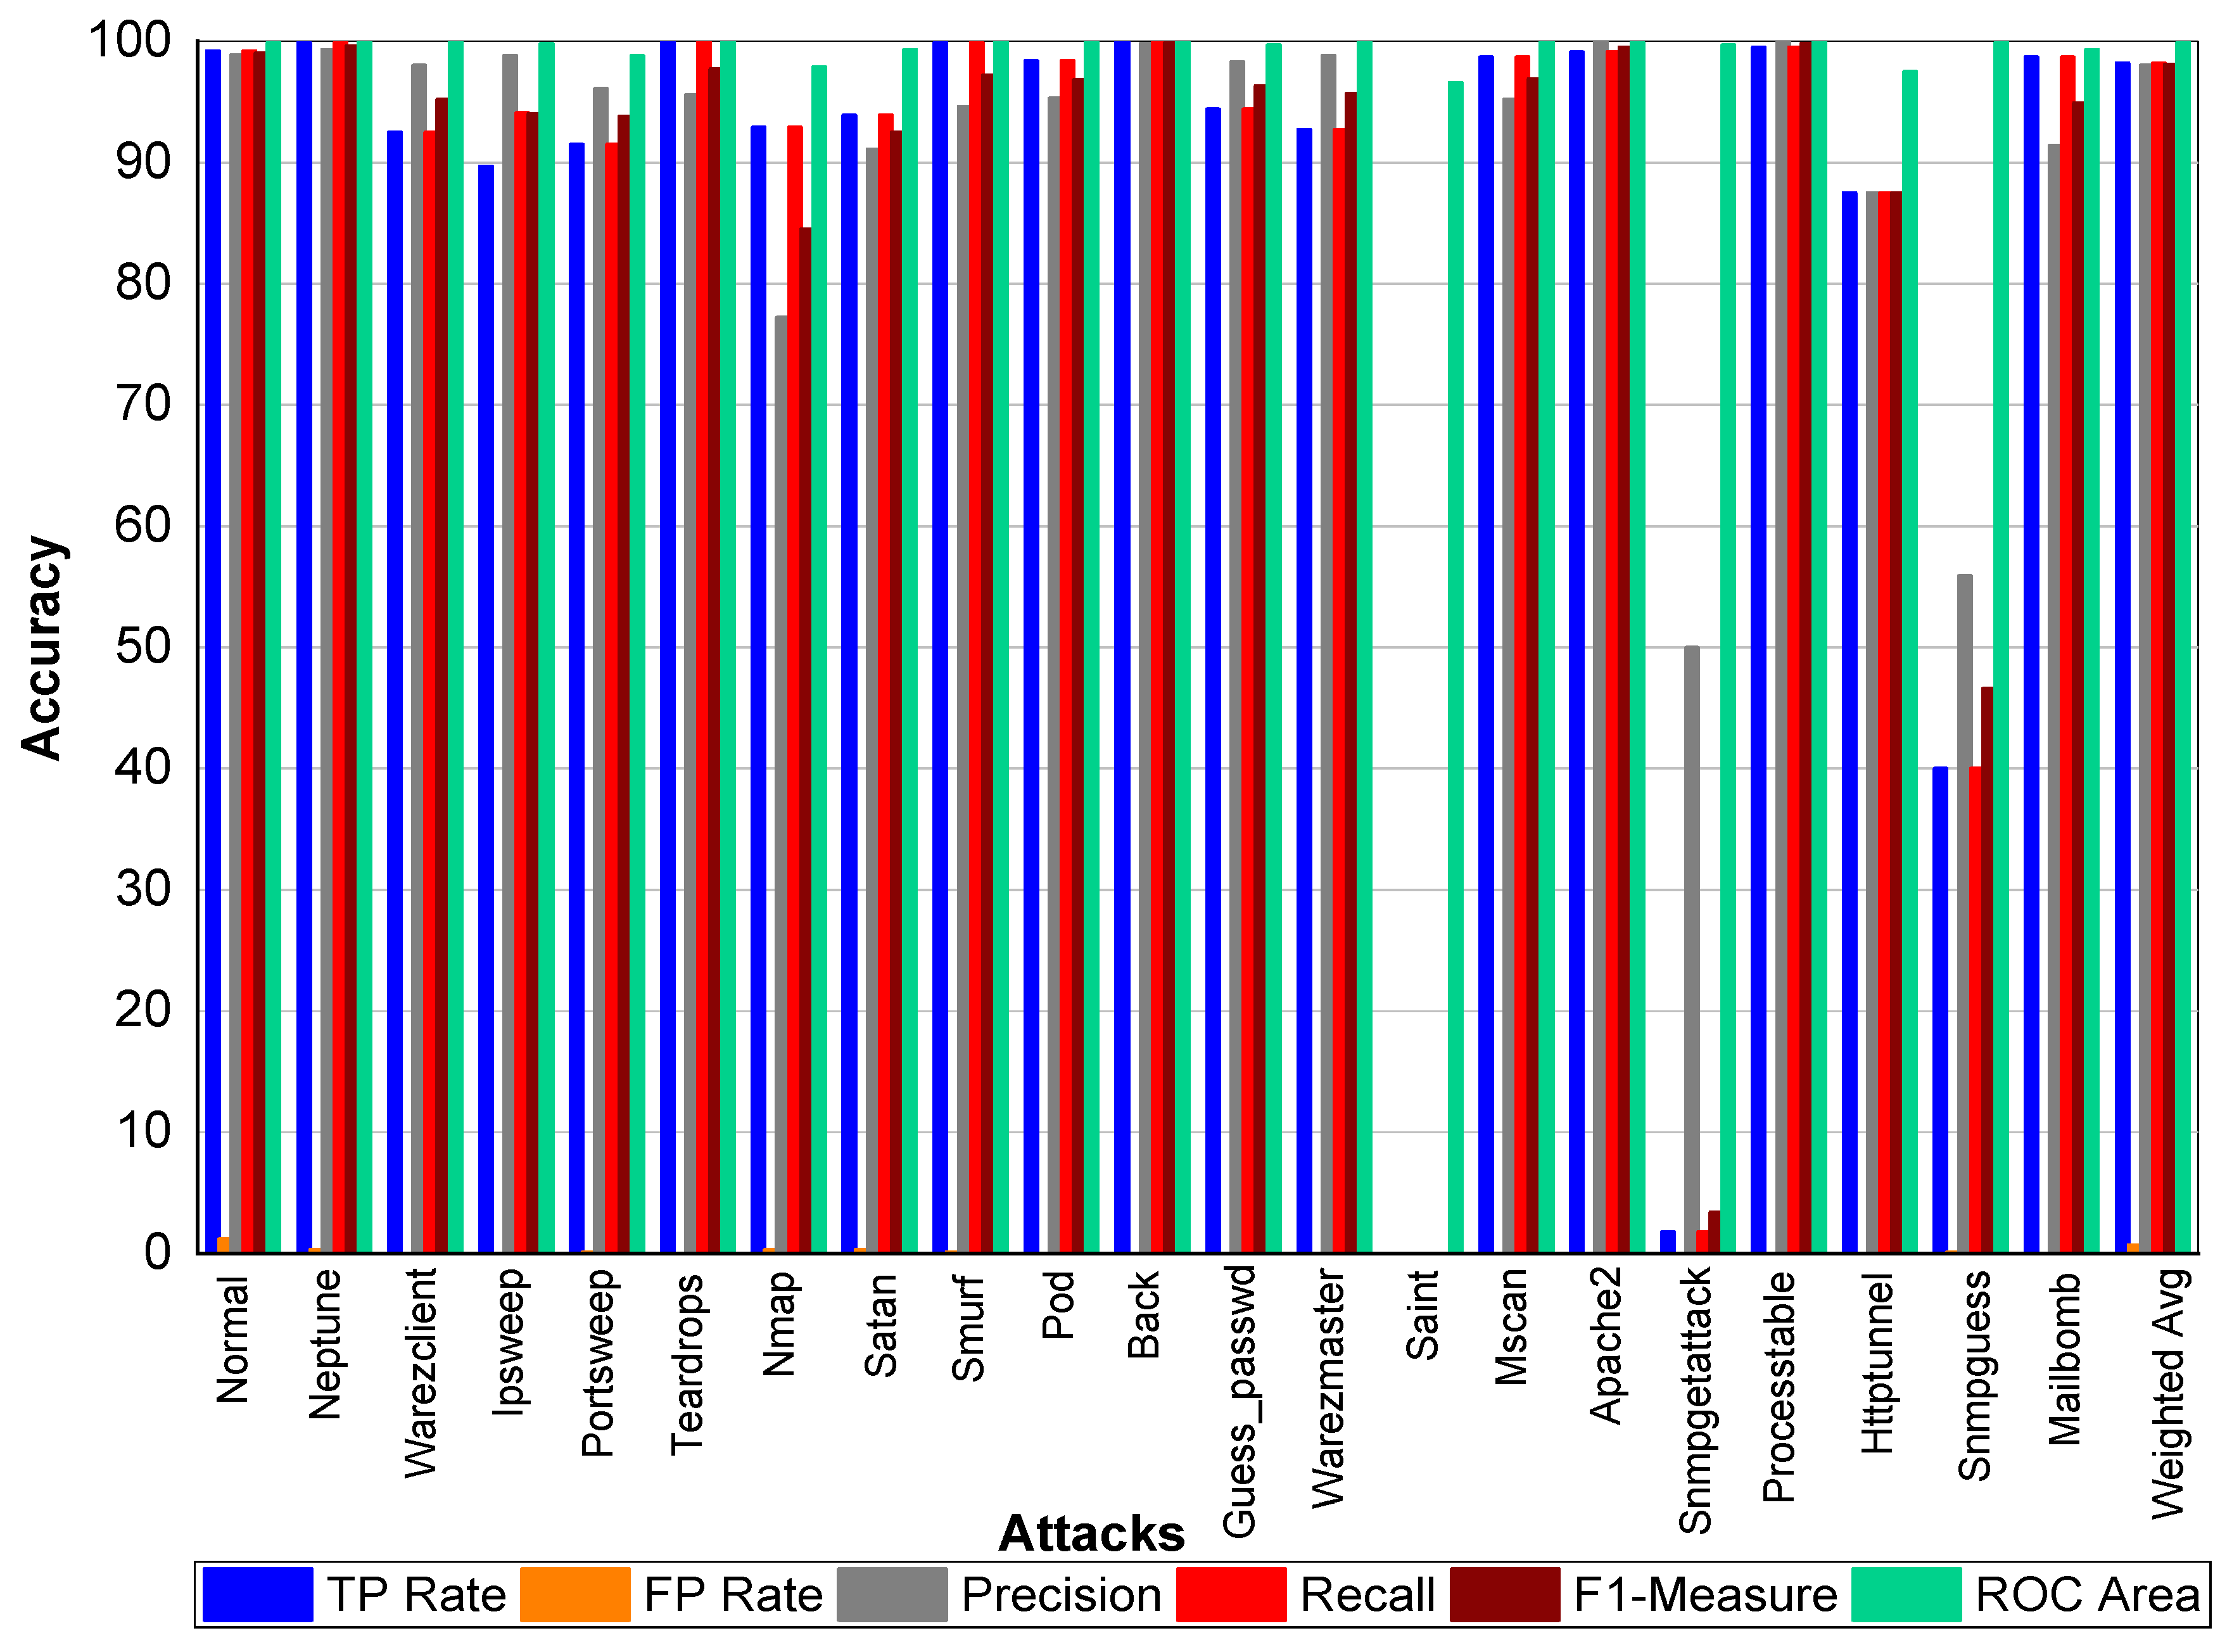
From
Table 41 and
Figure 11, we can conclude that Normal class achieved 98.90% precision, 99.10% recall, and 99% F1-Measure, respectively. Neptune class achieved 99.40% precision, 99.90% recall, and 99.60% F1-Measure, respectively. Similarly, Warezclient achieved 93%, 94.70%, and 93.90% precision, recall, and F1-Measure, respectively. In addition, Ipsweep achieved 98.40%, 90%, and 94% precision, recall, and F1-Measure, respectively. Portsweep achieved above 96.90% precision, 92% recall, and 94.40% F1-Measure, respectively. Teardrop achieved 95.20%, 100%, 97.60% precision, recall, and F1-Measure, respectively. For Nmap precision, recall and F1-Measure scores were 74.40%, 92.70%, and 84.40%, respectively. Satan, Smurf, and Pod achieved on average 93% precision, recall, and F1-Measure, respectively. Back attack achieved 100% recall while 99.30% and 99.60% precision, and F1-Measure, respectively. Guess_passwd achieved 97%, 96.50% and 96.80% precision, recall, and F1-Measure, respectively. Saint, Snmpgetattack, and Snmpguess performed well. Warezmaster, Mscan, Apache2, Processtable, Httptunnel, and Mailbomb also achieved promising results for precision, recall, and F1-Measure.
From
Table 42 and
Figure 12, we can conclude that Normal class achieved 99% Precision, 99.10% Recall, and 99.10% F1-Measure, respectively. Neptune class achieved 99.90% Precision, 100% Recall, and 99.90% F1-Measure, respectively. Similarly, Warezclient achieved 95%, 992%, and 93% Precision, Recall, and F1-Measure, respectively. Meanwhile, Ipsweep achieved 99%, 90%, and 94% Precision, Recall, and F1-Measure, respectively. Portsweep achieved above 98.10% precision, 98.40% Recall, and 98.20% F1-Measure, respectively. Teardrop achieved 96.30%, 100%, 98.60% Precision, Recall, and F1-Measure, respectively. For Nmap Precision, Recall, and F1-Measure scores are 78%, 96%, and 86%, respectively. In addition, 91%, 97%, and 94% Precision, Recall, and F1-Measure are achieved for Satan attack. Smurf and Pod achieved on average 96% Precision, Recall, and F1-Measure, respectively. Back attack achieved 100% Recall while 99.30% and 99.60% Precision, and F1-Measure, respectively. Guess_passwd achieved 97%, 96.50%, and 96.80% Precision, Recall, and F1-Measure, respectively. Saint, Snmpgetattack, and Snmpguess attacks did not perform well. Warezmaster, Mscan, Apache2, Processtable, Httptunnel, and Mailbomb also achieved promising results for precision, Recall, and F1-Measure.
From
Table 43 and
Figure 13, we can conclude that Normal class achieved 99.10% Precision, 99.20% Recall, and 99.20% F1-Measure, respectively. Neptune class achieved 99.80% Precision, 100% Recall, and 99.90% F1-Measure, respectively. In addition, Warezclient achieved 93%, 98.90%, and 96% Precision, Recall, and F1-Measure, respectively. Likewise, Ipsweep achieved 99.70%, 90.90%, and 95.10% Precision, Recall, and F1-Measure, respectively. Portsweep achieved above 99% precision, 96% Recall, and 97% F1-Measure, respectively. Teardrop achieved 96.30%, 99.60%, 97.90% Precision, Recall, and F1-Measure, respectively. For Nmap Precision, Recall, and F1-Measure scores are 78.60%, 95.30% and 86.20%, respectively. In addition, 91.90%, 96.70%, 94.20% Precision, Recall, and F1-Measure are achieved for Satan attack. Smurf achieved 94%, 99%, and 97% Precision, Recall, and F1-Measure, respectively. Pod achieved on average 96% Precision, Recall, and F1-Measure, respectively. Back attack achieved 100% Precision, Recall, and F1-Measure, respectively. Guess_passwd achieved 97%, 96.50%, and 96.80% Precision, Recall, and F1-Measure, respectively. Saint, Snmpgetattack, and Snmpguess performed well. Warezmaster, Mscan, Apache2, Processtable, Httptunnel, and Mailbomb also achieved promising results for precision, Recall, and F1-Measure. All the attacks achieved above 90% results for all the evaluation matrixs.
From
Table 44 and
Figure 14, we depict that Normal class achieved 98% precision, 99.20% recall, and 99.00% F1-Measure, respectively. Neptune class achieved 99.30% precision, 99.90% recall, and 99.60% F1-Measure, respectively, while Warezclient achieved 98%, 92%, and 95% precision, recall, and F1-Measure, respectively. Similarly, Ipsweep achieved 98%, 94%, and 94% precision, recall, and F1-Measure, respectively. Portsweep achieved above 96% precision, 91% recall, and 93% F1-Measure, respectively. Teardrop achieved 95.60%, 100%, 97.70% precision, recall, and F1-Measure, respectively. For Nmap precision, recall, and F1-Measure scores are 77%, 92%, and 84%, respectively. In addition, 91%, 93%, and 92% precision, recall, and F1-Measure were achieved for Satan attack. Smurf achieved 94%, 99%, and 97% precision, recall, and F1-Measure, respectively. Pod achieved on average 97% precision, recall, and F1-Measure, respectively. Back attack achieved 99.80% precision, 100% recall, and 99.90% F1-Measure, respectively. Guess_passwd achieved 98%, 94%, and 96% precision, recall, and F1-Measure, respectively. Saint, Snmpgetattack, and Snmpguess performed well. Warezmaster, Mscan, Apache2, Processtable, Httptunnel, and Mailbomb also achieved promising results for precision, recall, and F1-Measure. These attacks achieved above 95% results for all the evaluation matrixs.

 ,
, 


