Train Hunting Related Fast Degradation of a Railway Crossing—Condition Monitoring and Numerical Verification


Abstract
1. Introduction
2. Methodology
2.1. Experimental Tools
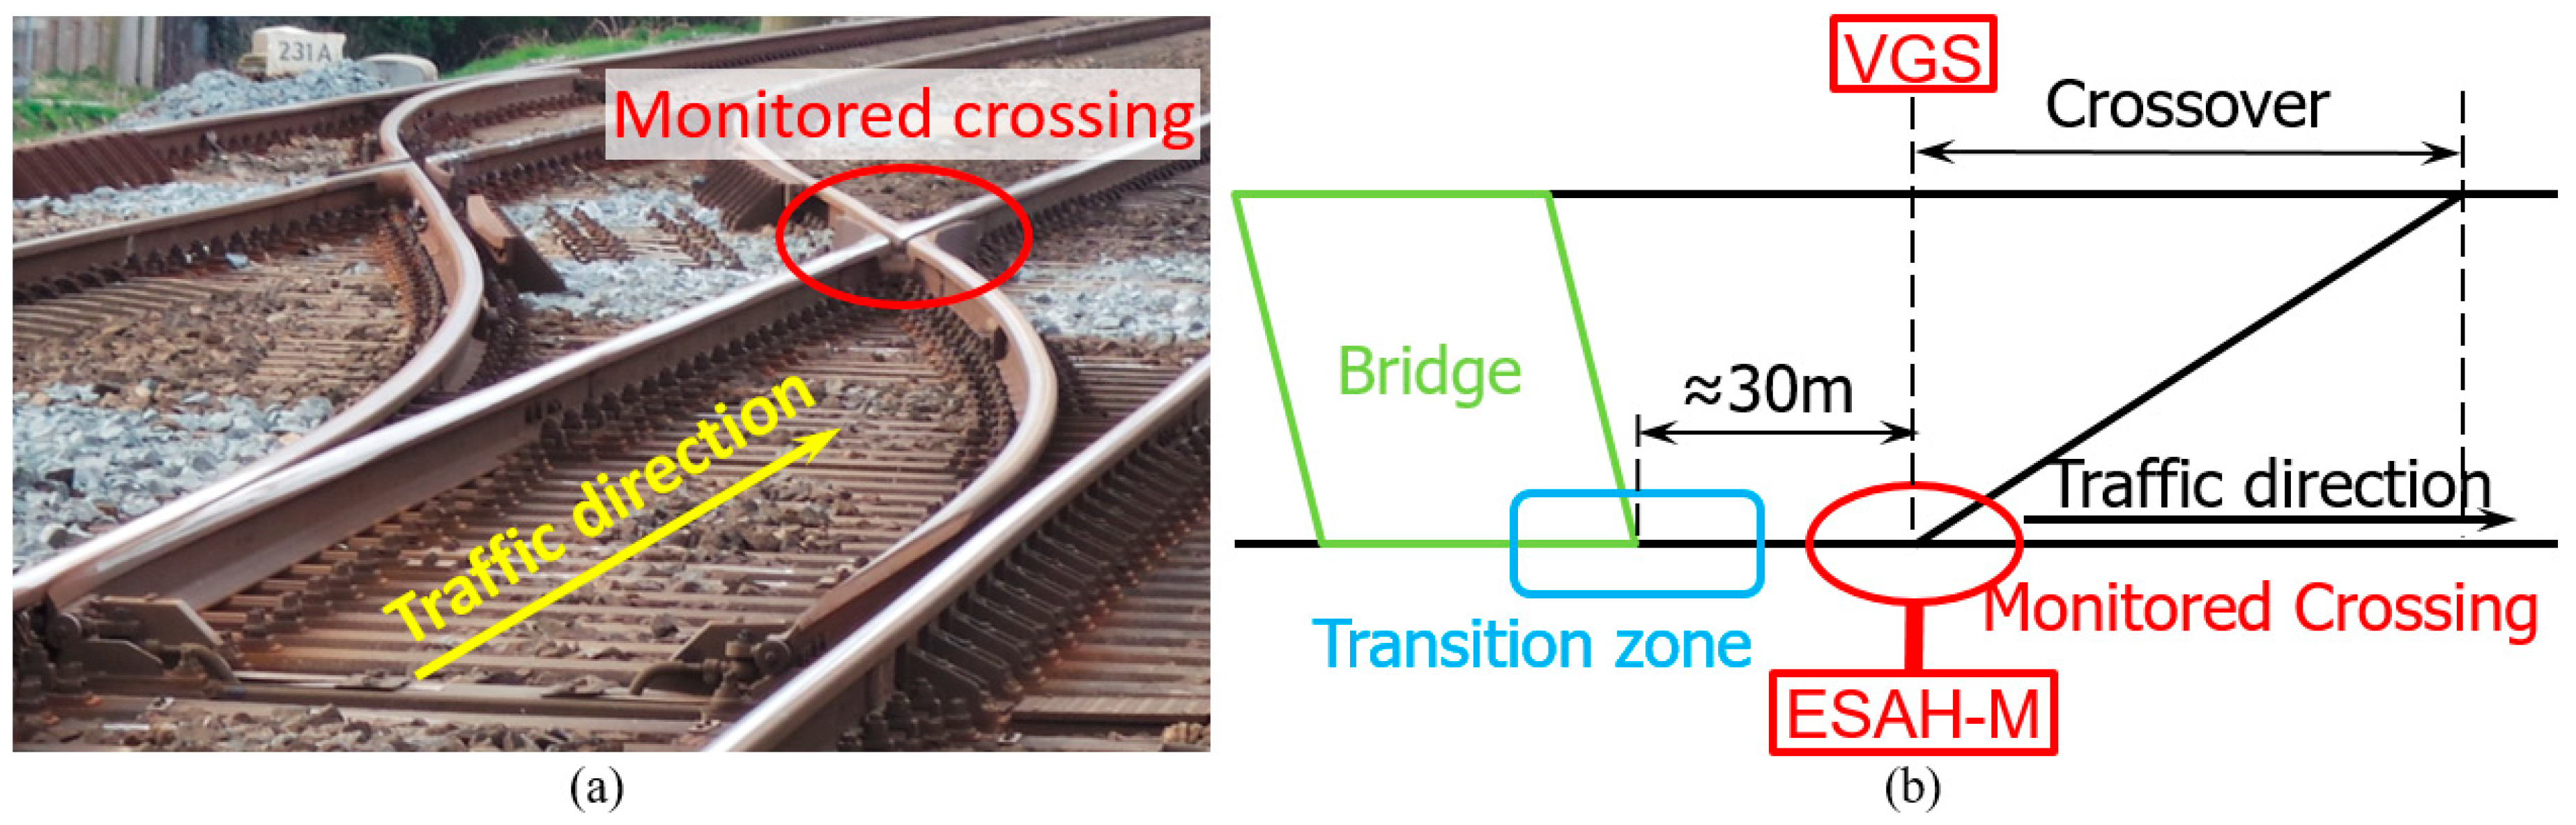
2.1.1. Crossing Instrumentation
2.1.2. Wayside Monitoring System
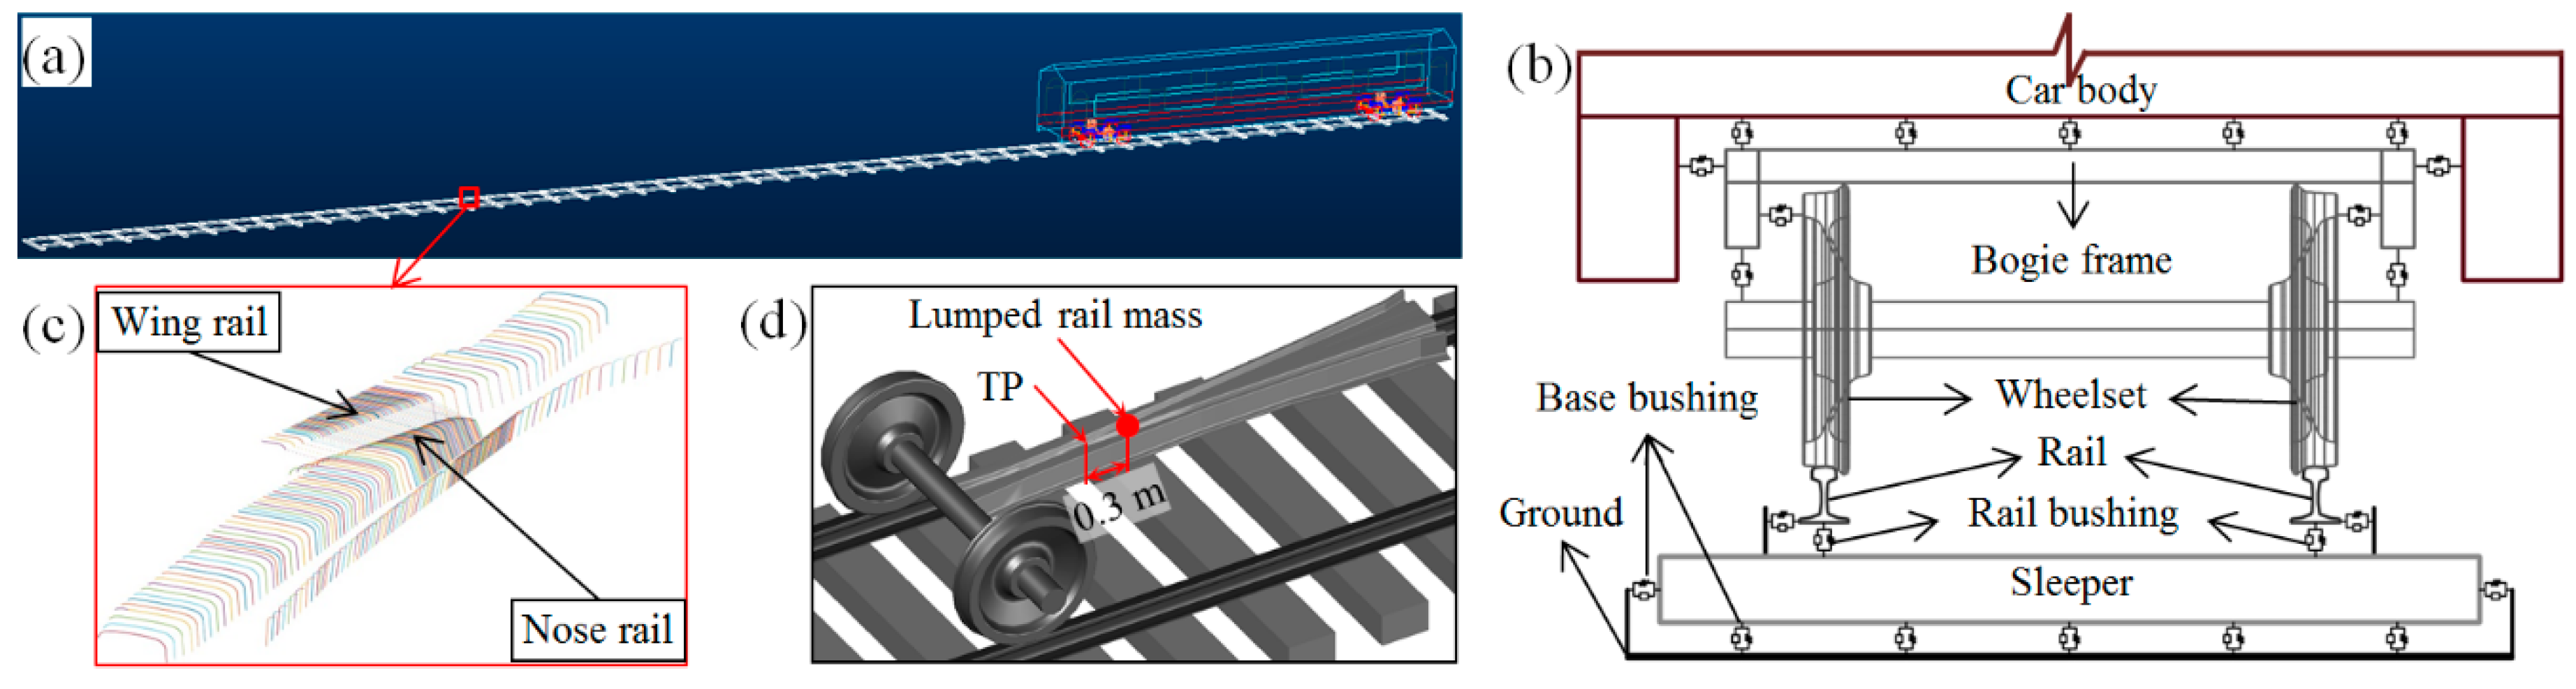
2.2. Multi-Body System (MBS) Vehicle-Crossing Model
3. Field Measurements and Analysis
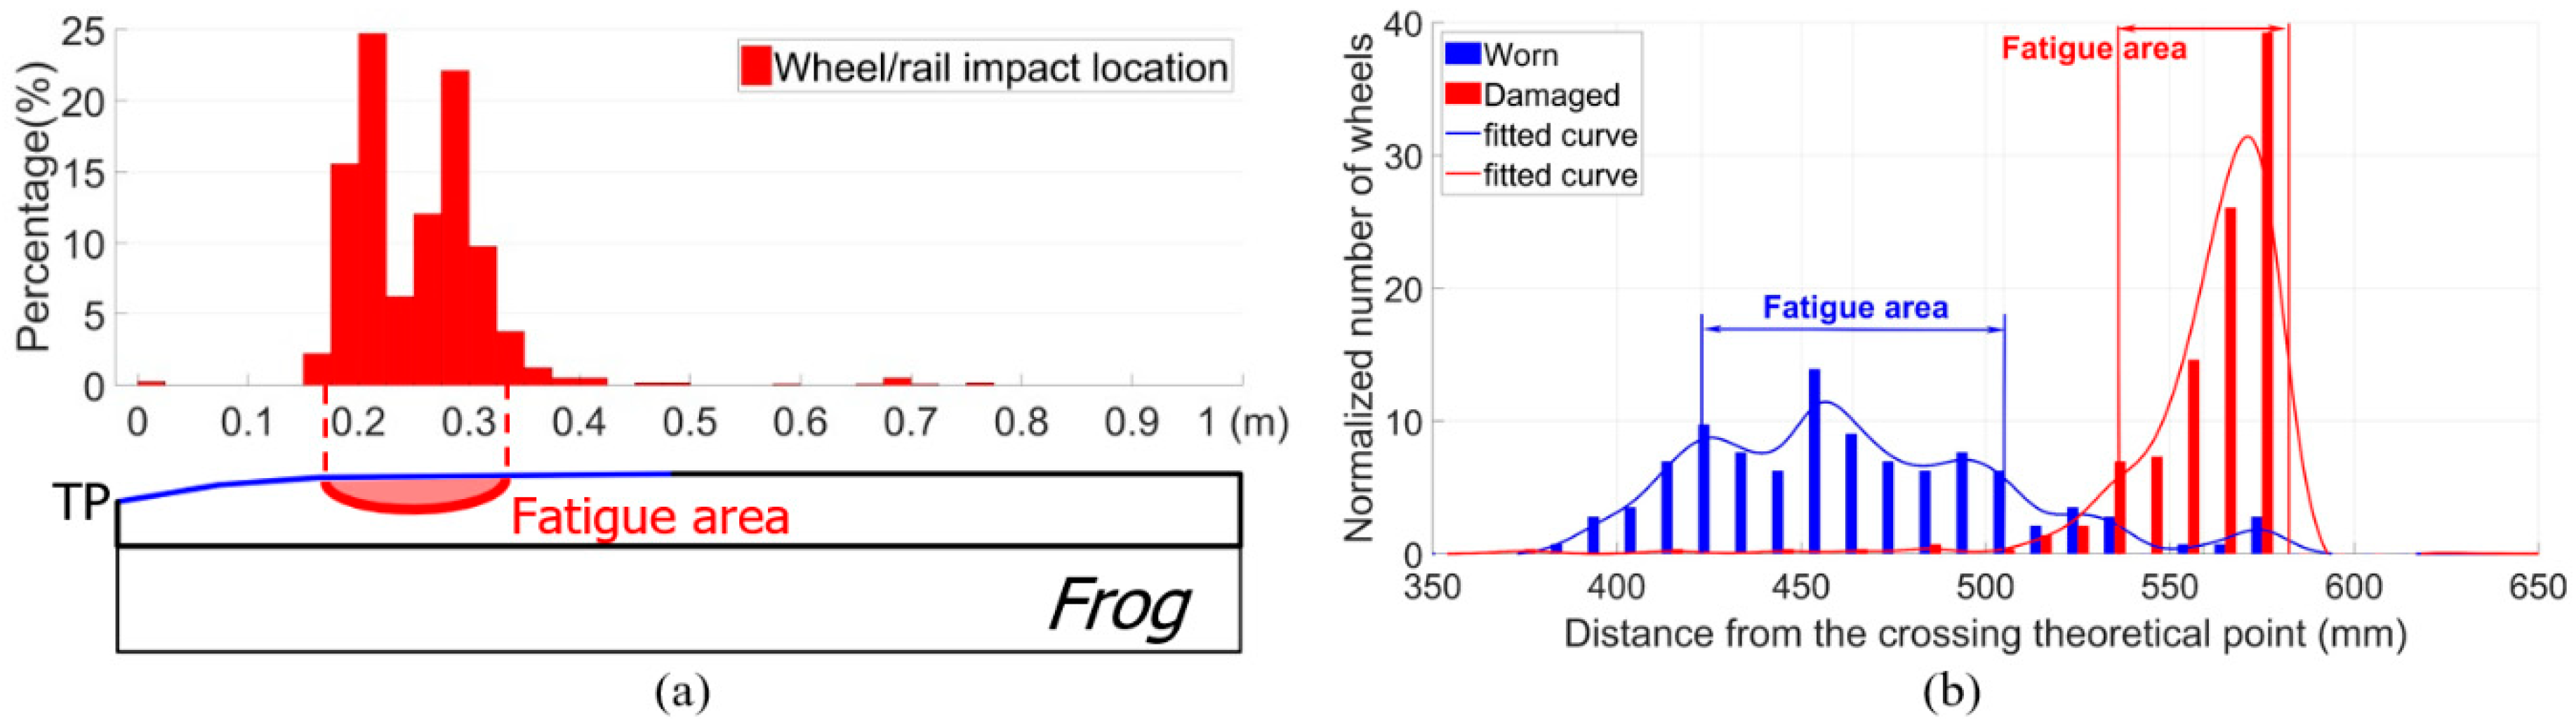
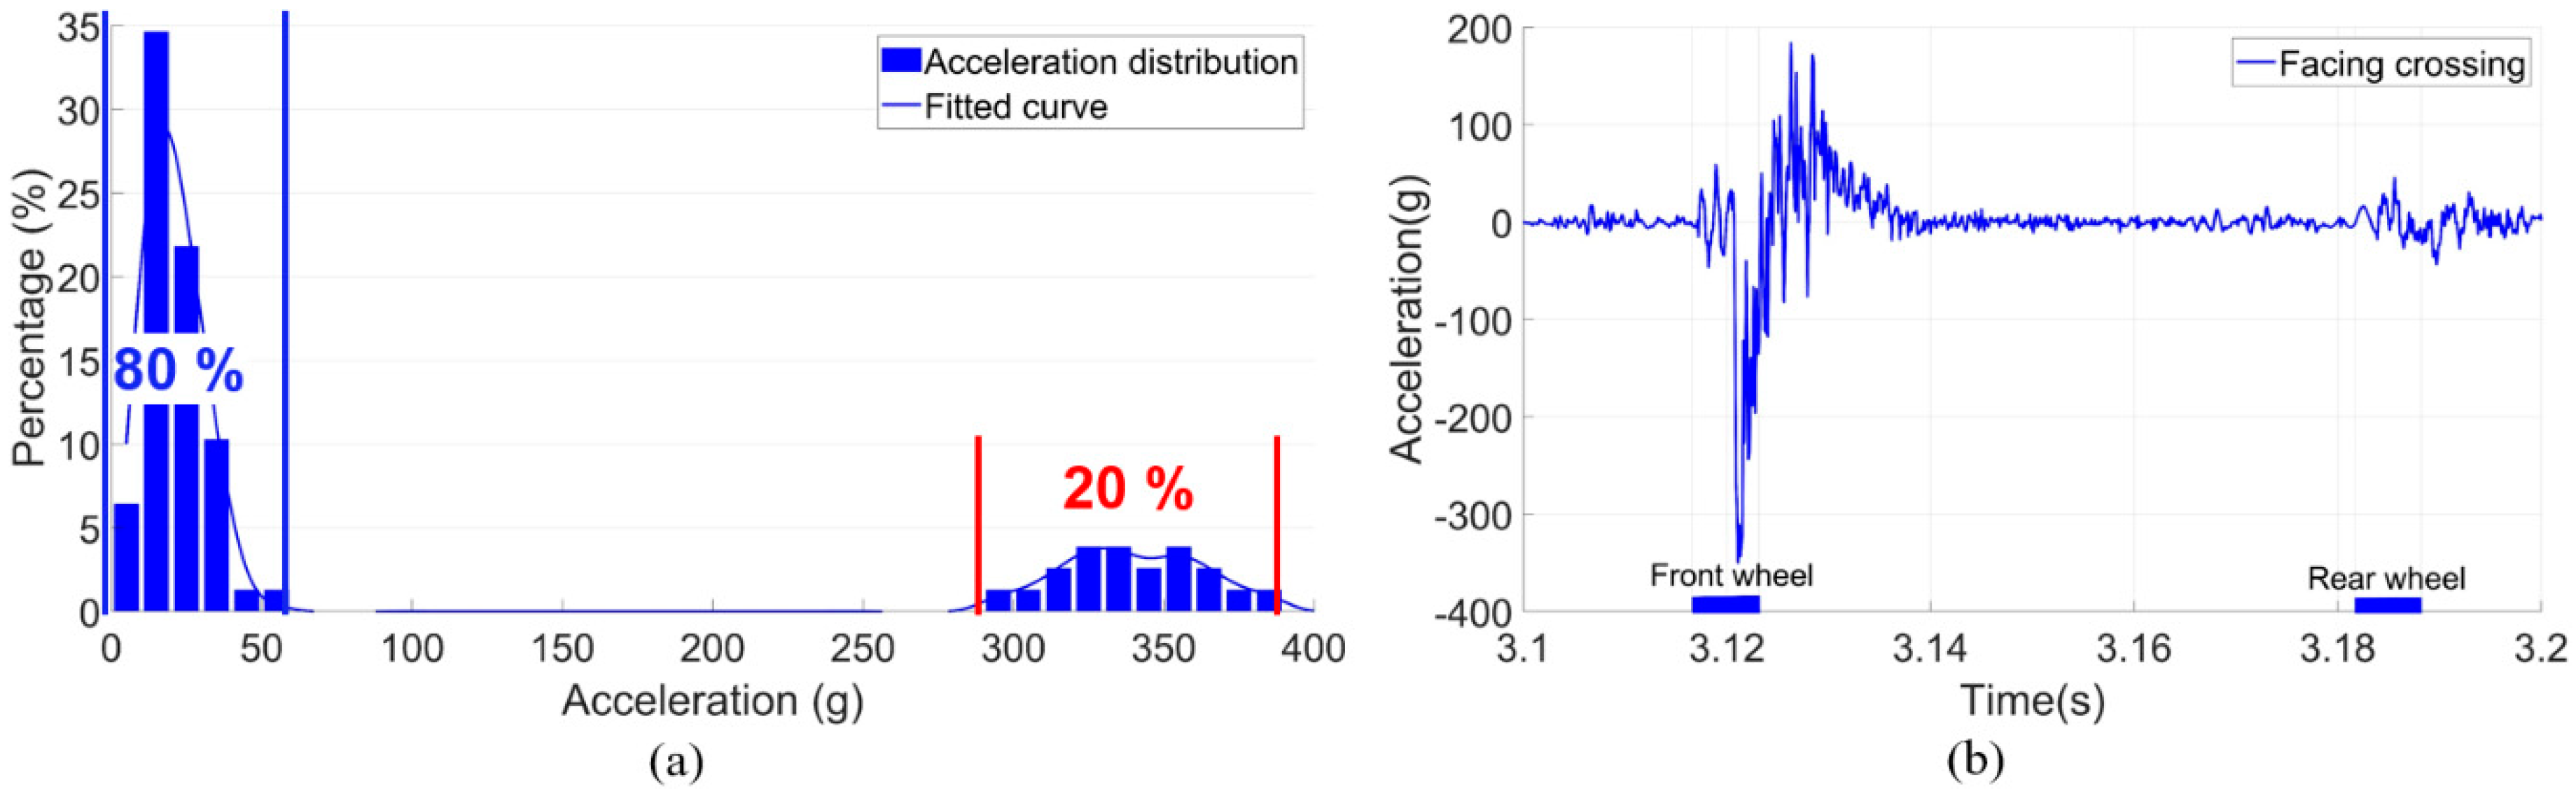
3.1. Wheel Impacts
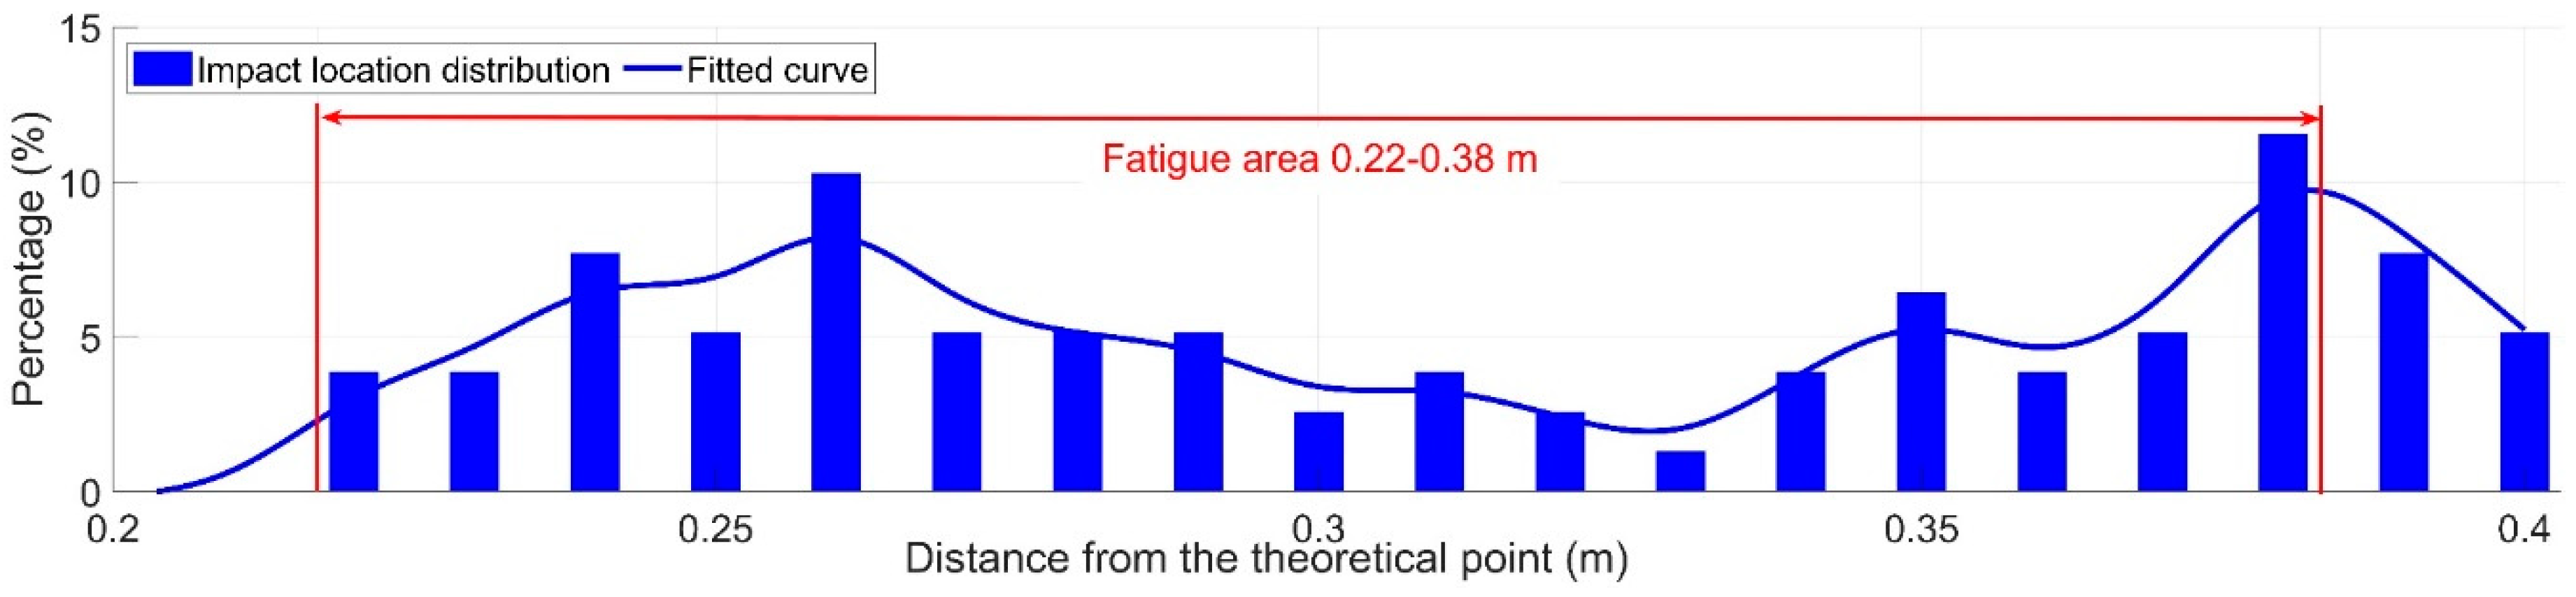
3.2. Fatigue Area
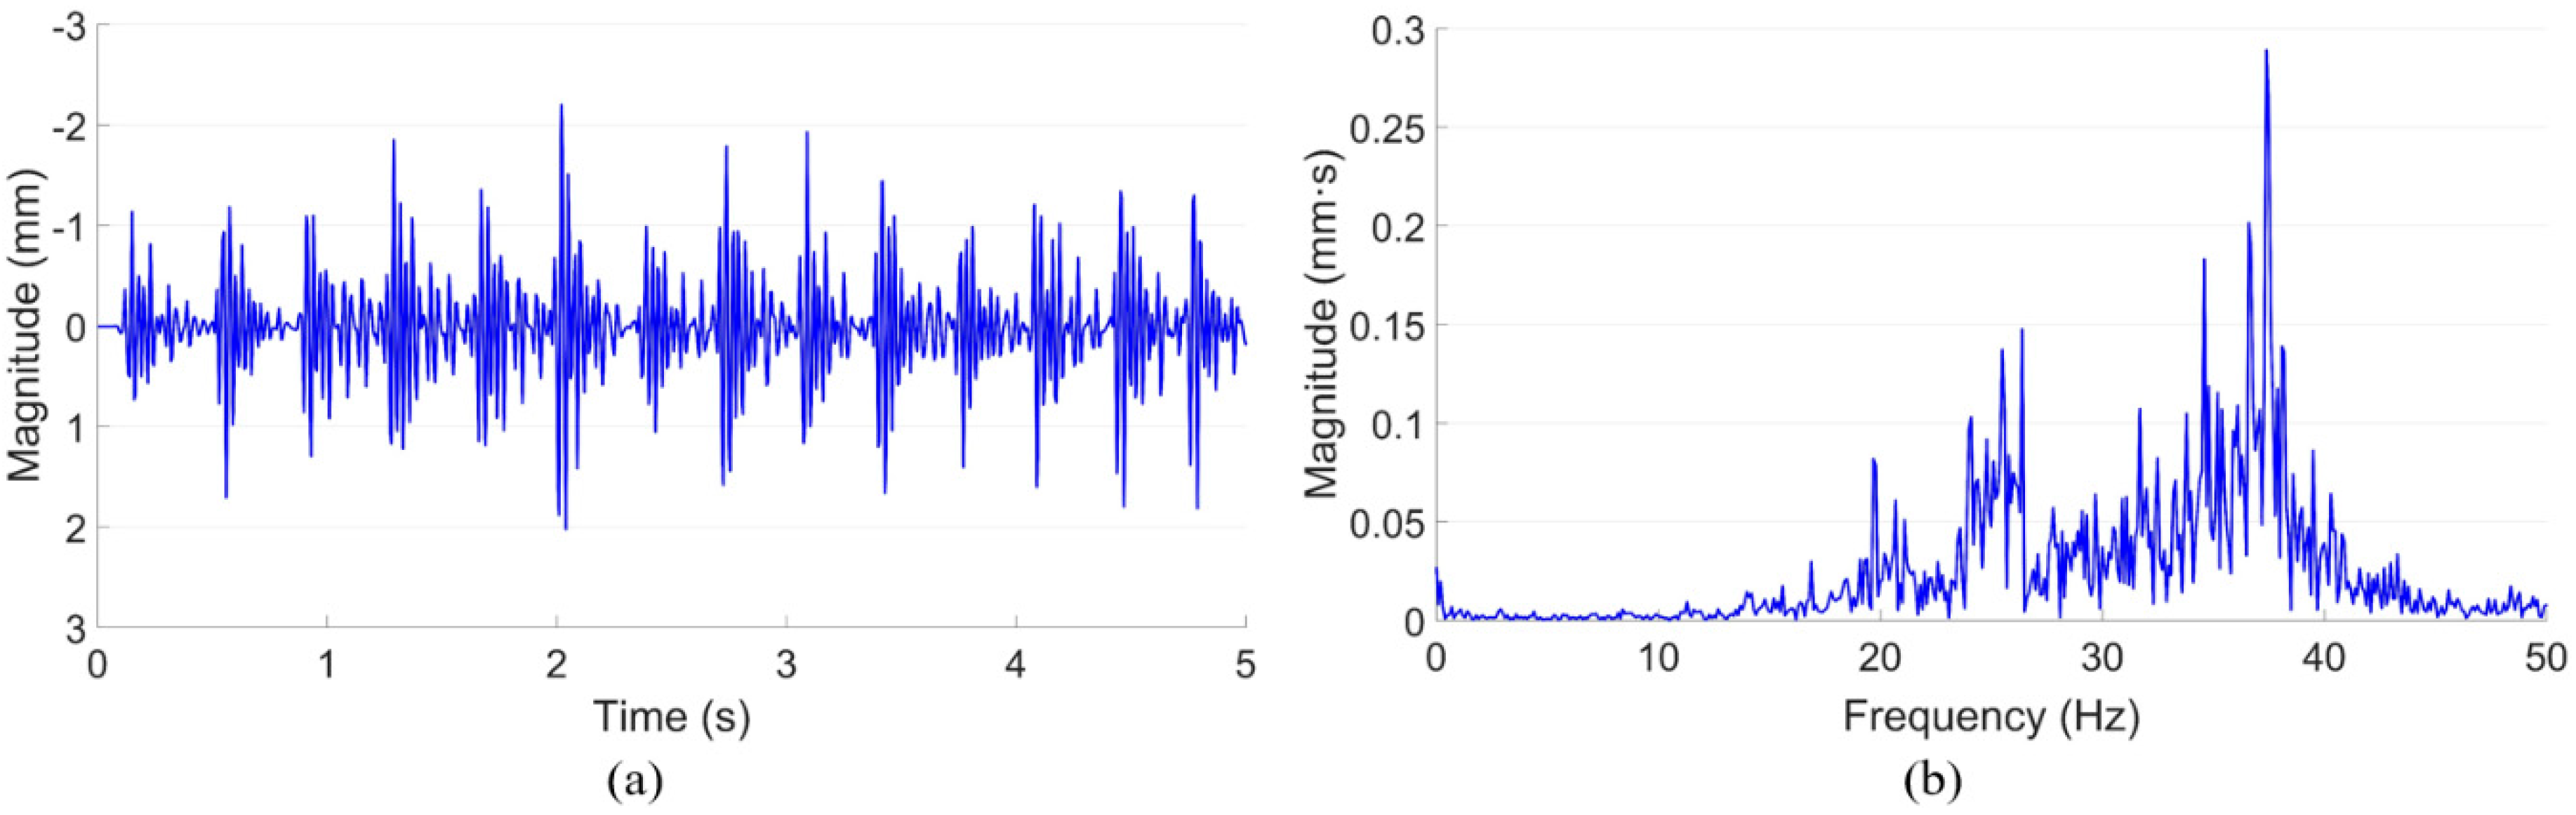
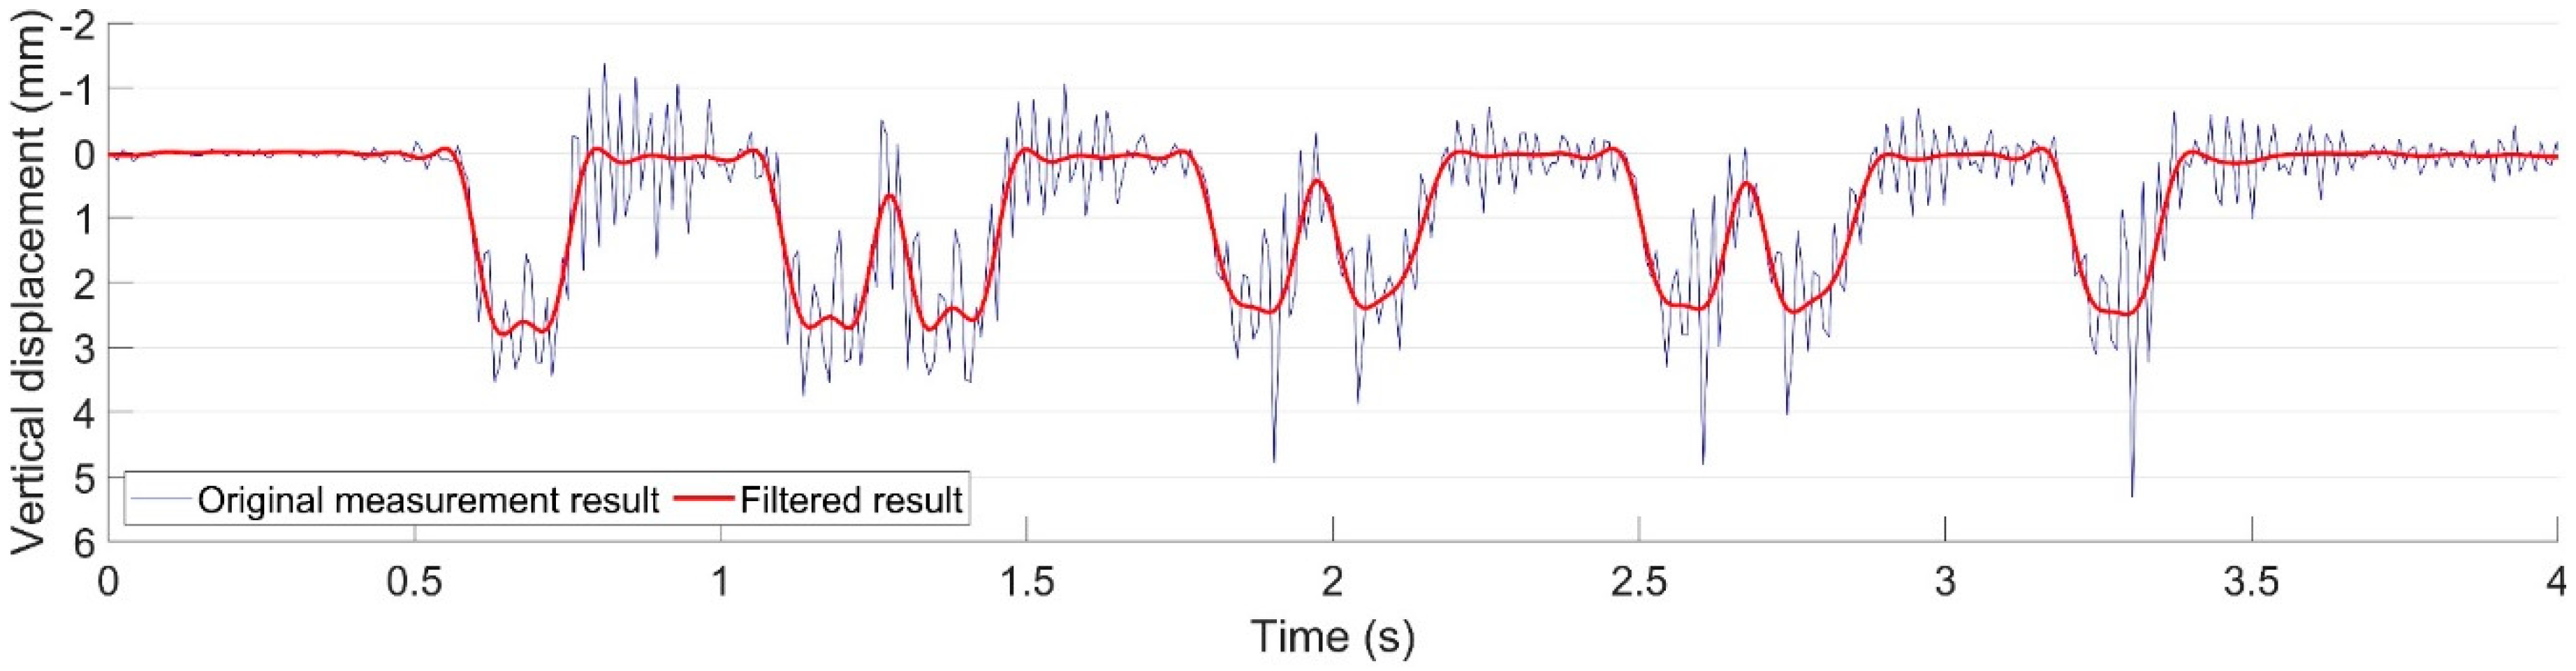
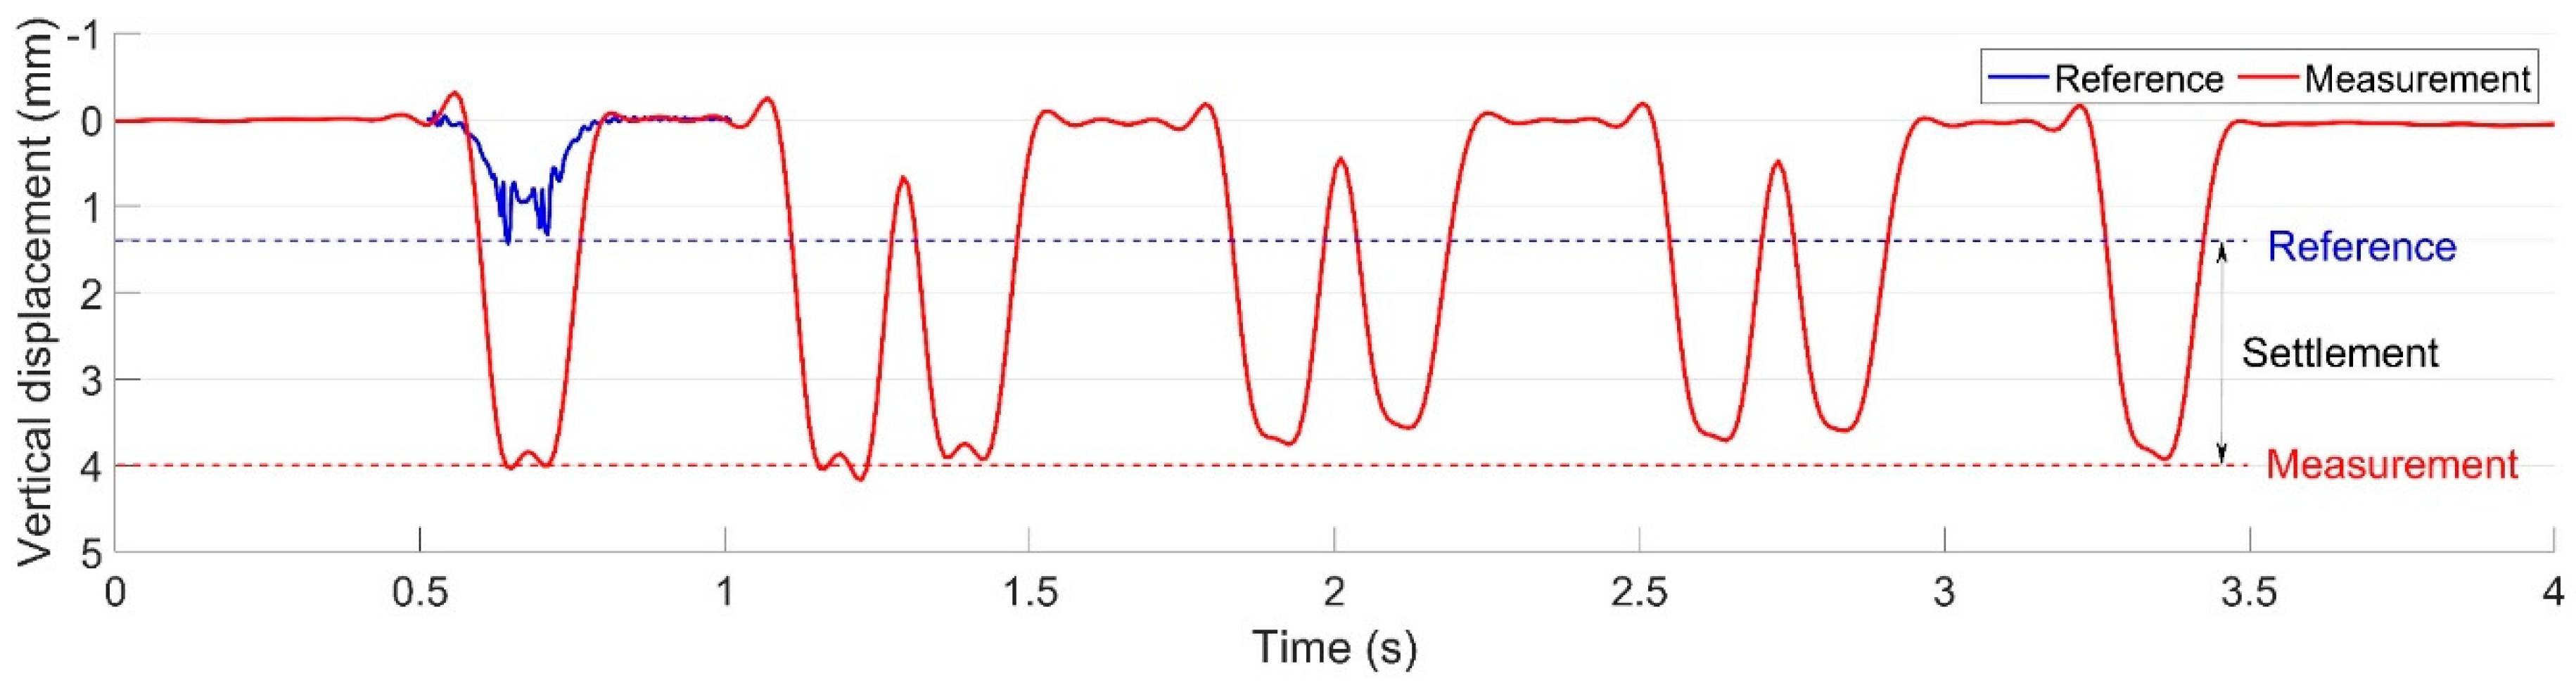
3.3. Ballast Settlement
4. Effectiveness Analysis of the Maintenance Actions
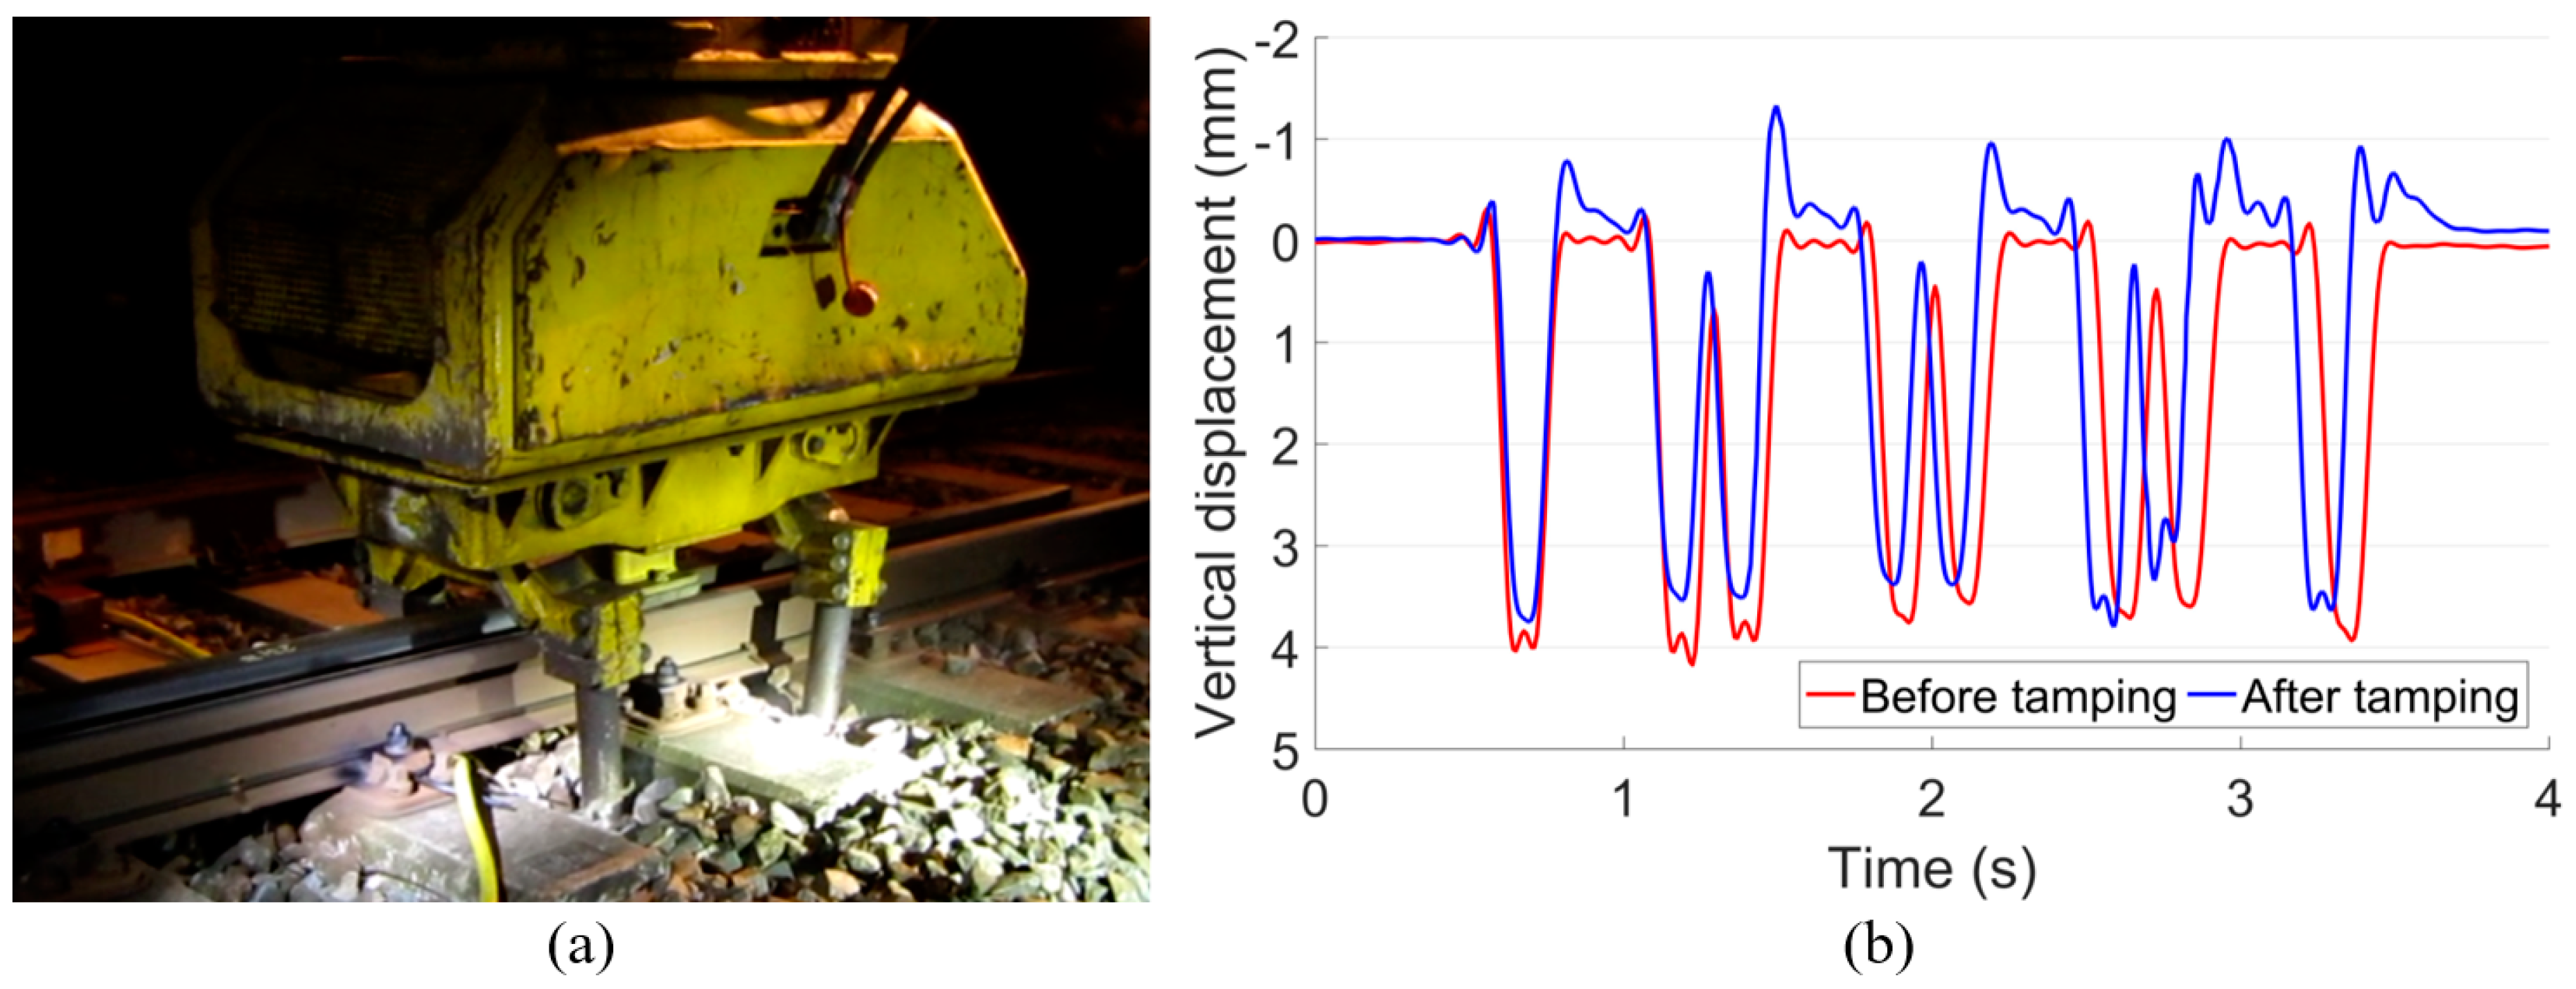
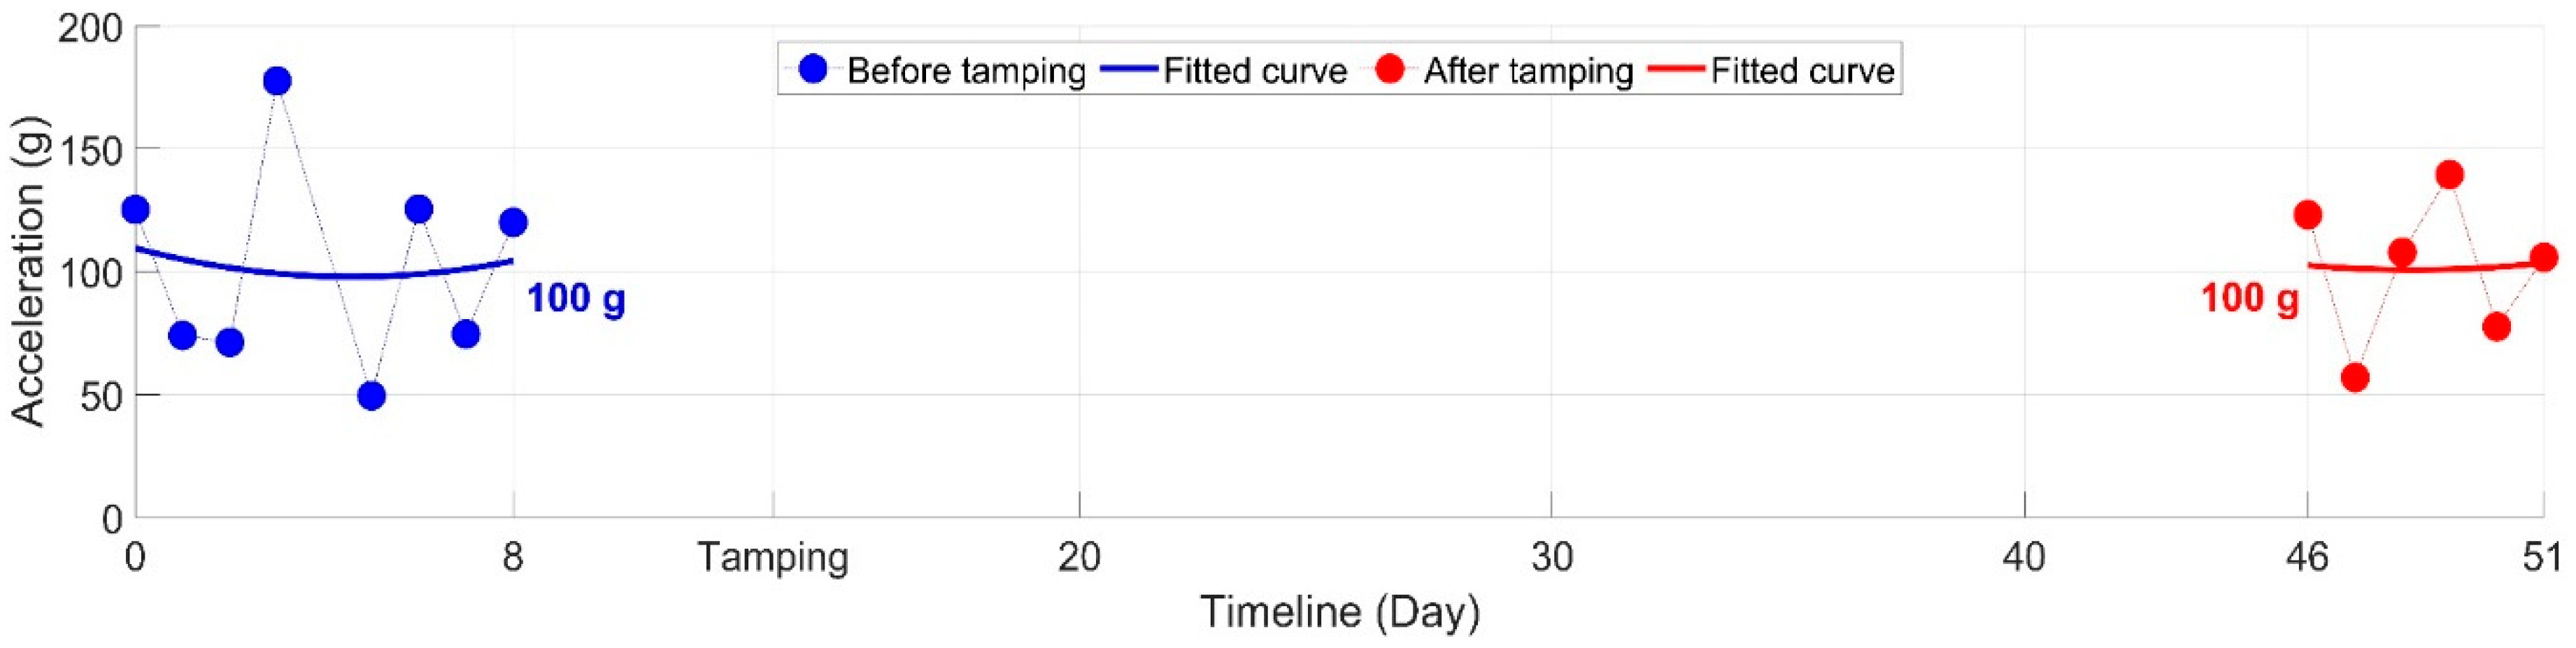
4.1. Ballast Tamping
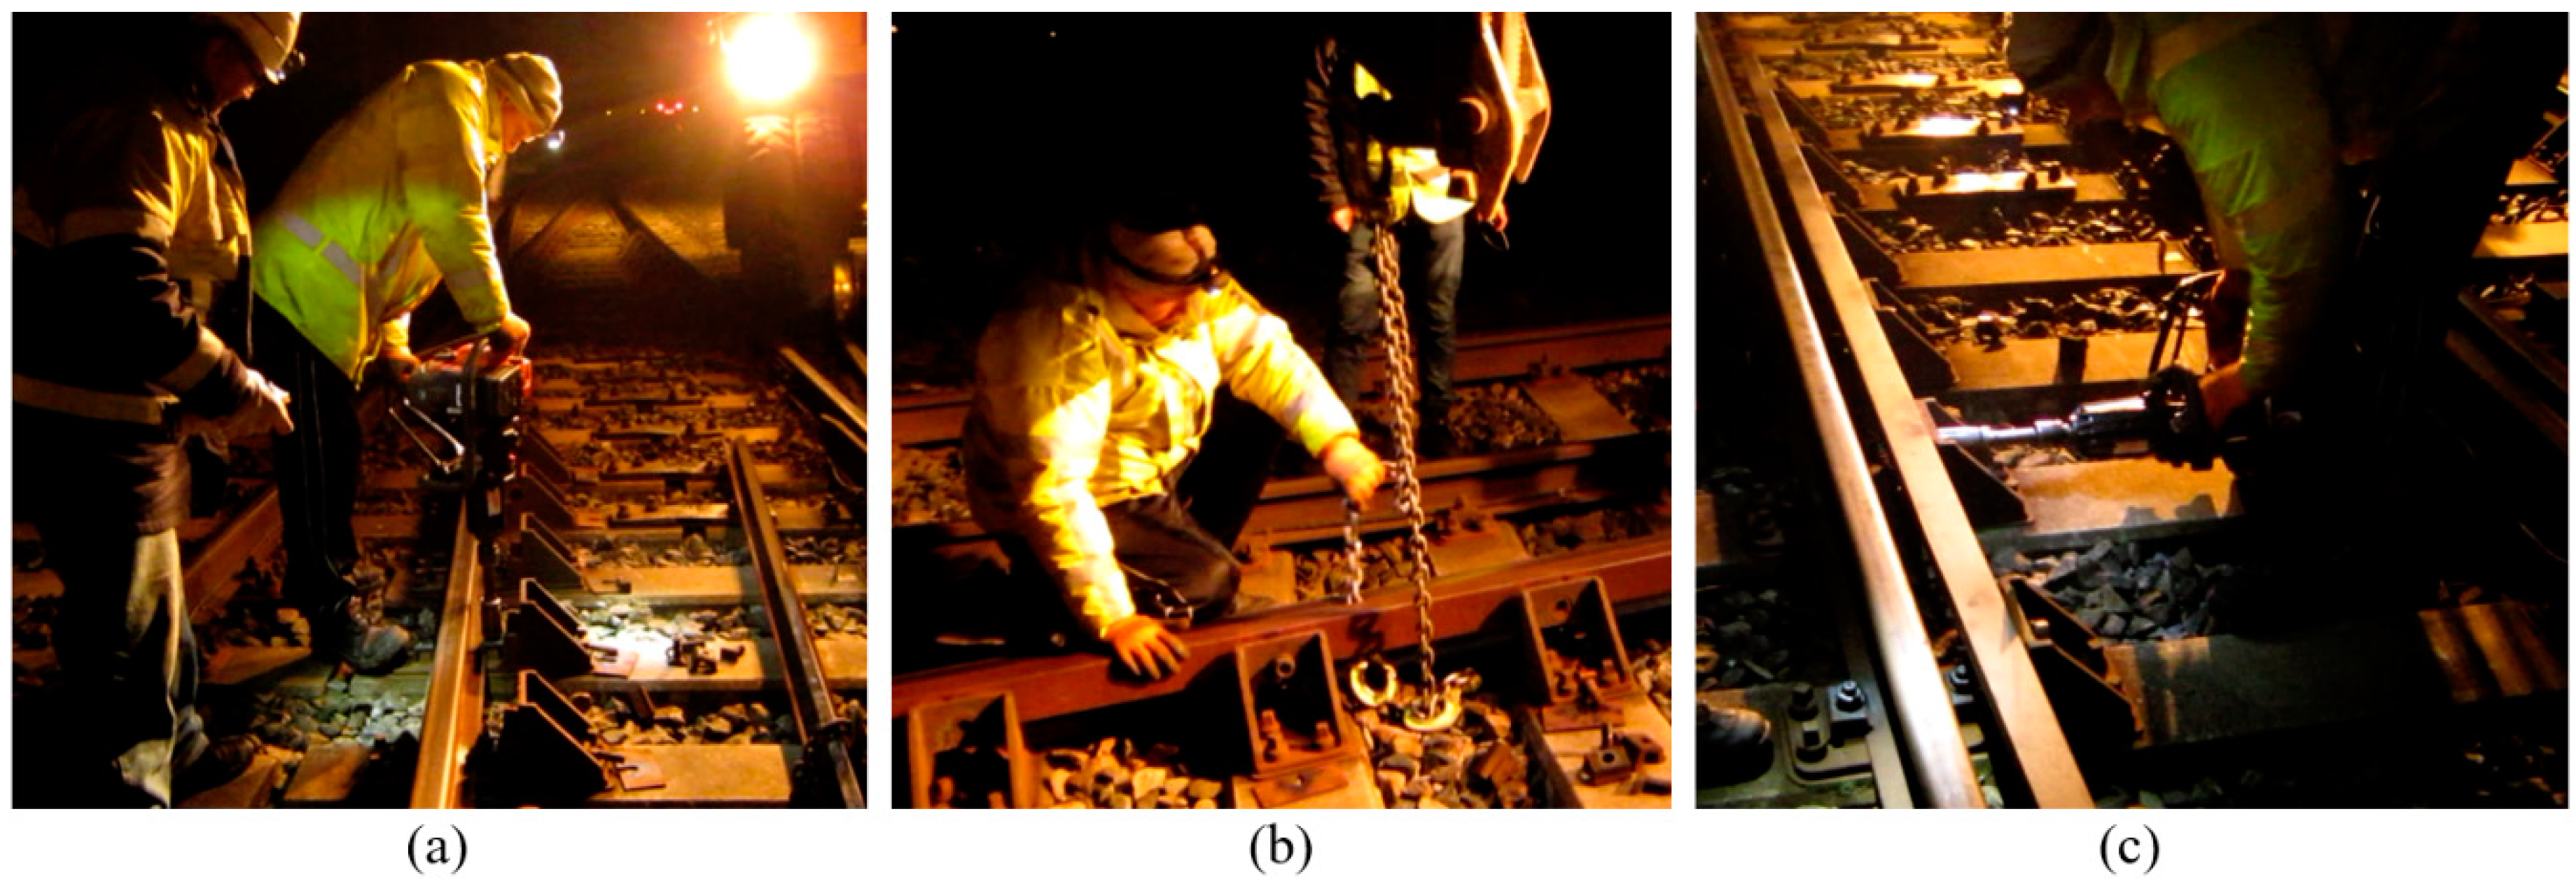
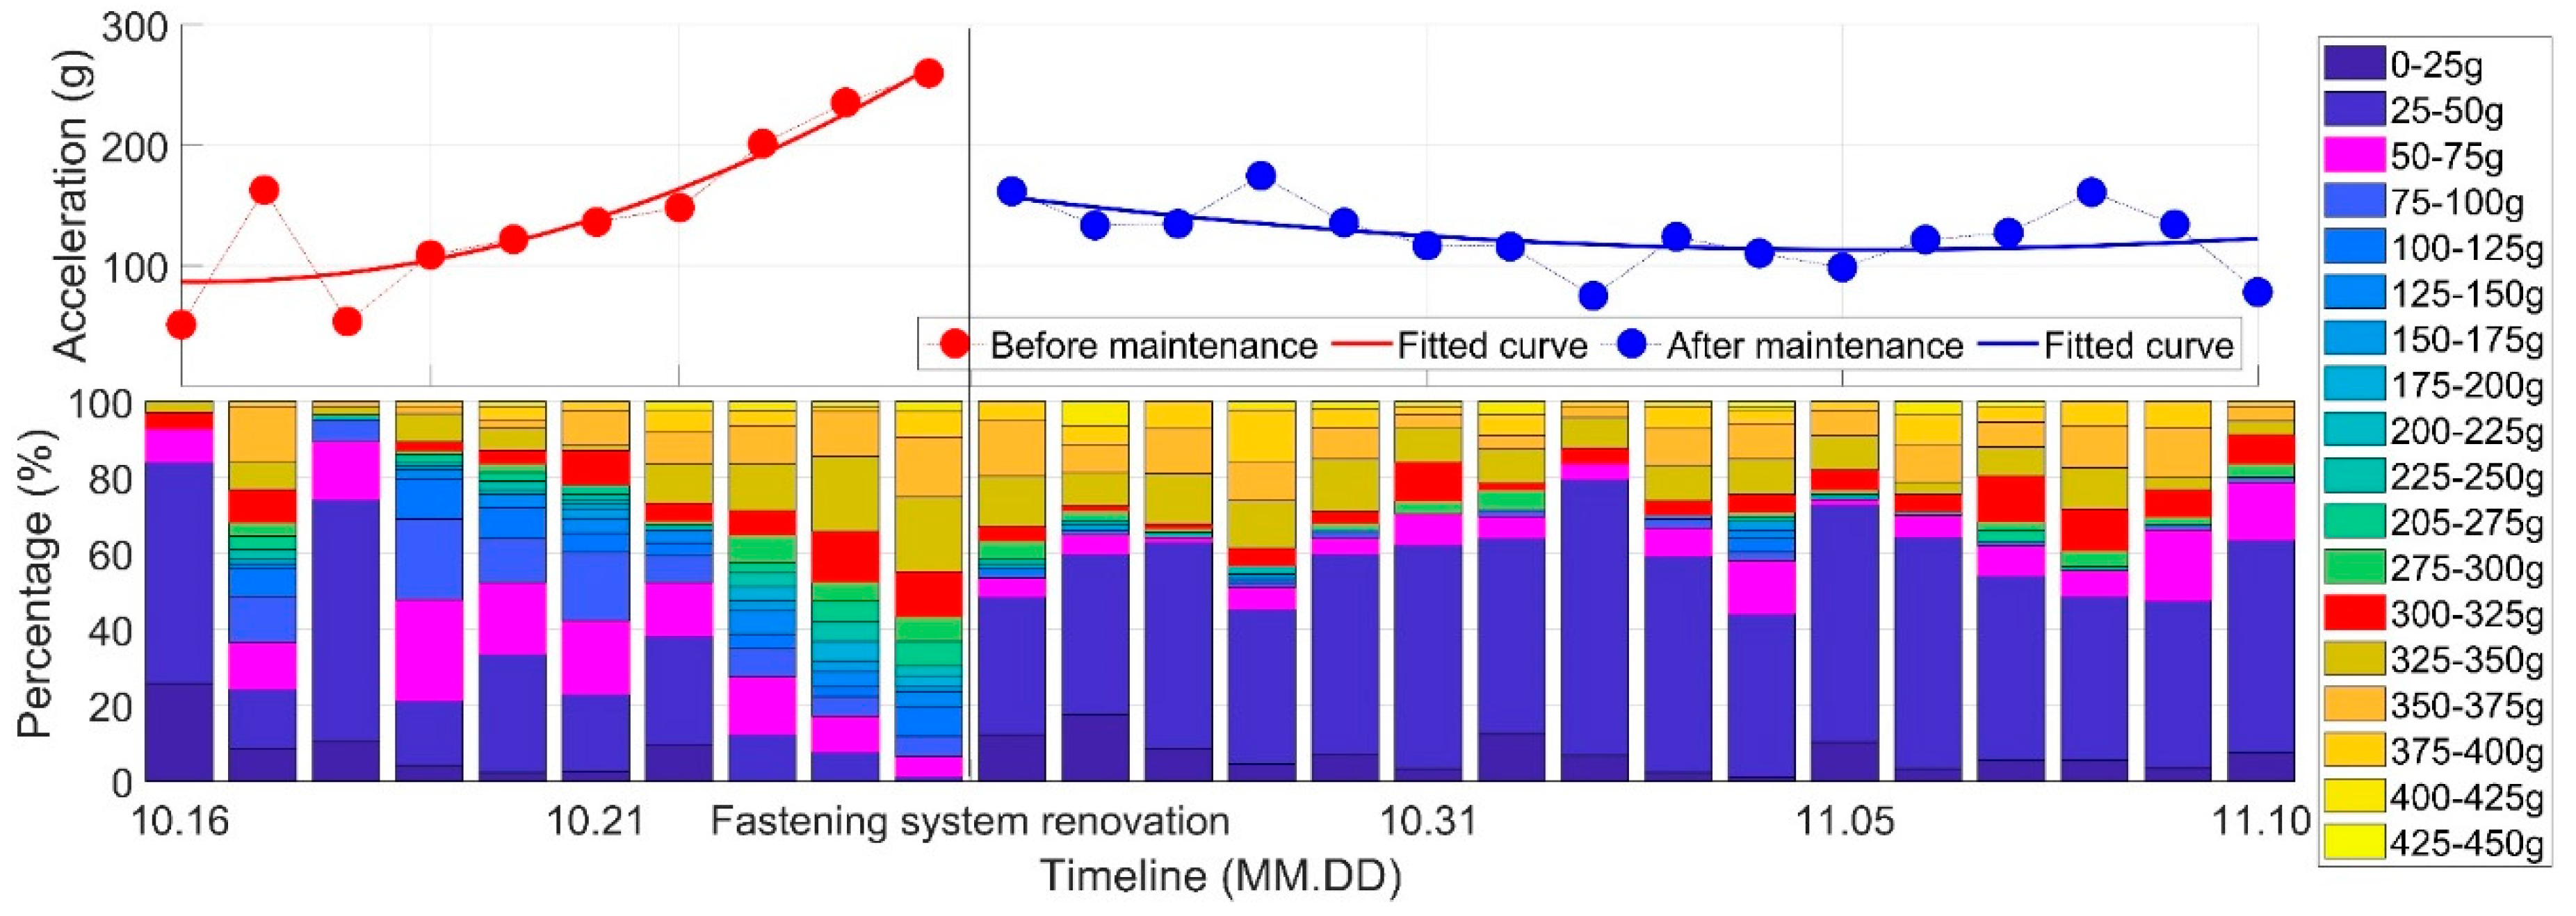
4.2. Fastening System Renovation
5. Damage Sources Investigation
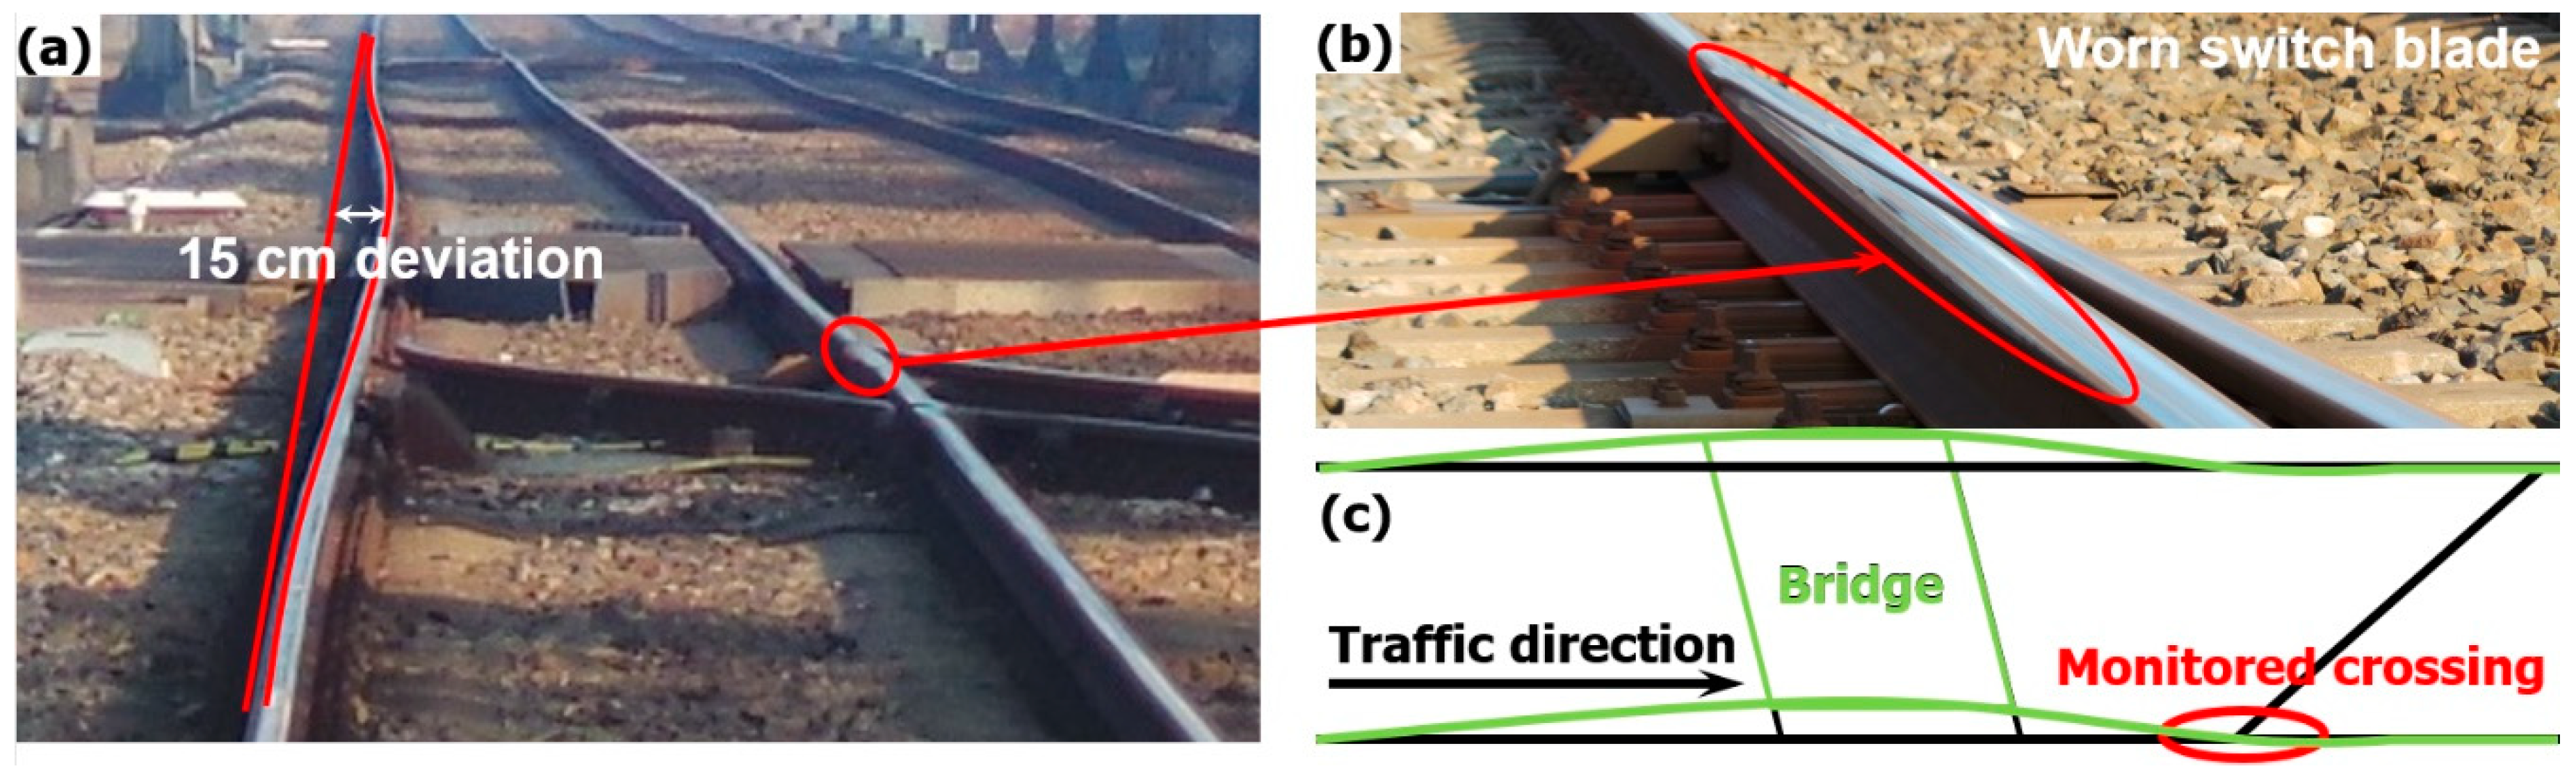
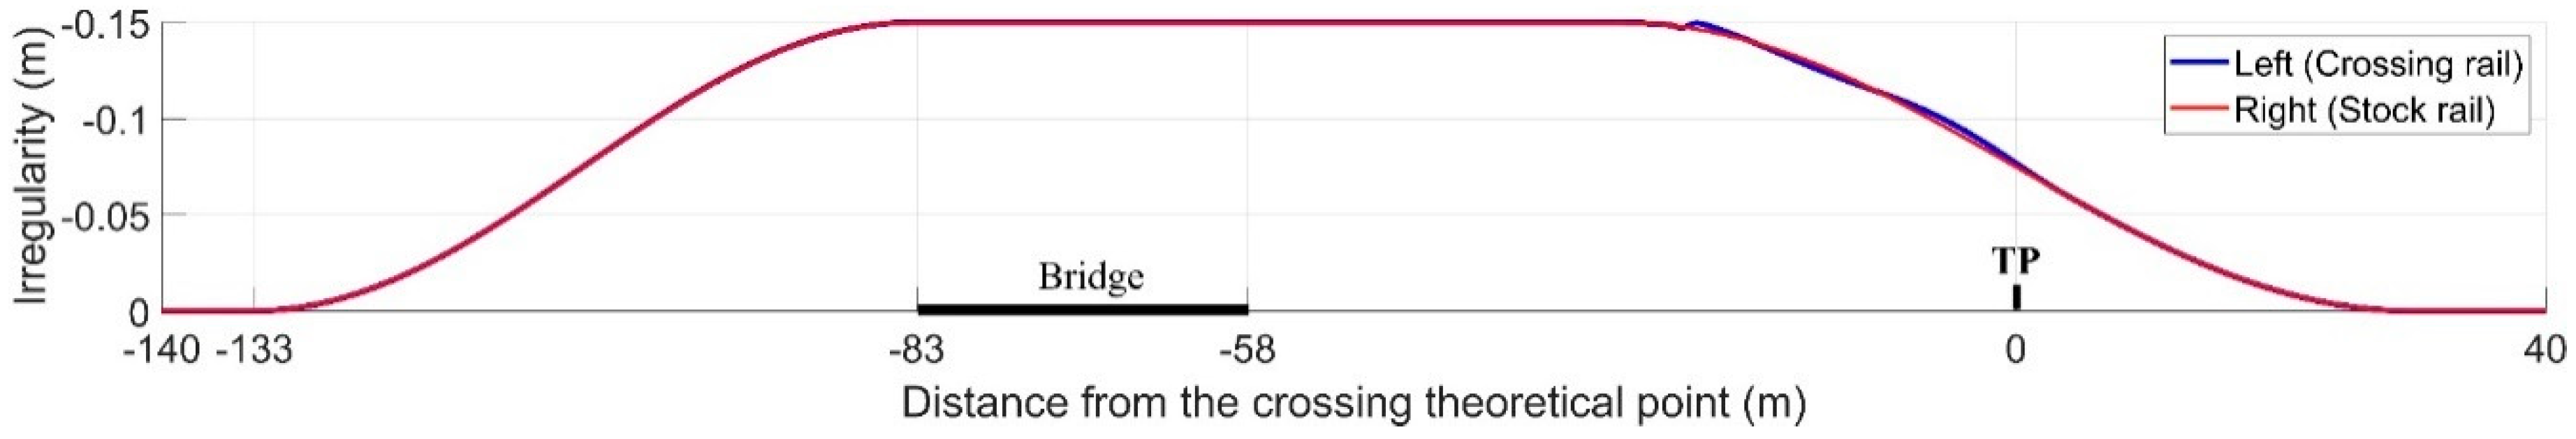
5.1. Track Inspection
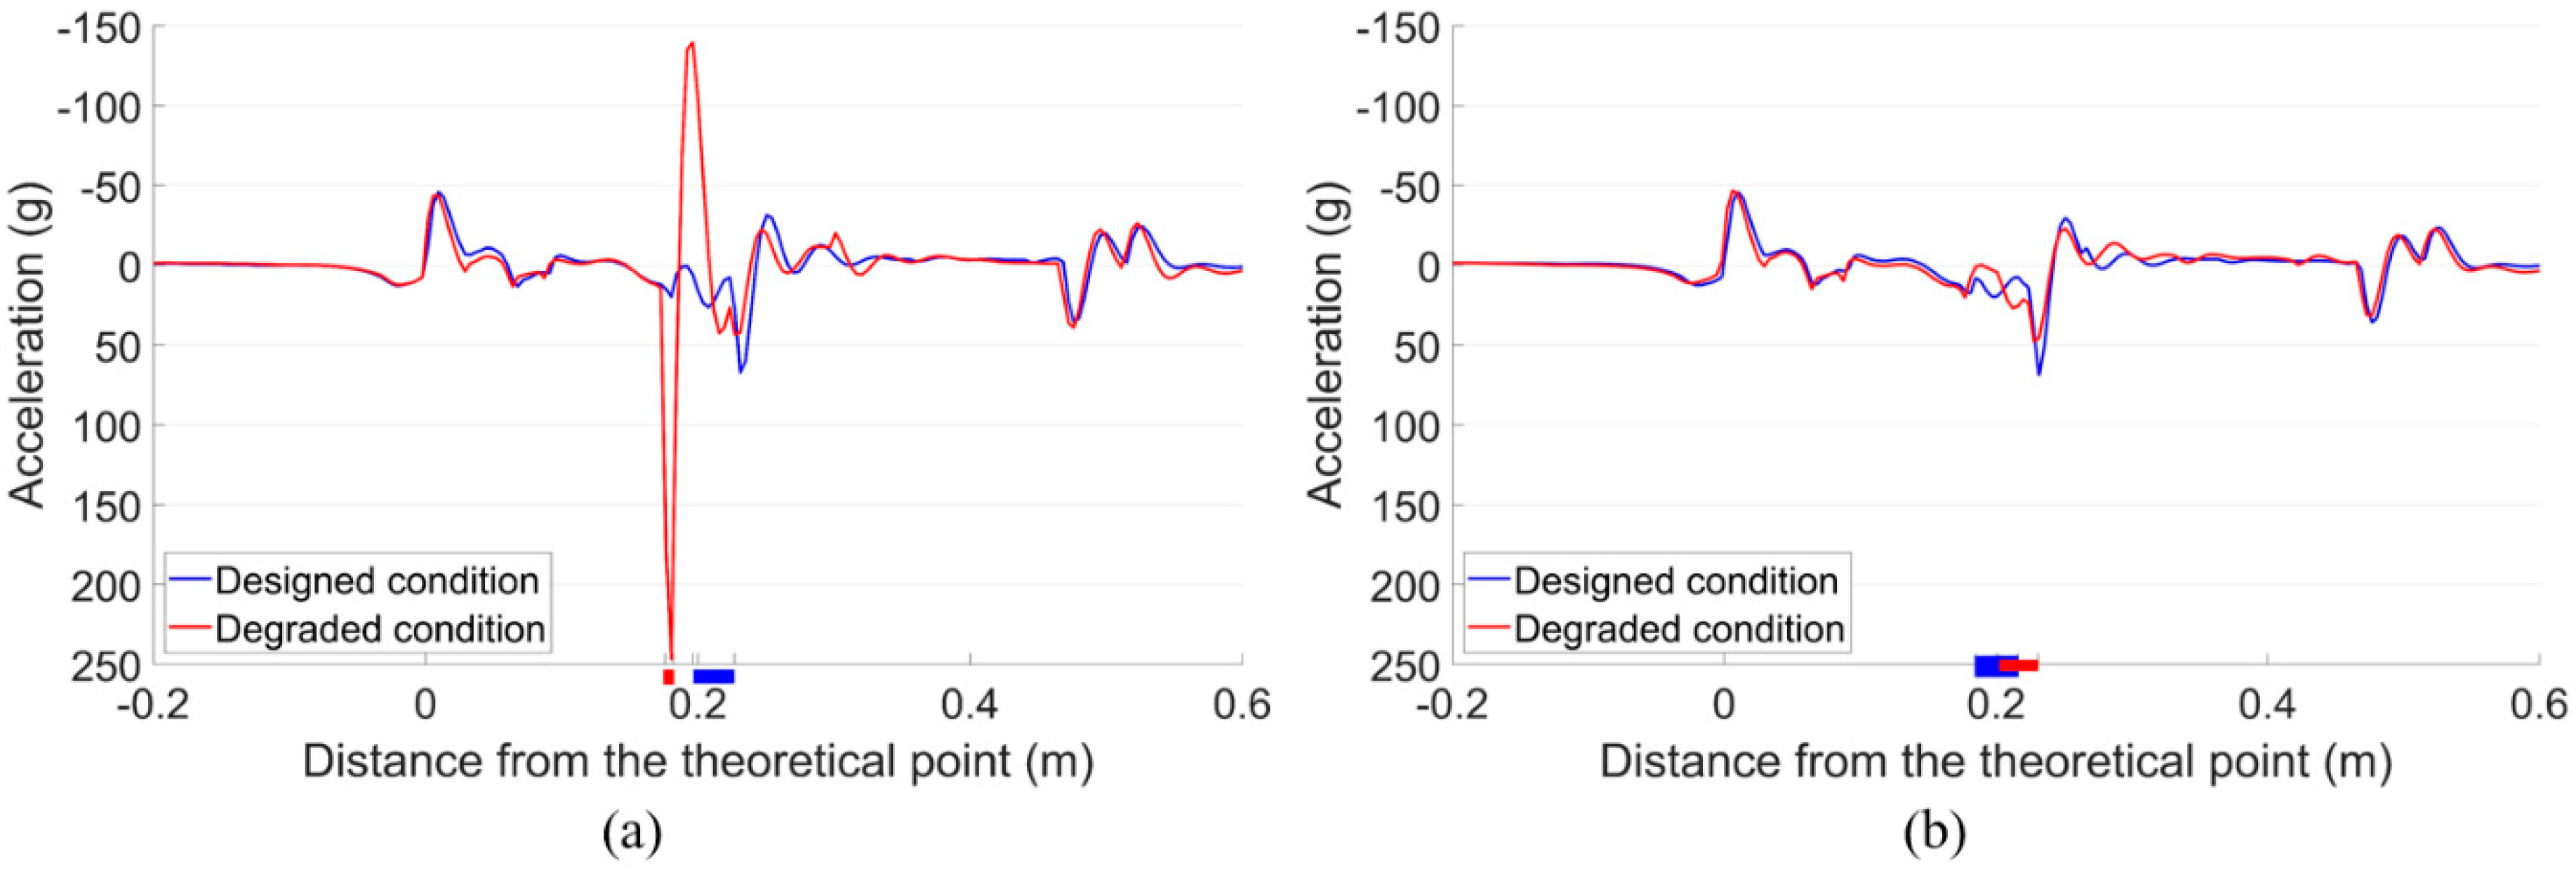
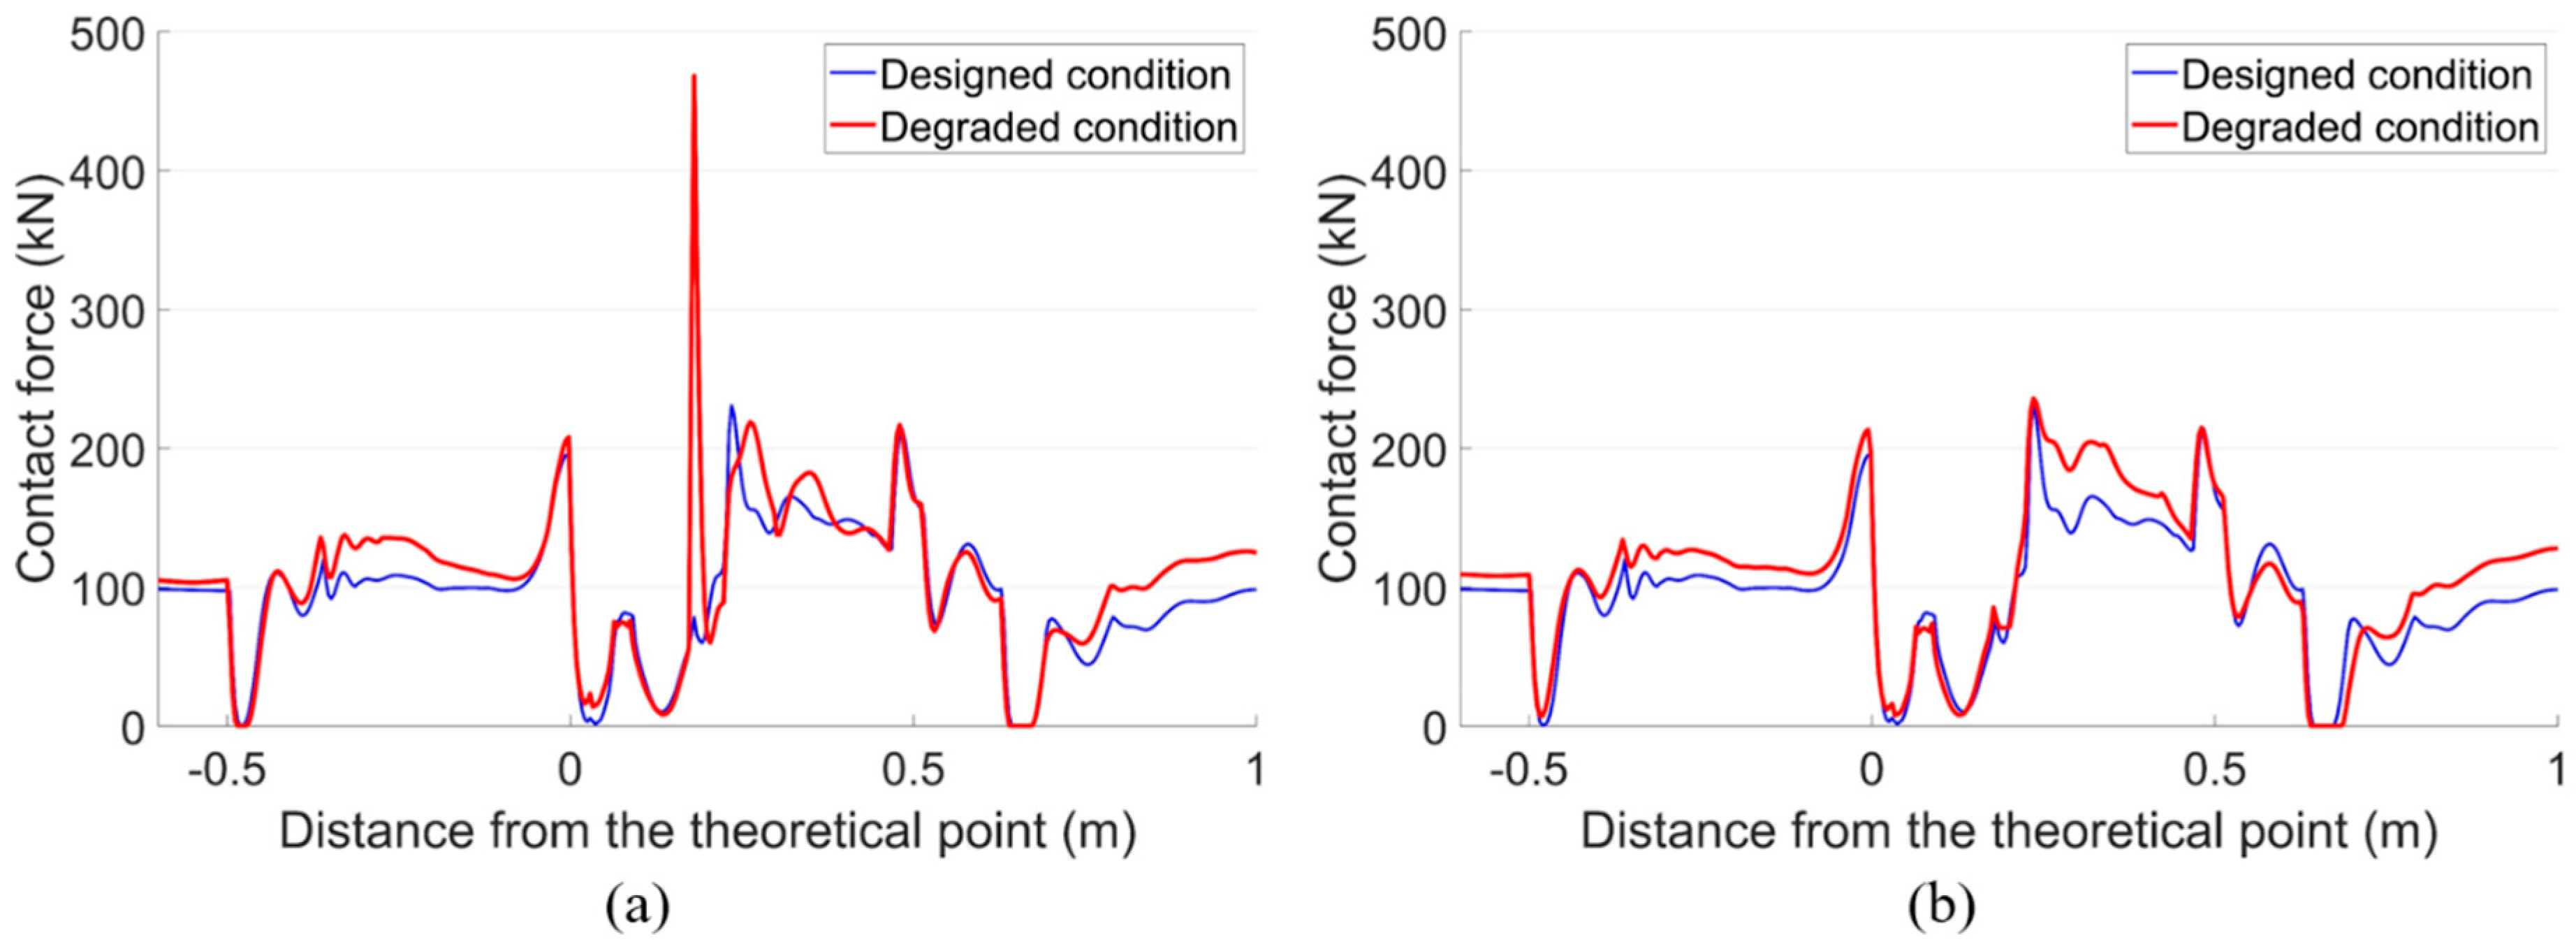
5.2. Numerical Verification and Analysis
5.3. Respective Effect of Lateral Curve or Track Gauge Deviation
5.4. Summary
6. Effect of Maintenance-Related Degradation
6.1. Effect of Ballast Settlement
6.2. Influence of Reduced Lateral Support
7. Conclusions
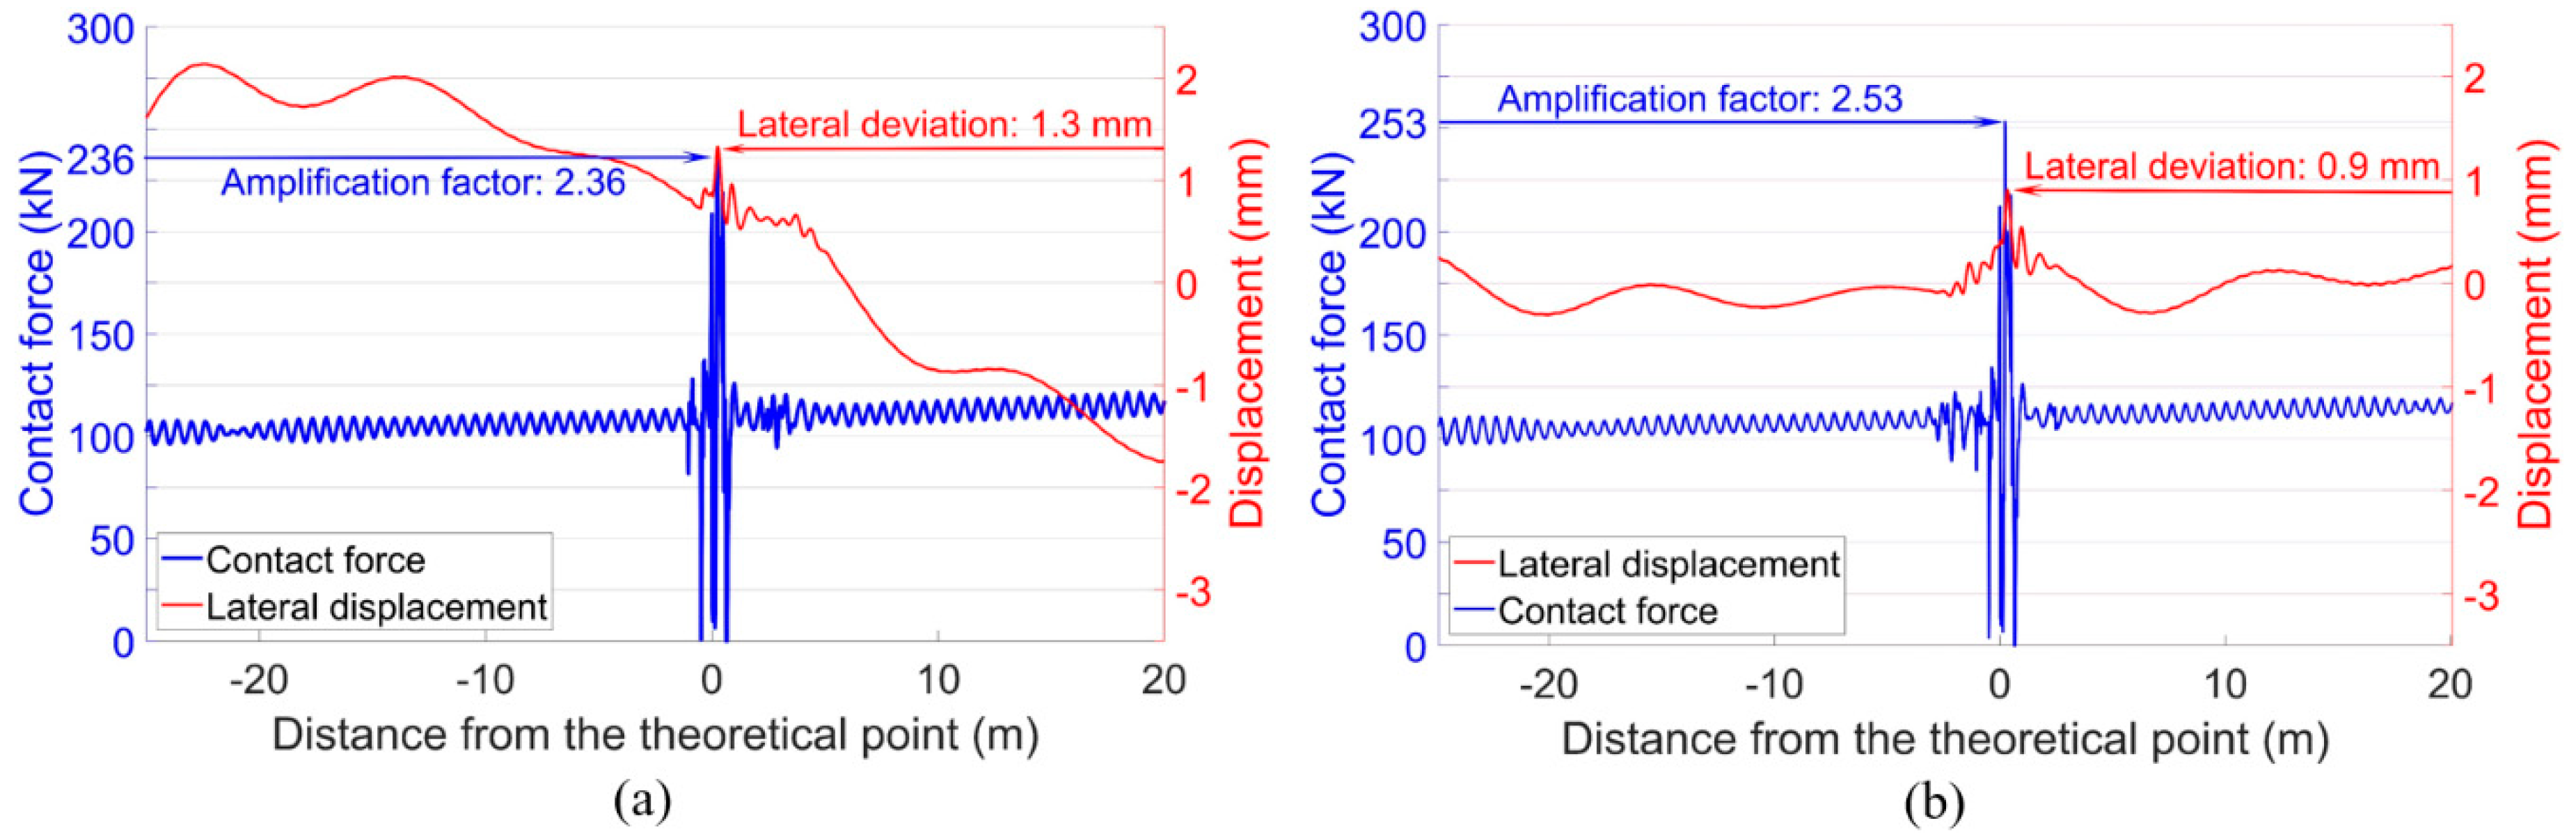
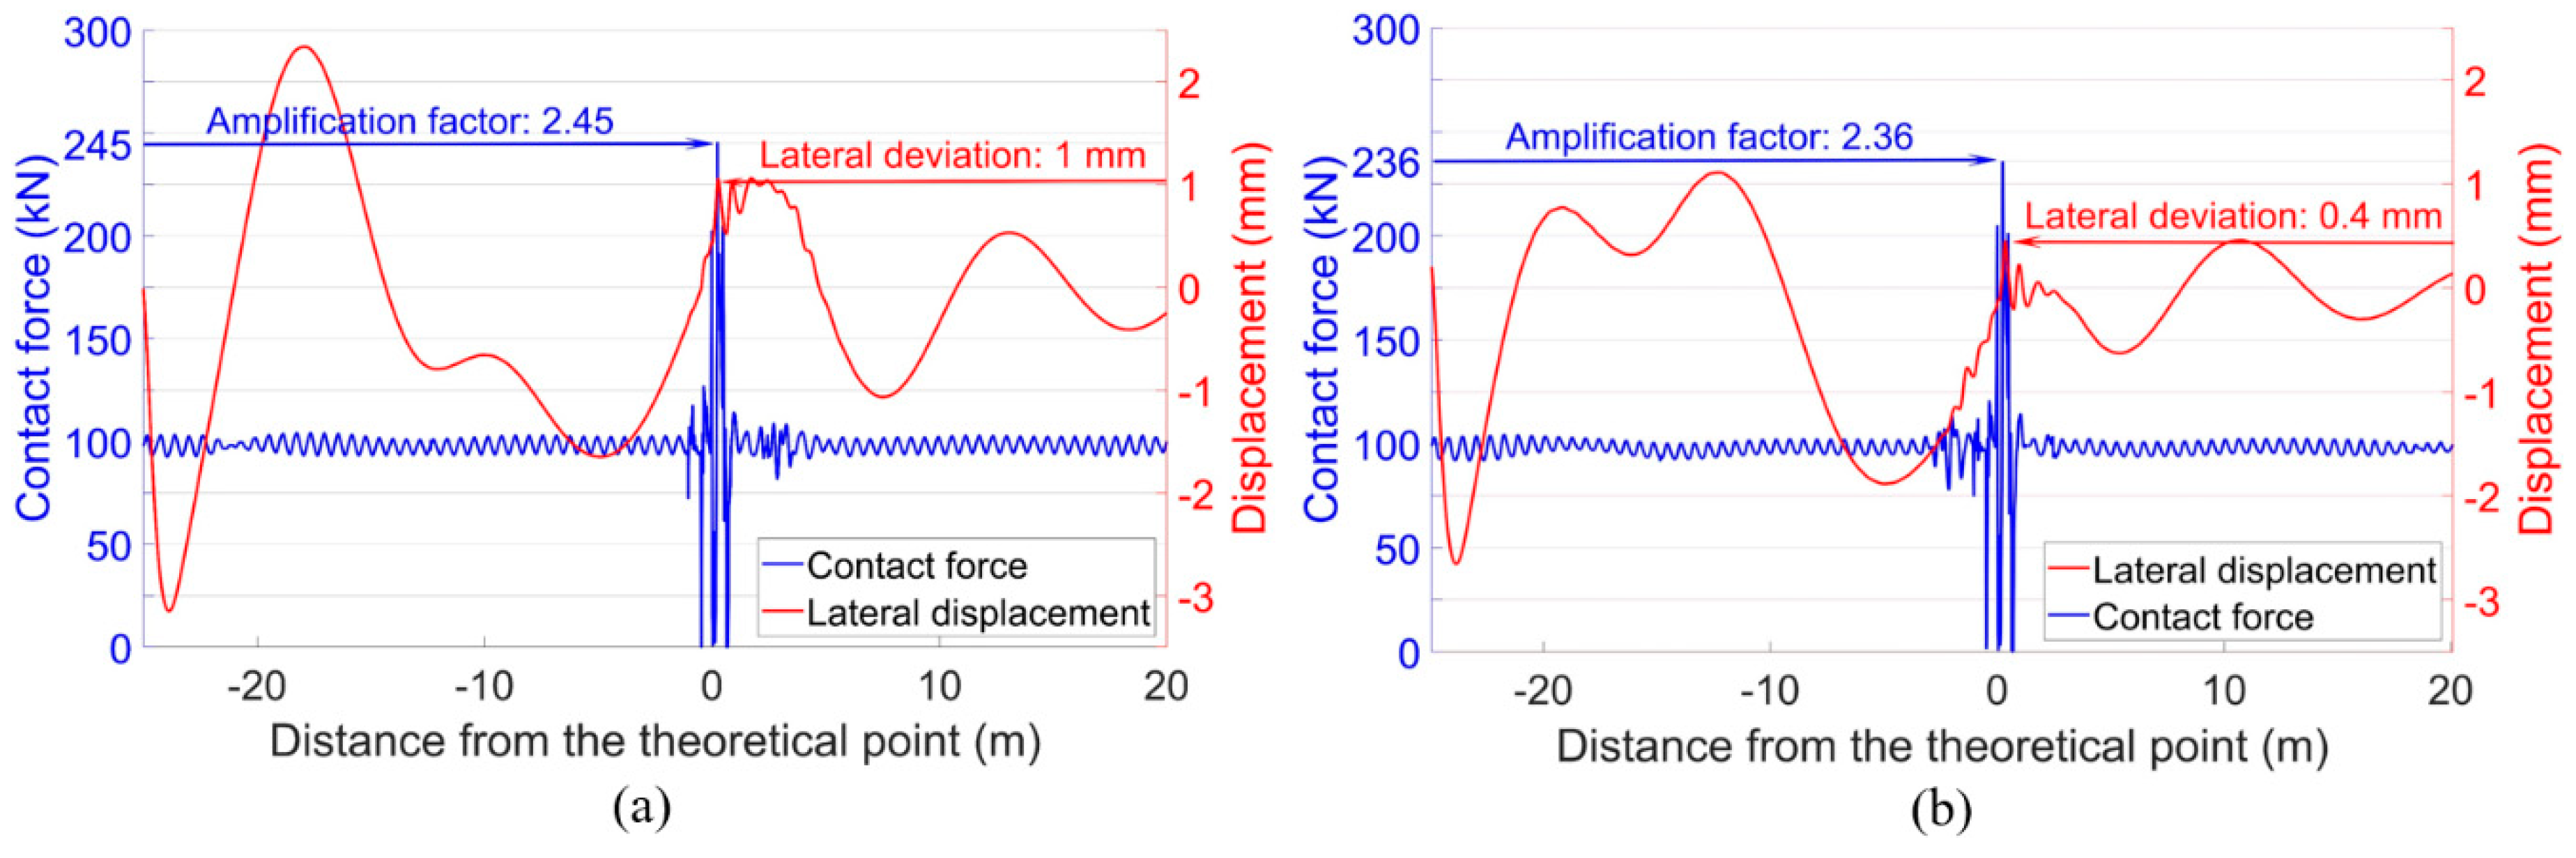
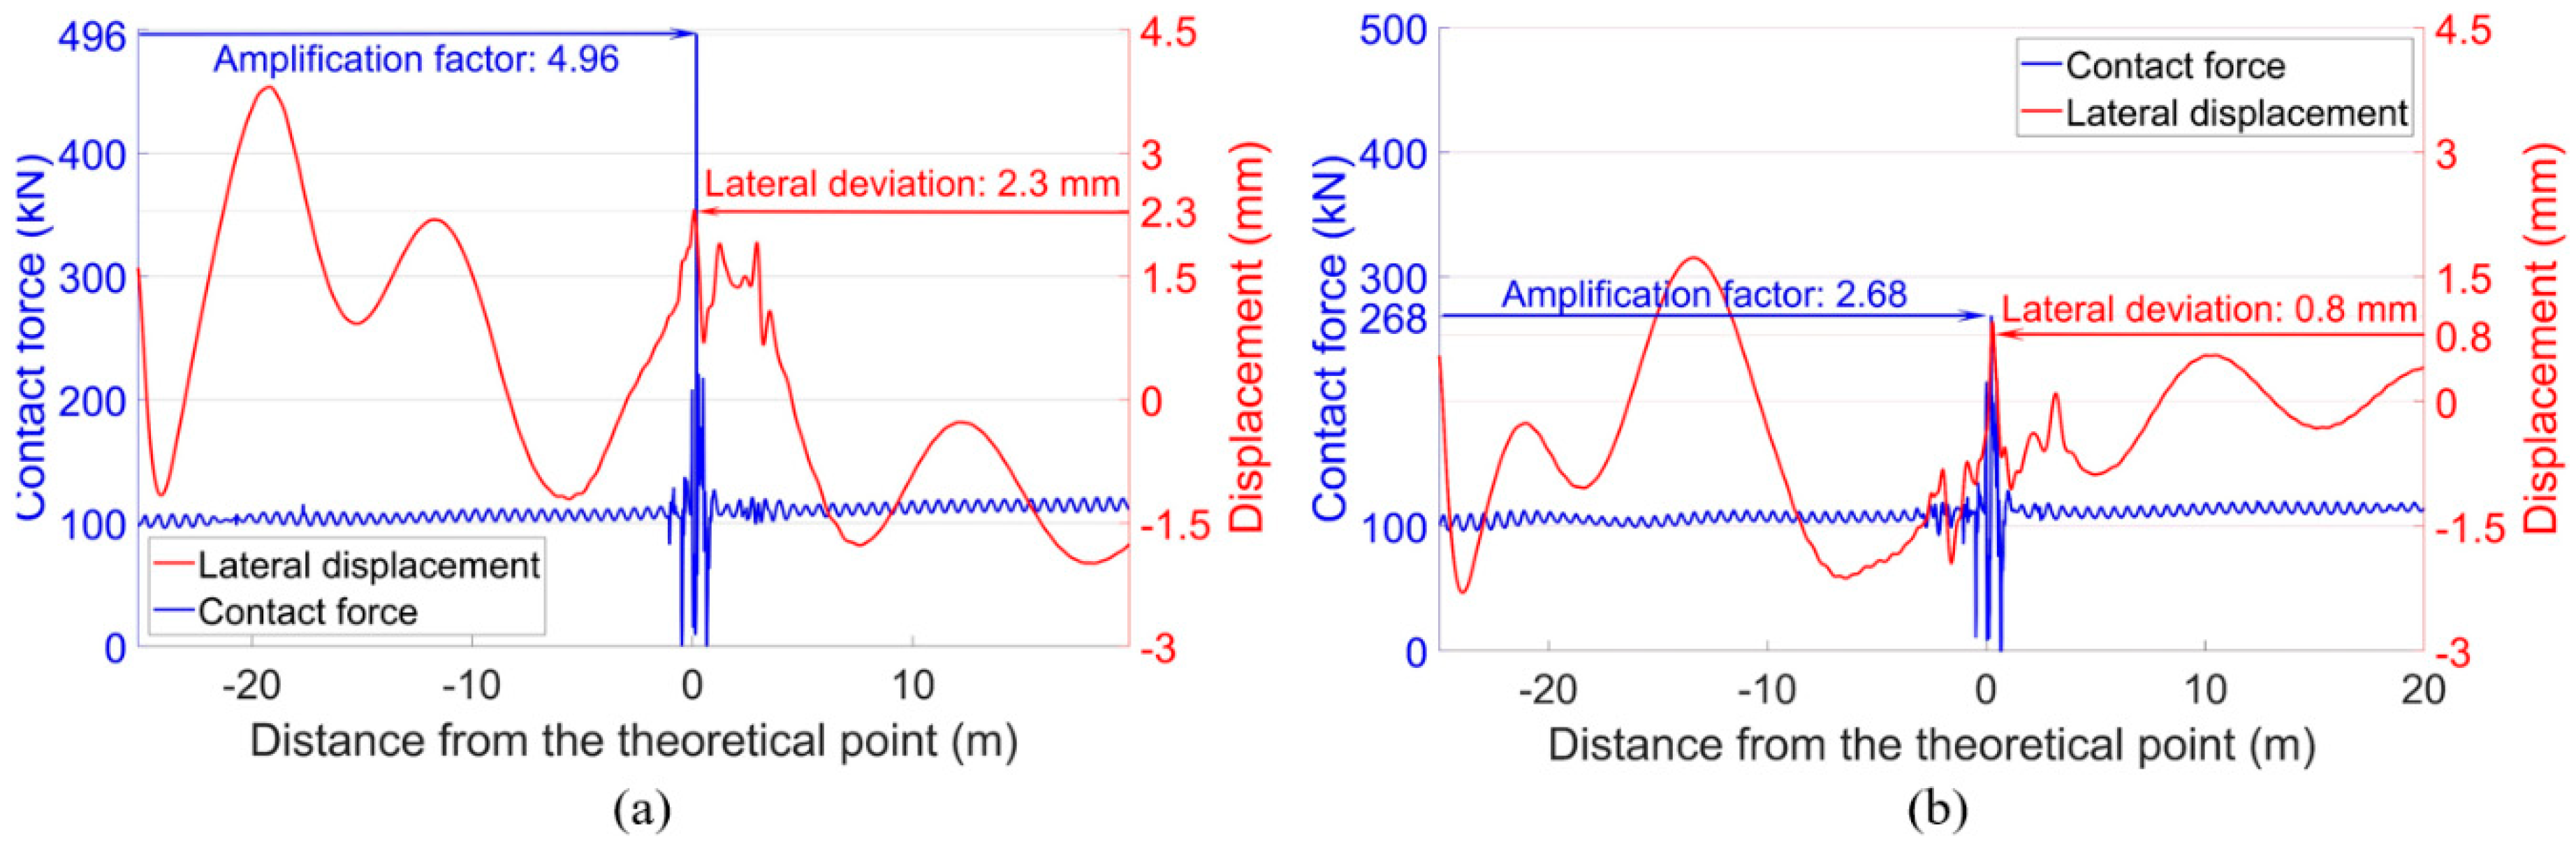
- The fast crossing degradation was directly caused by the extremely high wheel-rail impacts, and the root cause for such high impacts was the hunting of the passing trains that were activated by the track lateral misalignment in front of the crossing. When the lateral deviation of the passing wheel exceeds a certain extent (e.g., 2.3 mm), the wheel-rail contact situation will change and the wheel impacts will be dramatically increased. To improve the current situation, such track misalignment needs to be eliminated;
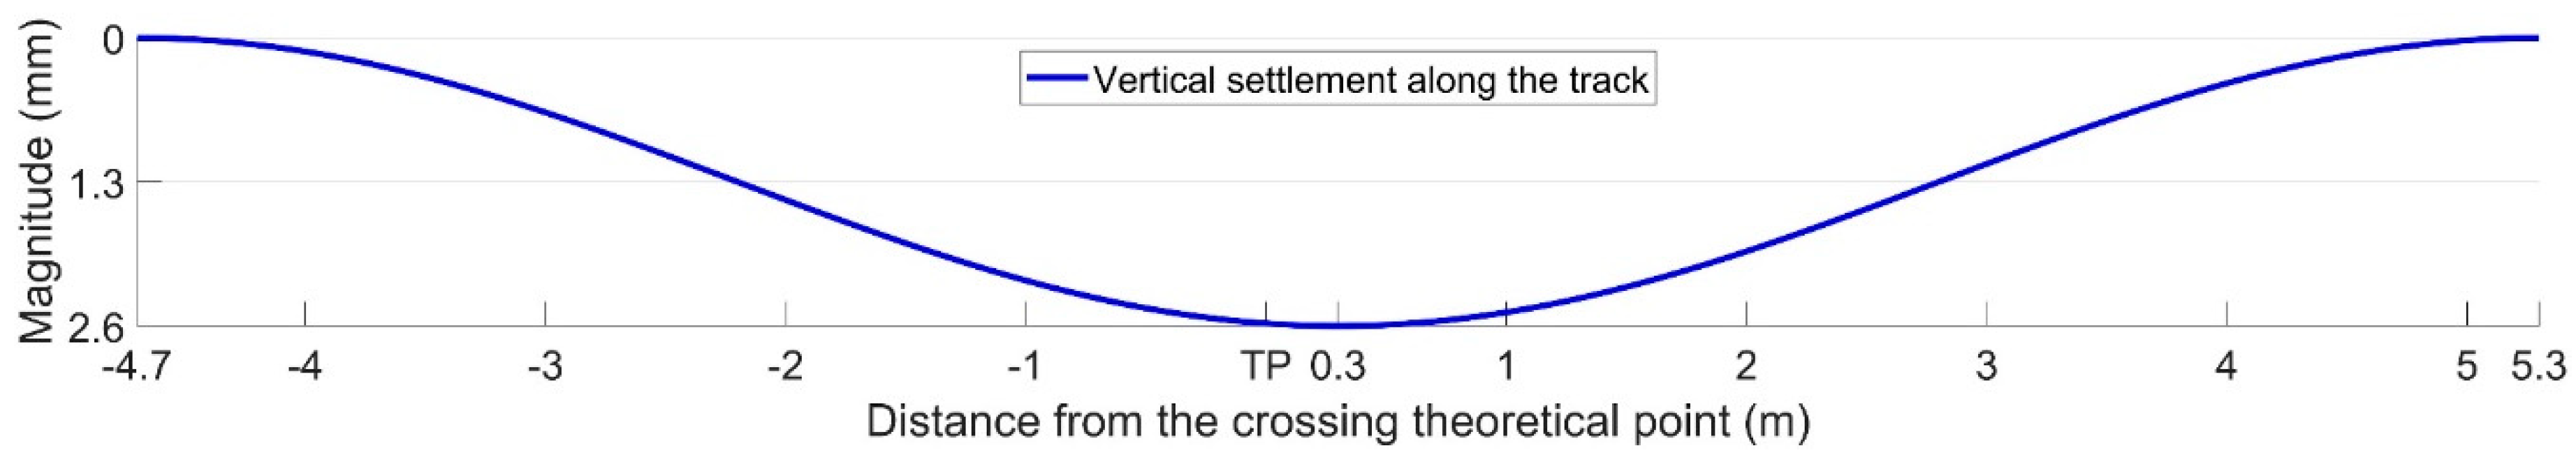
- Ballast settlement is likely to be the accumulated effect of the high wheel-rail impacts. The influence on the crossing performance is somewhat limited. Ballast tamping, especially with only the squeezing machine, cannot improve the dynamic performance of the crossing. In the case of not knowing the sources of damage, it is better to take no action, rather than implement ballast tamping;
- Fastening system renovation helped improved the crossing performance by providing better lateral support in the track but was not targeted to the fundamental problem. Therefore, such damage repair action is useful, but not enough for an improvement in the crossing performance.
Author Contributions
Funding
Acknowledgments
Conflicts of Interest
References
- ProRail, Ontwerpvoorschrift (Baan en Bovenbouw) Deel 6.1: Wissels en Kruisingen Alignement, Tussenafstanden, Overgangsvrije Zones en Bedieningsapparatuur, V006; ProRail: Utrecht, The Netherlands, 2015; p. 12.
- Shevtsov, I. Rolling Contact Fatigue Problems at Railway Turnouts. Available online: http://www.sim-flanders.be/sites/default/files/events/Meeting_Materials_Nov2013/mm_13112013_ivan_shevtsov_prorail.pdf (accessed on 13 November 2013).
- Cornish, A.T. Life-Time Monitoring of in Service Switches and Crossings through Field Experimentation. Ph.D. Thesis, Imperial College London, London, UK, May 2014. [Google Scholar]
- Molina, L.F.; Resendiz, E.; Edwards, J.R.; Hart, J.M.; Barkan, C.P.L.; Ahuja, N. Condition Monitoring of Railway Turnouts and Other Track Components Using Machine Vision. In Proceedings of the Transportation Research Board 90th Annual Meeting, Washington, DC, USA, 23–27 January 2011. [Google Scholar]
- Chen, C.; Xu, T.; Wang, G.; Li, B. Railway turnout system RUL prediction based on feature fusion and genetic programming. Measurement 2020, 151, 107162. [Google Scholar] [CrossRef]
- Wang, P.; Wang, L.; Chen, R.; Xu, J.; Gao, M. Overview and outlook on railway track stiffness measurement. J. Mod. Transp. 2016, 24, 89–102. [Google Scholar] [CrossRef]
- Yeo, G.J. Monitoring Railway Track Condition Using Inertial Sensors on an in-Service Vehicle. Ph.D. Thesis, University of Birmingham, Birmingham, UK, June 2017. [Google Scholar]
- De Rosa, A.; Alfi, S.; Bruni, S. Estimation of lateral and cross alignment in a railway track based on vehicle dynamics measurements. Mech. Syst. Signal Process. 2019, 116, 606–623. [Google Scholar] [CrossRef]
- Balouchi, F.; Bevan, A.; Formston, R. Detecting Railway Under-Track Voids Using Multi-Train in-Service Vehicle Accelerometer. In Proceedings of the 7th IET Conference on Railway Condition Monitoring, Birmingham, UK, 27–28 September 2016. [Google Scholar]
- Tsunashima, H. Condition Monitoring of Railway Tracks from Car-Body Vibration Using a Machine Learning Technique. Appl. Sci. 2019, 9, 2734. [Google Scholar] [CrossRef]
- Kassa, E.; Nielsen, J.C.O. Stochastic analysis of dynamic interaction between train and railway turnout. Veh. Syst. Dyn. 2008, 46, 429–449. [Google Scholar] [CrossRef]
- Alfi, S.; Bruni, S. Mathematical modelling of train-turnout interaction. Veh. Syst. Dyn. 2009, 47, 551–574. [Google Scholar] [CrossRef]
- Ren, Z.; Sun, S.; Xie, G. A method to determine the two-point contact zone and transfer of wheel rail forces in a turnout. Veh. Syst. Dyn. 2010, 48, 1115–1133. [Google Scholar] [CrossRef]
- Pletz, M.; Daves, W.; Ossberger, H. A wheel set/crossing model regarding impact, sliding and deformation explicit finite element approach. Wear 2012, 294, 446–456. [Google Scholar] [CrossRef]
- Anyakwo, A.; Pislaru, C.; Ball, A. A New Method for Modelling and Simulation of the Dynamic Behaviour of the Wheel-rail contact. Int. J. Autom. Comput. 2012, 9, 237–247. [Google Scholar] [CrossRef]
- Pålsson, B.A. Optimisation of Railway Switches and Crossings. Ph.D. Thesis, Chalmers University of Technology, Göteborg, Sweden, February 2014. [Google Scholar]
- Wei, Z.; Chen, S.; Li, Z.; Dollevoet, R. Wheel-Rail Impact at Crossings-Relating Dynamic Frictional Contact to Degradation. J. Comput. Nonlinear Dyn. 2017, 12, 1–11. [Google Scholar] [CrossRef]
- Xin, L. Long-Term Behaviour of Railway Crossings Wheel-Rail Interaction and Rail Fatigue Life Prediction. Ph.D. Thesis, Delft University of Technology, Delft, The Netherlands, June 2017. [Google Scholar]
- Chiou, S.; Yen, J. Modeling of railway turnout geometry in the frog area with the vehicle wheel trajectory. Proc. Inst. Mech. Eng. Part F J. Rail Rapid Transit 2018, 232, 1598–1614. [Google Scholar] [CrossRef]
- Skrypnyk, R.; Nielsen, J.C.O.; Ekh, M.; Pålsson, B.A. Metamodelling of wheel-rail normal contact in railway crossings with elasto-plastic material behavior. Eng. Comput. 2019, 35, 139–155. [Google Scholar] [CrossRef]
- Torstensson, P.T.; Squicciarini, G.; Krüger, M.; Pålsson, B.A.; Nielsen, J.C.O.; Thompson, D.J. Wheel-rail impact loads and noise generated at railway crossings influence of vehicle speed and crossing dip angle. J. Sound Vib. 2019, 456, 119–136. [Google Scholar] [CrossRef]
- Wiest, M.; Daves, W.; Fischer, F.D.; Ossberger, H. Deformation and damage of a crossing nose due to wheel passages. Wear 2008, 265, 1431–1438. [Google Scholar] [CrossRef]
- Johansson, A.; Pålsson, B.; Ekh, M.; Nielsen, J.; Ander, M.; Brouzoulis, J.; Kassa, E. Simulation of wheel-rail contact and damage in switches & crossings. Wear 2010, 271, 472–481. [Google Scholar]
- Nielsen, J.C.O.; Li, X. Railway track geometry degradation due to differential settlement of ballast/subgrade Numerical prediction by an iterative procedure. J. Sound Vib. 2018, 412, 441–456. [Google Scholar] [CrossRef]
- Skrypnyk, R.; Ekh, M.; Nielsen, J.C.O.; Pålsson, B.A. Prediction of plastic deformation and wear in railway crossings—Comparing the performance of two rail steel grades. Wear 2019, 428–429, 302–314. [Google Scholar] [CrossRef]
- Wan, C. Optimisation of Vehicle-Track Interaction at Railway Crossings. Ph.D. Thesis, Delft University of Technology, Delft, The Netherlands, September 2016. [Google Scholar]
- Liu, X.; Markine, V.L.; Wang, H.; Shevtsov, I.Y. Experimental tools for railway crossing condition monitoring. Measurement 2018, 129, 424–435. [Google Scholar] [CrossRef]
- Liu, X.; Markine, V.L. Correlation Analysis and Application in the Railway Crossing Condition Monitoring. Sensors 2019, 19, 4175. [Google Scholar] [CrossRef]
- Liu, X.; Markine, V.L. Validation and Verification of the MBS Models for the Dynamic Performance Study of Railway Crossings. Eng. Struct. 2019. submitted. [Google Scholar]
- Wang, H.; Markine, V.L.; Liu, X. Experimental analysis of railway track settlement in transition zones. Proc. Inst. Mech. Eng. Part F J. Rail Rapid Transit 2018, 232, 1774–1789. [Google Scholar] [CrossRef] [PubMed]
- Xu, L.; Yu, Z.; Shi, C. A matrix coupled model for vehicle-slab track-subgrade interactions at 3-D space. Soil Dyn. Earthq. Eng. 2020, 128, 105894. [Google Scholar] [CrossRef]
- Hiensch, M.; Nielsen, J.C.O.; Verheijen, E. Rail corrugation in The Netherlands measurements and simulations. Wear 2002, 253, 140–149. [Google Scholar] [CrossRef]


 | |||||||
| Location | A | B | C | D | E | F | G |
| Deviation (mm) | +2 | +3 | −2 | −2 | +2 | +3 | 0 |
| Track Components | Stiffness, MN/m | Damping, kN·s/m | |
|---|---|---|---|
| Rail pad/Clips | Vertical | 1300 | 45 |
| Lateral | 280 | 580 | |
| Roll | 360 | 390 | |
| Ballast | Vertical & lateral | 45 | 32 |
© 2020 by the authors. Licensee MDPI, Basel, Switzerland. This article is an open access article distributed under the terms and conditions of the Creative Commons Attribution (CC BY) license (http://creativecommons.org/licenses/by/4.0/).
Share and Cite
Liu, X.; Markine, V.L. Train Hunting Related Fast Degradation of a Railway Crossing—Condition Monitoring and Numerical Verification. Sensors 2020, 20, 2278. https://doi.org/10.3390/s20082278
Liu X, Markine VL. Train Hunting Related Fast Degradation of a Railway Crossing—Condition Monitoring and Numerical Verification. Sensors. 2020; 20(8):2278. https://doi.org/10.3390/s20082278
Chicago/Turabian StyleLiu, Xiangming, and Valéri L. Markine. 2020. "Train Hunting Related Fast Degradation of a Railway Crossing—Condition Monitoring and Numerical Verification" Sensors 20, no. 8: 2278. https://doi.org/10.3390/s20082278
APA StyleLiu, X., & Markine, V. L. (2020). Train Hunting Related Fast Degradation of a Railway Crossing—Condition Monitoring and Numerical Verification. Sensors, 20(8), 2278. https://doi.org/10.3390/s20082278