Toward Using Wearables to Remotely Monitor Cognitive Frailty in Community-Living Older Adults: An Observational Study

 ,
,  ,
,  ,
,
Abstract
1. Introduction
2. Methods
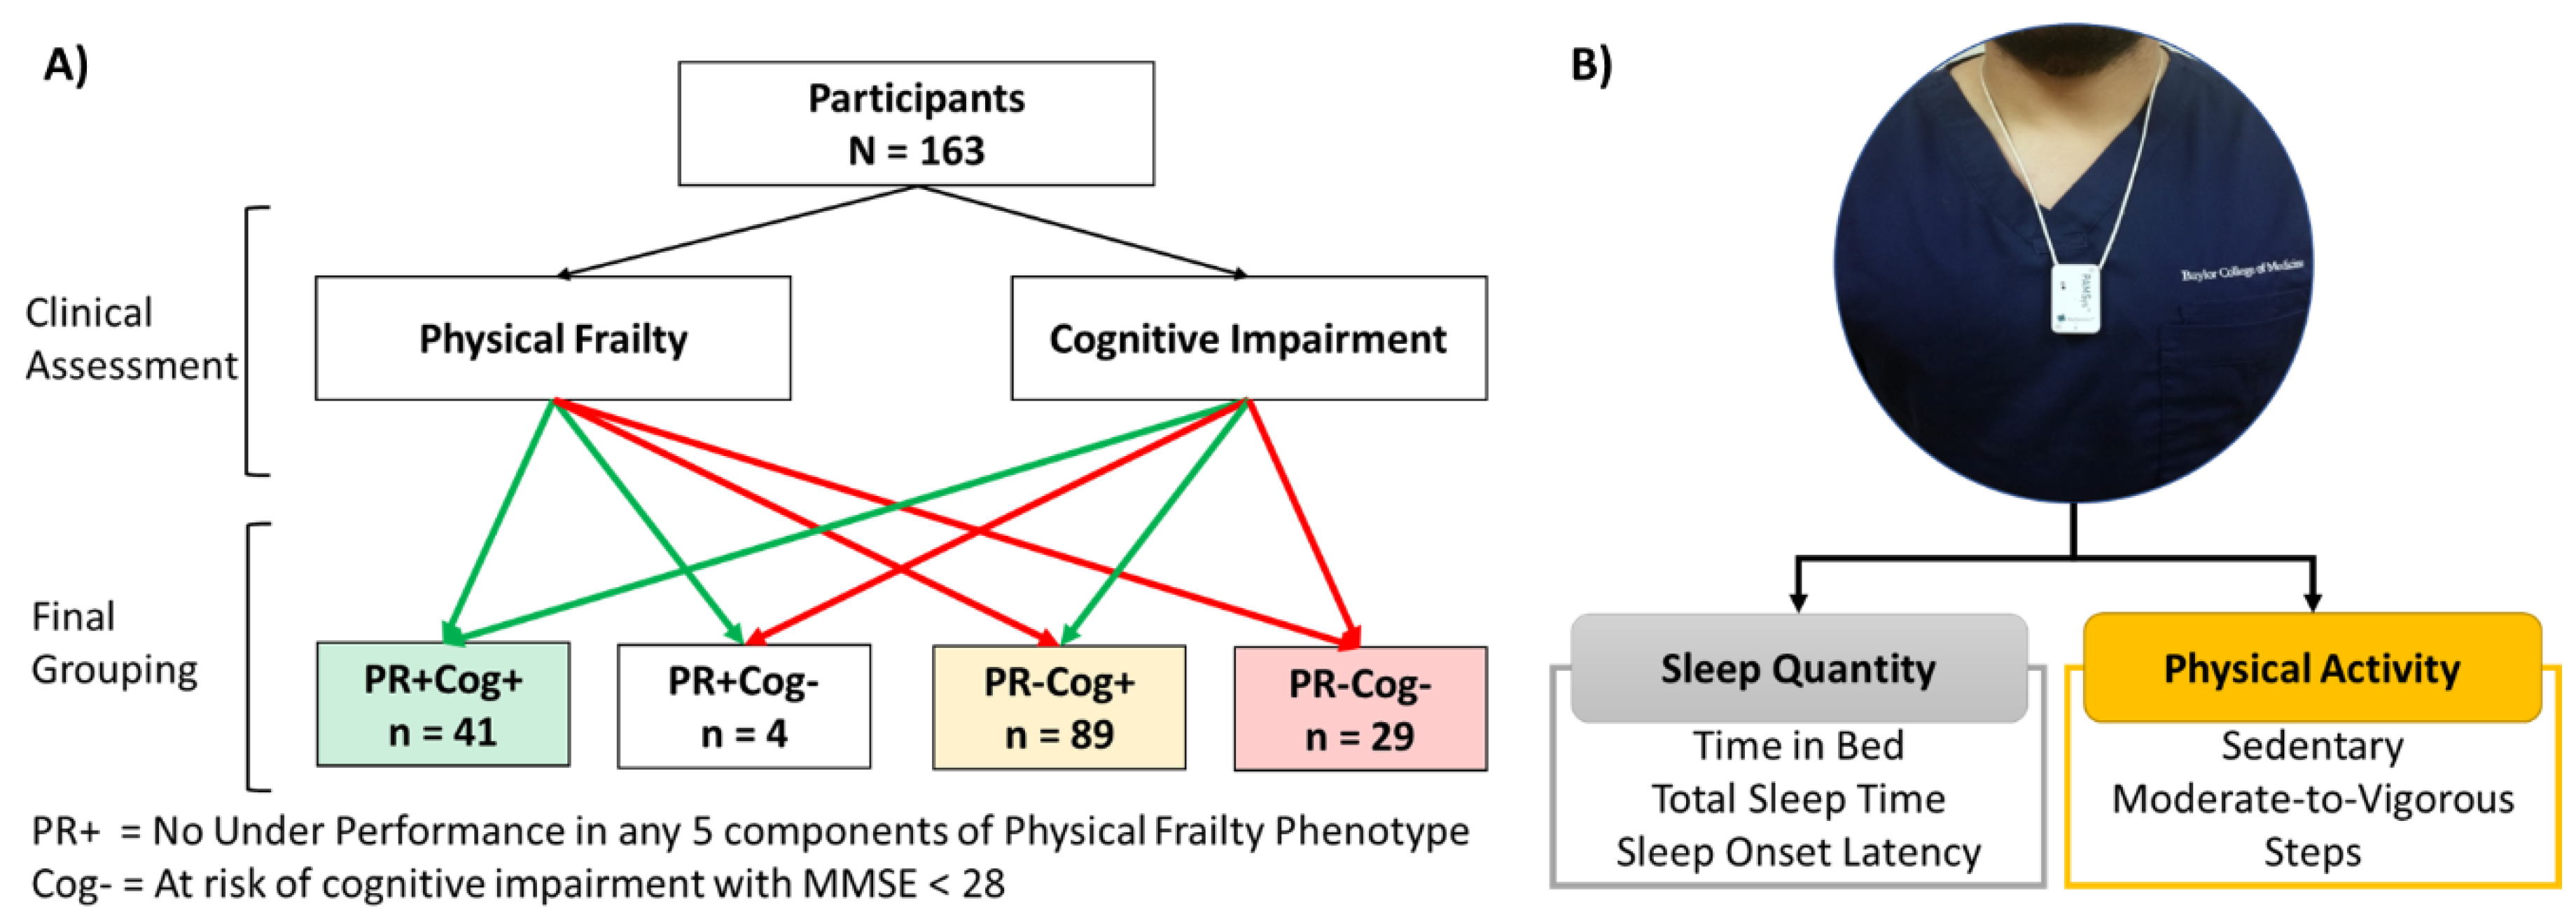
2.1. Participants
2.2. Physical Frailty and Cognitive Impairment Assessment
2.3. Sensor-Derived Parameters and Non-Wear Time
2.4. Statistics
3. Results
3.1. Participants
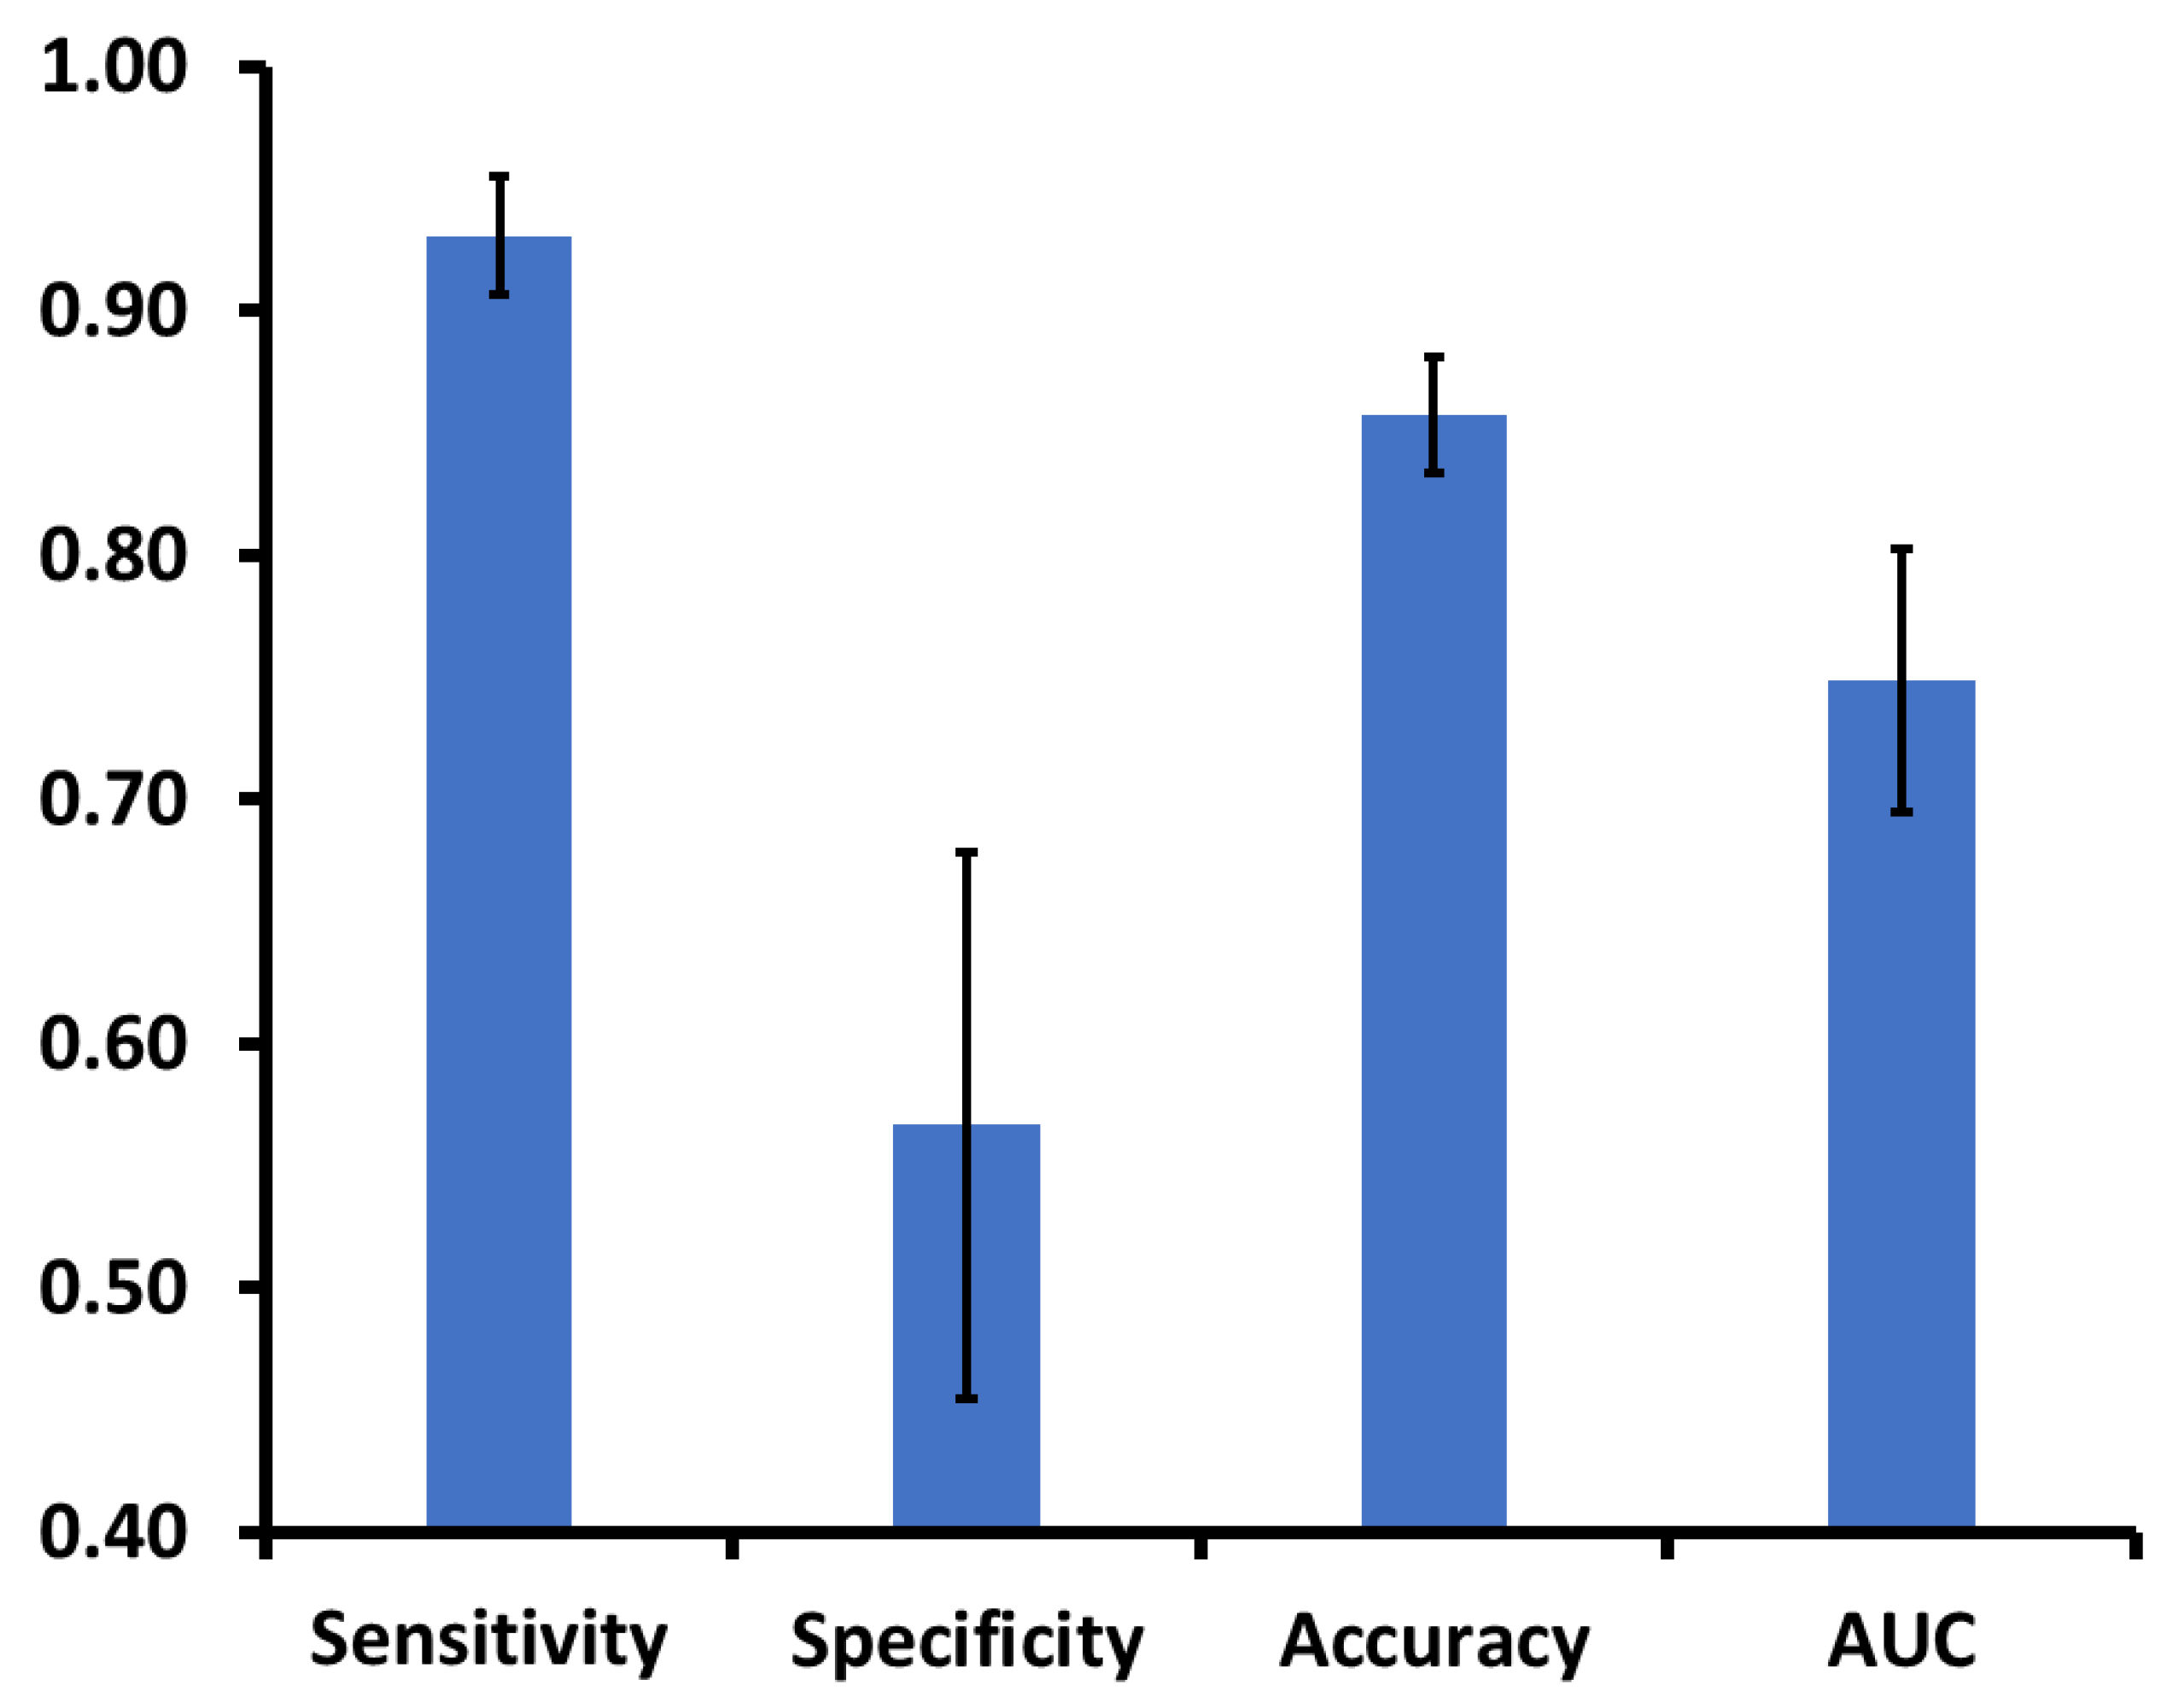
3.2. Association Between Cognitive Impairment and Sensor-Derived Parameters
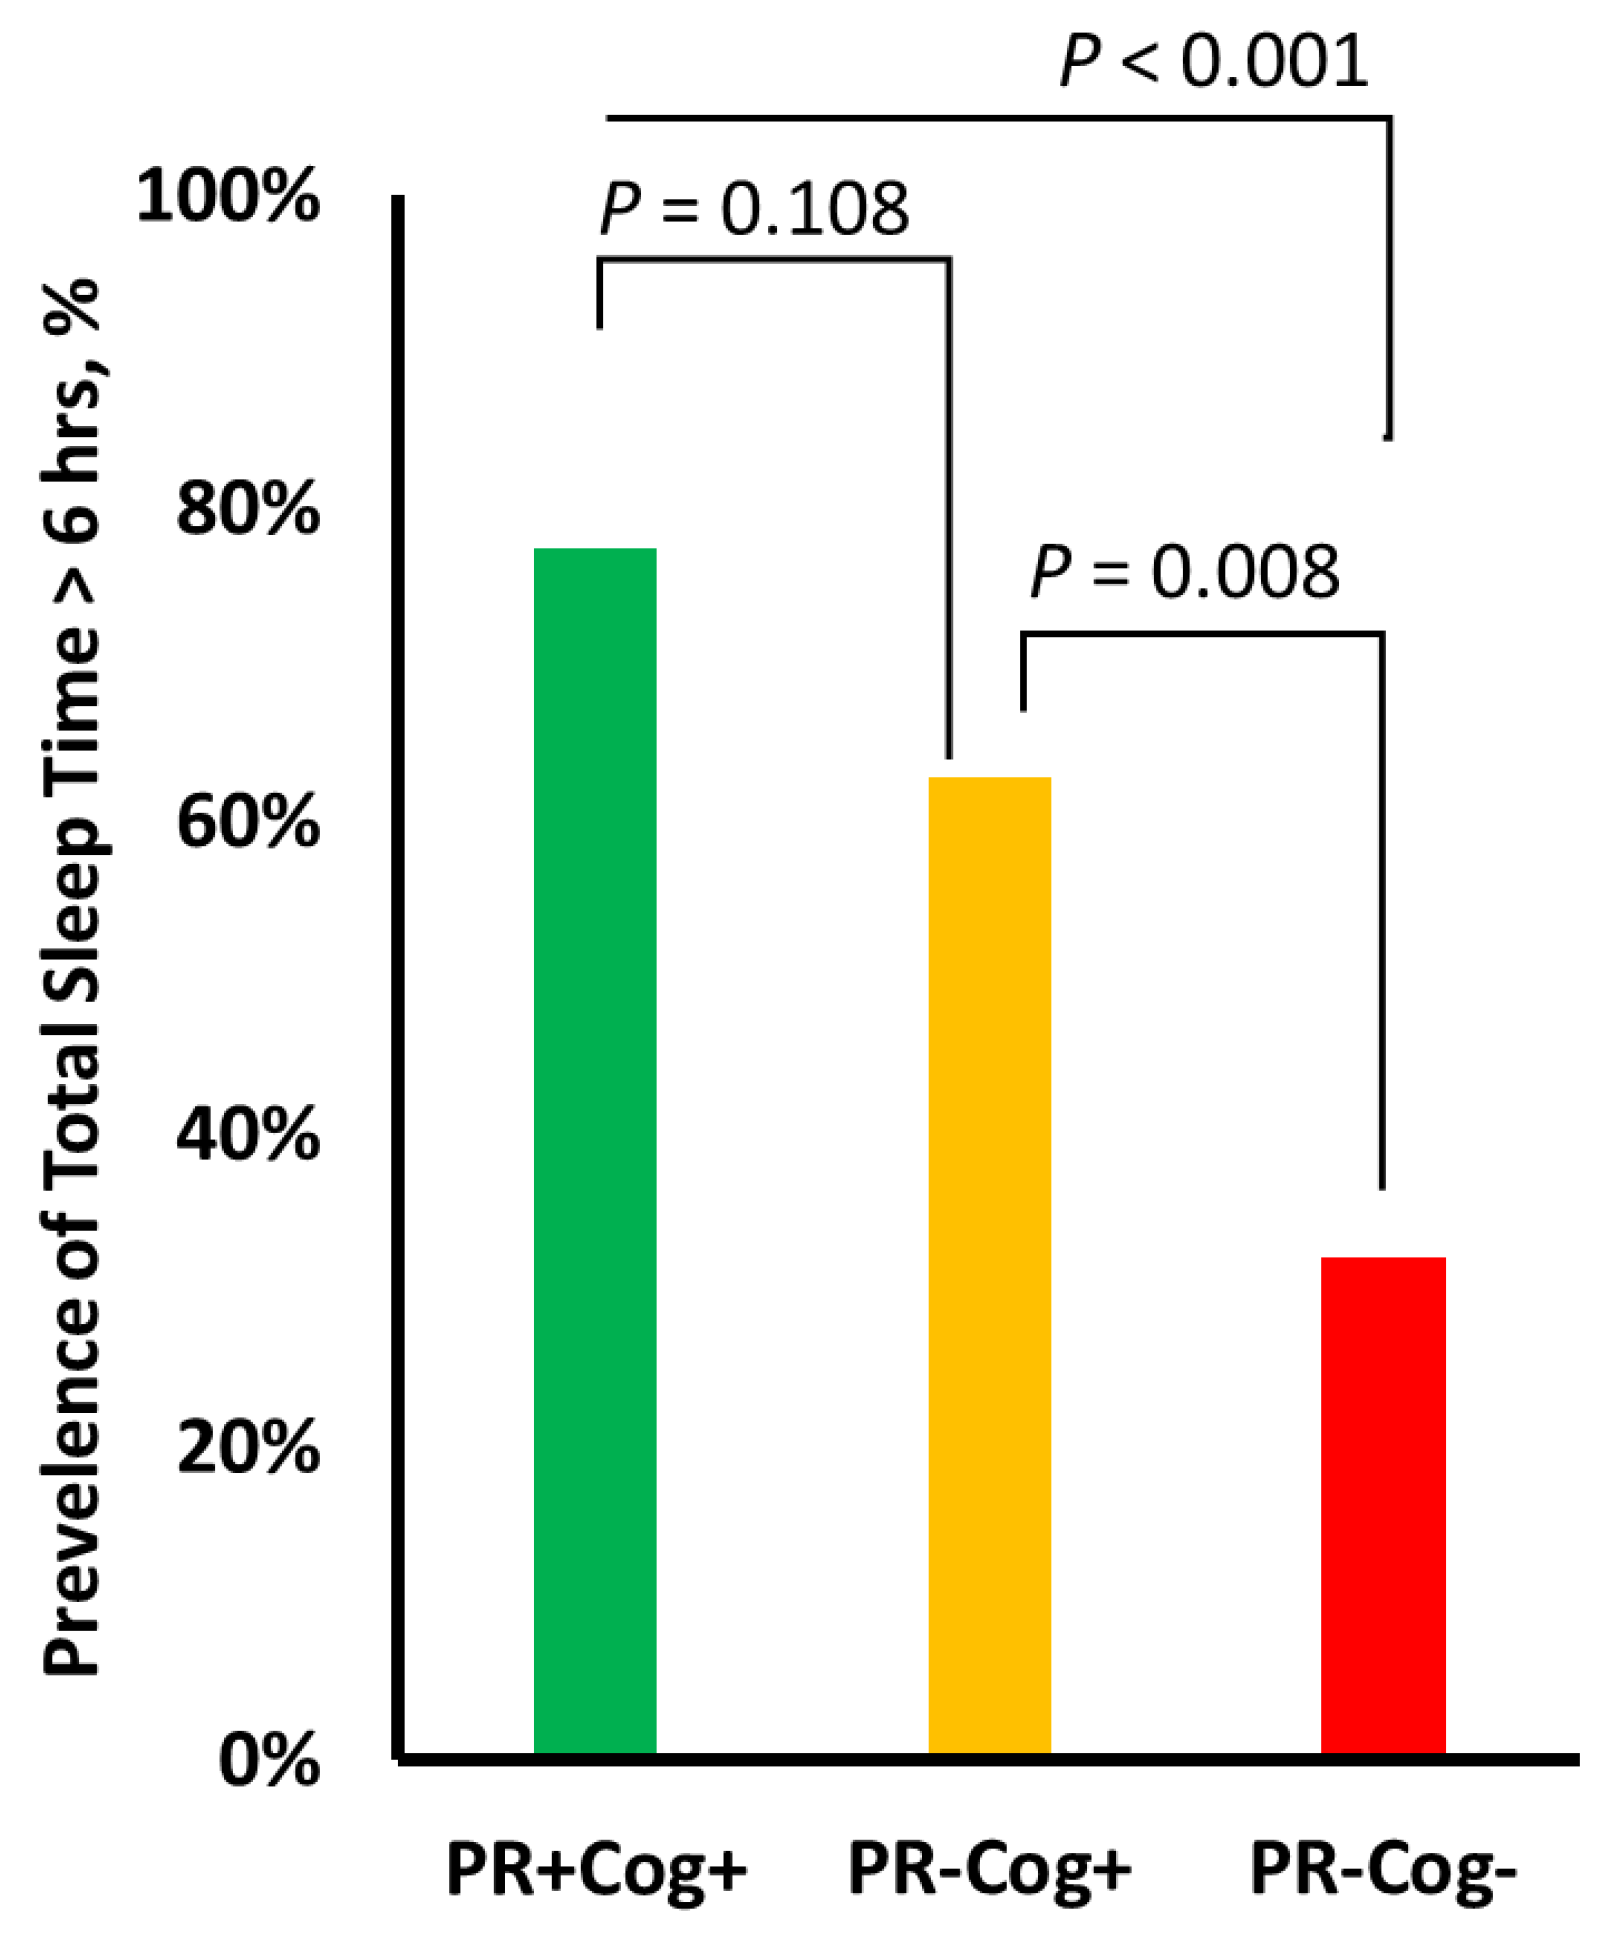
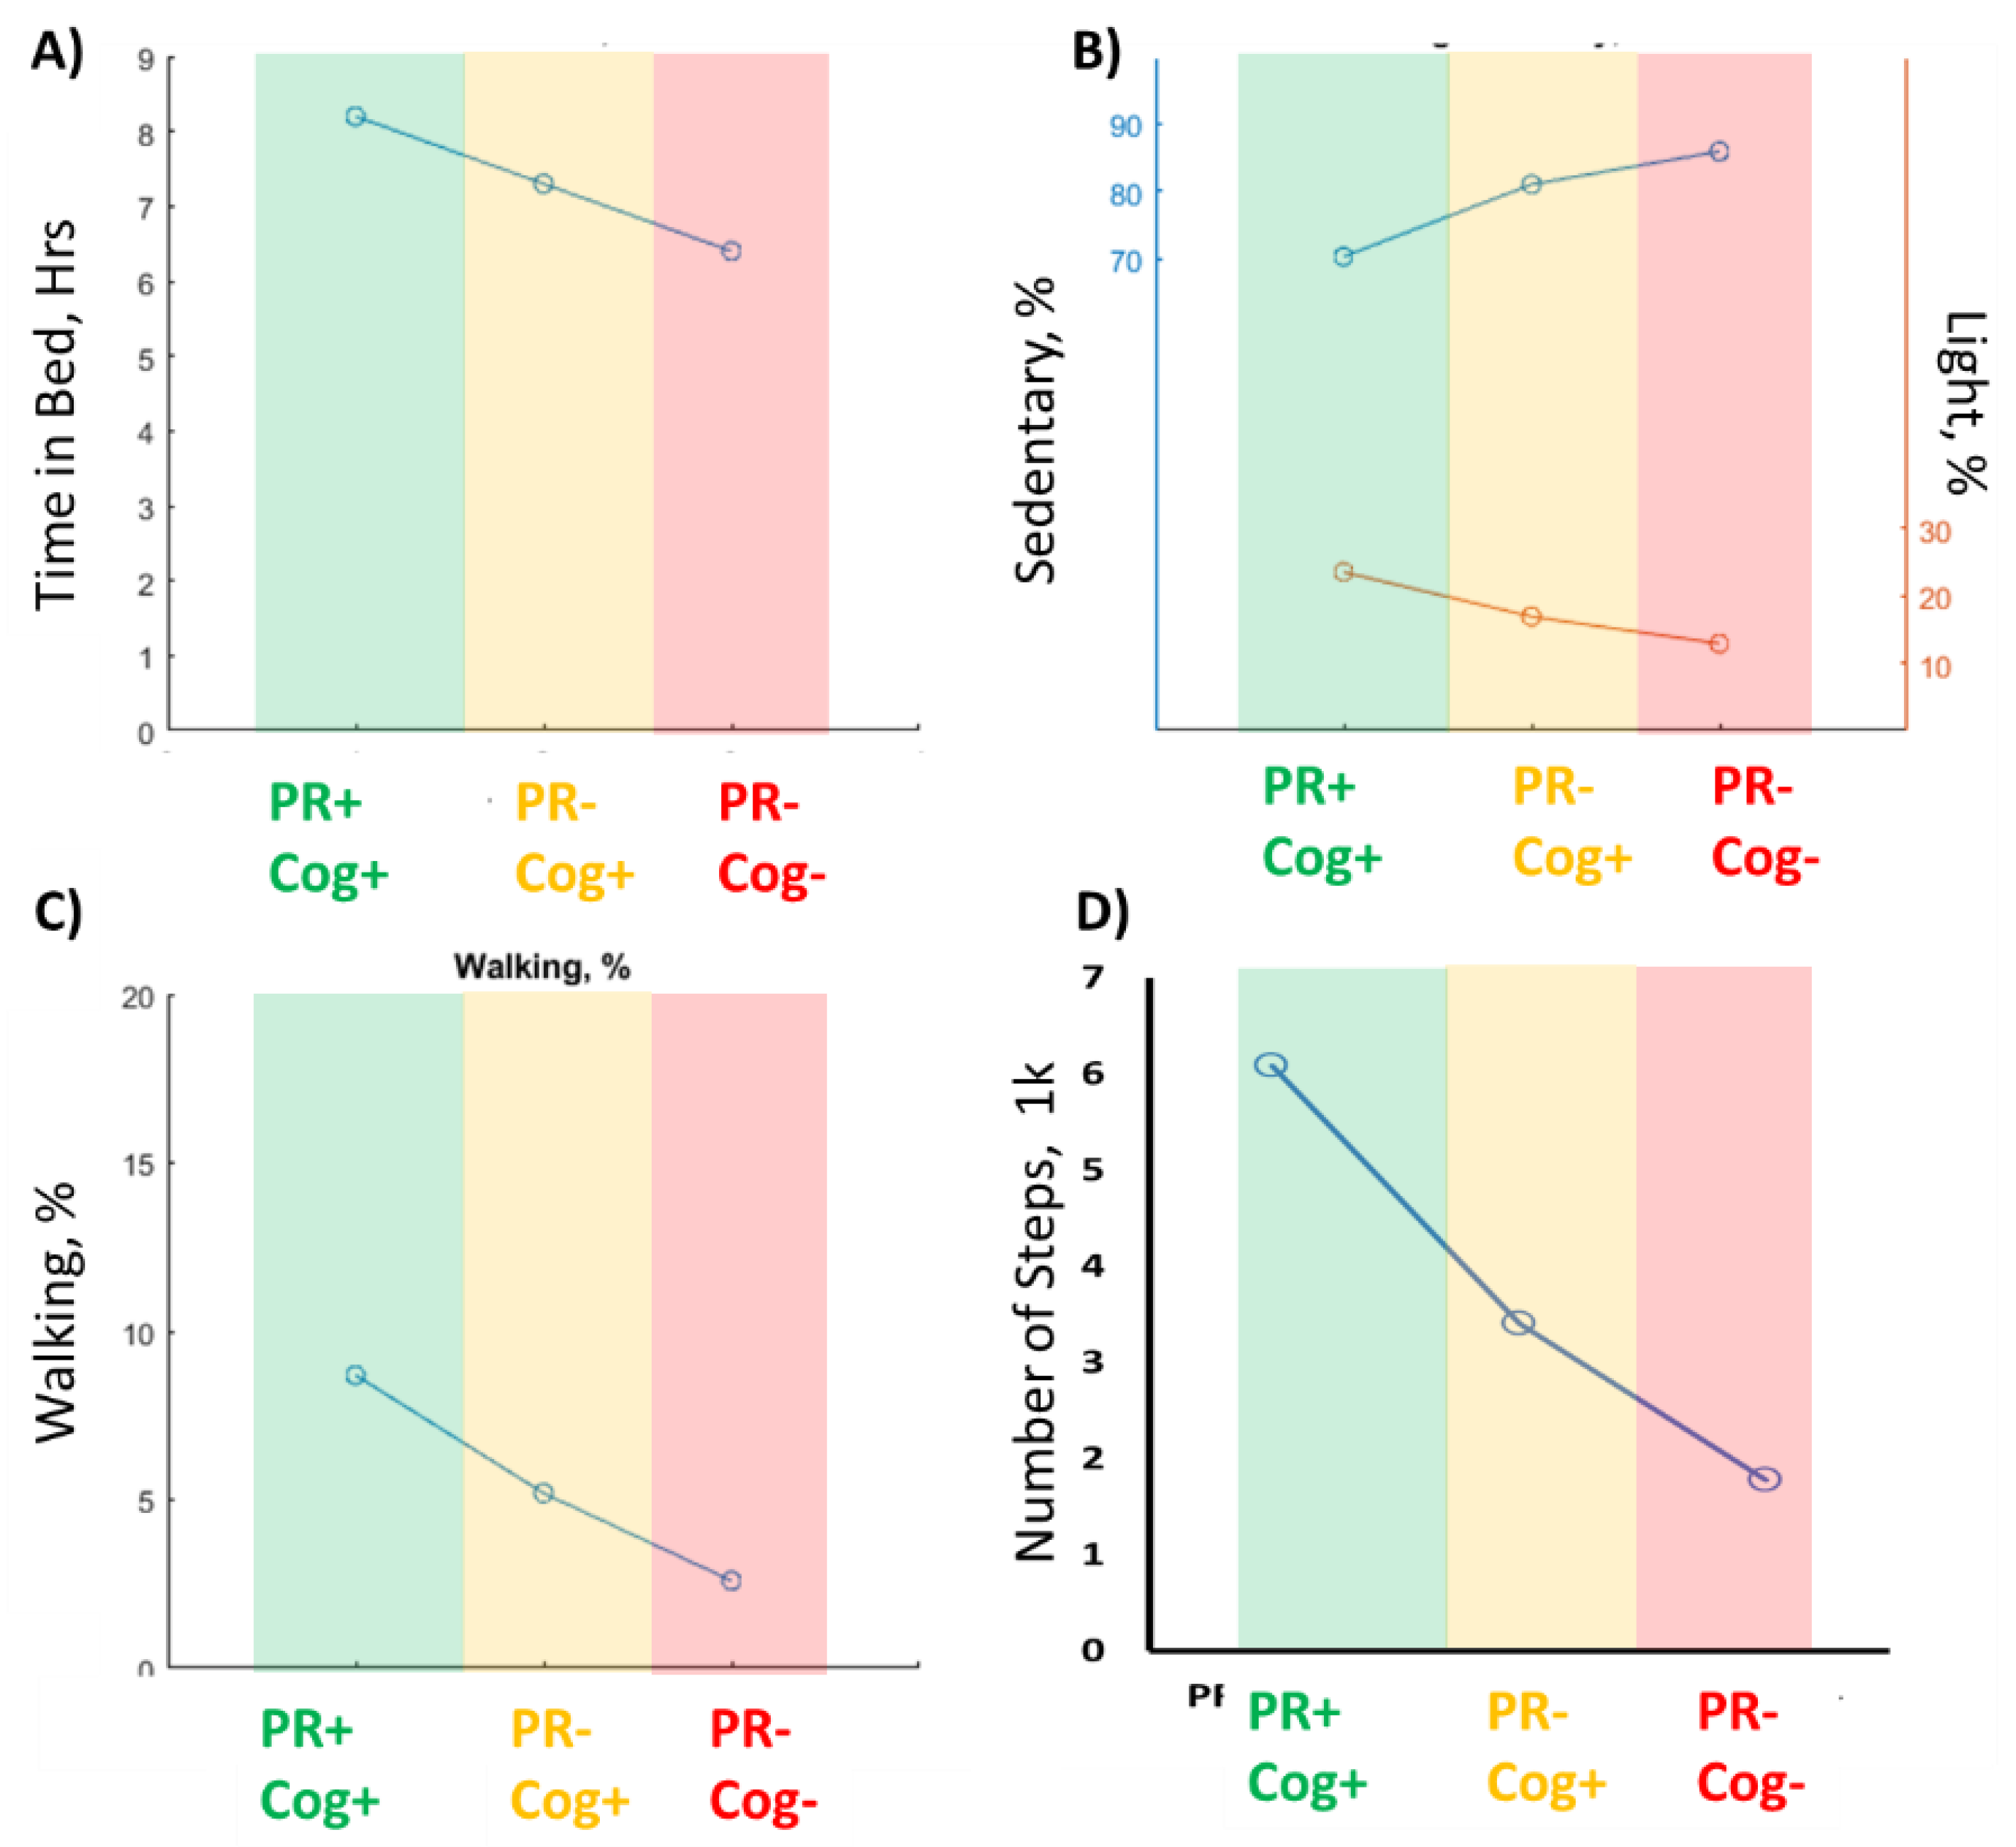
3.3. Comparison of Aging Groups
4. Discussion
5. Conclusions
Author Contributions
Funding
Acknowledgments
Conflicts of Interest
References
- Ávila-Funes, J.A.; Amieva, H.; Barberger-Gateau, P.; Le Goff, M.; Raoux, N.; Ritchie, K.; Carriere, I.; Tavernier, B.; Tzourio, C.; Gutiérrez-Robledo, L.M. Cognitive impairment improves the predictive validity of the phenotype of frailty for adverse health outcomes: The three-city study. J. Am. Geriatr. Soc. 2009, 57, 453–461. [Google Scholar] [CrossRef] [PubMed]
- Feng, L.; Nyunt, M.S.Z.; Gao, Q.; Feng, L.; Yap, K.B.; Ng, T.-P. Cognitive frailty and adverse health outcomes: Findings from the Singapore Longitudinal Ageing Studies (SLAS). J. Am. Med Dir. Assoc. 2017, 18, 252–258. [Google Scholar] [CrossRef]
- Bahureksa, L.; Najafi, B.; Saleh, A.; Sabbagh, M.; Coon, D.; Mohler, M.J.; Schwenk, M. The Impact of Mild Cognitive Impairment on Gait and Balance: A Systematic Review and Meta-Analysis of Studies Using Instrumented Assessment. Gerontology 2017, 63, 67–83. [Google Scholar] [CrossRef] [PubMed]
- Montero-Odasso, M.M.; Sarquis-Adamson, Y.; Speechley, M.; Borrie, M.J.; Hachinski, V.C.; Wells, J.; Riccio, P.M.; Schapira, M.; Sejdic, E.; Camicioli, R.M.; et al. Association of Dual-Task Gait With Incident Dementia in Mild Cognitive Impairment: Results From the Gait and Brain Study. JAMA Neurol. 2017, 74, 857–865. [Google Scholar] [CrossRef] [PubMed]
- Beauchet, O.; Launay, C.P.; Sekhon, H.; Barthelemy, J.C.; Roche, F.; Chabot, J.; Levinoff, E.J.; Allali, G. Association of increased gait variability while dual tasking and cognitive decline: Results from a prospective longitudinal cohort pilot study. Geroscience 2017, 39, 439–445. [Google Scholar] [CrossRef] [PubMed]
- Robertson, D.A.; Savva, G.M.; Kenny, R.A. Frailty and cognitive impairment—A review of the evidence and causal mechanisms. Ageing Res. Rev. 2013, 12, 840–851. [Google Scholar] [CrossRef]
- Han, E.S.; Lee, Y.; Kim, J. Association of cognitive impairment with frailty in community-dwelling older adults. Int. Psychogeriatr. 2014, 26, 155–163. [Google Scholar] [CrossRef]
- Buchman, A.S.; Boyle, P.A.; Wilson, R.S.; Tang, Y.; Bennett, D.A. Frailty is associated with incident Alzheimer’s disease and cognitive decline in the elderly. Psychosom. Med. 2007, 69, 483–489. [Google Scholar] [CrossRef]
- Kelaiditi, E.; Cesari, M.; Canevelli, M.; Van Kan, G.A.; Ousset, P.-J.; Gillette-Guyonnet, S.; Ritz, P.; Duveau, F.; Soto, M.; Provencher, V. Cognitive frailty: Rational and definition from an (IANA/IAGG) international consensus group. J. Nutr. Health Aging 2013, 17, 726–734. [Google Scholar] [CrossRef]
- Folstein, M.F.; Robins, L.N.; Helzer, J.E. Mini-mental state examination. Arch. Gen. Psychiatry 1983, 40, 812. [Google Scholar] [CrossRef]
- Nasreddine, Z.S.; Phillips, N.A.; Bedirian, V.; Charbonneau, S.; Whitehead, V.; Collin, I.; Cummings, J.L.; Chertkow, H. The Montreal Cognitive Assessment, MoCA: A brief screening tool for mild cognitive impairment. J. Am. Geriatr. Soc. 2005, 53, 695–699. [Google Scholar] [CrossRef]
- Fried, L.P.; Tangen, C.M.; Walston, J.; Newman, A.B.; Hirsch, C.; Gottdiener, J.; Seeman, T.; Tracy, R.; Kop, W.J.; Burke, G. Frailty in older adults: Evidence for a phenotype. J.Gerontol. Ser. A Biol. Sci. Med Sci. 2001, 56, M146–M157. [Google Scholar] [CrossRef] [PubMed]
- Clegg, A.; Bates, C.; Young, J.; Ryan, R.; Nichols, L.; Ann Teale, E.; Mohammed, M.A.; Parry, J.; Marshall, T. Development and validation of an electronic frailty index using routine primary care electronic health record data. Age Ageing 2016, 45, 353–360. [Google Scholar] [CrossRef]
- Zhou, H.; Razjouyan, J.; Halder, D.; Naik, A.D.; Kunik, M.E.; Najafi, B. Instrumented Trail-Making Task: Application of Wearable Sensor to Determine Physical Frailty Phenotypes. Gerontology 2019, 65, 186–197. [Google Scholar] [CrossRef]
- Zhou, H.; Sabbagh, M.; Wyman, R.; Liebsack, C.; Kunik, M.E.; Najafi, B. Instrumented trail-making task to differentiate persons with no cognitive impairment, amnestic mild cognitive impairment, and Alzheimer disease: A proof of concept study. Gerontology 2017, 63, 189–200. [Google Scholar] [CrossRef] [PubMed]
- Lee, H.; Joseph, B.; Enriquez, A.; Najafi, B. Toward Using a Smartwatch to Monitor Frailty in a Hospital Setting: Using a Single Wrist-Wearable Sensor to Assess Frailty in Bedbound Inpatients. Gerontology 2017. [Google Scholar] [CrossRef]
- Lindberg, C.M.; Srinivasan, K.; Gilligan, B.; Razjouyan, J.; Lee, H.; Najafi, B.; Canada, K.J.; Mehl, M.R.; Currim, F.; Ram, S.; et al. Effects of office workstation type on physical activity and stress. Occup. Environ. Med. 2018, 75, 689–695. [Google Scholar] [CrossRef] [PubMed]
- Joseph, B.; Toosizadeh, N.; Jokar, T.O.; Heusser, M.R.; Mohler, J.; Najafi, B. Upper-extremity function predicts adverse health outcomes among older adults hospitalized for ground-level falls. Gerontology 2017, 63, 299–307. [Google Scholar] [CrossRef] [PubMed]
- Toosizadeh, N.; Joseph, B.; Heusser, M.R.; Jokar, T.O.; Mohler, J.; Phelan, H.A.; Najafi, B. Assessing upper-extremity motion: An innovative, objective method to identify frailty in older bed-bound trauma patients. J. Am. Coll. Surg. 2016, 223, 240–248. [Google Scholar] [CrossRef] [PubMed]
- Schwenk, M.; Mohler, J.; Wendel, C.; Fain, M.; Taylor-Piliae, R.; Najafi, B. Wearable sensor-based in-home assessment of gait, balance, and physical activity for discrimination of frailty status: Baseline results of the Arizona frailty cohort study. Gerontology 2015, 61, 258–267. [Google Scholar] [CrossRef]
- Ensrud, K.E.; Blackwell, T.L.; Ancoli-Israel, S.; Redline, S.; Cawthon, P.M.; Paudel, M.L.; Dam, T.-T.L.; Stone, K.L. Sleep disturbances and risk of frailty and mortality in older men. Sleep Med. 2012, 13, 1217–1225. [Google Scholar] [CrossRef] [PubMed]
- Ensrud, K.E.; Blackwell, T.L.; Redline, S.; Ancoli-Israel, S.; Paudel, M.L.; Cawthon, P.M.; Dam, T.T.L.; Barrett-Connor, E.; Leung, P.C.; Stone, K.L. Sleep Disturbances and Frailty Status in Older Community-Dwelling Men. J. Am. Geriatr. Soc. 2009, 57, 2085–2093. [Google Scholar] [CrossRef] [PubMed]
- Del Pozo-Cruz, B.; Mañas, A.; Martín-García, M.; Marín-Puyalto, J.; García-García, F.J.; Rodriguez-Mañas, L.; Guadalupe-Grau, A.; Ara, I. Frailty is associated with objectively assessed sedentary behaviour patterns in older adults: Evidence from the Toledo Study for Healthy Aging (TSHA). PLoS ONE 2017, 12, e0183911. [Google Scholar] [CrossRef] [PubMed]
- Galan-Mercant, A.; Cuesta-Vargas, A. Clinical frailty syndrome assessment using inertial sensors embedded in smartphones. Physiol. Meas. 2015, 36, 1929. [Google Scholar] [CrossRef]
- Haider, S.; Luger, E.; Kapan, A.; Titze, S.; Lackinger, C.; Schindler, K.E.; Dorner, T.E. Associations between daily physical activity, handgrip strength, muscle mass, physical performance and quality of life in prefrail and frail community-dwelling older adults. Qual. Life Res. 2016, 25, 3129–3138. [Google Scholar] [CrossRef]
- Theou, O.; Jakobi, J.M.; Vandervoort, A.A.; Jones, G.R. A comparison of physical activity (PA) assessment tools across levels of frailty. Arch. Gerontol. Geriatr. 2012, 54, e307–e314. [Google Scholar] [CrossRef] [PubMed]
- Blodgett, J.; Theou, O.; Kirkland, S.; Andreou, P.; Rockwood, K. The association between sedentary behaviour, moderate–vigorous physical activity and frailty in NHANES cohorts. Maturitas 2015, 80, 187–191. [Google Scholar] [CrossRef] [PubMed]
- Schwenk, M.; Hauer, K.; Zieschang, T.; Englert, S.; Mohler, J.; Najafi, B. Sensor-derived physical activity parameters can predict future falls in people with dementia. Gerontology 2014, 60, 483–492. [Google Scholar] [CrossRef]
- Schmidt, C.R.; Hefner, J.; McAlearney, A.S.; Graham, L.; Johnson, K.; Moffatt-Bruce, S.; Huerta, T.; Pawlik, T.M.; White, S. Development and prospective validation of a model estimating risk of readmission in cancer patients. J. Surg. Oncol. 2018, 117, 1113–1118. [Google Scholar] [CrossRef]
- Naismith, S.L.; Rogers, N.L.; Hickie, I.B.; Mackenzie, J.; Norrie, L.M.; Lewis, S.J. Sleep well, think well: Sleep-wake disturbance in mild cognitive impairment. J. Geriatr. Psychiatry Neurol. 2010, 23, 123–130. [Google Scholar] [CrossRef]
- Cochrane, A.; Robertson, I.H.; Coogan, A.N. Association between circadian rhythms, sleep and cognitive impairment in healthy older adults: An actigraphic study. J. Neural Transm. 2012, 119, 1233–1239. [Google Scholar] [CrossRef] [PubMed]
- Diem, S.J.; Blackwell, T.L.; Stone, K.L.; Yaffe, K.; Tranah, G.; Cauley, J.A.; Ancoli-Israel, S.; Redline, S.; Spira, A.P.; Hillier, T.A. Measures of sleep–wake patterns and risk of mild cognitive impairment or dementia in older women. Am. J. Geriatr. Psychiatry 2016, 24, 248–258. [Google Scholar] [CrossRef] [PubMed]
- Wu, L.; Sun, D.; Tan, Y. A systematic review and dose-response meta-analysis of sleep duration and the occurrence of cognitive disorders. Sleep and Breathing 2017, 1–10. [Google Scholar] [CrossRef]
- Tian, Q.; Resnick, S.M.; Mielke, M.M.; Yaffe, K.; Launer, L.J.; Jonsson, P.V.; Grande, G.; Welmer, A.K.; Laukka, E.J.; Bandinelli, S.; et al. Association of Dual Decline in Memory and Gait Speed With Risk for Dementia Among Adults Older Than 60 Years: A Multicohort Individual-Level Meta-analysis. JAMA Netw. Open 2020, 3, e1921636. [Google Scholar] [CrossRef] [PubMed]
- Folstein, M.F.; Folstein, S.E.; McHugh, P.R. “Mini-mental state”: A practical method for grading the cognitive state of patients for the clinician. J. Psychiatr. Res. 1975, 12, 189–198. [Google Scholar] [CrossRef]
- Lewinsohn, P.M.; Seeley, J.R.; Roberts, R.E.; Allen, N.B. Center for Epidemiologic Studies Depression Scale (CES-D) as a screening instrument for depression among community-residing older adults. Psychol. Aging 1997, 12, 277. [Google Scholar] [CrossRef]
- Yardley, L.; Beyer, N.; Hauer, K.; Kempen, G.; Piot-Ziegler, C.; Todd, C. Development and initial validation of the Falls Efficacy Scale-International (FES-I). Age Ageing 2005, 34, 614–619. [Google Scholar] [CrossRef]
- Damian, A.M.; Jacobson, S.A.; Hentz, J.G.; Belden, C.M.; Shill, H.A.; Sabbagh, M.N.; Caviness, J.N.; Adler, C.H. The Montreal Cognitive Assessment and the Mini-Mental State Examination as screening instruments for cognitive impairment: Item analyses and threshold scores. Dement. Geriatr. Cogn. Disord. 2011, 31, 126–131. [Google Scholar] [CrossRef]
- Luck, T.; Then, F.S.; Luppa, M.; Schroeter, M.L.; Arélin, K.; Burkhardt, R.; Thiery, J.; Löffler, M.; Villringer, A.; Riedel-Heller, S.G. Association of the apolipoprotein E genotype with memory performance and executive functioning in cognitively intact elderly. Neuropsychology 2015, 29, 382. [Google Scholar] [CrossRef]
- Shan, G. Improved confidence intervals for the Youden index. PLoS ONE 2015, 10, e0127272. [Google Scholar] [CrossRef]
- Najafi, B.; Armstrong, D.G.; Mohler, J. Novel wearable technology for assessing spontaneous daily physical activity and risk of falling in older adults with diabetes. J. Diabetes Sci. Technol. 2013, 7, 1147–1160. [Google Scholar] [CrossRef] [PubMed]
- Najafi, B.; Aminian, K.; Loew, F.; Blanc, Y.; Robert, P.A. Measurement of stand-sit and sit-stand transitions using a miniature gyroscope and its application in fall risk evaluation in the elderly. IEEE Trans. Biomed. Eng. 2002, 49, 843–851. [Google Scholar] [CrossRef] [PubMed]
- Najafi, B.; Aminian, K.; Paraschiv-Ionescu, A.; Loew, F.; Bula, C.J.; Robert, P. Ambulatory system for human motion analysis using a kinematic sensor: Monitoring of daily physical activity in the elderly. IEEE Trans. Biomed. Eng. 2003, 50, 711–723. [Google Scholar] [CrossRef] [PubMed]
- Razjouyan, J.; Naik, A.D.; Horstman, M.J.; Kunik, M.E.; Amirmazaheri, M.; Zhou, H.; Sharafkhaneh, A.; Najafi, B. Wearable Sensors and the Assessment of Frailty among Vulnerable Older Adults: An Observational Cohort Study. Sensors 2018, 18, 1336. [Google Scholar] [CrossRef]
- Razjouyan, J.; Lee, H.; Parthasarathy, S.; Mohler, J.; Sharafkhaneh, A.; Najafi, B. Improving Sleep Quality Assessment Using Wearable Sensors by Including Information From Postural/Sleep Position Changes and Body Acceleration: A Comparison of Chest-Worn Sensors, Wrist Actigraphy, and Polysomnography. J. Clin. Sleep Med. 2017, 13, 1301–1310. [Google Scholar] [CrossRef]
- Troiano, R.P.; Berrigan, D.; Dodd, K.W.; Masse, L.C.; Tilert, T.; McDowell, M. Physical activity in the United States measured by accelerometer. Med. Sci. Sports Exerc. 2008, 40, 181. [Google Scholar] [CrossRef]
- Esfahani, M.I.M.; Nussbaum, M.A. A “smart” undershirt for tracking upper body motions: Task classification and angle estimation. IEEE Sens. J. 2018, 18, 7650–7658. [Google Scholar] [CrossRef]
- Incel, O.D.; Kose, M.; Ersoy, C. A review and taxonomy of activity recognition on mobile phones. BioNanoScience 2013, 3, 145–171. [Google Scholar] [CrossRef]
- Mokhlespour Esfahani, M.I.; Nussbaum, M.A. Classifying Diverse Physical Activities Using “Smart Garments”. Sensors 2019, 19, 3133. [Google Scholar] [CrossRef]
- Mukhopadhyay, S.C. Wearable sensors for human activity monitoring: A review. IEEE Sens. J. 2014, 15, 1321–1330. [Google Scholar] [CrossRef]
- Schrack, J.A.; Cooper, R.; Koster, A.; Shiroma, E.J.; Murabito, J.M.; Rejeski, W.J.; Ferrucci, L.; Harris, T.B. Assessing daily physical activity in older adults: Unraveling the complexity of monitors, measures, and methods. J. Gerontol. Ser. A Biomed. Sci. Med Sci. 2016, 71, 1039–1048. [Google Scholar] [CrossRef]
- De Bruin, E.D.; Najafi, B.; Murer, K.; Uebelhart, D.; Aminian, K. Quantification of everyday motor function in a geriatric population. J. Rehabil. Res. Dev. 2007, 44, 417–428. [Google Scholar] [CrossRef] [PubMed]
- US Department of Health and Human Services. 2008 Physical Activity Guidelines for Americans: Be Active, Healthy, and Happy! Available online: http://www.health.gov/paguidelines (accessed on 1 February 2020).
- Najafi, B.; Crews, R.T.; Wrobel, J.S. Importance of time spent standing for those at risk of diabetic foot ulceration. Diabetes Care 2010, 33, 2448–2450. [Google Scholar] [CrossRef] [PubMed]
- Cohen, J. Statistical Power Analysis for the Behavioral Sciences, 2nd ed.; Erlbaum: Hillsdale, NJ, USA, 1988. [Google Scholar]
- Singhi, S.K.; Liu, H. Feature Subset Selection Bias for Classification Learning, Proceedings of the 23rd International Conference on Machine Learning, Pittsburgh, PA, USA, 25–29 June 2006; ACM: New York, NY, USA, 2006; pp. 849–856. [Google Scholar]
- Jović, A.; Brkić, K.; Bogunović, N. A Review of Feature Selection Methods with Applications Information and Communication Technology, Electronics and Microelectronics (MIPRO), Proceedings of the 38th International Convention, Opatija, Croatia, 25–29 May 2015; IEEE: Piscataway, NJ, USA, 2015; pp. 1200–1205. [Google Scholar]
- Rudolfer, S.M.; Paliouras, G.; Peers, I.S. A comparison of logistic regression to decision tree induction in the diagnosis of carpal tunnel syndrome. Comput. Biomed. Res. 1999, 32, 391–414. [Google Scholar] [CrossRef]
- Nasrabadi, N.M. Pattern recognition and machine learning. J. Electron. Imaging 2007, 16, 049901. [Google Scholar]
- Podgorelec, V.; Kokol, P.; Stiglic, B.; Rozman, I. Decision trees: An overview and their use in medicine. J. Med Syst. 2002, 26, 445–463. [Google Scholar] [CrossRef] [PubMed]
- Arlot, S.; Celisse, A. A survey of cross-validation procedures for model selection. Stat. Surv. 2010, 4, 40–79. [Google Scholar] [CrossRef]
- Taborri, J.; Palermo, E.; Rossi, S. Automatic detection of faults in race walking: A comparative analysis of machine-learning algorithms fed with inertial sensor data. Sensors 2019, 19, 1461. [Google Scholar] [CrossRef]
- Thein, F.S.; Li, Y.; Nyunt, M.S.Z.; Gao, Q.; Wee, S.L.; Ng, T.P. Physical frailty and cognitive impairment is associated with diabetes and adversely impact functional status and mortality. Postgrad. Med. 2018, 130, 561–567. [Google Scholar] [CrossRef] [PubMed]
- Wick, J. Understanding frailty in the geriatric population. Consult. Pharm. 2011, 26, 634–645. [Google Scholar] [CrossRef]
- Foley, D.; Ancoli-Israel, S.; Britz, P.; Walsh, J. Sleep disturbances and chronic disease in older adults: Results of the 2003 National Sleep Foundation Sleep in America Survey. J. Psychosom. Res. 2004, 56, 497–502. [Google Scholar] [CrossRef] [PubMed]
- Yaffe, K.; Laffan, A.M.; Harrison, S.L.; Redline, S.; Spira, A.P.; Ensrud, K.E.; Ancoli-Israel, S.; Stone, K.L. Sleep-disordered breathing, hypoxia, and risk of mild cognitive impairment and dementia in older women. JAMA 2011, 306, 613–619. [Google Scholar] [CrossRef] [PubMed]
- Trevethan, R. Sensitivity, specificity, and predictive values: Foundations, pliabilities, and pitfalls in research and practice. Front. Public Health 2017, 5, 307. [Google Scholar] [CrossRef] [PubMed]
- Kang, G.E.; Najafi, B. Sensor-Based Daily Physical Activity: Towards Prediction of the Level of Concern about Falling in Peripheral Neuropathy. Sensors 2020, 20, 505. [Google Scholar] [CrossRef]
- Cornelis, E.; Gorus, E.; Beyer, I.; Bautmans, I.; De Vriendt, P. Early diagnosis of mild cognitive impairment and mild dementia through basic and instrumental activities of daily living: Development of a new evaluation tool. PLoS Med. 2017, 14, e1002250. [Google Scholar] [CrossRef]


| Physically Robust (PR+Cog+) n = 41 | Not Physically Robust (PR-) | PR+Cog+ Vs PR-Cog+ | PR+Cog+ Vs PR-Cog- | PR-Cog+ Vs PR-Cog- | ||
|---|---|---|---|---|---|---|
| High Cognitive Performance (PR-Cog+) n = 89 | Cognitive Impairment Risk(PR-Cog-) n = 29 | |||||
| mean ± SD | mean ± SD | mean ± SD | p-Value (Effect Size) | |||
| Age, years | 73.4 ± 7.2 | 76.5 ± 11.7 | 74.7 ± 10.8 | 0.123(0.32) | 0.626(0.14) | 0.416(0.16) |
| BMI, kg/m2 | 24.9 ± 5.7 | 29.7 ± 7.0 | 31.7 ± 6.6 | 0.000(0.75) | 0.000(1.09) | 0.170(0.29) |
| MMSE | 29.5 ± 0.7 | 29.2 ± 0.8 | 24.5 ± 2.6 | 0.303(0.34) | 0.000(2.65) | 0.000(2.49) |
| Concern about falls (FES-I) | 20.2 ± 3.6 | 26.1 ± 13.4 | 22.9 ± 11.4 | 0.007(0.59) | 0.326(0.32) | 0.199(0.25) |
| Depression (CES-D) | 6.5 ± 5.7 | 9.7 ± 7.2 | 10.8 ± 7.1 | 0.014(0.49) | 0.012(0.65) | 0.477(0.15) |
| Medications | 2.4 ± 1.8 | 4.6 ± 3.6 | 4.6 ± 4.9 | 0.002(0.77) | 0.034(0.60) | 0.968(0.01) |
| Comorbidities | 2.3 ± 1.8 | 3.9 ± 2.1 | 4.3 ± 2.1 | 0.000(0.81) | 0.002(1.03) | 0.519(0.19) |
| Correlation, rho (p-Value) † | |
|---|---|
| Sleep Parameters | |
| Time in Bed, h | 0.24(0.002) * |
| Sleep Onset Latency, min | −0.10(0.201) |
| Total Sleep Time, h | 0.26(0.001) * |
| Sleep Efficiency, % | 0.12(0.129) |
| Sleep Supine, % | 0.05(0.489) |
| Sleep Prone, % | −0.10(0.095) |
| Sleep Sides, % | 0.21(0.007) * |
| Physical Activity | |
| Sedentary, h | −0.29(0.000) * |
| Sedentary, % | −0.30(0.000) * |
| Light, h | 0.24(0.003) * |
| Light, % | 0.28(0.000) * |
| Moderate-to-Vigorous, min | 0.29(0.000) * |
| Moderate-to-Vigorous, % | 0.27(0.001) * |
| Sitting, % | 0.01(0.829) |
| Standing, % | 0.19(0.020) * |
| Walking, % | 0.34(0.000) * |
| Lying, % | −0.10(0.050) * |
| Number of Steps, 1K | 0.33(0.000) * |
| Physically Robust (PR+Cog+) | Signs of Frailty Phenotype (PR-) | PR+ Cog+ Vs PR-Cog+ | PR+Cog+ Vs PR-Cog- | PR-Cog+ Vs PR-Cog- | ||
|---|---|---|---|---|---|---|
| High Cognitive performance (PR-Cog+) | Cognitive Impairment Risk (PR-Cog-) | |||||
| Mean ± SD | p-Value (Effect Size) | |||||
| Sleep Parameters | ||||||
| Time in Bed, h* | 8.2 ± 2.0 | 7.3 ± 2.1 | 6.4 ± 2.1 | 0.023(0.45) | 0.000(0.91) | 0.037(0.45) |
| Total Sleep Time, h | 6.1 ± 1.5 | 5.5 ± 1.9 | 4.6 ± 1.9 | 0.082(0.36) | 0.001(0.88) | 0.024(0.47) |
| Sleep Onset Latency, min | 16.8 ± 7.7 | 18.7 ± 8.0 | 19.7 ± 8.5 | 0.227(0.24) | 0.144(0.36) | 0.551(0.13) |
| Wake After Sleep Onset, h | 1.7 ± 0.8 | 1.4 ± 0.7 | 1.4 ± 0.7 | 0.005(0.55) | 0.004(0.72) | 0.438(0.17) |
| Sleep Efficiency, % | 78.1 ± 9.3 | 78.6 ± 10.8 | 76.5 ± 12.0 | 0.818(0.05) | 0.548(0.15) | 0.378(0.18) |
| Sleep Supine, % | 45.1 ± 20.3 | 42.6 ± 26.4 | 44.0 ± 24.4 | 0.593(0.11) | 0.855(0.05) | 0.792(0.06) |
| Sleep Prone, % | 13.7 ± 17.3 | 12.4 ± 18.2 | 19.3 ± 20.4 | 0.712(0.07) | 0.222(0.29) | 0.088(0.36) |
| Sleep Sides, % | 33.8 ± 17.3 | 33.6 ± 23.9 | 20.8 ± 22.9 | 0.952(0.01) | 0.018(0.64) | 0.009(0.55) |
| Physical Activity Parameters | ||||||
| Sedentary, h | 9.5 ± 2.6 | 11.9 ± 3.8 | 12.9 ± 2.7 | 0.000(0.73) | 0.000(1.29) | 0.146(0.32) |
| Sedentary, %* | 70.3 ± 12.9 | 81.0 ± 8.9 | 85.9 ± 6.4 | 0.000(0.96) | 0.000(1.52) | 0.022(0.64) |
| Light, h | 3.2 ± 1.3 | 2.4 ± 1.2 | 1.9 ± 0.9 | 0.002(0.57) | 0.000(1.10) | 0.045(0.49) |
| Light, %* | 23.5 ± 10.0 | 16.9 ± 7.7 | 12.9 ± 5.4 | 0.000(0.75) | 0.000(1.33) | 0.024(0.60) |
| Moderate-to-Vigorous, min | 49.3 ± 31.6 | 19.2 ± 20.5 | 11.2 ± 14.1 | 0.000(1.13) | 0.000(1.56) | 0.116(0.45) |
| Moderate-to-Vigorous, % | 6.1 ± 4.1 | 2.2 ± 2.3 | 1.3 ± 1.6 | 0.000(1.17) | 0.000(1.55) | 0.155(0.45) |
| Sitting, % | 44.1 ± 15.7 | 47.5 ± 16.4 | 43.8 ± 18.9 | 0.287(0.21) | 0.951(0.01) | 0.314(0.21) |
| Standing, % | 16.8 ± 5.9 | 13.4 ± 6.0 | 11.5 ± 5.0 | 0.003(0.56) | 0.000(0.96) | 0.133(0.35) |
| Walking, %* | 8.7 ± 4.0 | 5.2 ± 3.4 | 2.6 ± 2.3 | 0.000(0.95) | 0.000(1.87) | 0.001(0.91) |
| Lying, % | 30.3 ± 16.0 | 33.8 ± 19.9 | 42.1 ± 21.8 | 0.352(0.19) | 0.015(0.61) | 0.052(0.40) |
| Number of Steps, 1K * | 6.1 ± 3.1 | 3.4 ± 2.2 | 1.8 ± 1.6 | 0.000(0.99) | 0.000(1.74) | 0.002(0.86) |
© 2020 by the authors. Licensee MDPI, Basel, Switzerland. This article is an open access article distributed under the terms and conditions of the Creative Commons Attribution (CC BY) license (http://creativecommons.org/licenses/by/4.0/).
Share and Cite
Razjouyan, J.; Najafi, B.; Horstman, M.; Sharafkhaneh, A.; Amirmazaheri, M.; Zhou, H.; Kunik, M.E.; Naik, A. Toward Using Wearables to Remotely Monitor Cognitive Frailty in Community-Living Older Adults: An Observational Study. Sensors 2020, 20, 2218. https://doi.org/10.3390/s20082218
Razjouyan J, Najafi B, Horstman M, Sharafkhaneh A, Amirmazaheri M, Zhou H, Kunik ME, Naik A. Toward Using Wearables to Remotely Monitor Cognitive Frailty in Community-Living Older Adults: An Observational Study. Sensors. 2020; 20(8):2218. https://doi.org/10.3390/s20082218
Chicago/Turabian StyleRazjouyan, Javad, Bijan Najafi, Molly Horstman, Amir Sharafkhaneh, Mona Amirmazaheri, He Zhou, Mark E. Kunik, and Aanand Naik. 2020. "Toward Using Wearables to Remotely Monitor Cognitive Frailty in Community-Living Older Adults: An Observational Study" Sensors 20, no. 8: 2218. https://doi.org/10.3390/s20082218
APA StyleRazjouyan, J., Najafi, B., Horstman, M., Sharafkhaneh, A., Amirmazaheri, M., Zhou, H., Kunik, M. E., & Naik, A. (2020). Toward Using Wearables to Remotely Monitor Cognitive Frailty in Community-Living Older Adults: An Observational Study. Sensors, 20(8), 2218. https://doi.org/10.3390/s20082218