Abstract
Assessing and keeping control of the mechanical properties of sport surfaces is a relevant task in sports since it enables athletes to train and compete safely and under equal conditions. Currently, different tests are used for assessing athlete- and ball-surface interactions in artificial turf pitches. In order to make these evaluations more agile and accessible for every facility, it is important to develop new apparatus that enable to perform the tests in an easier and quicker way. The existing equipment for determining the vertical ball behavior requires a complex and non-easily transportable device in which the ball must be fixed to the upper part of the frame in a very precise position by means of a magnet. The rebound height is determined by capturing the acoustic signal produced when the ball bounces on the turf. When extended tests are conducted, the time required to evaluate a single field is too high due to the non-valid trials. This work proposes a novel methodology which allows to notoriously decrease the time of testing fields maintaining the repeatability and accuracy of the test method together with a compact device for improving its mobility and transport. Simulations and experiments demonstrates the repeatability and accuracy of the results obtained by the proposed device, which decreases the non-valid trials and notoriously reduces the time for field evaluation.
1. Introduction
Artificial turf football pitches are one of the most commonly used sports facilities worldwide. These facilities contribute significantly to the development of football at all levels and all ages, representing a very important resource for sports practice in most societies and contexts [1]. Artificial turf systems offer considerable advantages compared to natural grass pitches since the formers are much less sensitive to frequent use and inclement weather [2,3]. Although first-and-second generation artificial turf had some disadvantages such as distorted behavior of the ball and increased risk of injury [4] with the connected social costs for orthopedic [5] or dental rehabilitations [6], the quality of modern artificial turf systems is such that the governing bodies of football currently accept the use of third-generation artificial turf systems in official competitions. These systems are characterized by long fibers in the carpet (40–65 mm), a relatively low tuft density, and, most of all, the presence of large quantities of infill in comparison to first or second generation products, with usually a sand layer at the base and crumbed rubber at the top [7]. Also, a shockpad layer is often placed underneath the grass carpet [8].
Previous studies have identified the condition of the playing surface as a parameter that affects football players’ safety and performance [2,9,10]. Therefore, to promote football in a responsible way and to safeguard the safety and the integrity of the performance of all athletes, it should be permanently guaranteed that these surfaces comply with appropriate quality standards [8]. To do so, any artificial turf football pitch, new or used, should be submitted periodically to maintenance tasks and evaluation tests to ensure that its surface has been installed correctly and meets those quality standards. Whilst the maintenance tasks would depend on different factors such as hours of use, climate conditions or wear, the evaluation tests will allow to assess anytime the sport functionality of the surface, helping to plan the maintenance activities more effectively and increasing the impact of these actions and the performance and durability of the artificial surface.
The on-site evaluation of artificial turf pitches is developed using mechanical devices that enable properties to be measured directly on the installed surface by performing tests that somehow reproduce ball and athlete interactions with the ground in a real game situation. Although some of these tests might be excessively simplistic when mimicking human and ball movement [11,12,13,14], they still are recognized by most of the international standards and sports federations as being appropriate for the assessment and regulation of sports surfaces, since they represent a practical and reproducible tool for predicting surface behavior during athletic movements. Therefore, mechanical tests are useful because they allow surfaces to be compared and provide evidence whether they meet certain specification standards [15].
Two different organizations have issued regulations seeking to ensure quality of artificial turf football pitches: the European Committee for Standardization (CEN) and the Fédération Internationale de Football Association (FIFA). Thus, the European standard EN 15330-1 [16], issued by the CEN, and the Quality Programme for Football Turf [17], issued by the FIFA, are the two regulations under which the quality of an artificial turf football pitch can be evaluated. While the EN 15330-1 standard is intended to apply to surfaces used for community, educational and recreational sport, FIFA specifications are more focused on professional and elite levels of competition.
Generally, the tests methods stipulated in both the CEN and the FIFA regulations are old and complex, and due to the current development of technology they are certainly becoming out of date and, in some cases, inaccurate. This adversely affects the quality control of artificial turf football pitches as it slows down the data collection processes and increases the margins of error and the evaluation costs. Thus, although some other sports federations faced the task of renewing their test methods several years ago [18], most of the methods currently applicable to artificial turf football pitches have been outdated for a long time. Therefore, to develop simpler test methods that allow a quicker and more accessible evaluation of artificial turf surfaces is a measure that would benefit all parties, from the managing bodies of the facilities to the athletes themselves.
The requirements that installed artificial turf football surfaces must meet to ensure that the facility is suitable for the intended use can be generally divided into two different groups: those affecting athlete-surface interaction and those affecting ball-surface interaction. Regarding the later, a test method to assess the vertical ball rebound is included in both the CEN (European standard EN 12235) and the FIFA requirements (FIFA Test Method 01) [17]. In both cases, the test consists in a football falling vertically on the surface from a height of 2.00 ± 0.01 m (measured from the bottom of ball) without imparting any impulse or spin. After the ball hits the ground, the height to which it bounces is estimated by acoustic methods, and the percentage that the rebound height represents with respect to the initial dropping height is calculated.
Besides the complexity of the test due to the configuration and assembly of its components, which makes it one of the most time consuming and labor intensive tests for football pitches, this ball rebound test also lacks precision, since it estimates the rebound height from acoustic signals and this can induce errors, especially in windy conditions and noisy environments. To overcome this problem, a new device to evaluate the ball rebound has been developed. The objective of this study was to establish the accuracy of the new apparatus and compare it with that of the traditional method. The new test should facilitate the evaluation of the ball rebound in artificial turf football pitches, contributing to that the managing bodies of these facilities carry out a more systematic and exhaustive control of the functionality of the surface, decreasing notoriously the time for turf evaluation.
2. Novel Methodology
2.1. Standard Test Method
The principle of the test consists on releasing a ball from 2 m and determining the height of its first rebound from the surface.
For height estimation, an acoustic sensor records the time between the first and the second impact.
According to [17], for each test the rebound height can be determined by:
being the rebound height, T the time between first and second impact and s. The output value of ball rebound must be rounded to the nearest 0.01 m, since the allowed uncertainty of measurement is m.
The actual requirements of the device for ensuring a proper measurement are [17,19]:
- An electromagnetic or vacuum release mechanism that allows the ball to fall vertically from 2.00 ± 0.01 m (measured from the bottom of ball) without imparting any impulse or spin.
- Vertical scale to allow the drop height of the ball to be established.
- Timing device, activated acoustically, capable of measuring to an accuracy of 1 ms.
- Means of measuring wind speed to an accuracy of 0.1 m/s (field tests only).
Figure 1 illustrates the sequence of events of the conventional test method, where time between first and second impact is .
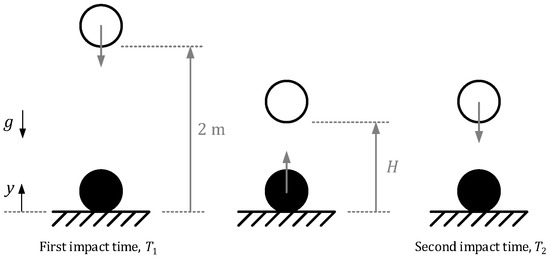
Figure 1.
Conventional test method scenario.
2.2. Novel Proposal
The main disadvantages of the conventional test method are [17,19]:
- Slight initial spin is exerted and the rebound is not vertical.
- Acoustic measurement uses to yield incorrect measurement owing to any acoustic disturbance.
- Moderate wind presence yields to non-uniform rebound or acoustic disturbance and annuls the test.
Assuming a point mass model, the differential equation of the conventional test method is:
being the vertical component of the ball movement, m the mass of the ball, c the viscous friction coefficient and g the gravity acceleration. For reproducing the dynamics of the test method the differential Equation (2) must be solved with the initial conditions m, being D the diameter of the ball, and m/s. The ball rebound height corresponds to the maximum value of after the first rebound.
In order to improve the conventional test method, a more direct estimation of the height of the rebound avoiding disturbances would be desirable. This proposal is based on modifying the free fall movement by a restricted movement as shown in Figure 2.

Figure 2.
Proposed test method scenario.
Assuming a point mass model, the differential equation of the proposed test method is:
where is the beam angle with regards to horizontal plane. In this sense, the rebound height can be directly determined by measuring and:
Differential Equation (3) should be solved imposing a initial condition rad and rad/s such as m.
The rebound height ca be therefore obtained by means of:
being the maximum angle measured by the encoder placed at the revolute joint after the first rebound.
This proposal avoids non-desired initial spin, non-uniform rebounds and it does not depend of any acoustic signal to measure the time between rebounds, and can directly obtain the rebound height by measuring angle , for example with an encoder.
Time constant of both dynamic models, (2) and (3), are different and the time that the ball takes in executing the trajectory is also different.
Nevertheless, for both models, the potential energy converts to kinetic energy and the rebound height should be similar.
On the other hand, the rebound is modeled by means for the coefficient of restitution (COR), assuming that the kinetic energy before and after the rebound is related by means of the COR, and:
being the time before rebound and the time after it.
3. Simulated Results
3.1. Preliminaries
In this section we present the dynamic simulations of both models. The simulations have been carried out using Simulink of Matlab software (R2019b, MathWorks, Massachusetts, United States). Sample time has been fixed to 1 ms.
The collision between turf and ball (Adidas conext 19, Adidas, Herzogenaurach, Germany) has been modeled using a illustrative coefficient of restitution of 0.825 (concrete) has been set and compared to the coefficient of restitution of artificial turf, 0.65 [20], but the analysis presented here is valid for any other values.
3.2. Comparative Results
Table 1 summaries the parameters used for the conventional test method since Figure 3 represents the evolution of the vertical coordinate of the ball during the test.

Table 1.
Simulation parameter of the conventional test method.
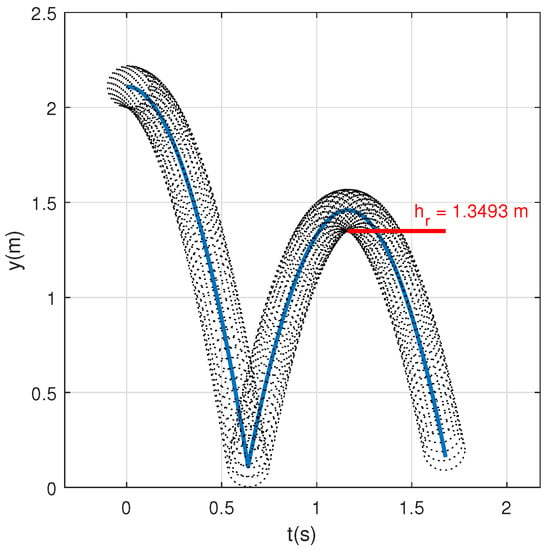
Figure 3.
Conventional test method simulation.
As reported in [17], the vertical ball rebound height should be 1.35 m when ball rebound on concrete. In this sense, for adjusting the COR value of the surface, a range of COR has been simulated, choosing the COR value which provides the nearest value of rebound height to 1.35 m. The chosen value of COR is 0.825 which provides a value of rebound height 1.3493 m. (≈1.35 m).
In analogous way, Table 2 summaries the parameters used for the test method proposed here and Figure 3 represents the evolution of the angle of the beam, to be measured, and the vertical coordinate of the ball during the test.

Table 2.
Simulation parameter of the proposal test method.
Note that using the same COR (0.825) the obtained vertical ball is 1.3552 m, very close to the obtained with the conventional method (Figure 4).
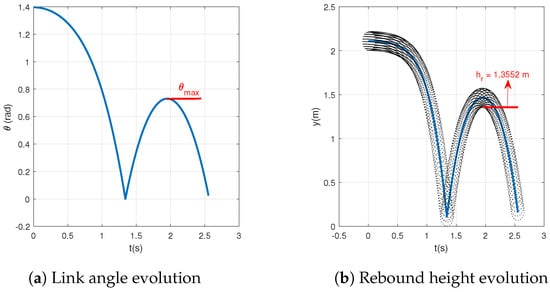
Figure 4.
Proposed test method simulation.
The difference between both methods is the time that ball takes to rebound but the rebound maintains constant.
Figure 5 compares the aforementioned simulations (conventional vs. proposal) by changing the COR in a reasonable range [0.3, 0.9]. Note that the linear fit is almost perfect, with a coefficient of correlation near to 1, and height of ball rebound are similar for both methods. Matlab software Curve Fitting Tool (R2019b, MathWorks, Massachusetts, United States) was used to obtain the statistical data.
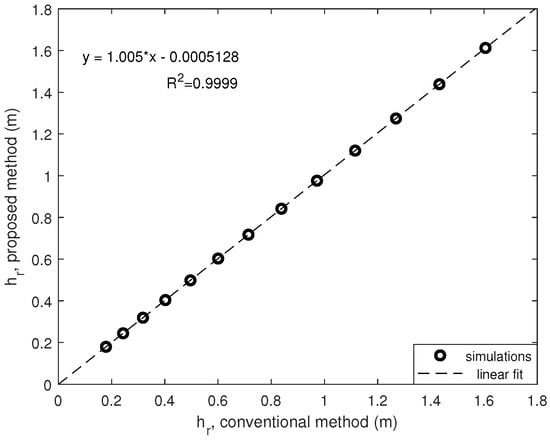
Figure 5.
Ball rebound for different COR values: conventional vs. proposed.
This result allows designing a device based in this proposal with the main advantage that the measurement of the height of the ball rebound does not require any acoustic sensor and a conventional encoder, placed at the joint of the beam, can be used for a directly measurement.
Finally, the simulated results have been compared to the experiments for validation purpose (Section 4.2). The comparison yields that model (3) is valid for describing the dynamics of the device (detailed in Section 4.1).
3.3. Scaling the Problem
In order to develop a more compact device based on this proposal, an analysis of the implications of scaling the problem is required.
Let’s assume that for the proposed method the length of the beam, , is the half of the original one, i.e., 1 m. If we replicate the previous result by changing the length of the beam to 1 meter the results are represented in Figure 6.
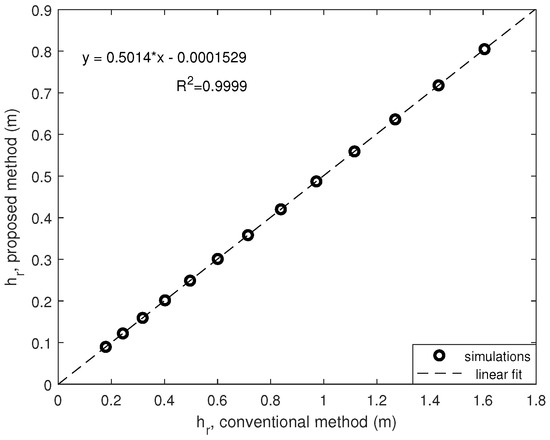
Figure 6.
Ball rebound for different COR values: conventional vs. proposed.
Note that the goodness of the linear fit is almost perfect () and the expected height of ball rebound is the half of the conventional one when decreasing the length of the beam to the half of the equivalent one.
In this sense, simulation results show that a compact device for ball rebound test method can be designed based in this proposal and the height of the rebound can be obtained as:
being the rebound height obtained using as beam length.
4. Experimental Results
4.1. Prototype and Height of Ball Rebound
The first prototype for testing this proposal is shown in Figure 7.
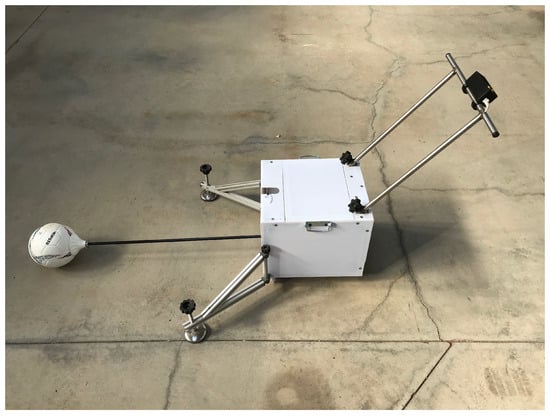
Figure 7.
First prototype.
The prototype has an aluminum frame covered by a polycarbonate case. Inside the frame, a motor/gearbox set lifts the set beam/ball up to 80 and allows the beam to fall down. An incremental encoder obtains the angular position of the beam and it is registered in a microcontroller.
The length of the beam is 1 m for compacting purpose and the equivalent height of the rebound can be therefore obtained as:
being C an invariant coefficient that should be experimentally determined, the height of the ball rebound of the novel device and the maximum angle measured by the encoder after the first rebound.
The beam is a 10 mm of diameter carbon fiber tube and the ball is attached to the tip by means of a part printed in PLA (polylactic acid).
4.2. Device Validation
For determining vertical rebound height is only required to obtain the maximum angle after the first ball rebound (). Nevertheless, in order to validate the dynamics model (3) a set of experiments obtaining the whole ball trajectory (movement / impact / rebound movement) has been developed.
Controller has been configured to determine the angle of the ball, , during all the trajectory using a sample time of 10 ms.
In order to demonstrate the repeatability of the device, not only in the final value of the rebound height (see Section 4.4), but also the trajectory of the ball, Figure 8 represents the trajectory of the ball for a set of 10 experiments in a concrete surface. Note that all the trajectories described by the ball during the 10 different test are similar. The maximum error committed between the 10 test is 0.87cm.
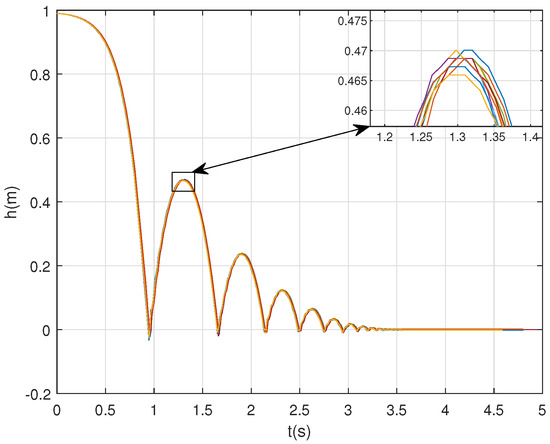
Figure 8.
Experimental results: trajectory of the ball. Set of 10 tests for model validation purpose.
Once that we have demonstrated that the device provides repeatable trajectories of the ball, we are going to compare the experimental results with the mathematical model (3).
Using the parameters shown in Table 3, Figure 9 compares simulation result to the experimental one (e.g., test 5).

Table 3.
Simulation parameter for model validation
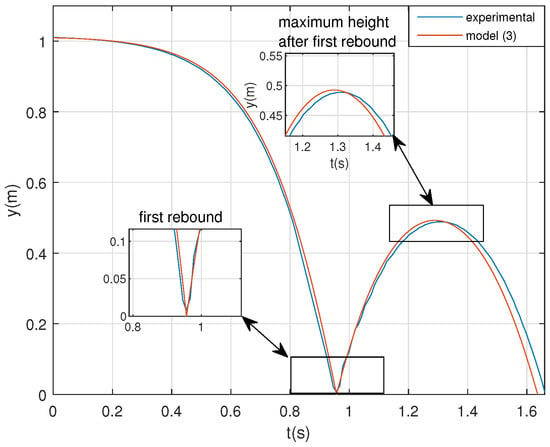
Figure 9.
Simulation vs. experimental result.
Note that, although some time delay between both results is noticeable after the first rebound, model (3) describes the dynamics of the real prototype. In this sense, the results demonstrate that model (3) is accurate enough (more than a fit of 80%, see e.g., [21]) for describing the dynamics of the system. Other effects such as non-linear friction, complex impact models or aerodynamics force, are not needed and simple model (3) is enough to describe the dynamics of the device.
4.3. Calibration Test
The first set of experiments allows to obtain the linear coefficient which relates the height of the novel device with regards to the conventional one. Attending to [17], a initial test on concrete should be carried out to adjust the pressure of the ball for a rebound height of 1.35 m with the conventional device. For this calibration a set of 20 experiments on concrete has been carried out with both devices. The obtained results are summarized in Table 4.

Table 4.
Calibration tests: concrete surface.
Using the Method of Least Squares the value of coefficient C of [8] can be easily obtained and yields, . In this sense, the calibration equation for obtaining the ball rebound test results for this particular device is:
4.4. Repeatability and Accuracy
After the calibration procedure, a set of experiments to check the repeatability of the results is required. For this purpose, 3 different surfaces have been using both, conventional and novel device. A set of 20 tests has been carried out for each surface and for each device.
Figure 10 represents the Box Plot of the results of both devices for the 3 different surfaces. Matlab software (R2019b, MathWorks, Massachusetts, United States) was used to graph.
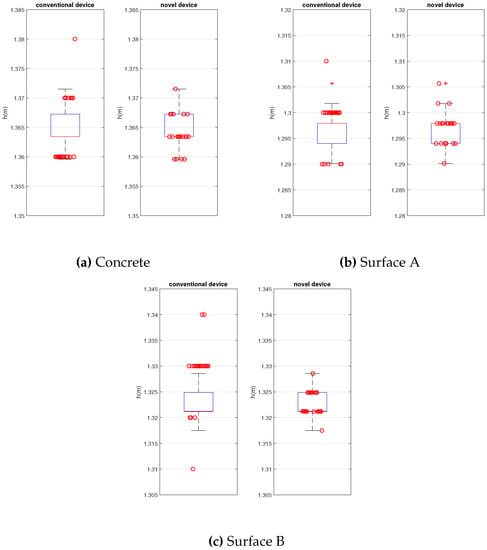
Figure 10.
Repeatability and accuracy tests.
Note that the results of both devices are very close in terms of value and dispersion. The proposed device results the same values of ball rebound that the conventional one and a bit lower dispersion.
4.5. Final Test: Turf Evaluation
For demonstrating the final application of the novel device for turf evaluation, a real artificial turf field has been tested with the conventional (certified device, see Figure 11) and novel device (see Figure 7) for comparison purpose. All the tests have been carried out following the Fifa Quality Programme procedure [17].
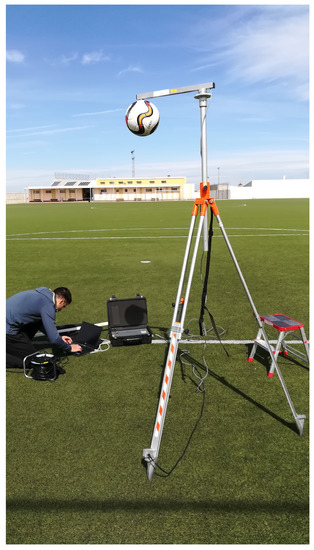
Figure 11.
Certified device for determining football rebound.
Table 5 and Figure 12 compares the obtained results of ball rebound test with both devices in the evaluation of Villacanas field (Toledo, Spain). Obtaining p-value between conventional and novel device results (Matlab software (R2019b, MathWorks, MA, USA) we can conclude that both results are analogous and no noticeable difference can be found between them (). Table 5 also includes test time, wasting time of non-valid tests, moving the equipment between zones and equipment setup.

Table 5.
Compared evaluation: Villacanas field.

Figure 12.
Compared evaluation: Villacanas field.
Owing to the preparation procedure of the conventional test and the acoustic based measurement, the effective time for evaluating the field with the conventional device (see Figure 11) was 65.2 min, since the time with the new device was about 8.30 min.
5. Conclusions
Assessing and keeping control of the mechanical properties of sport surfaces is a relevant task in sports since it enables athletes to train and compete safely and under equal conditions. This is particularly important in synthetic, complex surfaces whose properties evolve over time and usage, such as artificial turf pitches.
Currently, different tests are used for assessing athlete- and ball-surface interactions in artificial turf pitches. In order to make these evaluations more agile and accessible for every facility, it is important to develop new apparatus that enable to perform the tests in an easier and quicker way.
In this sense, the existing equipment for determining the vertical ball behavior requires a complex and non-easily transportable device (see Figure 1) in which the ball must be fixed to the upper part of the frame in a very precise position by means of a magnet. After release, the rebound height is determined by capturing the acoustic signal produced when the ball bounces on the turf. When extended tests are conducted, the time required to evaluate a single field is too high due to the non-valid trials (for undesired initial spin or acoustic interference) together with the waste of time that takes the user to gather the ball and fix it back to the magnet.
This work proposes a novel methodology which allows to notoriously decrease the time of testing fields maintaining the repeatability and accuracy of the test method together with a compact device for improving its mobility and transport (see Figure 7).
The proposal is based on fixing the ball to a very lightweight beam and reproducing the tests with a constraining rotational movement and estimating the rebound height with a conventional encoder placed in the rotational joint. By means of simulations we have demonstrated that the rebound height of both movements, the free and the rotational one, is the same and the problem can be also easily scalable.
A preliminary prototype has been built and tested based on this new proposal. This prototype has a motor/gearbox set which allows an automated placing of the ball at the beginning of the test and encoder to measure the angle of the beam during the test. The repeatability and the accuracy of the device have been experimentally tested over three surfaces.
Finally, a field has been evaluated with both devices for comparing purpose. The novel proposal maintains the quality of the evaluation but wastes much less time for the whole evaluation of the field. Additionally, the device can be used by a non-specialized user.
Author Contributions
Conceptualization, L.G. and F.J.C.-G.; methodology, S.J.-P. and A.G.-R.; software, D.R.-R.; validation, E.C., D.R.-R. and J.G.-U.; formal analysis, J.S.-S. and J.L.F.; investigation, S.J.-P., J.S.-S., A.G.-R. and J.L.F.; resources, J.S.-S. and J.L.F.; data curation, D.R.-R.; writing–original draft preparation, E.C. and L.C.-G.; writing–review and editing, E.C. and L.C.-G.; visualization, L.C.-G. and J.G.-U.; supervision, L.G. and F.J.C.-G.; project administration, L.G. and F.J.C.-G.; funding acquisition, L.G. and F.J.C.-G.. All authors have read and agreed to the published version of the manuscript.
Funding
This study was supported by the Government of Castilla-La Mancha (Consejería de Educación, Cultura y Deportes) and the European Regional Development Fund (FEDER) (Grant No. SBPLY/17/180501/000141).
Acknowledgments
EC acknowledges the Spanish Ministry of Education, Culture and Sport for funding the development of his PhD (Grant No. FPU15/04700). JGU acknowledges “Fondo Europeo de Desarrollo Regional, Programa Operativo de la Región de Castilla-La Mancha” (2018/11744) for funding the development of his research work.
Conflicts of Interest
The authors declare no conflict of interest.
References
- Burillo, P.; Gallardo, L.; Felipe, J.L.; Gallardo, A.M. Artificial turf surfaces: perception of safety, sporting feature, satisfaction and preference of football users. Eur. J. Sport Sci. 2014, 14, S437–S447. [Google Scholar] [CrossRef] [PubMed]
- Andersson, H.; Ekblom, B.; Krustrup, P. Elite football on artificial turf versus natural grass: movement patterns, technical standards, and player impressions. J. Sport Sci. 2008, 26, 113–122. [Google Scholar] [CrossRef] [PubMed]
- Sánchez-Sánchez, J.; García-Unanue, J.; Felipe, J.L.; Jiménez-Reyes, P.; Viejo-Romero, D.; Gómez-López, M.; Hernando, E.; Burillo, P.; Gallardo, L. Physical and physiological responses of amateur football players on third-generation artificial turf systems during simulated game situations. J. Strength Conditioning Res. 2016, 30, 3165–3177. [Google Scholar] [CrossRef] [PubMed]
- Lanzetti, R.; Ciompi, A.; Lupariello, D.; Guzzini, M.; De Carli, A.; Ferretti, A. Safety of third-generation artificial turf in male elite professional soccer players in Italian major league. Scandinavian J. Med. Sci. Sports 2017, 27, 435–439. [Google Scholar] [CrossRef] [PubMed]
- Brooks, M.A.; McGuine, T.A. Translating cost-effective injury prevention research into sustainable change on the playing field: the youth injury epidemic. Arch. Pediatrics Adolescent Med. 2011, 165, 1049–1050. [Google Scholar] [CrossRef] [PubMed]
- Scribante, A.; Vallittu, P.K.; Özcan, M. Fiber-reinforced composites for dental applications. BioMed. Res. Int. 2018, 2018. [Google Scholar] [CrossRef] [PubMed]
- Zanetti, E.M.; Bignardi, C.; Franceschini, G.; Audenino, A.L. Amateur football pitches: mechanical properties of the natural ground and of different artificial turf infills and their biomechanical implications. J. Sport Sci. 2013, 31, 767–778. [Google Scholar] [CrossRef] [PubMed]
- Sánchez-Sánchez, J.; García-Unanue, J.; Jiménez-Reyes, P.; Gallardo, A.; Burillo, P.; Felipe, J.L.; Gallardo, L. Influence of the mechanical properties of third-generation artificial turf systems on soccer players’ physiological and physical performance and their perceptions. PLoS ONE 2014, 9, e111368. [Google Scholar] [CrossRef] [PubMed]
- Brito, J.; Krustrup, P.; Rebelo, A. The influence of the playing surface on the exercise intensity of small-sided recreational soccer games. Hum. Mov. Sci. 2012, 31, 946–956. [Google Scholar] [CrossRef] [PubMed]
- Hughes, M.G.; Birdsey, L.; Meyers, R.; Newcombe, D.; Oliver, J.L.; Smith, P.M.; Stembridge, M.; Stone, K.; Kerwin, D.G. Effects of playing surface on physiological responses and performance variables in a controlled football simulation. J. Sport Sci. 2013, 31, 878–886. [Google Scholar] [CrossRef] [PubMed]
- Dixon, S.; Stiles, V. Impact absorption of tennis shoe-surface combinations. Sports Eng. 2003, 6, 1–9. [Google Scholar] [CrossRef]
- McGhie, D.; Ettema, G. Biomechanical analysis of surface-athlete impacts on third-generation artificial turf. Am. J. Sports Med. 2013, 41, 177–185. [Google Scholar] [CrossRef] [PubMed]
- Nigg, B.M. The validity and relevance of tests used for the assessment of sports surfaces. Med. Sci. Sports Exerc. 1990, 22, 131–139. [Google Scholar] [CrossRef] [PubMed]
- Yukawa, H.; Aduma, R.; Kawamura, S.; Kobayashi, K. Shock attenuation properties of sports surfaces with two dimensional impact test. Procedia Eng. 2012, 34, 855–860. [Google Scholar] [CrossRef]
- Colino, E.; Sánchez-Sánchez, J.; García-Unanue, J.; Ubago-Guisado, E.; Haxaire, P.; Le Blan, A.; Gallardo, L. Validity and reliability of two standard test devices in assessing mechanical properties of different sport surfaces. Polym. Test. 2017, 62, 61–67. [Google Scholar] [CrossRef]
- CEN-EN 15330-1. Surfaces for sports areas—Synthetic turf and needle-punched surfaces primarily designed for outdoor use—part 1: Specification for synthetic turf, CEN European Committee for Standardisation (2007). Available online: https://standards.globalspec.com/std/1628469/EN%2015330-1 (accessed on 18 March 2020).
- FIFA. FIFA Quality Programme for Football Turf - Handbook of Test Methods. 2015. Available online: https://football-technology.fifa.com/en/search/?q=Fifa+Quality+Programme (accessed on 18 March 2020).
- Miller, S. Accuracy of an automated system for measuring ball rebound height. Eng. Sportd 2004, 5, 125. [Google Scholar]
- BS EN 12235:2013. Surfaces for Sports Areas. Determination of Vertical Ball Behaviour. Available online: https://shop.bsigroup.com/ProductDetail/?pid=000000000030262909 (accessed on 18 March 2020).
- Brosnan, J.; McNitt, A.; Livingston, D. Developing an Apparatus to Evaluate the Pace of Baseball Field Playing Surfaces. 2005. Available online: https://plantscience.psu.edu/research/centers/ssrc/documents/brosnan-2005.pdf (accessed on 18 March 2020).
- Ljung, L. System identification. In Wiley Encyclopedia of Electrical and Electronics Engineering; John Wiley & Sons, Inc.: Hoboken, NJ, USA, 2001. [Google Scholar]
© 2020 by the authors. Licensee MDPI, Basel, Switzerland. This article is an open access article distributed under the terms and conditions of the Creative Commons Attribution (CC BY) license (http://creativecommons.org/licenses/by/4.0/).