Quantitative Infrared Thermography to Evaluate the Humidification of Lightweight Concrete


Abstract
1. Introduction
2. Methodology
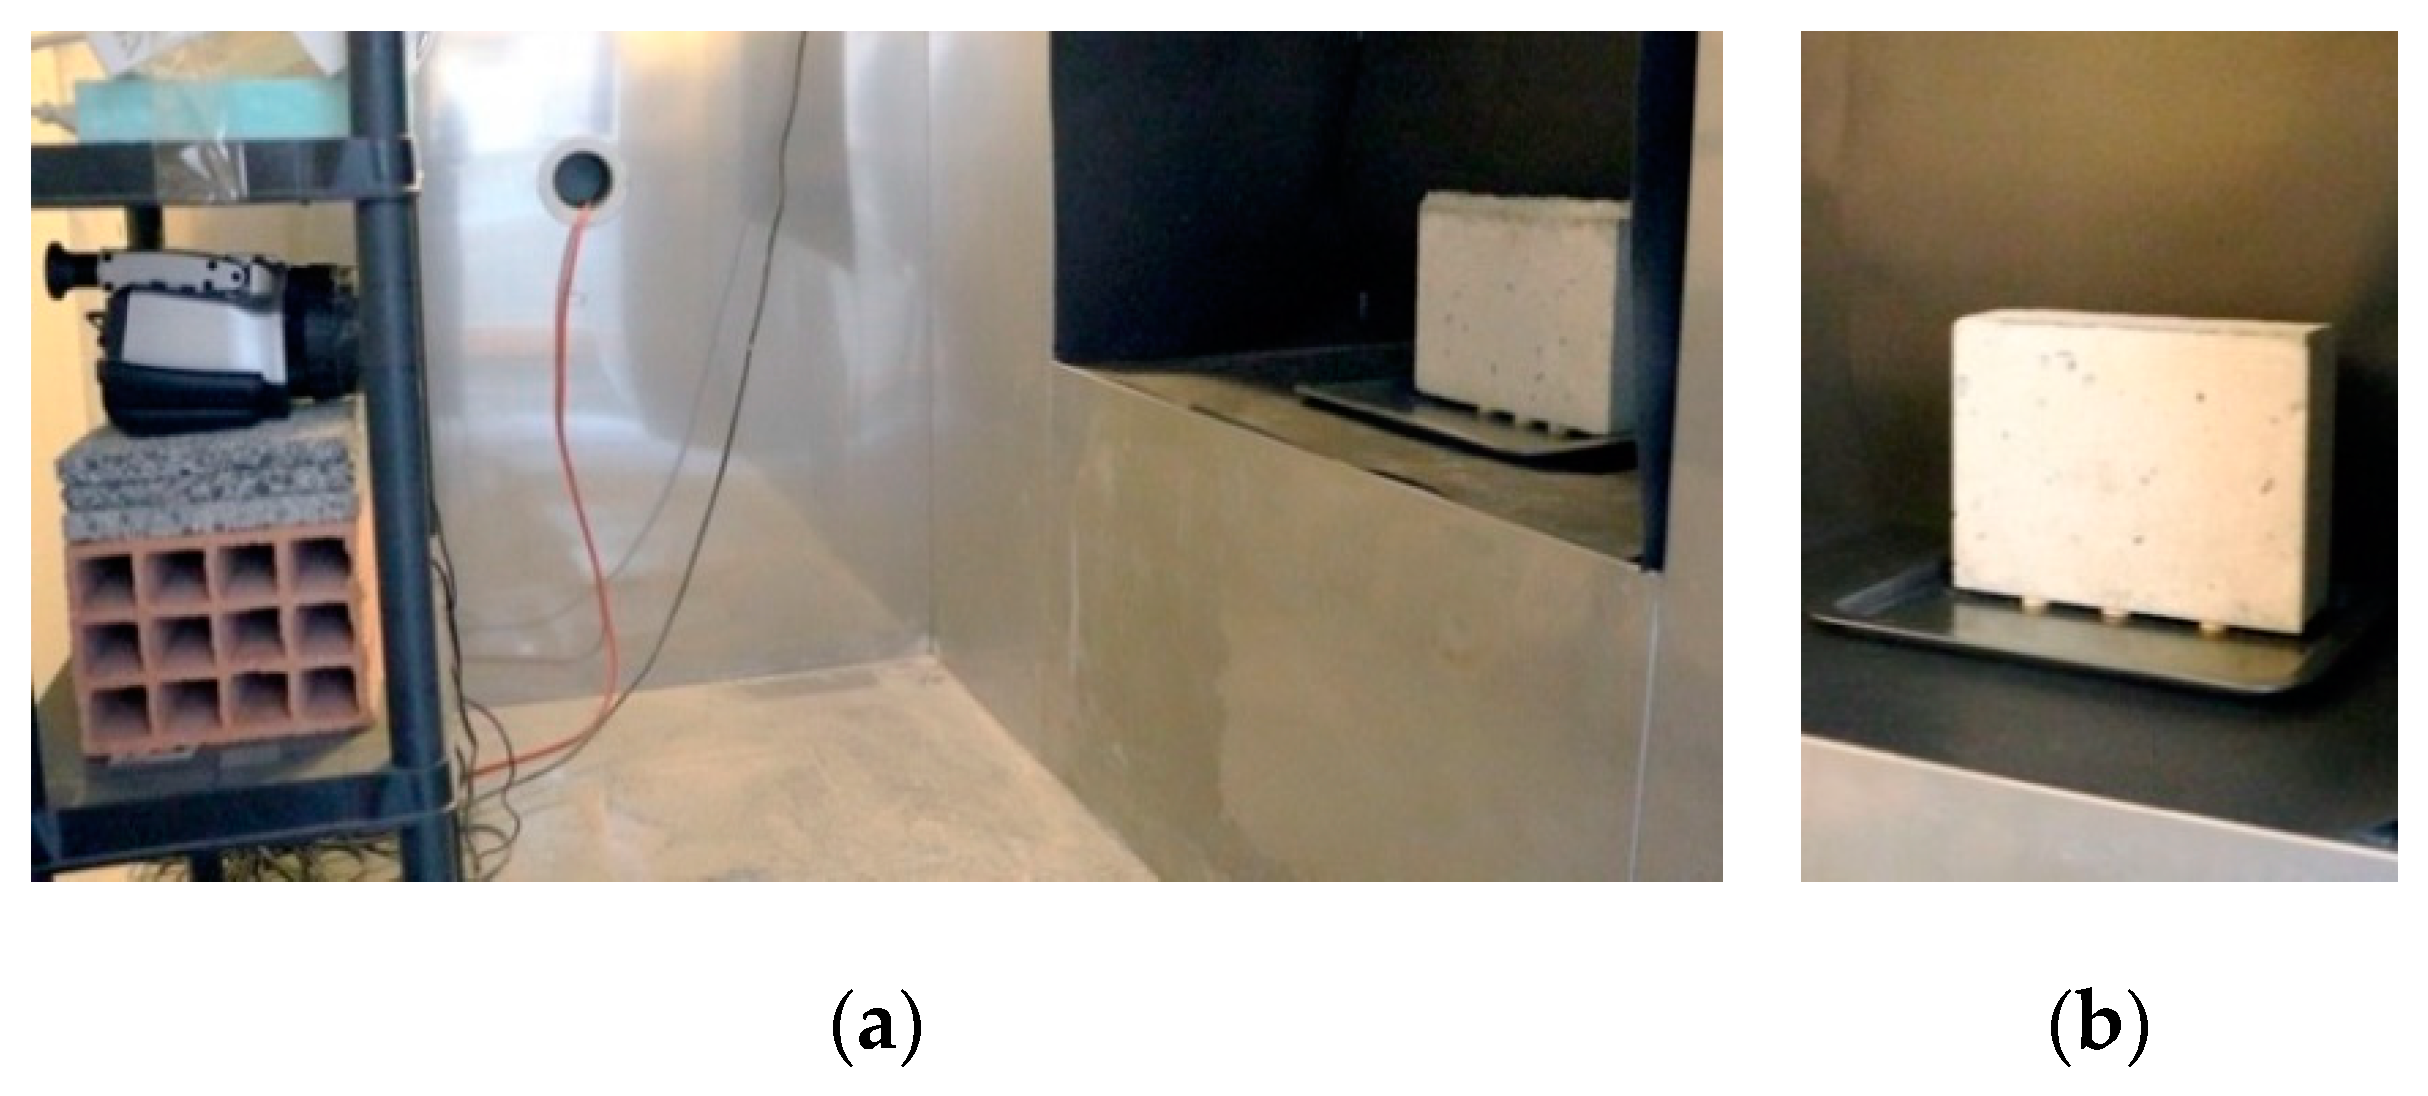
2.1. Test Procedures
2.2. Imaging Processing
- Step I
- The average surface temperature of the entire specimen was considered, and the statistic t-test was used to compare consecutive thermal images. With Step I, a reduction by one-half was expected.
- Step II
- Step II Only the average surface temperature of the boxes G, H, and I was considered, as the lower area of the specimen was deemed to be the most relevant in the phenomenon. Once more, the statistic t-test was used to compare consecutive thermal images aiming for a reduction by one-quarter.
3. Results
3.1. Phase 1—Pre-Processing
3.1.1. Sample Reduction
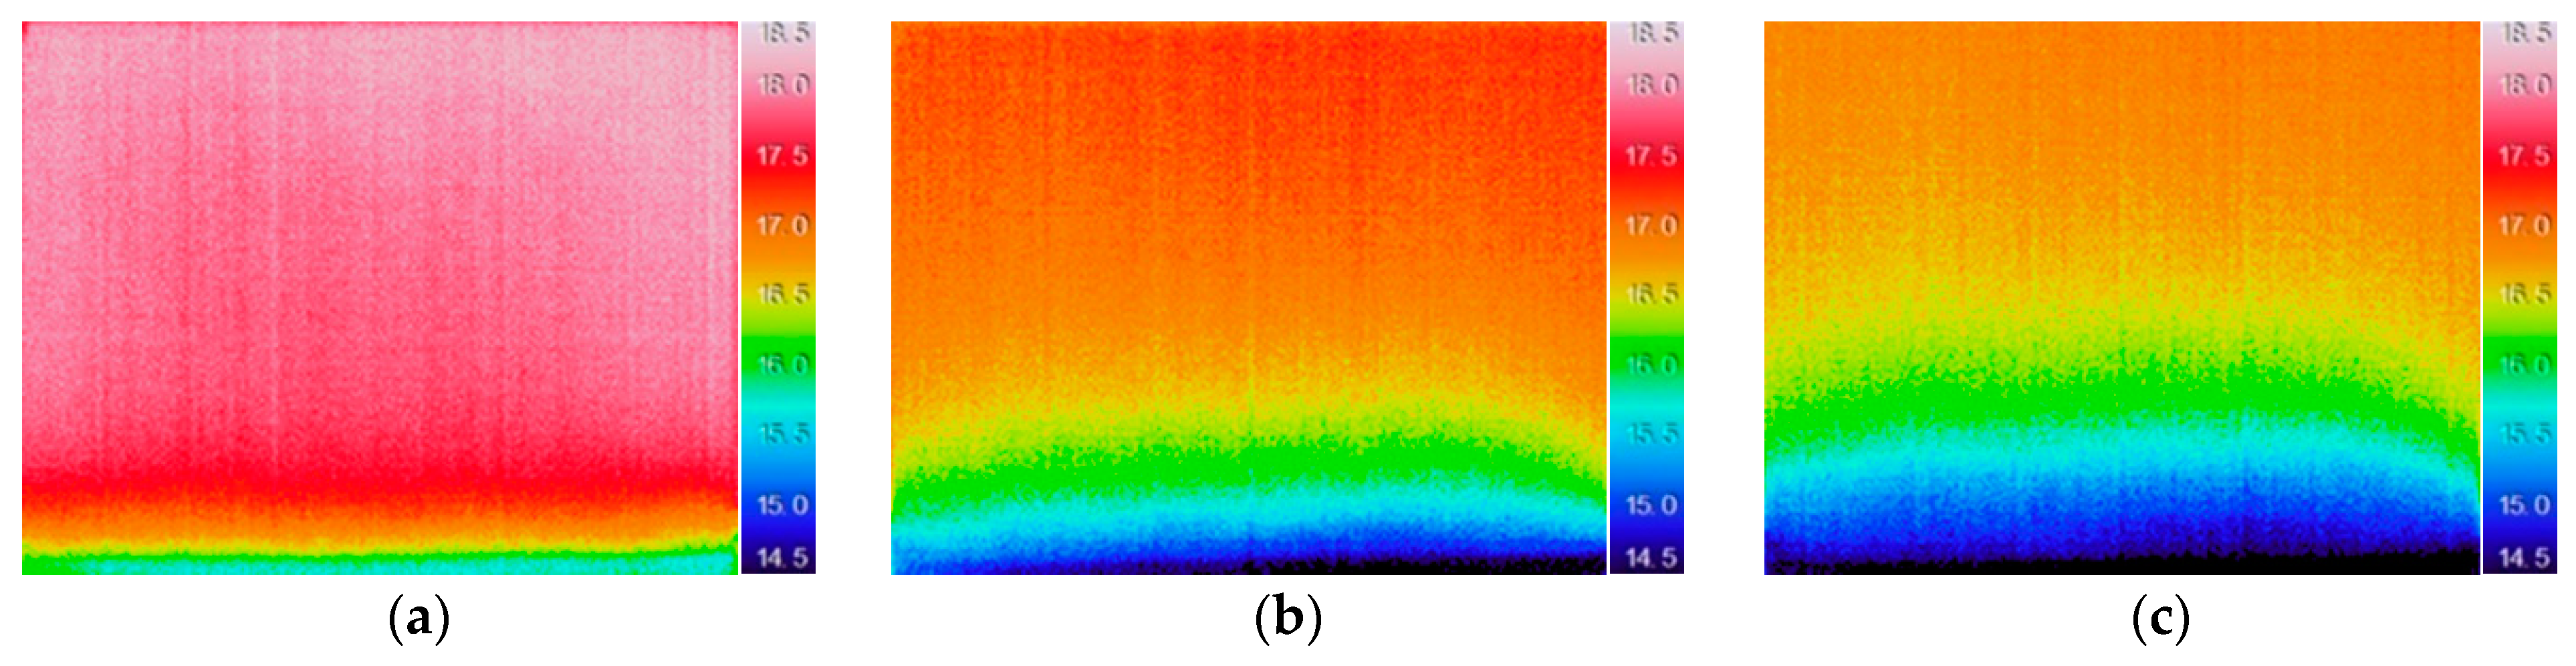
3.1.2. Surface Temperature over Time
3.2. Phase 2—Data Processing
3.2.1. Statistical Descriptive Analysis
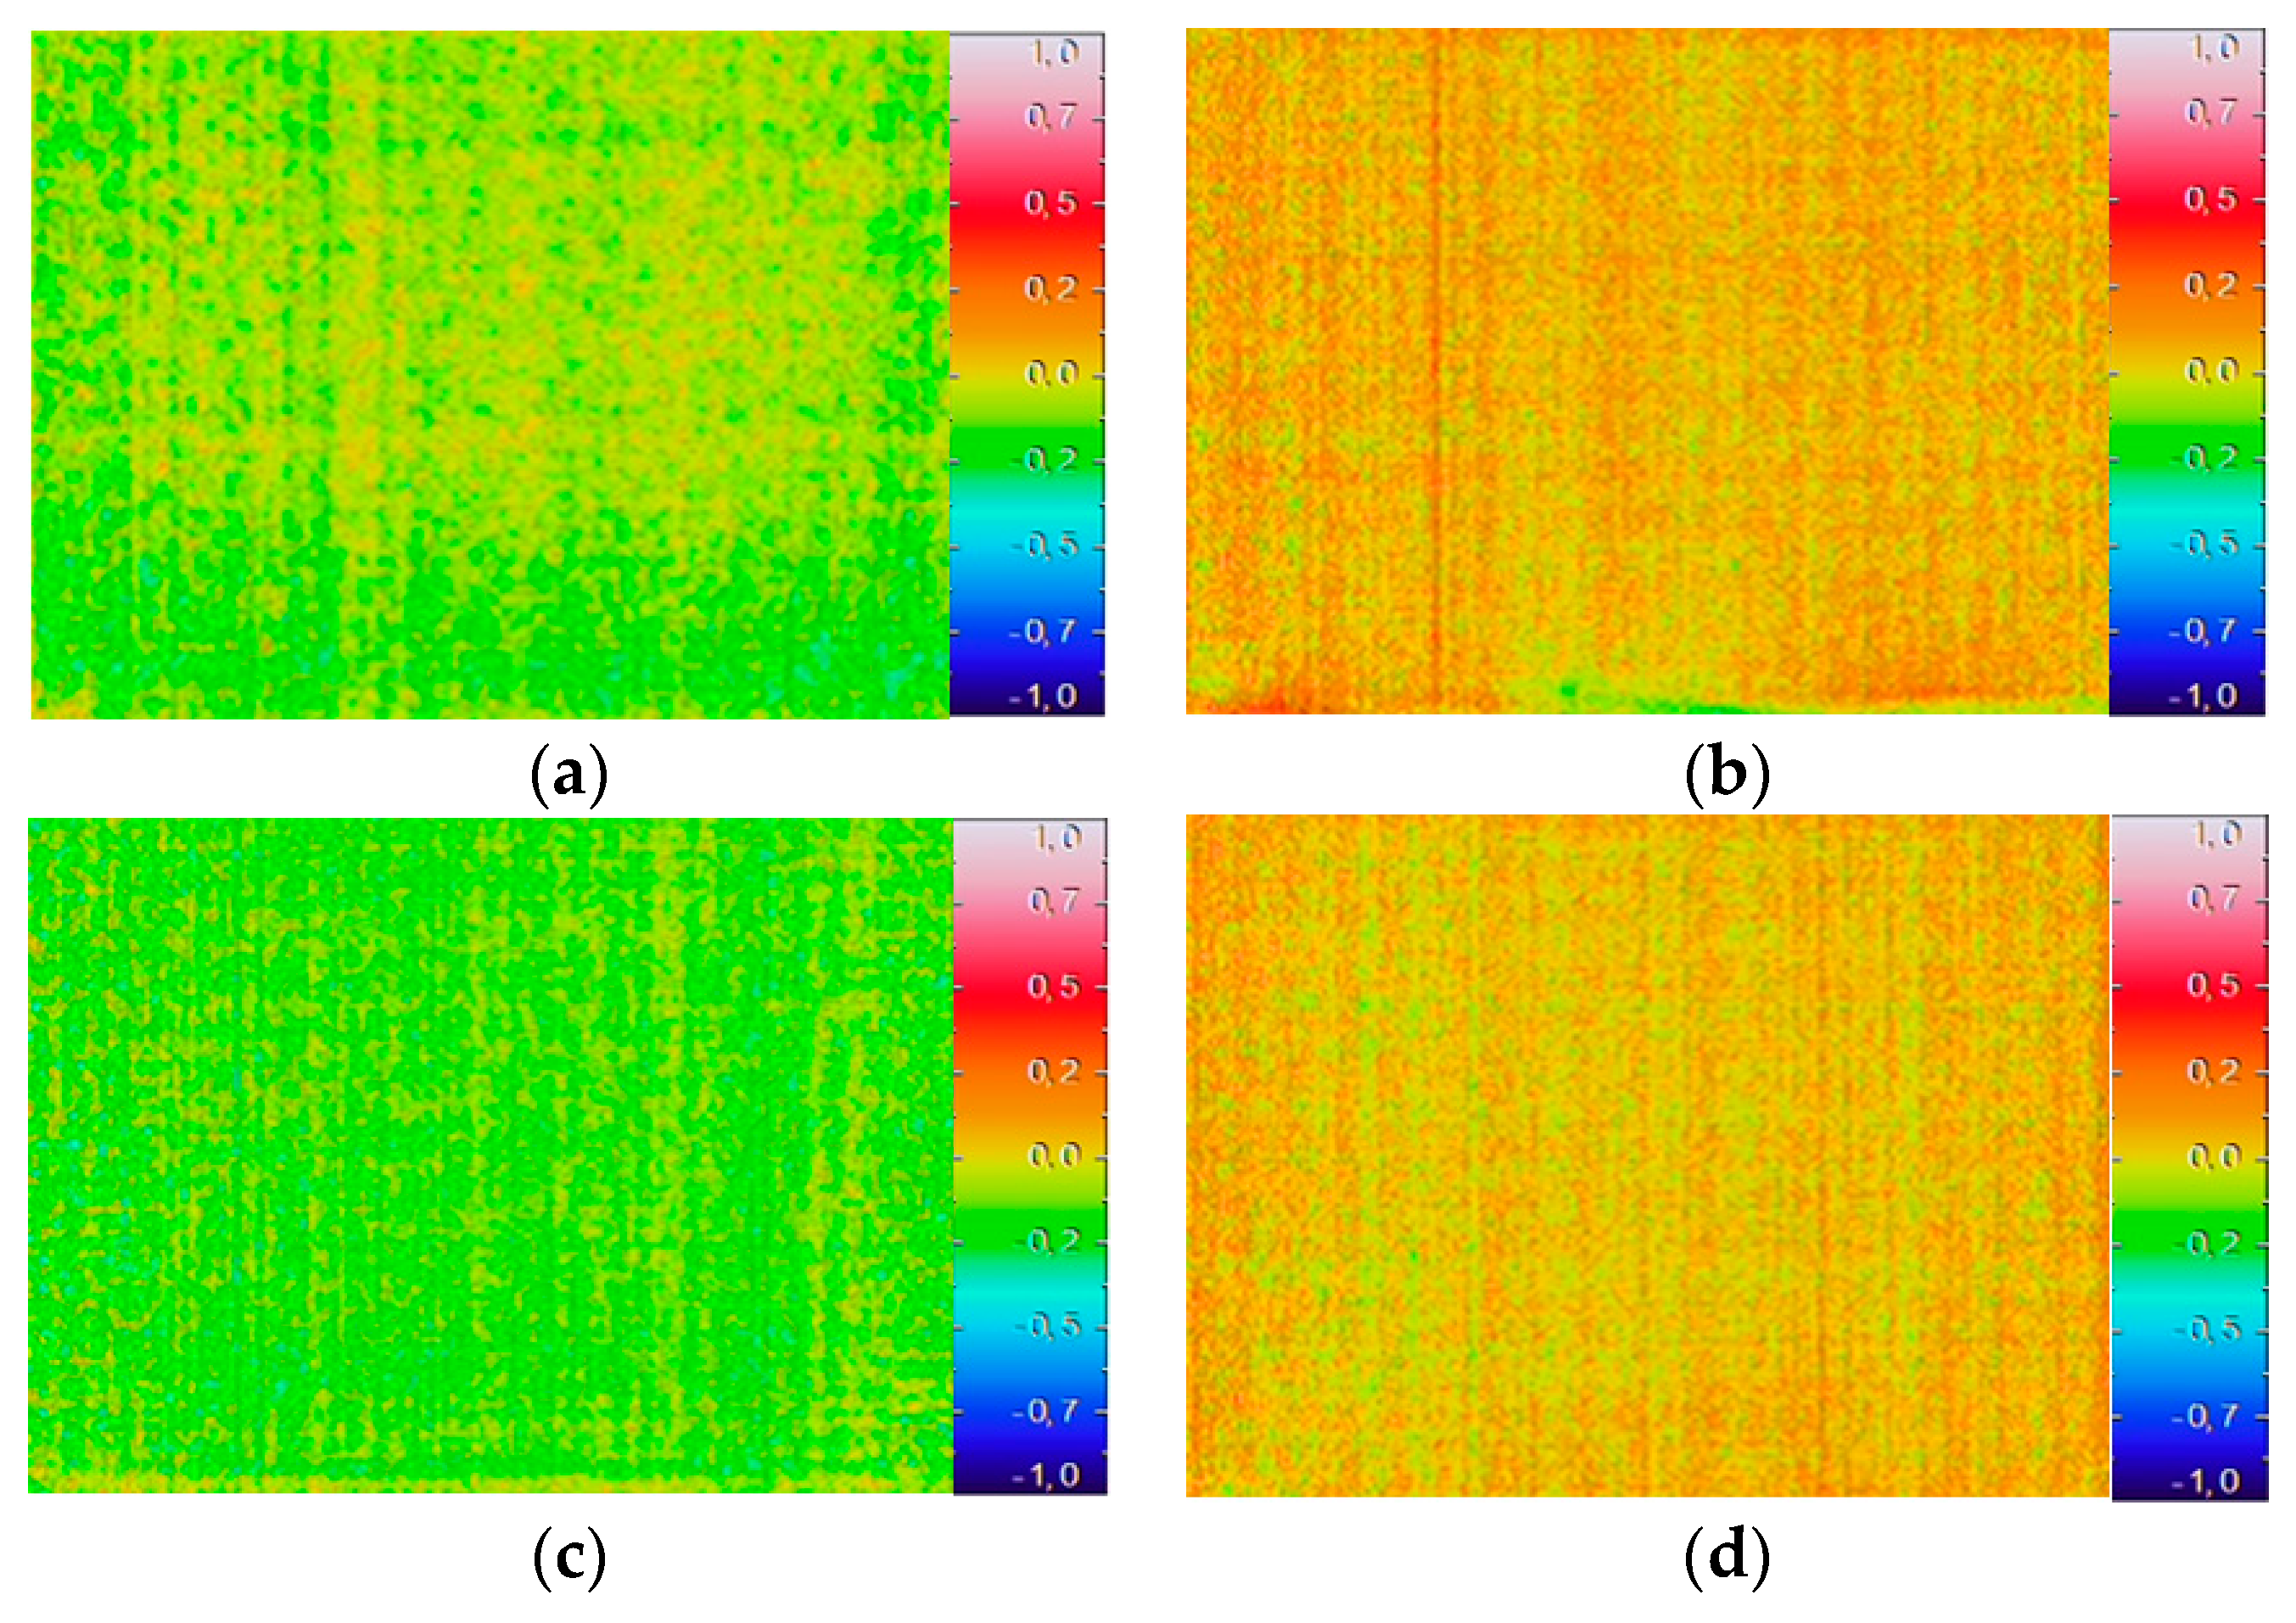
3.2.2. Analysis Based on Image Subtraction
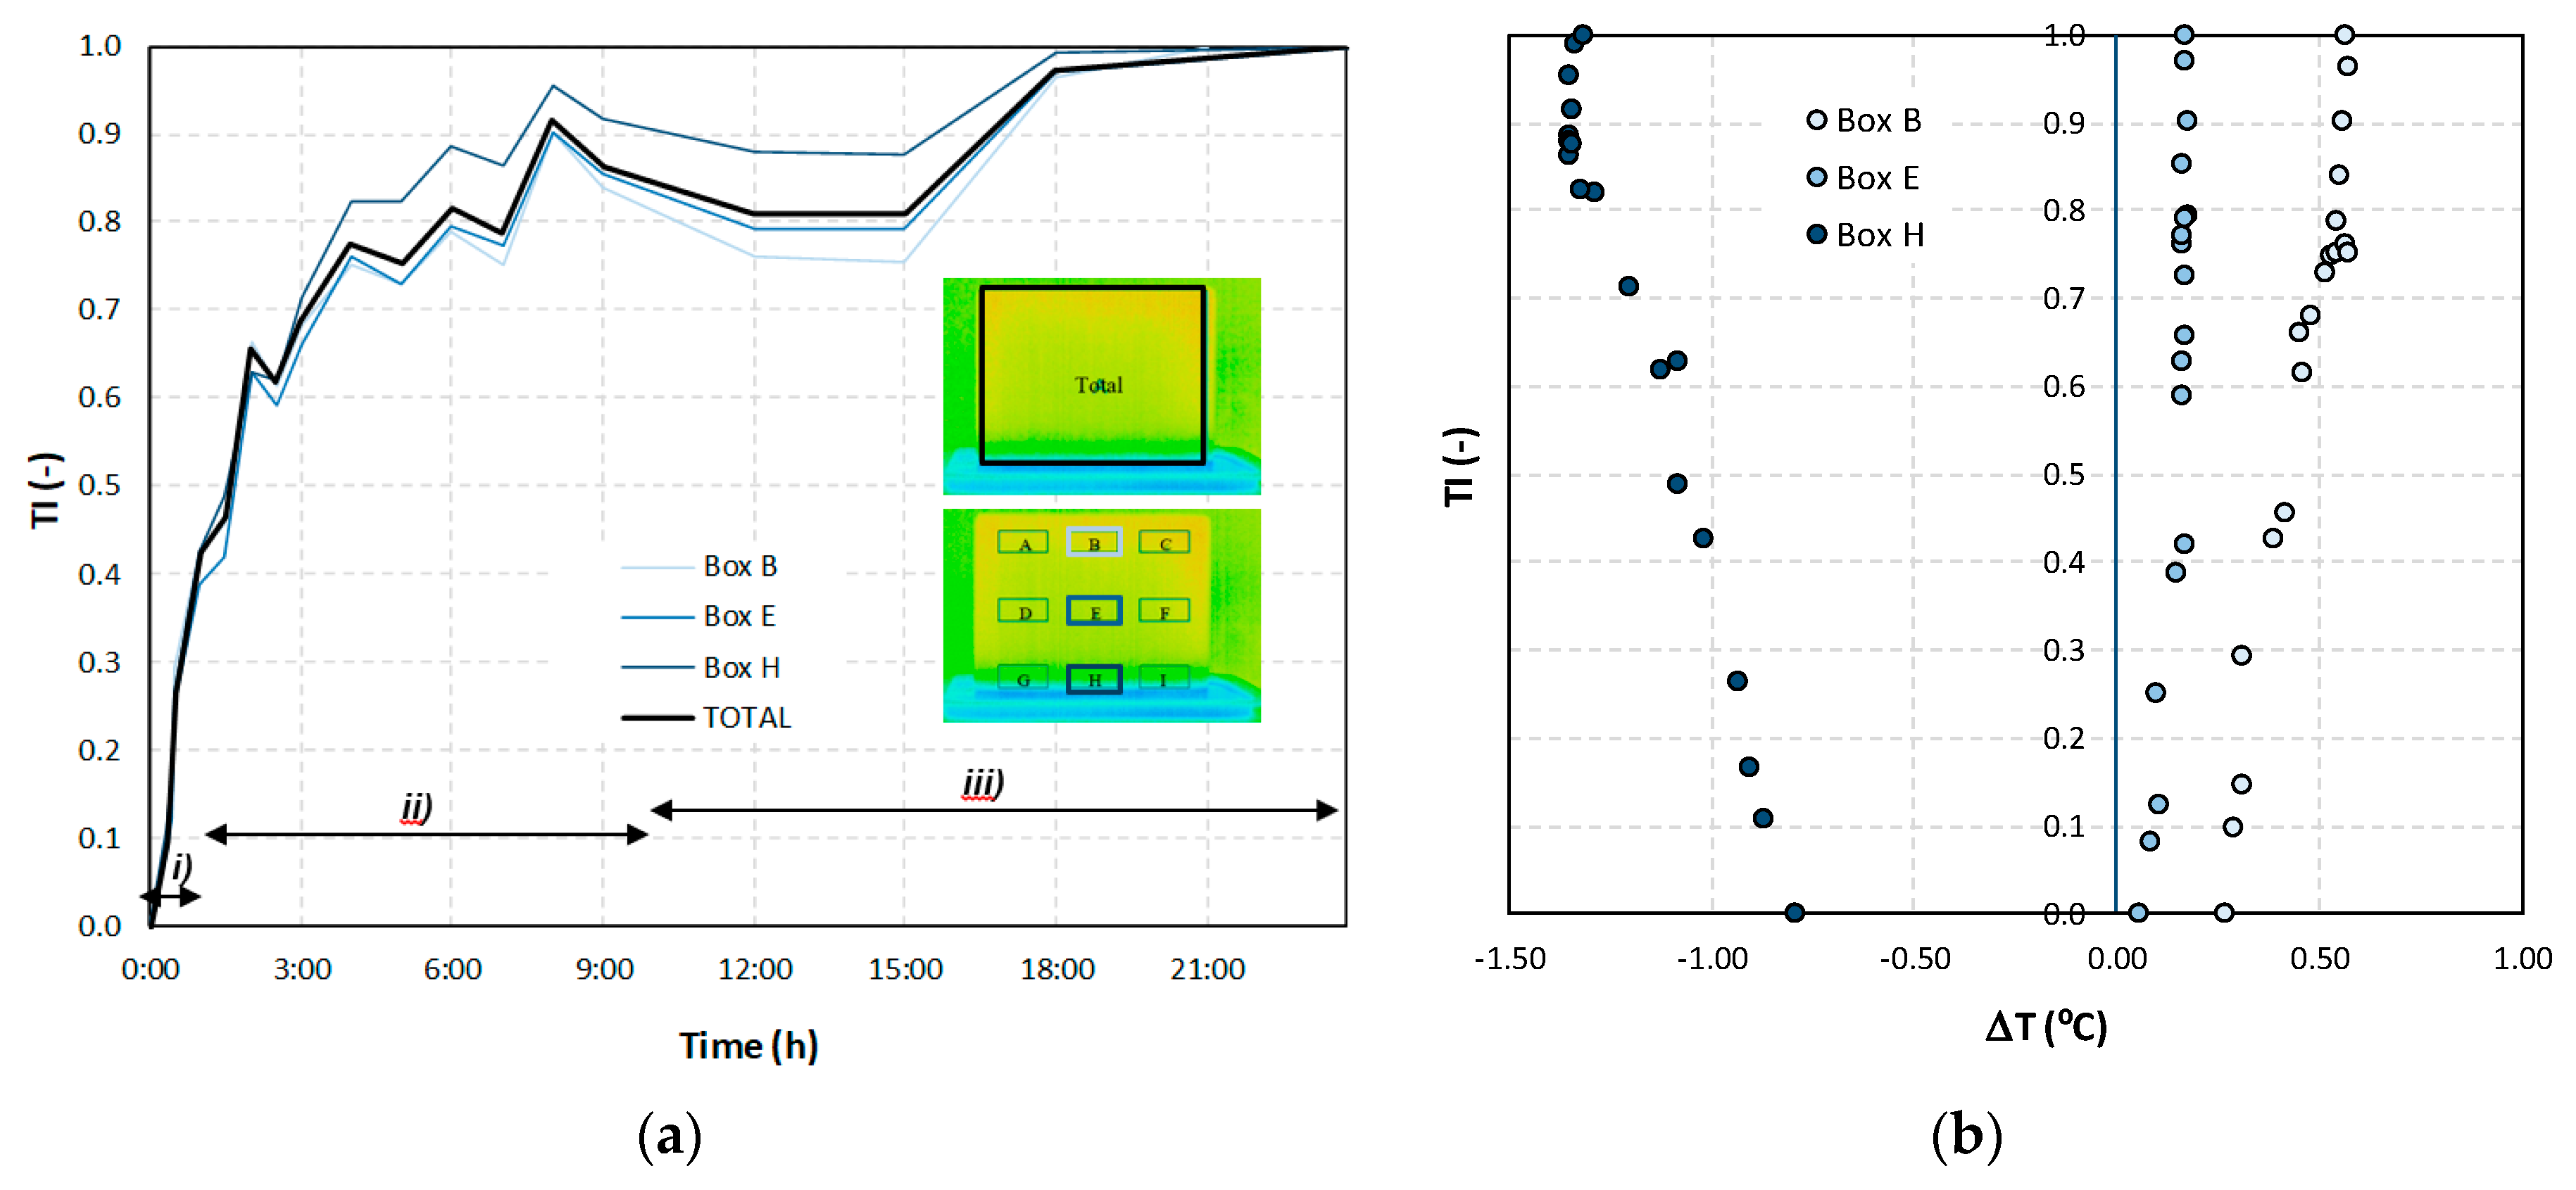
3.2.3. Analysis Based on Index TI
4. Conclusions
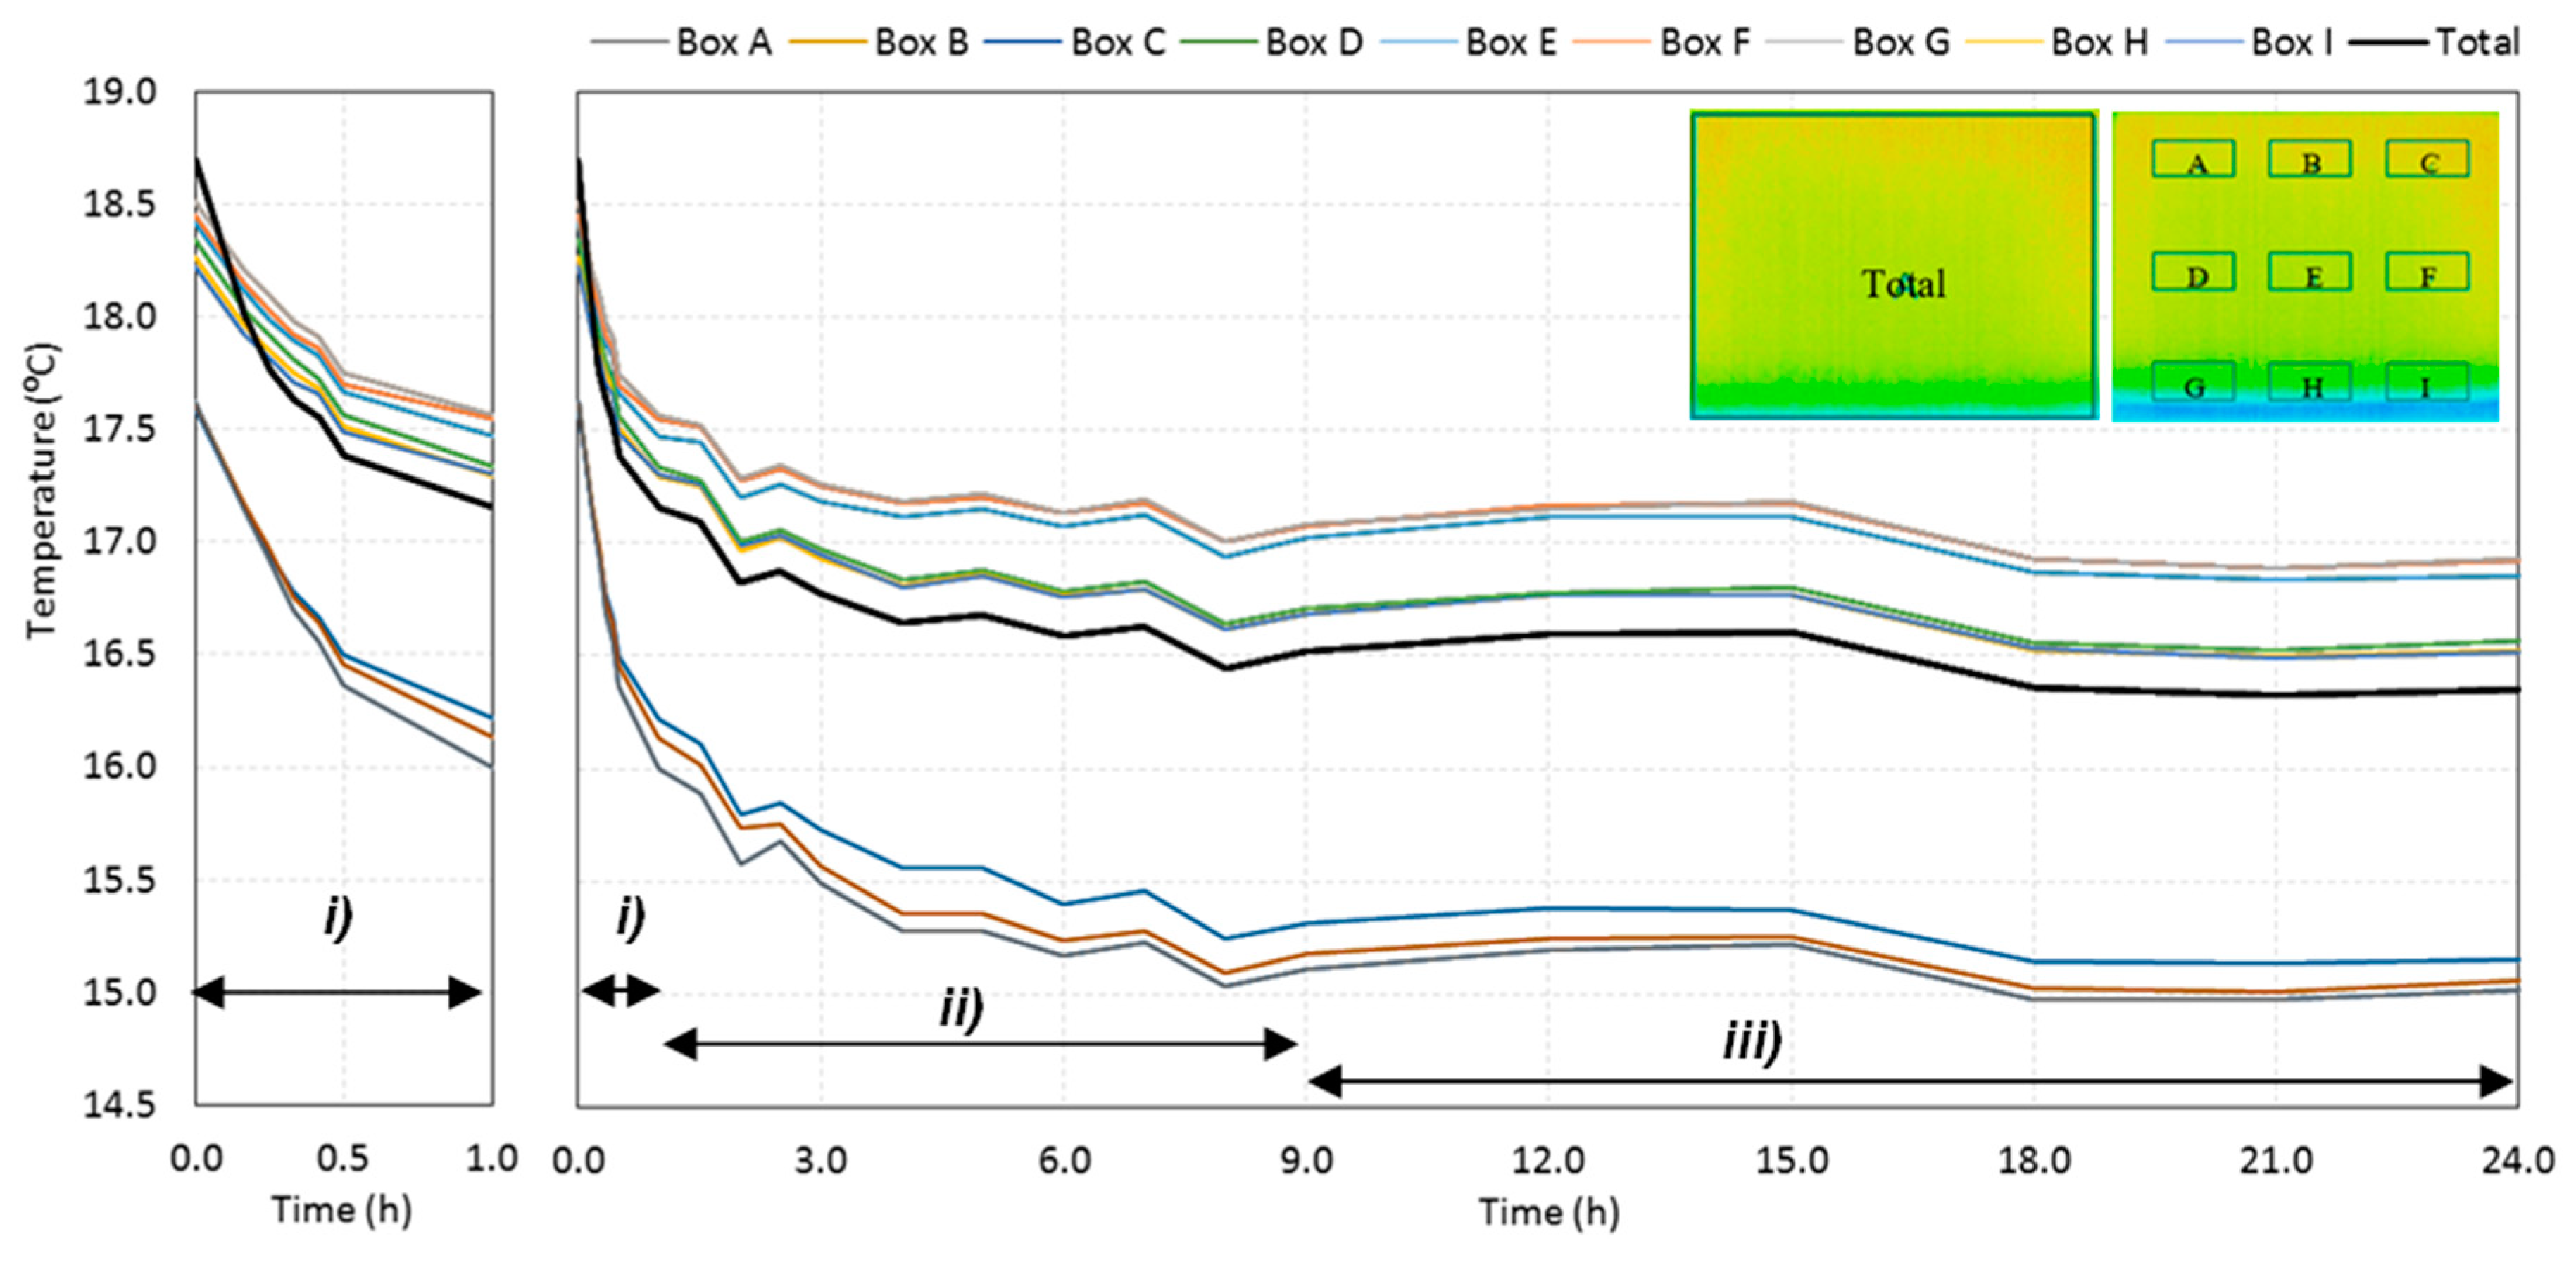
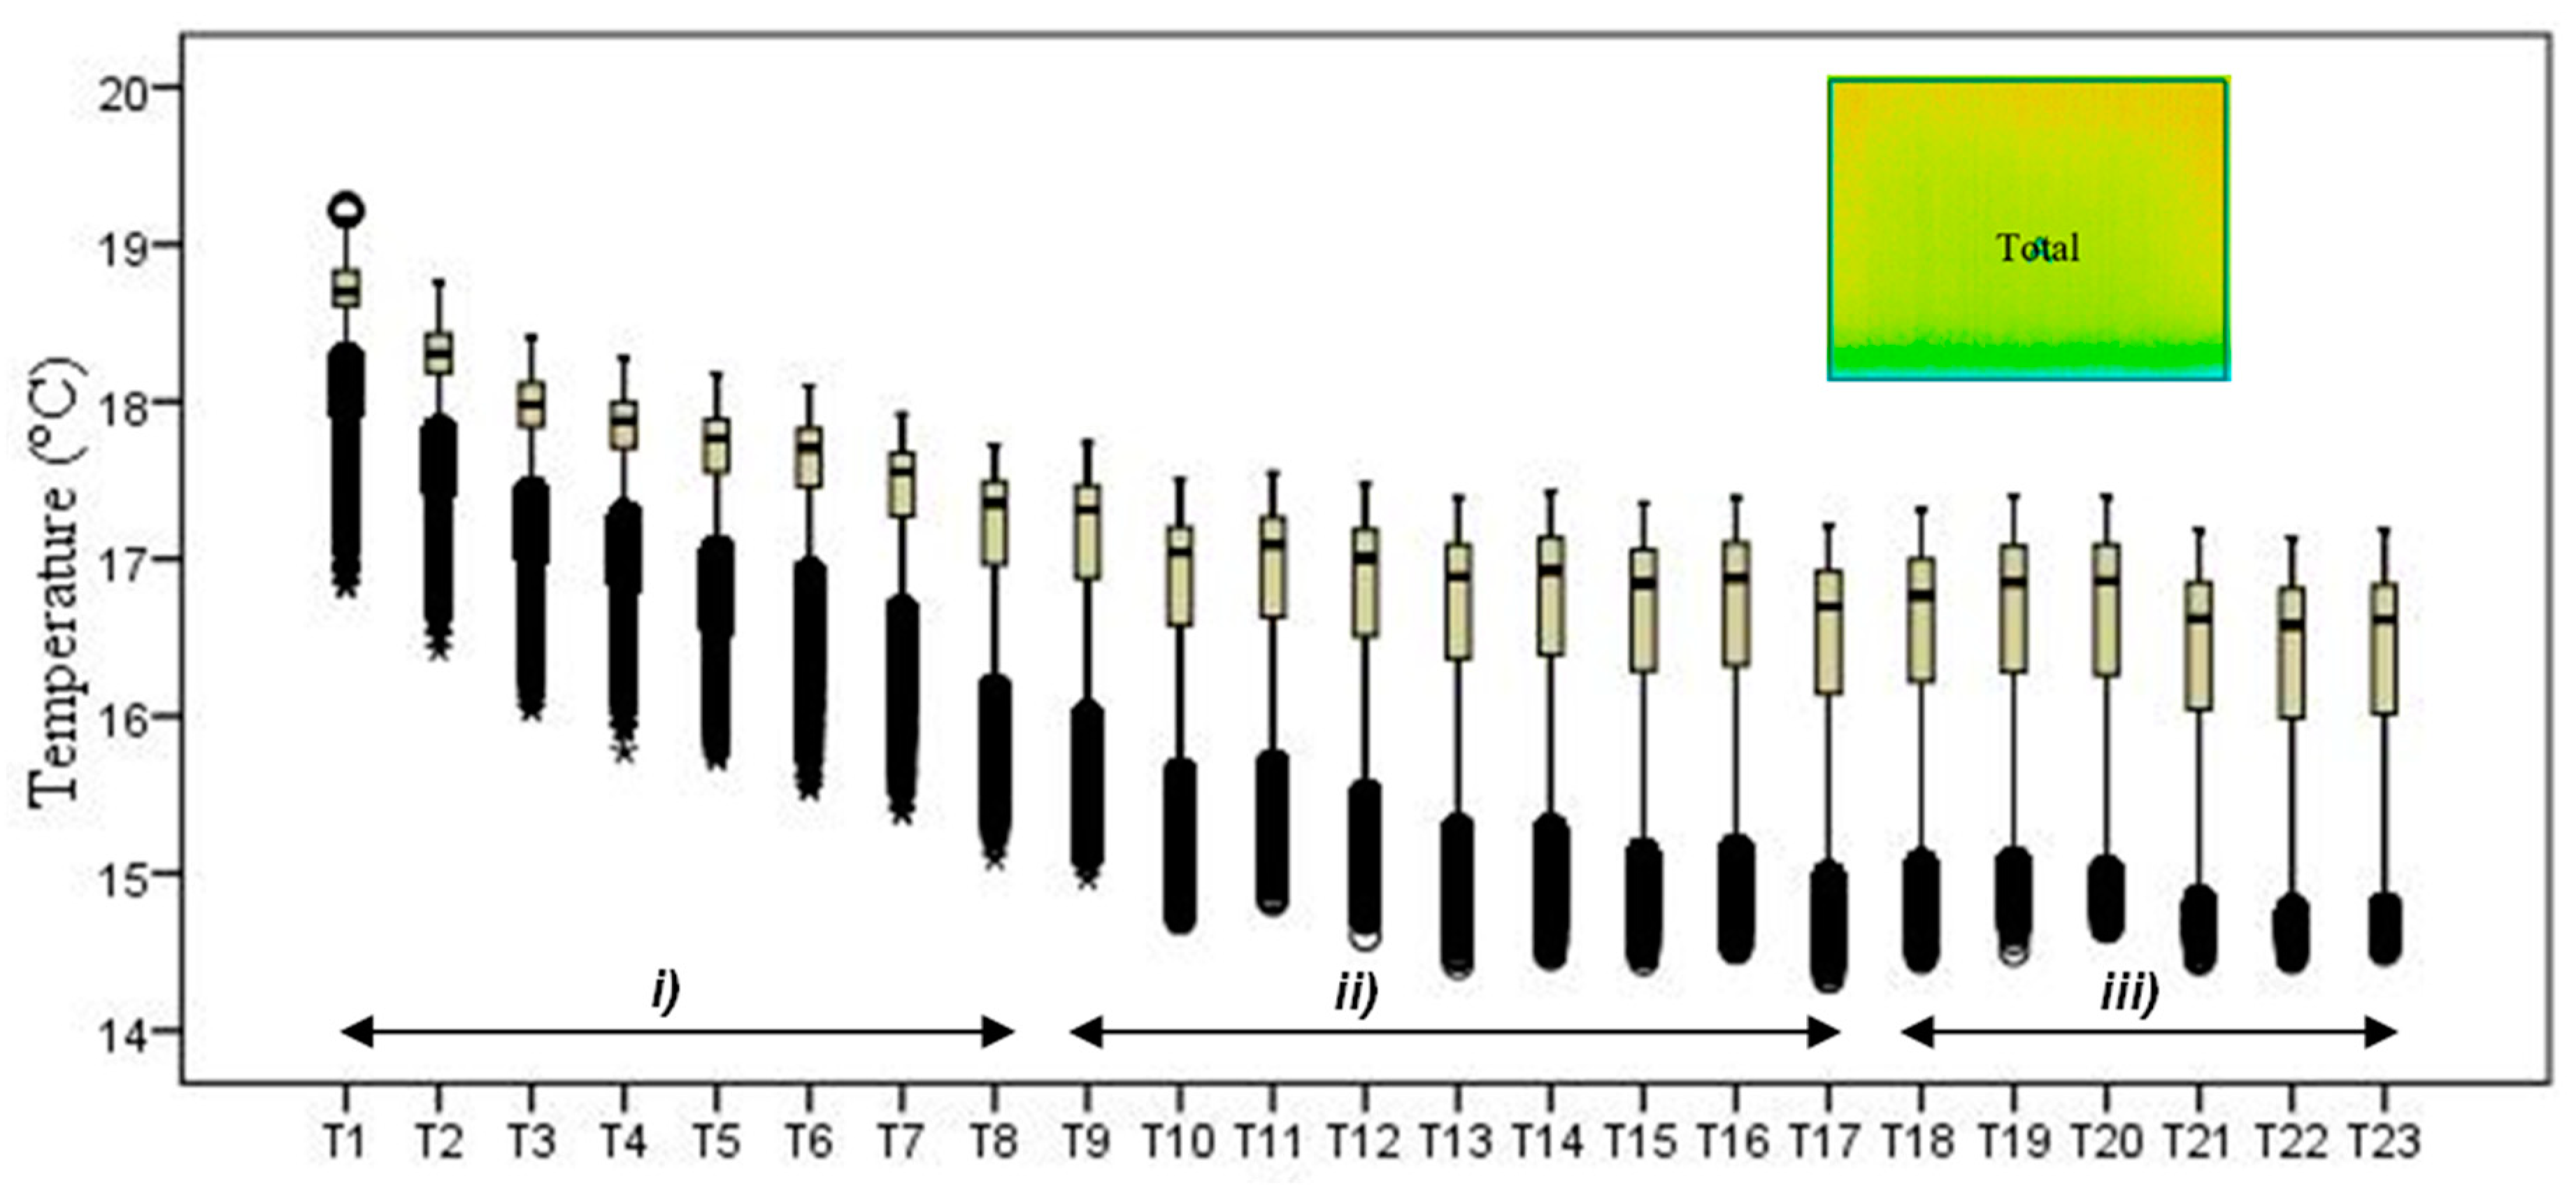
- The second phase of the methodology was the data processing. It was based on three methods: statistical descriptive analysis, image subtraction, and definition of a thermal index. The use of a box-plot representation over time considering the entire specimen was very interesting because the variability of the temperatures at certain moments of the experiment could be observed. It was found that the variability increased with the humidification process due to the increase of the wet area. The information provided by the outliers confirmed this conclusion, as their number tended to decrease throughout the test. Analyzing the box-plot representations of the boxes located in the central region of the specimen gave additional information regarding temperature variations at different levels, allowing an understanding of the water level achieved by the absorbed water at different moments of the experiment. In this case study, the temperature range in the lowest box, at different periods in time, pointed to the largest variations in the first hours, tending to stabilize at the end of the humidification.
- Image subtraction was a very interesting technique if the first image was used as a reference. When subtracting the previous image, the results were not so clear. This result confirmed that time is a key parameter to characterize the humidification phenomenon. Image subtraction is the most useful method if one intends to quantify the temperature differences due to moisture.
- The thermal index, TI, ranging between 0 and 1, allowed quantifying the cooling rate of the specimen. The three phases already identified through other methods were also highlighted by this index, as well as the confirmation of the cooling effect at the bottom of the specimen. However, more information could be obtained, as it was possible to identify that the effect of moisture on the surface temperature of the specimen only occurred after the first three hours.
Author Contributions
Funding
Acknowledgments
Conflicts of Interest
References
- Maldague, X. Nondestructive Evaluation of Materials by Infrared Thermography; Springer: Berlin, Germany, 1993. [Google Scholar]
- Hart, J. A Practical Guide for Infra-Red Thermography for Building Surveys; BRE: Bracknell, UK, 2001. [Google Scholar]
- Chew, M. Assessing building façades using infra-red thermography. Struct. Surv. 1998, 16, 81–86. [Google Scholar] [CrossRef]
- Ocaña, S.; Guerrero, I.; Requena, I. Thermographic survey of two rural buildings in Spain. Energy Build. 2004, 36, 515–523. [Google Scholar] [CrossRef]
- Bauer, E.; de Freitas, V.P.; Mustelier, N.; Barreira, E.; de Freitas, S.S. Infrared thermography—Evaluation of the results reproducibility. Struct. Surv. 2015, 33, 20–35. [Google Scholar] [CrossRef]
- Barreira, E.; Almeida, R.M.S.F.; Moreira, M. An infrared thermography passive approach to assess the effect of leakage points in buildings. Energy Build. 2017, 140, 224–235. [Google Scholar] [CrossRef]
- ASTM C1371-04a. Standard Test Method for Determination of Emittance of Materials Near Room Temperature Using Portable Emissometers; American Society for Testing and Materials: West Conshohocken, PA, USA, 2010. [Google Scholar]
- Sfarra, S.; Ibarra-Castanedo, C.; Theodorakeas, P.; Avdelidis, N.P.; Perilli, S.; Zhang, H.; Nardi, I.; Koui, M.; Maldague, X.P.V. Evaluation of the state of conservation of mosaics: Simulations and thermographic signal processing. Int. J. Therm. Sci. 2017, 117, 287–315. [Google Scholar] [CrossRef]
- Ludwig, N.; Redaelli, V.; Rosina, E.; Augelli, F. Moisture detection in wood and plaster by IR thermography. Infrared Phys. Technol. 2004, 46, 161–166. [Google Scholar] [CrossRef]
- Garrido, I.; Lagüela, S.; Sfarra, S.; Madruga, F.J.; Arias, P. Automatic detection of moistures in different construction materials from thermographic images. J. Therm. Anal. Calorim. 2019, 138, 1649–1668. [Google Scholar] [CrossRef]
- Sfarra, S.; Perilli, S.; Paoletti, D.; Ambrosini, D. Ceramics and defects. Infrared thermography and numerical simulations—A wide-ranging view for quantitative analysis. J. Therm. Anal. Calorim. 2016, 123, 43–62. [Google Scholar] [CrossRef]
- Urrestarazu, M.; Gallegos, V.; Álvaro, J.E. The use of thermography images in the description of the humidification bulb in soilless culture. Commun. Soil Sci. Plant Anal. 2017, 48, 1595–1602. [Google Scholar] [CrossRef]
- Rosina, E.; Ludwig, N. Optimal thermographic procedures for moisture analysis in building materials. Soc. Photogr. Instrum. Eng. 1999, 3827, 22–33. [Google Scholar]
- Moropoulou, A.; Avdelidis, N.P.; Haralampopoulos, G.; Anagnostopoulou, S. Detection of Moisture in Porous Materials by Infrared Thermography. Thermosense XXIV 2002, 4710, 324–332. [Google Scholar]
- Bison, P.; Cadelano, G.; Grinzato, E. Thermographic signal reconstruction with periodic temperature variation applied to moisture classification. Quant. Infrared Thermogr. J. 2011, 8, 221–238. [Google Scholar] [CrossRef]
- Grinzato, B.; Cadelano, G.; Bison, P. Moisture map by IR thermography. J. Mod. Opt. 2010, 57, 1770–1778. [Google Scholar] [CrossRef]
- Barreira, E.; Almeida, R.M.S.F.; Delgado, J.M.P.Q. Infrared thermography for assessing moisture related phenomena in building components. Constr. Build. Mater. 2016, 110, 251–269. [Google Scholar] [CrossRef]
- Janetti, M.B.; Colombo, L.P.M.; Ochs, F.; Feist, W. Effect of evaporation cooling on drying capillary active building materials. Energy Build. 2018, 166, 550–560. [Google Scholar] [CrossRef]
- Janetti, M.B.; Colombo, L.P.M.; Ochs, F.; Feist, W. Determination of the water retention curve from drying experiments using infrared thermography: A preliminary study. Int. J. Therm. Sci. 2017, 114, 271–280. [Google Scholar] [CrossRef]
- Rajewski, G.; Devine, G. “Building Envelope—Infrared thermography”. Preventative Roof Maintenance Workshop; Building Operator Association: Calgary, AB, Canada, 1996. [Google Scholar]
- ASTM-C 1060-90. Standard Practice for Thermographic Inspection of Insulation Installations in Envelope Cavities of FRAME buildings; American Society for Testing and Materials: West Conshohocken, PA, USA, 2003. [Google Scholar]
- Balaras, C.A.; Argiriou, A.A. Infrared thermography for building diagnostics. Energy Build. 2002, 34, 171–183. [Google Scholar] [CrossRef]
- Lerma, J.L.; Cabrelles, M.; Portalés, C. Multitemporal thermal analysis to detect moisture on a building façade. Constr. Build. Mater. 2011, 25, 2190–2197. [Google Scholar] [CrossRef]
- Vollmer, M.; Möllmann, K.P. Infrared Thermal Imaging: Fundamentals, Research and Applications; John Wiley & Sons: Hoboken, NJ, USA, 2010. [Google Scholar]
- Bendada, A.; Ibarra-Castanedo, C.; Ambrosini, D.; Paoletti, D.; Cheilakou, E.; Koui, M.; Avdelidis, N.; Theodorakeas, P.; Sfarra, S.; Maldague, X. How to retrieve information inherent to old restorations made on frescoes of particular artistic value using infrared vision? Int. J. Thermophys. 2015, 36, 3051–3070. [Google Scholar]
- Sfarra, S.; Ibarra-Castanedo, C.; Tortora, M.; Arrizza, L.; Cerichelli, G.; Nardi, I.; Maldague, X. Diagnostics of wall paintings: A smart and reliable approach. J. Cult. Herit. 2016, 18, 229–241. [Google Scholar] [CrossRef]
- Tavukçuoğlu, A.; Grinzato, E. Determination of critical moisture content in porous materials by IR thermography. Quant. Infrared Thermogr. J. 2006, 3, 231–245. [Google Scholar] [CrossRef]
- Grinzato, E. Monitoring of Thermal-Hygrometrical Conditions of Large Surfaces by IR. Thermography. Patent PD2006A000191, 15 June 2006. [Google Scholar]
- Madruga, F.J.; Sfarra, S.; Perilli, S.; Pivarčiová, E.; López-Higuera, J.M. Measuring the Water Content in Wood Using Step-Heating Thermography and Speckle Patterns-Preliminary Results. Sensors 2020, 20, 316. [Google Scholar] [CrossRef] [PubMed]
- Edis, E.; Flores-Colen, I.; de Brito, J. Quasi-quantitative infrared thermographic detection of moisture variation in facades with adhered ceramic cladding using principal component analysis. Build. Environ. 2015, 94, 97–108. [Google Scholar] [CrossRef]
- Maldague, X. Theory and Practice of Infrared Technology for Nondestructive Testing; John Wiley & Sons: Hoboken, NJ, USA, 2001. [Google Scholar]
- Tavukçuoğlu, A.; Akevren, S.; Grinzato, E. In situ examination of structural cracks at historic masonry structures by quantitative infrared thermography and ultrasonic testing. J. Mod. Opt. 2010, 57, 1779–1789. [Google Scholar] [CrossRef]
- Tran, Q.H.; Han, D.; Kang, C.; Haldar, A.; Huh, J. Effects of Ambient Temperature and Relative Humidity on Subsurface Defect Detection in Concrete Structures by Active Thermal Imaging. Sensors 2017, 17, 1718. [Google Scholar] [CrossRef]
- Barreira, E.; Almeida, R.M.S.F.; Ferreira, J.P.B. Assessing the humidification process of lightweight concrete specimens through infrared thermography. Energy Procedia 2017, 132, 213–218. [Google Scholar] [CrossRef]
- BS EN 12390-7:2000. Testing Hardened Concrete. Density of Hardened Concrete; BSI, British Standards Institution: London, UK, 2000. [Google Scholar]
- ISO 15148:2002. Hygrothermal Performance of Building Materials and Products—Determination of Water Absorption Coefficient by Partial Immersion; ISO, Thermal Performance of Buildings: London, UK, 2002. [Google Scholar]


| Dimensions | 0.28 × 0.21 × 0.075 m3 |
| Dry density | 1351 kg/m3 [34] |
| Water absorption coefficient | 4.521 × 10⁻³ g/(mm2∙h0.5) [35] |
| Emissivity | 0.91 [36] |
| Measuring range | −20 °C to 100 °C |
| Resolution | 0.06 °C at 30 °C, 60 Hz |
| Accuracy | ±2 °C or ±2% |
| Detector | FPA (microbolometer) |
| Spectral range | 8 and 14.0 μm |
| IFOV | 1.2 mrad |
| Thermal resolution | 320 × 240 pixels |
| Field of view | 22° × 16° |
| Box A | Box B | Box C | Box D | Box E | |
|---|---|---|---|---|---|
| Mean | 16.9 | 16.9 | 16.9 | 16.5 | 16.5 |
| Median | 16.9 | 16.9 | 16.9 | 16.5 | 16.5 |
| SD | 0.06 | 0.06 | 0.06 | 0.09 | 0.09 |
| Skewness coefficient | −0.16 | 0.07 | −0.03 | −0.19 | −0.18 |
| Maximum | 17.0 | 17.1 | 17.1 | 16.8 | 16.7 |
| Minimum | 16.7 | 16.7 | 16.7 | 16.3 | 16.3 |
| Box plot |  |  |  |  |  |
| Histogram | |||||
| Box F | Box G | Box H | Box I | Total | |
| Mean | 16.6 | 15.2 | 15.1 | 15 | 16.4 |
| Median | 16.6 | 15.2 | 15.1 | 15 | 16.6 |
| SD | 0.10 | 0.19 | 0.19 | 0.22 | 0.63 |
| Skewness coefficient | −0.10 | −0.01 | −0.07 | −0.05 | −1.07 |
| Maximum | 16.9 | 15.6 | 15.5 | 15.5 | 17.2 |
| Minimum | 16.3 | 14.7 | 14.6 | 14.5 | 14.5 |
| Box plot |  |  |  |  |  |
| Histogram |
© 2020 by the authors. Licensee MDPI, Basel, Switzerland. This article is an open access article distributed under the terms and conditions of the Creative Commons Attribution (CC BY) license (http://creativecommons.org/licenses/by/4.0/).
Share and Cite
Barreira, E.; Almeida, R.M.S.F.; L. Simões, M.; Rebelo, D. Quantitative Infrared Thermography to Evaluate the Humidification of Lightweight Concrete. Sensors 2020, 20, 1664. https://doi.org/10.3390/s20061664
Barreira E, Almeida RMSF, L. Simões M, Rebelo D. Quantitative Infrared Thermography to Evaluate the Humidification of Lightweight Concrete. Sensors. 2020; 20(6):1664. https://doi.org/10.3390/s20061664
Chicago/Turabian StyleBarreira, Eva, Ricardo M.S.F. Almeida, Maria L. Simões, and Daniela Rebelo. 2020. "Quantitative Infrared Thermography to Evaluate the Humidification of Lightweight Concrete" Sensors 20, no. 6: 1664. https://doi.org/10.3390/s20061664
APA StyleBarreira, E., Almeida, R. M. S. F., L. Simões, M., & Rebelo, D. (2020). Quantitative Infrared Thermography to Evaluate the Humidification of Lightweight Concrete. Sensors, 20(6), 1664. https://doi.org/10.3390/s20061664