Room-Level Fall Detection Based on Ultra-Wideband (UWB) Monostatic Radar and Convolutional Long Short-Term Memory (LSTM)


Abstract
1. Introduction
2. Materials and Methods
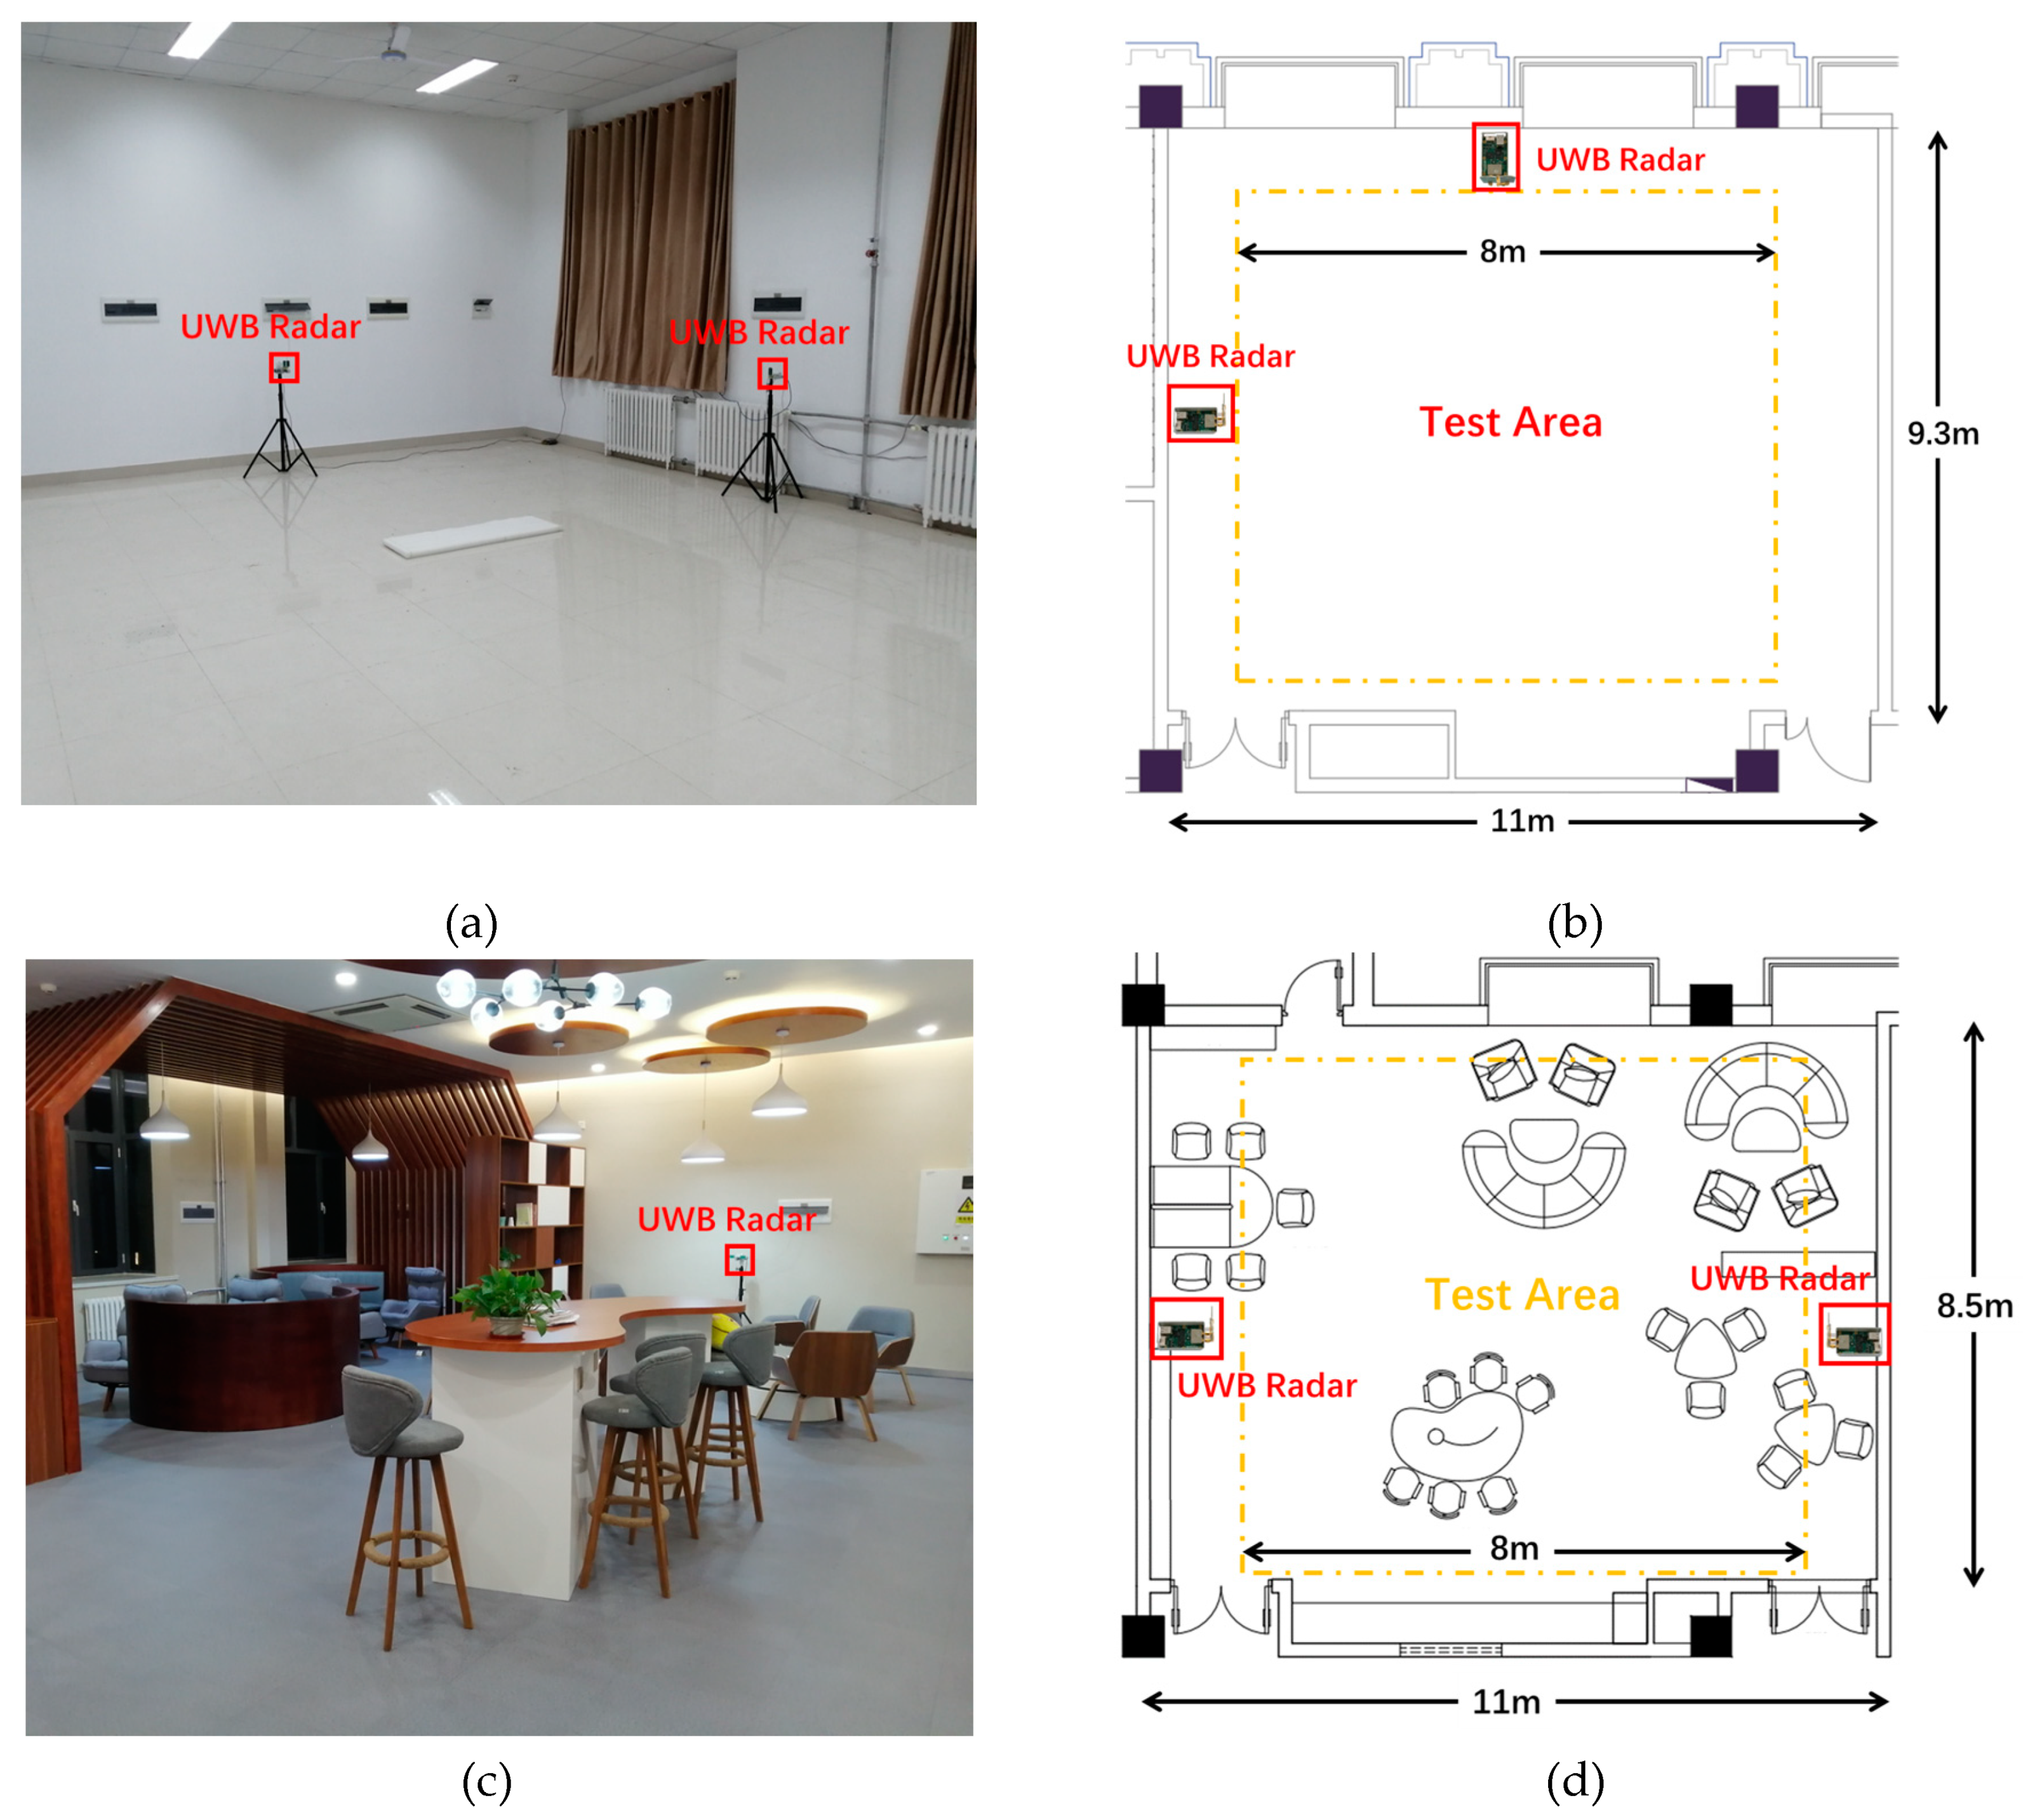
2.1. Data Acquisition with IR-UWB Monostatic Radar
2.2. Dataset
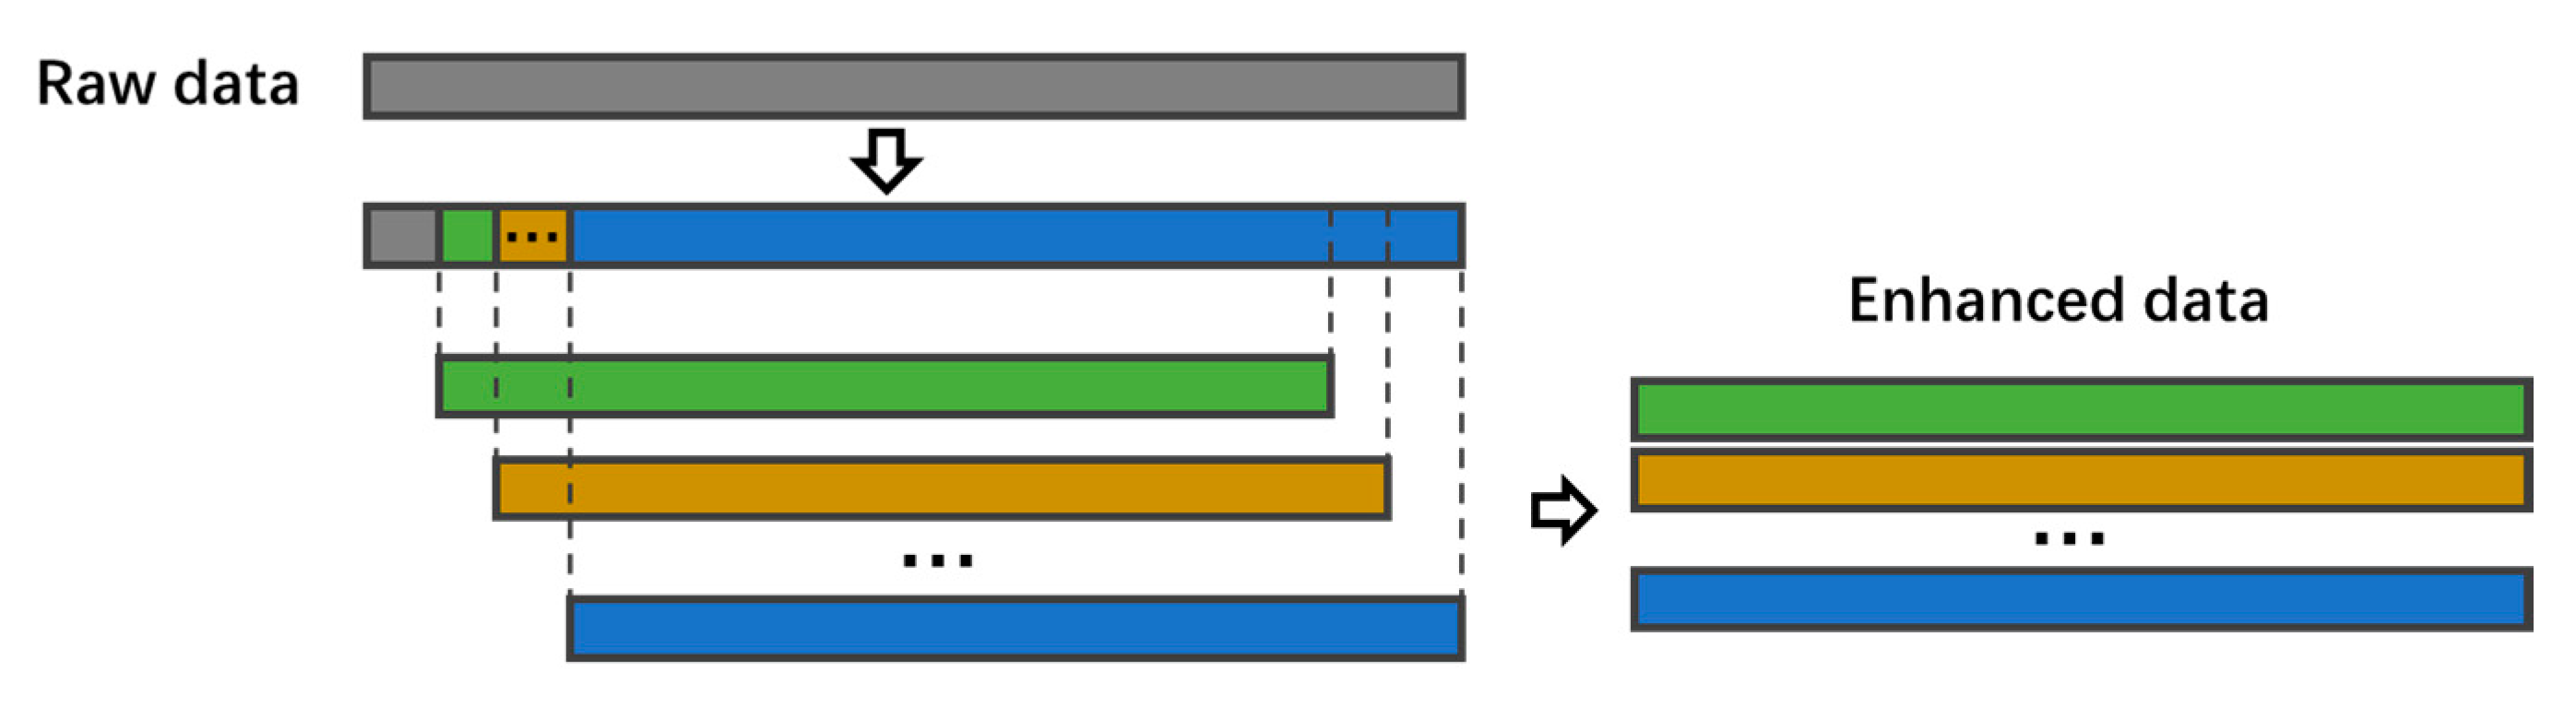
2.3. Preprocessing
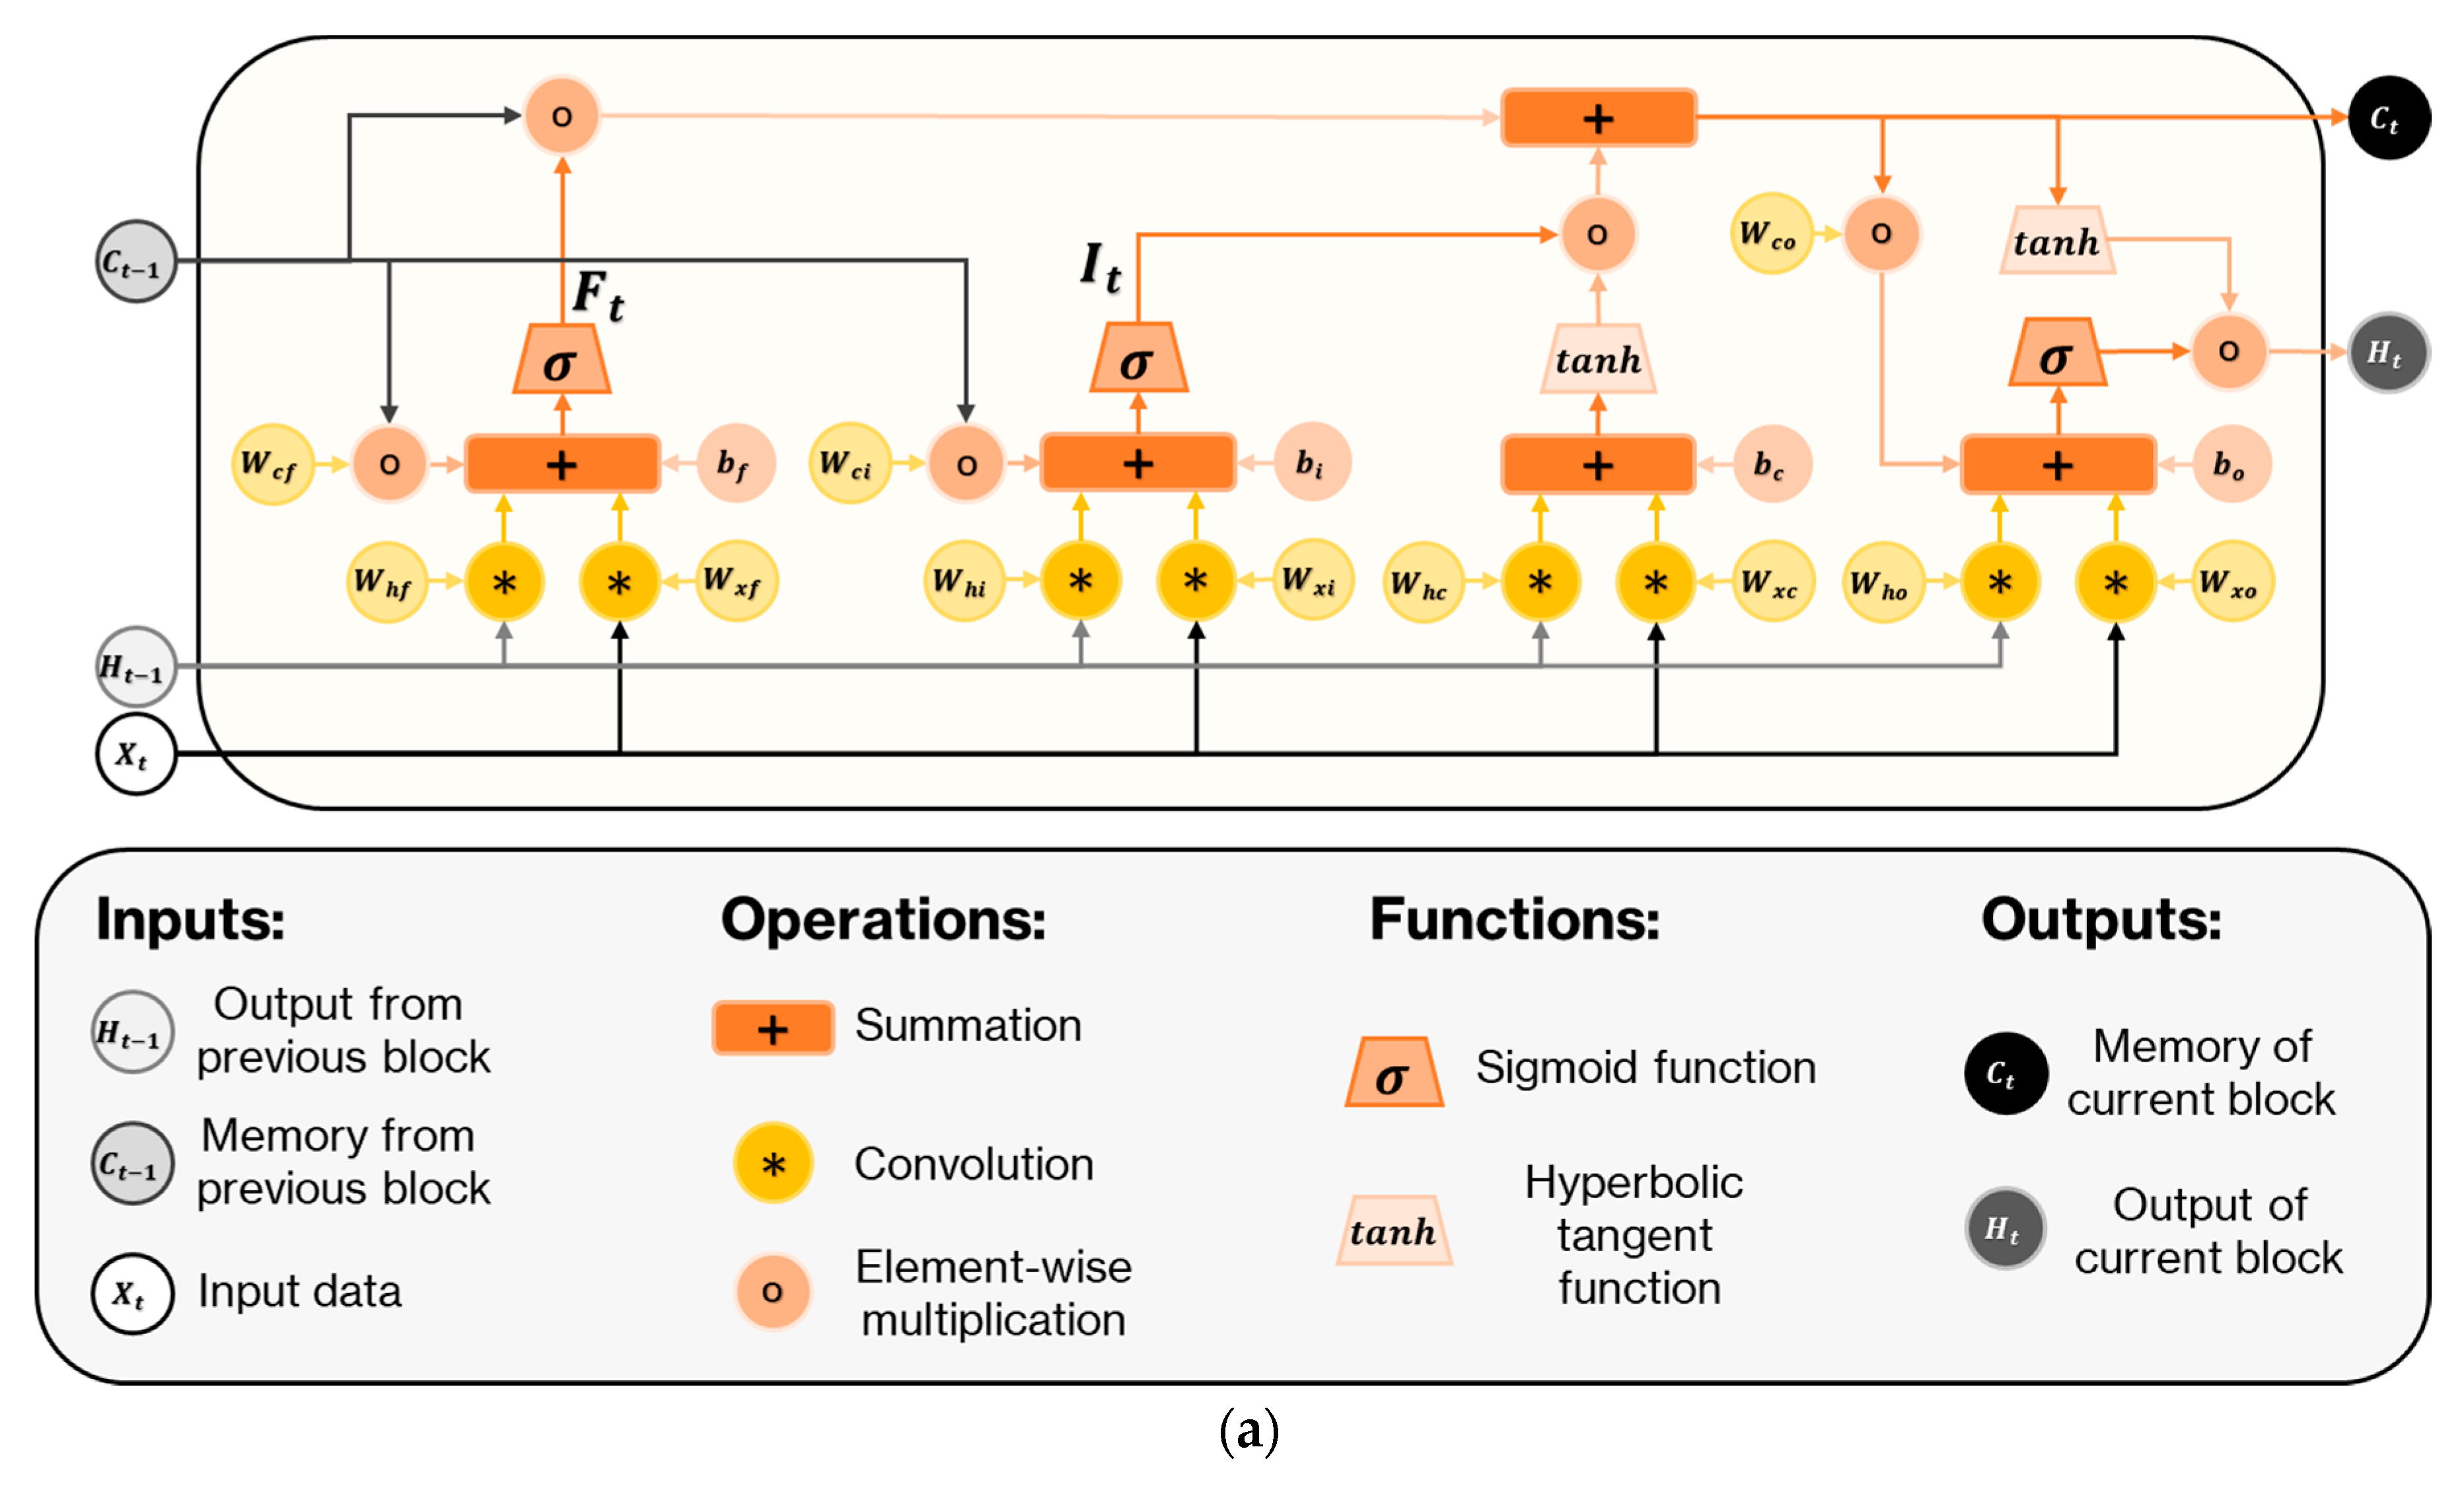
2.4. Convolutional LSTM
3. Results and Discussion
3.1. Performance Evaluation
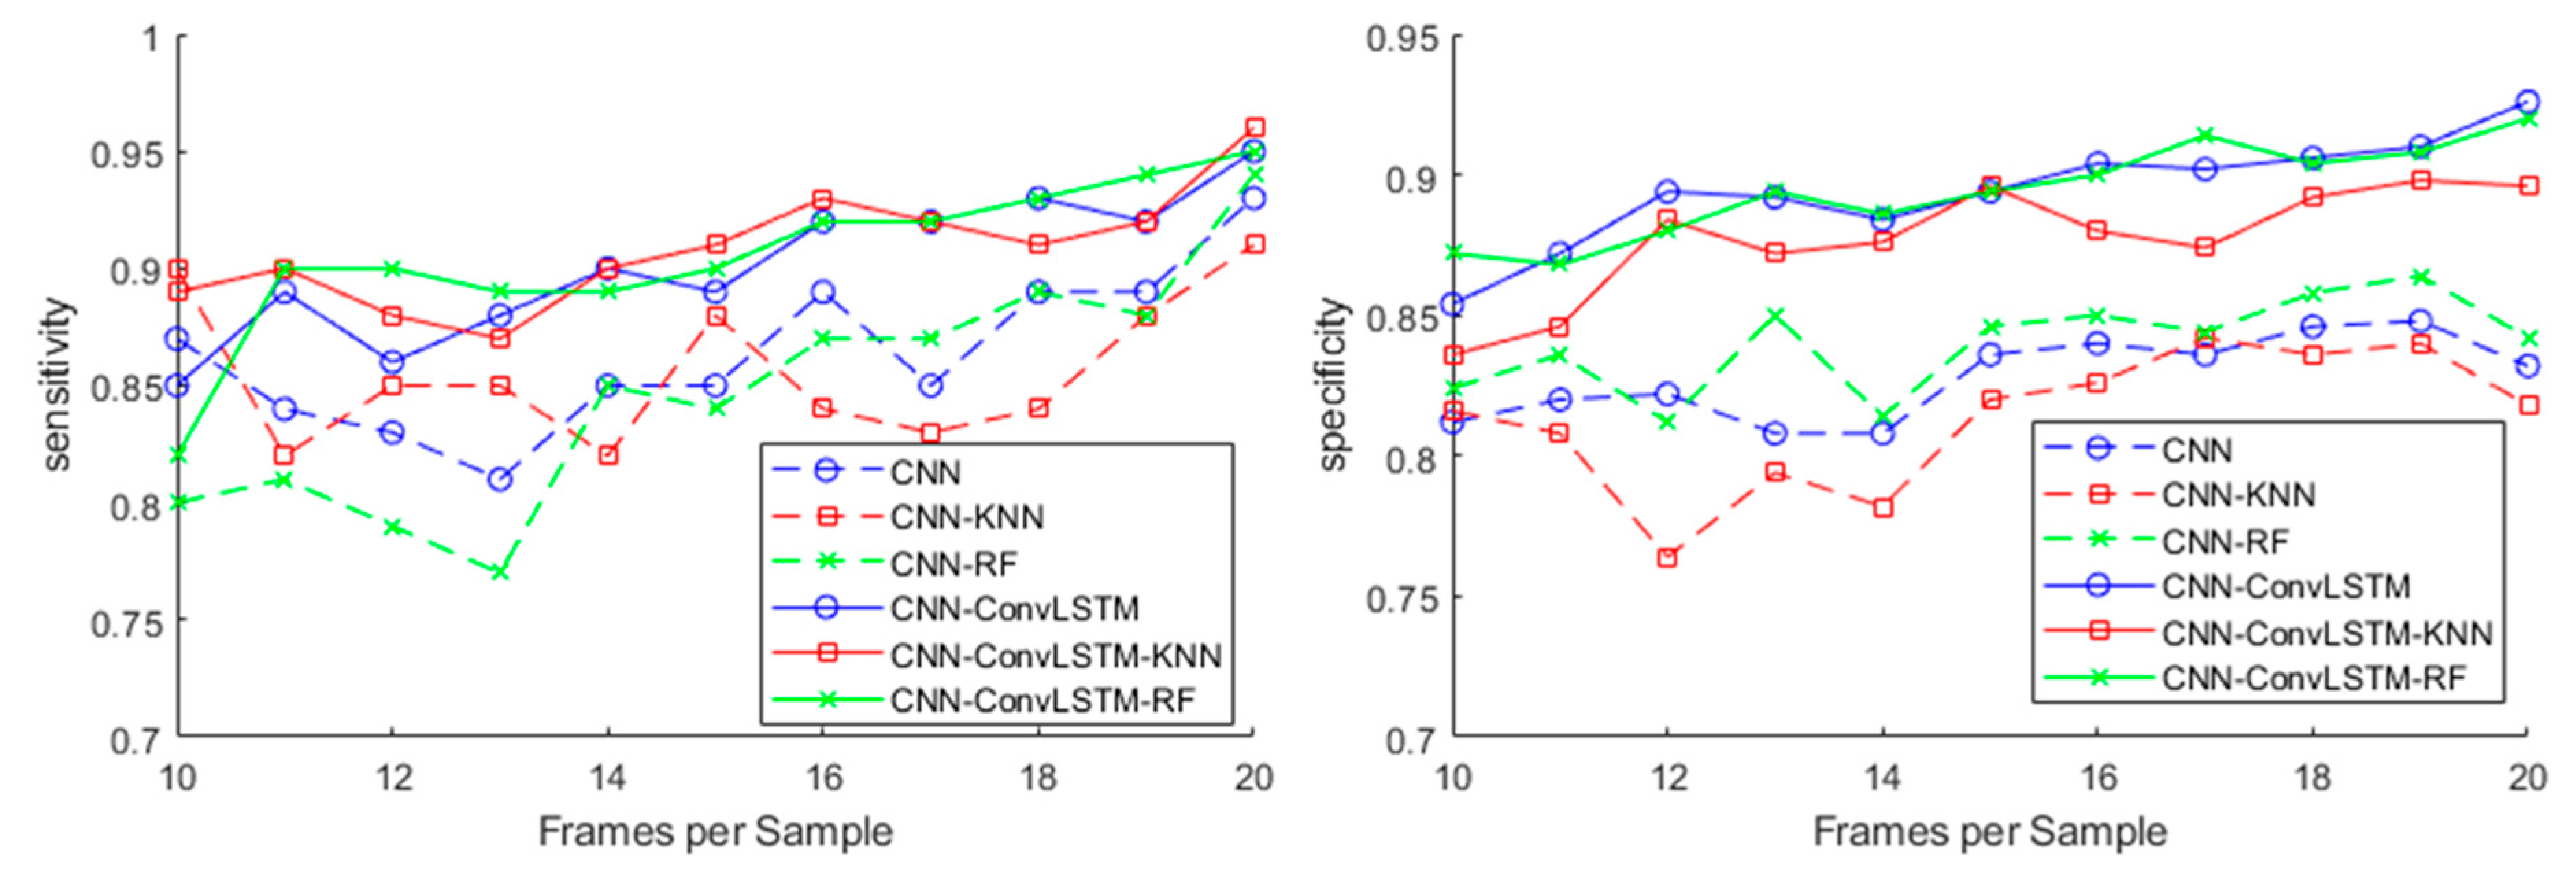
3.2. Effect of the Number of Frames per Sample
3.3. Evaluation of Transferability to Other Environment
3.4. Evaluation of Performance Classifying Activities of Unknown Subjects
3.5. Evaluation of Execution Time
4. Conclusions
Author Contributions
Funding
Conflicts of Interest
Abbreviations
| IR-UWB | Impulse–Response Ultra-Wideband |
| ConvLSTM | Convolutional Long Short Term Memory |
| CNN | Convolutional Neural Network |
| WHO | World Health Organization |
| CSI | Channel State Information |
| SVM | Support Vector Machine |
| USRP | Universal Software Radio Peripheral |
| PCA | Principal Components Analysis |
| FMCW | Frequency-Modulated Continuous Wave |
| ICNN | Iterative Convolutional Neural Network |
| SEP | SEPeration |
| NS | Not Specified |
| IDPC-CNN | Improved Dual Parallel Channel Convolutional Neural Network |
| TOA | Time of Arrival |
| KNN | K-Nearest Neighbors |
| RF | Random Forest |
| CPU | Central Processing Unit |
References
- Tinetti, M.E.; Speechley, M.; Ginter, S.F. Risk factors for falls among elderly persons living in the community. N. Engl. J. Med. 1988, 319, 1701–1707. [Google Scholar] [CrossRef] [PubMed]
- Myers, A.H.; Baker, S.P.; Van Natta, M.L.; Abbey, H.; Robinson, E.G. Risk factors associated with falls and injuries among elderly institutionalized persons. Am. J. Epidemiol. 1991, 133, 1179–1190. [Google Scholar] [CrossRef] [PubMed]
- Burns, E.R.; Stevens, J.A.; Lee, R. The direct costs of fatal and non-fatal falls among older adults—United States. J. Saf. Res. 2016, 58, 99–103. [Google Scholar] [CrossRef] [PubMed]
- Luna-Perejón, F.; Domínguez-Morales, M.J.; Civit-Balcells, A. Wearable Fall Detector Using Recurrent Neural Networks. Sensors 2019, 19, 4885. [Google Scholar] [CrossRef]
- Mubashir, M.; Ling, S.; Seed, L. A survey on fall detection: Principles and approaches. Neurocomputing 2013, 100, 144–152. [Google Scholar] [CrossRef]
- Kim, Y.; Yang, L. Human Activity Classification with Transmission and Reflection Coefficients of On-Body Antennas Through Deep Convolutional Neural Networks. IEEE Trans. Antennas Propag. 2017, 65, 2764–2768. [Google Scholar] [CrossRef]
- Nguyen, N.D.; Truong, P.H.; Jeong, G.M. Daily wrist activity classification using a smart band. Physiol. Meas. 2017, 38, 10. [Google Scholar] [CrossRef]
- Ren, L.; Peng, Y. Research of Fall Detection and Fall Prevention Technologies: A Systematic Review. IEEE Access 2019, 7, 77702–77722. [Google Scholar] [CrossRef]
- Chaccour, K.; Darazi, R.; Hajjam, A.; Andres, E. From Fall Detection to Fall Prevention: A Generic Classification of Fall-Related Systems. IEEE Sens. 2017, 17, 812–822. [Google Scholar] [CrossRef]
- Liu, M.; Chen, R.; Li, D.; Chen, Y.; Guo, G.; Cao, Z.; Pan, Y. Scene Recognition for Indoor Localization Using a Multi-Sensor Fusion Approach. Sensors 2017, 17, 2847. [Google Scholar] [CrossRef]
- Xue, W.; Qiu, W.; Hua, X.; Yu, K. Improved Wi-Fi RSSI Measurement for Indoor Localization. IEEE Sens. 2017, 17, 2224–2230. [Google Scholar] [CrossRef]
- Luo, J.; Fu, L. A Smartphone Indoor Localization Algorithm Based on WLAN Location Fingerprinting with Feature Extraction and Clustering. Sensors 2017, 17, 1339. [Google Scholar] [CrossRef]
- Wang, G.; Gu, C.; Inoue, T.; Li, C. A Hybrid FMCW-Interferometry Radar for Indoor Precise Positioning and Versatile Life Activity Monitoring. IEEE Trans. Microwave Theory Tech. 2014, 62, 2812–2822. [Google Scholar] [CrossRef]
- Li, F.; Yang, C.; Xia, Y.; Ma, X.; Zhang, T.; Zhou, Z. An Adaptive S-Method to Analyze Micro-Doppler Signals for Human Activity Classification. Sensors 2017, 17, 2769. [Google Scholar] [CrossRef] [PubMed]
- Nannuru, S.; Li, Y.; Coates, M.; Yang, B. Multi-target device-free tracking using radio frequency tomography. In Proceedings of the International Conference on Intelligent Sensors, Sensor Networks and Information Processing, Adelaide, SA, Australia, 6–9 December 2012. [Google Scholar]
- Rabiee, R.; Zhong, X.; Yan, Y.; Tay, W.P. LaIF: A Lane-Level Self-Positioning Scheme for Vehicles in GNSS-Denied Environments. IEEE Trans. Intell. Transp. Syst. 2018, 20, 2944–2961. [Google Scholar] [CrossRef]
- Wang, H.; Zhang, D.; Wang, Y.; Ma, J.; Wang, Y.; Li, S. RT-Fall: A Real-time and Contactless Fall Detection System with Commodity WiFi Devices. IEEE Trans. Mob. Comput. 2016, 16, 511–526. [Google Scholar] [CrossRef]
- Yan, W.; Jian, L.; Chen, Y.; Gruteser, M.; Liu, H. E-eyes: Device-free location-oriented activity identification using fine-grained WiFi signatures. In Proceedings of the MobiCom, New York, NY, USA, 7–11 September 2014; pp. 617–628. [Google Scholar]
- Han, C.; Wu, K.; Wang, Y.; Ni, L.M. WiFall: Device-Free Fall Detection by Wireless Networks. IEEE Trans. Mob. Comput. 2014, 16, 581–594. [Google Scholar]
- Pu, Q.; Gupta, S.; Gollakota, S.; Patel, S. Whole-home gesture recognition using wireless signals. In Proceedings of the MobiCom, Miami, FL, USA, 30 September–4 October 2013. [Google Scholar]
- Huang, D.; Nandakumar, R.; Gollakota, S. Feasibility and limits of Wi-Fi imaging. In Proceedings of the ACM Conference on Embedded Network Sensor Systems, Memphis, TN, USA, 3–6 November 2014; pp. 266–279. [Google Scholar]
- Chelli, A.; Pätzold, M. A Machine Learning Approach for Fall Detection Based on the Instantaneous Doppler Frequency. IEEE Access 2019, 7, 166173–166189. [Google Scholar] [CrossRef]
- Nguyen, V.H.; Pyun, J.Y. Location Detection and Tracking of Moving Targets by a 2D IR-UWB Radar System. Sensors 2015, 15, 6740–6762. [Google Scholar] [CrossRef]
- Stelios, M.A.; Nick, A.D.; Effie, M.T.; Dimitris, K.M.; Thomopoulos, S.C.A. An indoor localization platform for ambient assisted living using UWB. In Proceedings of the International Conference on Advances in Mobile Computing and Multimedia, Linz, Austria, 24–26 November 2008; pp. 178–182. [Google Scholar]
- Zhai, S.; Jiang, T. Target detection and classification by measuring and processing bistatic UWB radar signal. Measurement 2014, 47, 547–557. [Google Scholar] [CrossRef]
- Liang, J.; Liang, Q.; Samn, S.W. Foliage Clutter Modeling Using the UWB Radar. In Proceedings of the IEEE International Conference on Communications, Beijing, China, 19–23 May 2008. [Google Scholar]
- Jing, L.; Liang, Q. A Differential Based Approach for Sense-Through-Foliage Target Detection Using UWB Radar Sensor Networks. In Proceedings of the IEEE International Conference on Communications, Beijing, China, 19–23 May 2008. [Google Scholar]
- Park, J.; Cho, S.H. IR-UWB Radar Sensor for Human Gesture Recognition by Using Machine Learning. In Proceedings of the IEEE International Conference on High-performance Computing & Communications, Sydney, NSW, Australia, 12–14 December 2016. [Google Scholar]
- Yin, J.; Tran, S.N.; Zhang, Q. Human Identification via Unsupervised Feature Learning from UWB Radar Data. In Proceedings of the Pacific-Asia Conference on Knowledge Discovery and Data Mining, Cham, Switzerland, 3–6 June 2018; pp. 322–334. [Google Scholar]
- Mokhtari, G.; Aminikhanghahi, S.; Zhang, Q.; Cook, D.J. Fall detection in smart home environments using UWB sensors and unsupervised change detection. J. Reliab. Intell. Environ. 2018, 4, 131–139. [Google Scholar] [CrossRef]
- Tsuchiyama, K.; Kajiwara, A. Accident detection and health-monitoring UWB sensor in toilet. In Proceedings of the IEEE Topical Conference on Wireless Sensors and Sensor Networks, Orlando, FL, USA, 20–23 January 2019. [Google Scholar]
- Lin, Y.; Kernec, J.L.; Yang, S.; Fioranelli, F.; Romain, O.; Zhao, Z. Human Activity Classification With Radar: Optimization and Noise Robustness With Iterative Convolutional Neural Networks Followed With Random Forests. IEEE Sens. 2018, 18, 9669–9681. [Google Scholar] [CrossRef]
- Sadreazami, H.; Bolic, M.; Rajan, S. Fall Detection Using Standoff Radar-Based Sensing and Deep Convolutional Neural Network. IEEE Trans. Circuits Syst. Express Briefs 2020, 67, 197–201. [Google Scholar] [CrossRef]
- Sadreazami, H.; Bolic, M.; Rajan, S. Residual Network-Based Supervised Learning of Remotely Sensed Fall Incidents using Ultra-Wideband Radar. In Proceedings of the IEEE International Symposium on Circuits and Systems, Sapporo, Japan, 26–29 May 2019; pp. 1–4. [Google Scholar]
- Liu, X.; Li, H.; Lou, C.; Liang, T.; Liu, X.; Wang, H. A New Approach to Fall Detection Based on Improved Dual Parallel Channels Convolutional Neural Network. Sensors 2019, 19, 2814. [Google Scholar] [CrossRef]
- Ultra-Wideband Radar and Channel Analysis for Research and Education. Available online: https://www.humatics.com/products/scholar-radar/ (accessed on 1 November 2019).
- UWBfall Dataset. Available online: https://github.com/milllilitre/UWBfall (accessed on 1 November 2019).
- Qian, T. Wavelet Analysis and Applications; Birkhauser: Basel, Switzerland, 2007; Volume 3. [Google Scholar]
- Shi, X.; Chen, Z.; Hao, W.; Yeung, D.Y.; Woo, W.C. Convolutional LSTM Network: A Machine Learning Approach for Precipitation Nowcasting. In Proceedings of the International Conference on Neural Information Processing Systems, Montreal, QC, Canada, 7–12 December 2015; pp. 802–810. [Google Scholar]
- Sutskever, I.; Martens, J.; Dahl, G.; Hinton, G. On the importance of initialization and momentum in deep learning. In Proceedings of the 30th International Conference on International Conference on Machine Learning, Atlanta, GA, USA, 16–21 June 2013; pp. III-1139–III-1147. [Google Scholar]
- Altman, D.G.; Bland, J.M. Diagnostic tests. 1: Sensitivity and specificity. BMJ 1994, 308, 1552. [Google Scholar] [CrossRef]


| Ref | Type of Sensor | N Users | N Records | N Classes | Covered Area | Algorithms | Accuracy (%) | Sensitivity (%) | Specificity (%) |
|---|---|---|---|---|---|---|---|---|---|
| [32] | FMCW Radar | 5 | 6720 | 7 | 6 m | ICNN Random Forest | 99.11 | 97.78 | 99.45 |
| [30] | UWB radar | 2 | 240 | 6 | Door area | SEP SVM | 97.5 | 100 | NS |
| [19] | Wi-Fi | 10 | 13,000 | 4 | 7 m | SVM Random Forest | 94 | NS | NS |
| [35] | Surface electromyography | 10 | 1600 | 4 | NS | IDPC-CNN | 92.55 | 95.71 | 91.7 |
| [34] | UWB radar | 10 | 336 | 5 | 10 m | Deep residual neural network | 93.07 | 90.91 | NS |
| [22] | Simulated Wi-Fi using path model | 30 | 900 | 3 | NS | Cubic SVM | 98.7 | 99.7 | NS |
| [33] | UWB radar | 5 | 2665 | 5 | 10 m | CNN | 95.3 | 100 | 91.67 |
| Test Subjects | I | II | III | IV | V |
|---|---|---|---|---|---|
| Gender | Male | Male | Female | Male | Female |
| Weight | 60 kg | 90 kg | 50 kg | 75 kg | 55 kg |
| Height | 175 cm | 180 cm | 160 cm | 180 cm | 165 cm |
| Method | CNN | CNN-KNN 1 | CNN-RF | CNN-ConvLSTM | CNN-ConvLSTM-KNN 1 | CNN-ConvLSTM-RF |
|---|---|---|---|---|---|---|
| Accuracy | 84.8% | 83.3% | 85.8% | 93.0% | 90.7% | 92.5% |
| Sensitivity | 93.0% | 91.0% | 94.0% | 95.0% | 96.0% | 95.0% |
| Specificity | 83.2% | 81.8% | 84.2% | 92.6% | 89.6% | 92.0% |
| Method | CNN | CNN-KNN | CNN-RF | CNN-ConvLSTM | CNN-ConvLSTM-KNN | CNN-ConvLSTM-RF |
|---|---|---|---|---|---|---|
| Accuracy | 67.2% | 66.1% | 66.3% | 78.3% | 78.0% | 77.9% |
| Sensitivity | 92.9% | 91.3% | 92.9% | 96.8% | 96.0% | 96.8% |
| Specificity | 62.1% | 61.1% | 61.0% | 74.6% | 74.4% | 74.1% |
| Method | CNN | CNN-KNN | CNN-RF | CNN-ConvLSTM | CNN-ConvLSTM-KNN | CNN-ConvLSTM-RF |
|---|---|---|---|---|---|---|
| Accuracy | 84.24 | 83.01 | 86.41 | 95.78 | 93.33 | 95.36 |
| Sensitivity | 93.73 | 91.76 | 91.96 | 98.04 | 97.65 | 97.06 |
| Specificity | 82.35 | 81.25 | 85.29 | 95.33 | 92.47 | 95.02 |
| Method | CNN | CNN-KNN | CNN-RF | CNN-ConvLSTM | CNN-ConvLSTM-KNN | CNN-ConvLSTM-RF |
|---|---|---|---|---|---|---|
| Accuracy | 17.9 | 19.6 | 18.6 | 19.3 | 22 | 21.7 |
| Method | CNN | CNN-KNN | CNN-RF | CNN-ConvLSTM | CNN-ConvLSTM-KNN | CNN-ConvLSTM-RF |
|---|---|---|---|---|---|---|
| Execution time/task (μs) | 352 | 518 | 367 | 651 | 925 | 662 |
© 2020 by the authors. Licensee MDPI, Basel, Switzerland. This article is an open access article distributed under the terms and conditions of the Creative Commons Attribution (CC BY) license (http://creativecommons.org/licenses/by/4.0/).
Share and Cite
Ma, L.; Liu, M.; Wang, N.; Wang, L.; Yang, Y.; Wang, H. Room-Level Fall Detection Based on Ultra-Wideband (UWB) Monostatic Radar and Convolutional Long Short-Term Memory (LSTM). Sensors 2020, 20, 1105. https://doi.org/10.3390/s20041105
Ma L, Liu M, Wang N, Wang L, Yang Y, Wang H. Room-Level Fall Detection Based on Ultra-Wideband (UWB) Monostatic Radar and Convolutional Long Short-Term Memory (LSTM). Sensors. 2020; 20(4):1105. https://doi.org/10.3390/s20041105
Chicago/Turabian StyleMa, Liang, Meng Liu, Na Wang, Lu Wang, Yang Yang, and Hongjun Wang. 2020. "Room-Level Fall Detection Based on Ultra-Wideband (UWB) Monostatic Radar and Convolutional Long Short-Term Memory (LSTM)" Sensors 20, no. 4: 1105. https://doi.org/10.3390/s20041105
APA StyleMa, L., Liu, M., Wang, N., Wang, L., Yang, Y., & Wang, H. (2020). Room-Level Fall Detection Based on Ultra-Wideband (UWB) Monostatic Radar and Convolutional Long Short-Term Memory (LSTM). Sensors, 20(4), 1105. https://doi.org/10.3390/s20041105