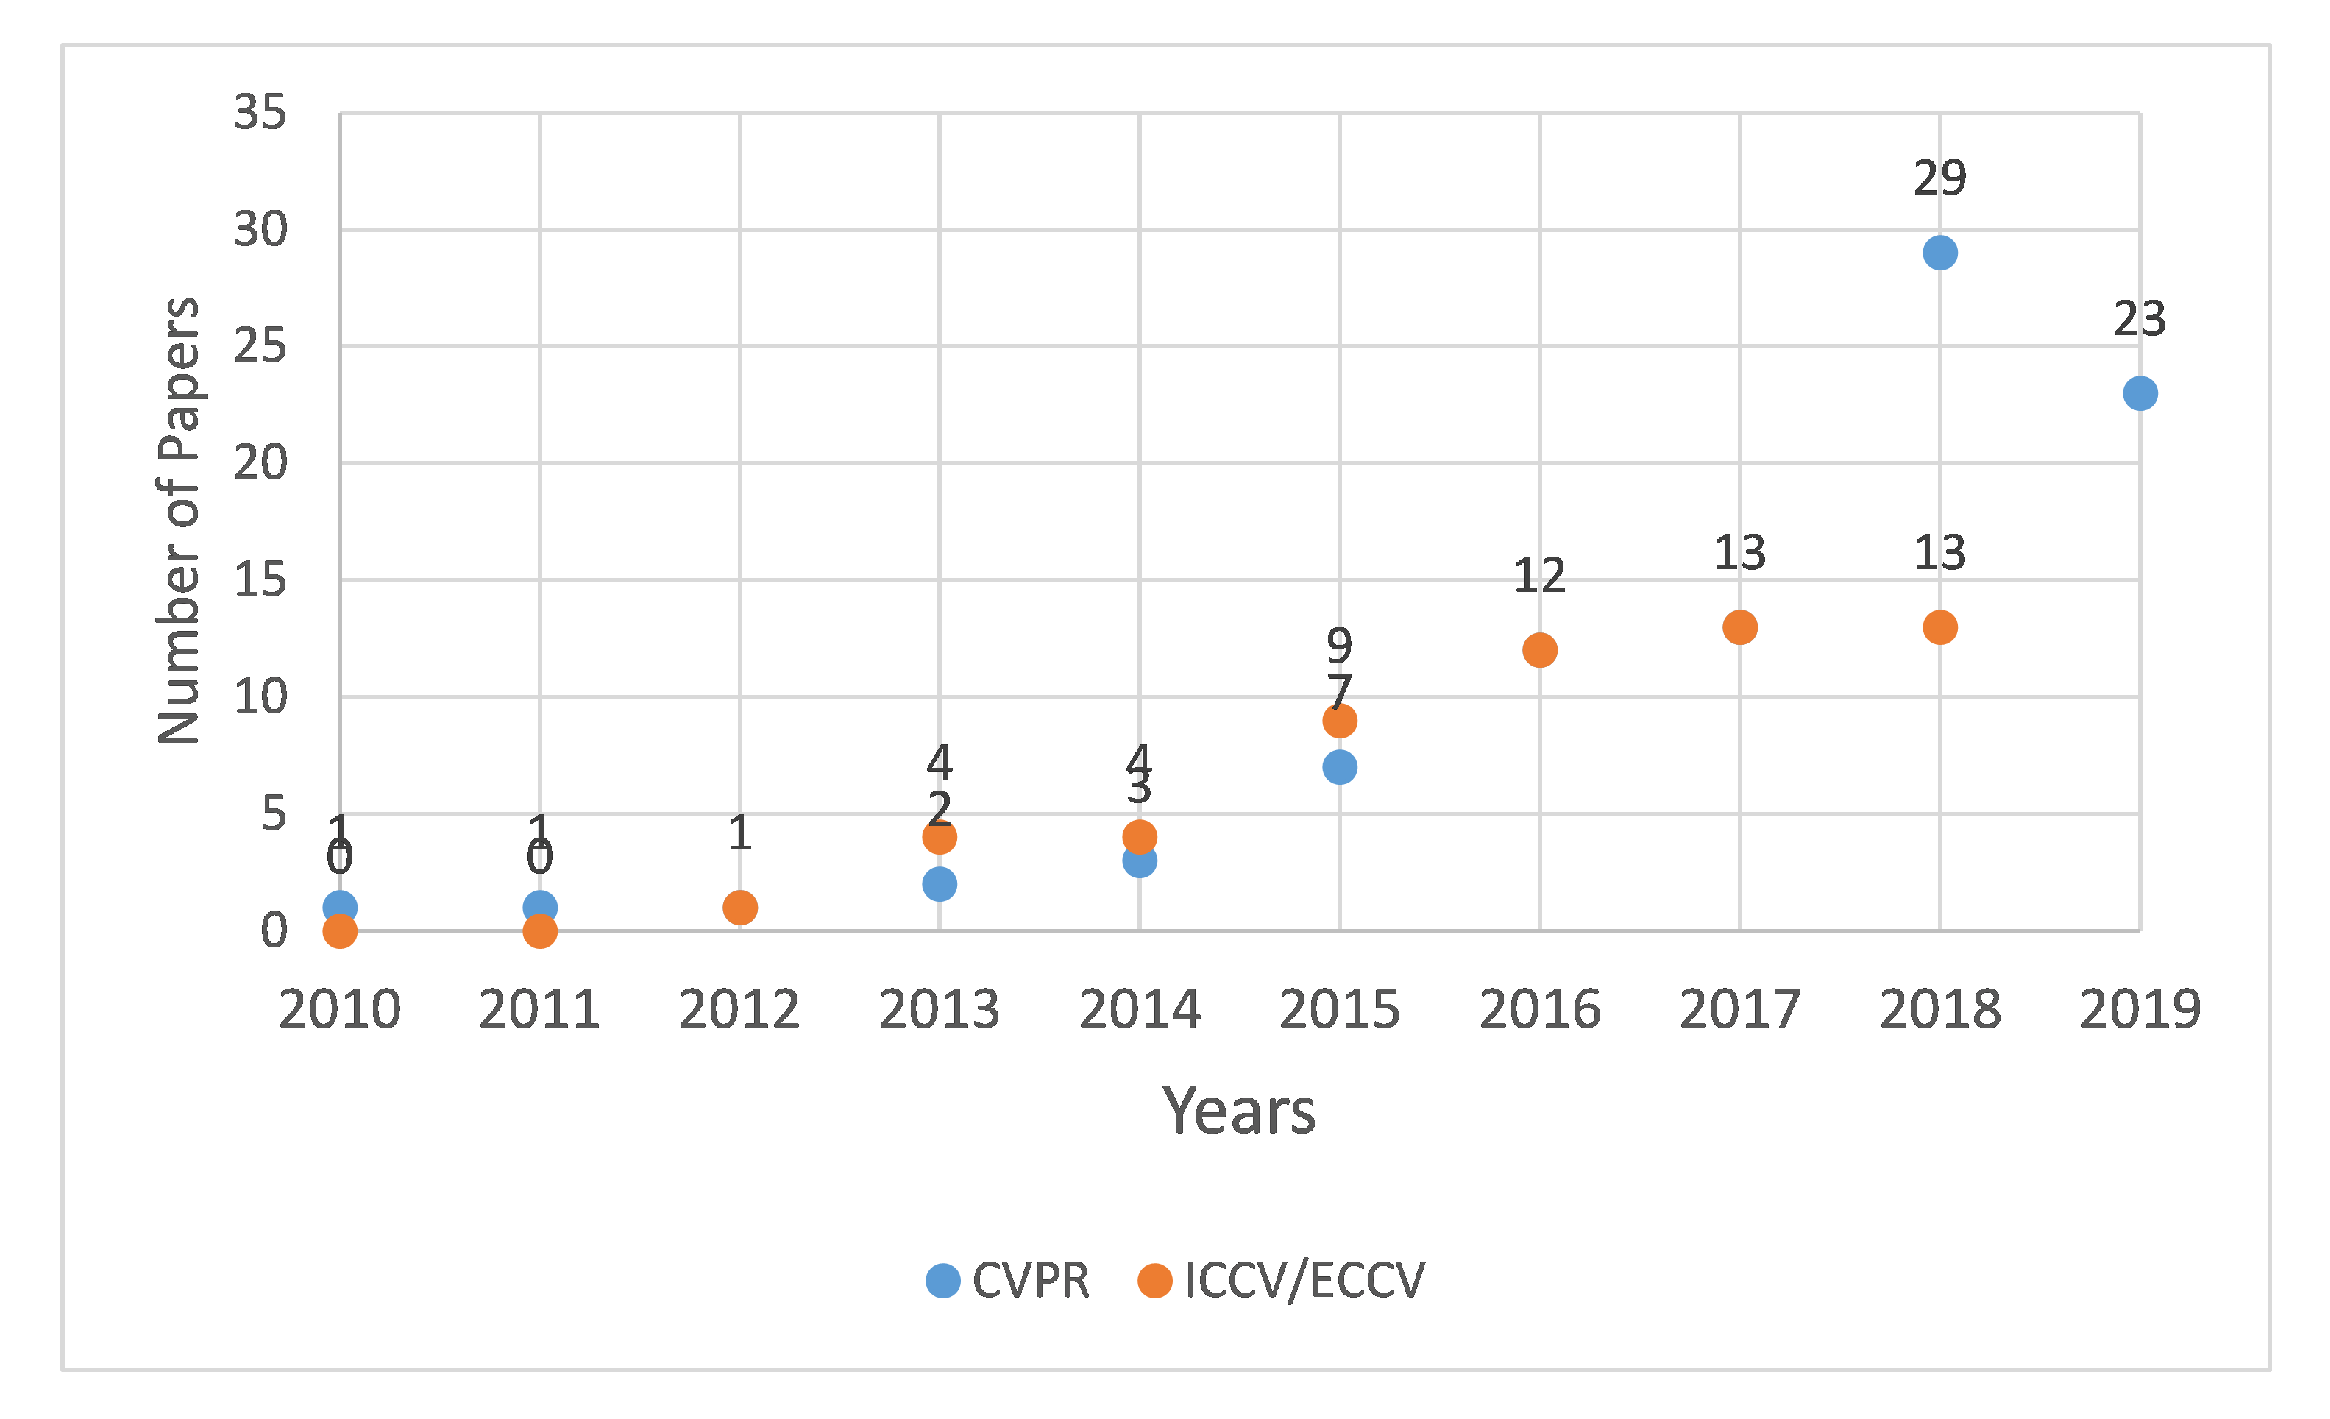
Figure 1.
Plot depicting the increasing trend of re-ID publications in top computer vision conferences including CVPR, ICCV and ECCV.
Figure 1.
Plot depicting the increasing trend of re-ID publications in top computer vision conferences including CVPR, ICCV and ECCV.
Figure 2.
The sensors were attached tightly on the chest of the subject using elastic bands: (a) smartphone (MPU-6500) sensor; and (b) APDM Opal IMU.
Figure 2.
The sensors were attached tightly on the chest of the subject using elastic bands: (a) smartphone (MPU-6500) sensor; and (b) APDM Opal IMU.
Figure 3.
Raw low-level 6D inertial signals captured during a gait trial: (a) 3D accelerations; and (b) 3D angular velocities.
Figure 3.
Raw low-level 6D inertial signals captured during a gait trial: (a) 3D accelerations; and (b) 3D angular velocities.
Figure 4.
GRU with update and reset gates; the update gate decides what information to keep and what to throw away while the reset gate decides which information to keep.
Figure 4.
GRU with update and reset gates; the update gate decides what information to keep and what to throw away while the reset gate decides which information to keep.
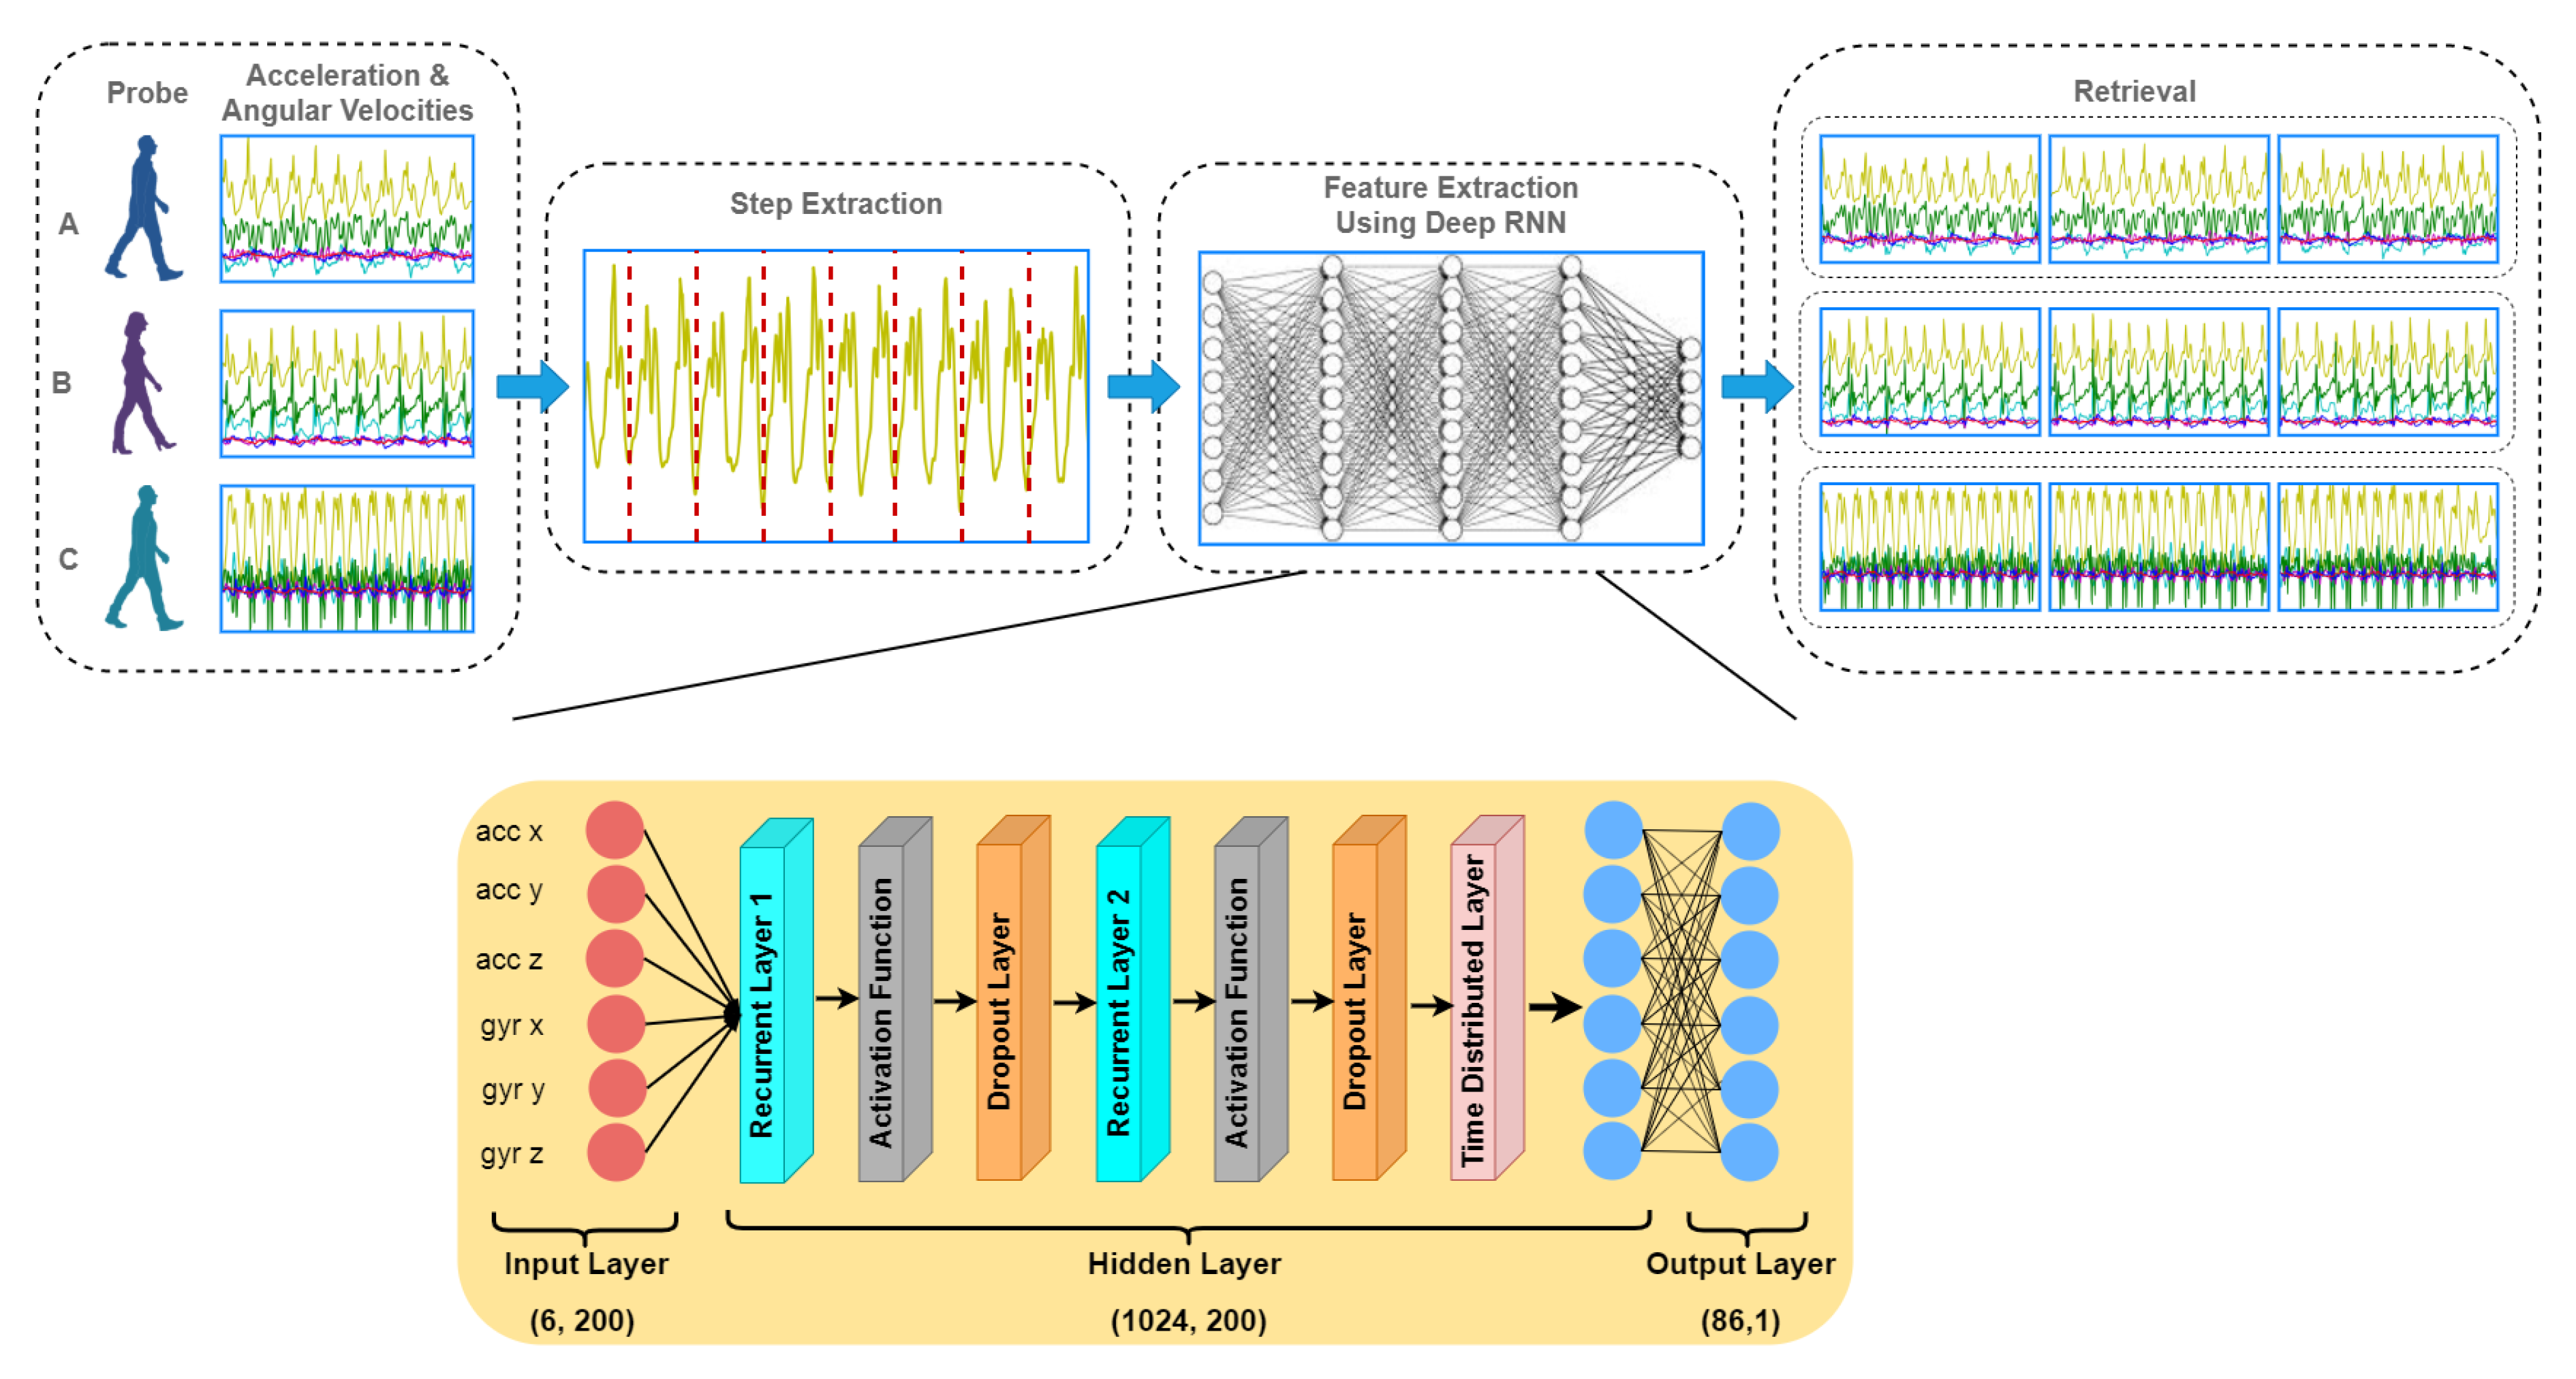
Figure 5.
An overview of the proposed method. The gait pattern is captured using IMUs and raw signals from 6D components are used to train deep learning model.
Figure 5.
An overview of the proposed method. The gait pattern is captured using IMUs and raw signals from 6D components are used to train deep learning model.
Figure 6.
The matching rate computed against step data and stride data are shown as CMCs. Only slight variations in the matching rate are observable.
Figure 6.
The matching rate computed against step data and stride data are shown as CMCs. Only slight variations in the matching rate are observable.
Figure 7.
Confusion matrices computed from the steps using hybrid data: (left) train/test split; and (right) 10-fold cross validation. The convention of notations used in the axes are (gender, age, experimental setup), e.g., (F, 22, A) means that the subject is a female who is 22 years old and the data were captured under experimental Setup A. The person re-identification accuracies remained higher for most of the subjects.
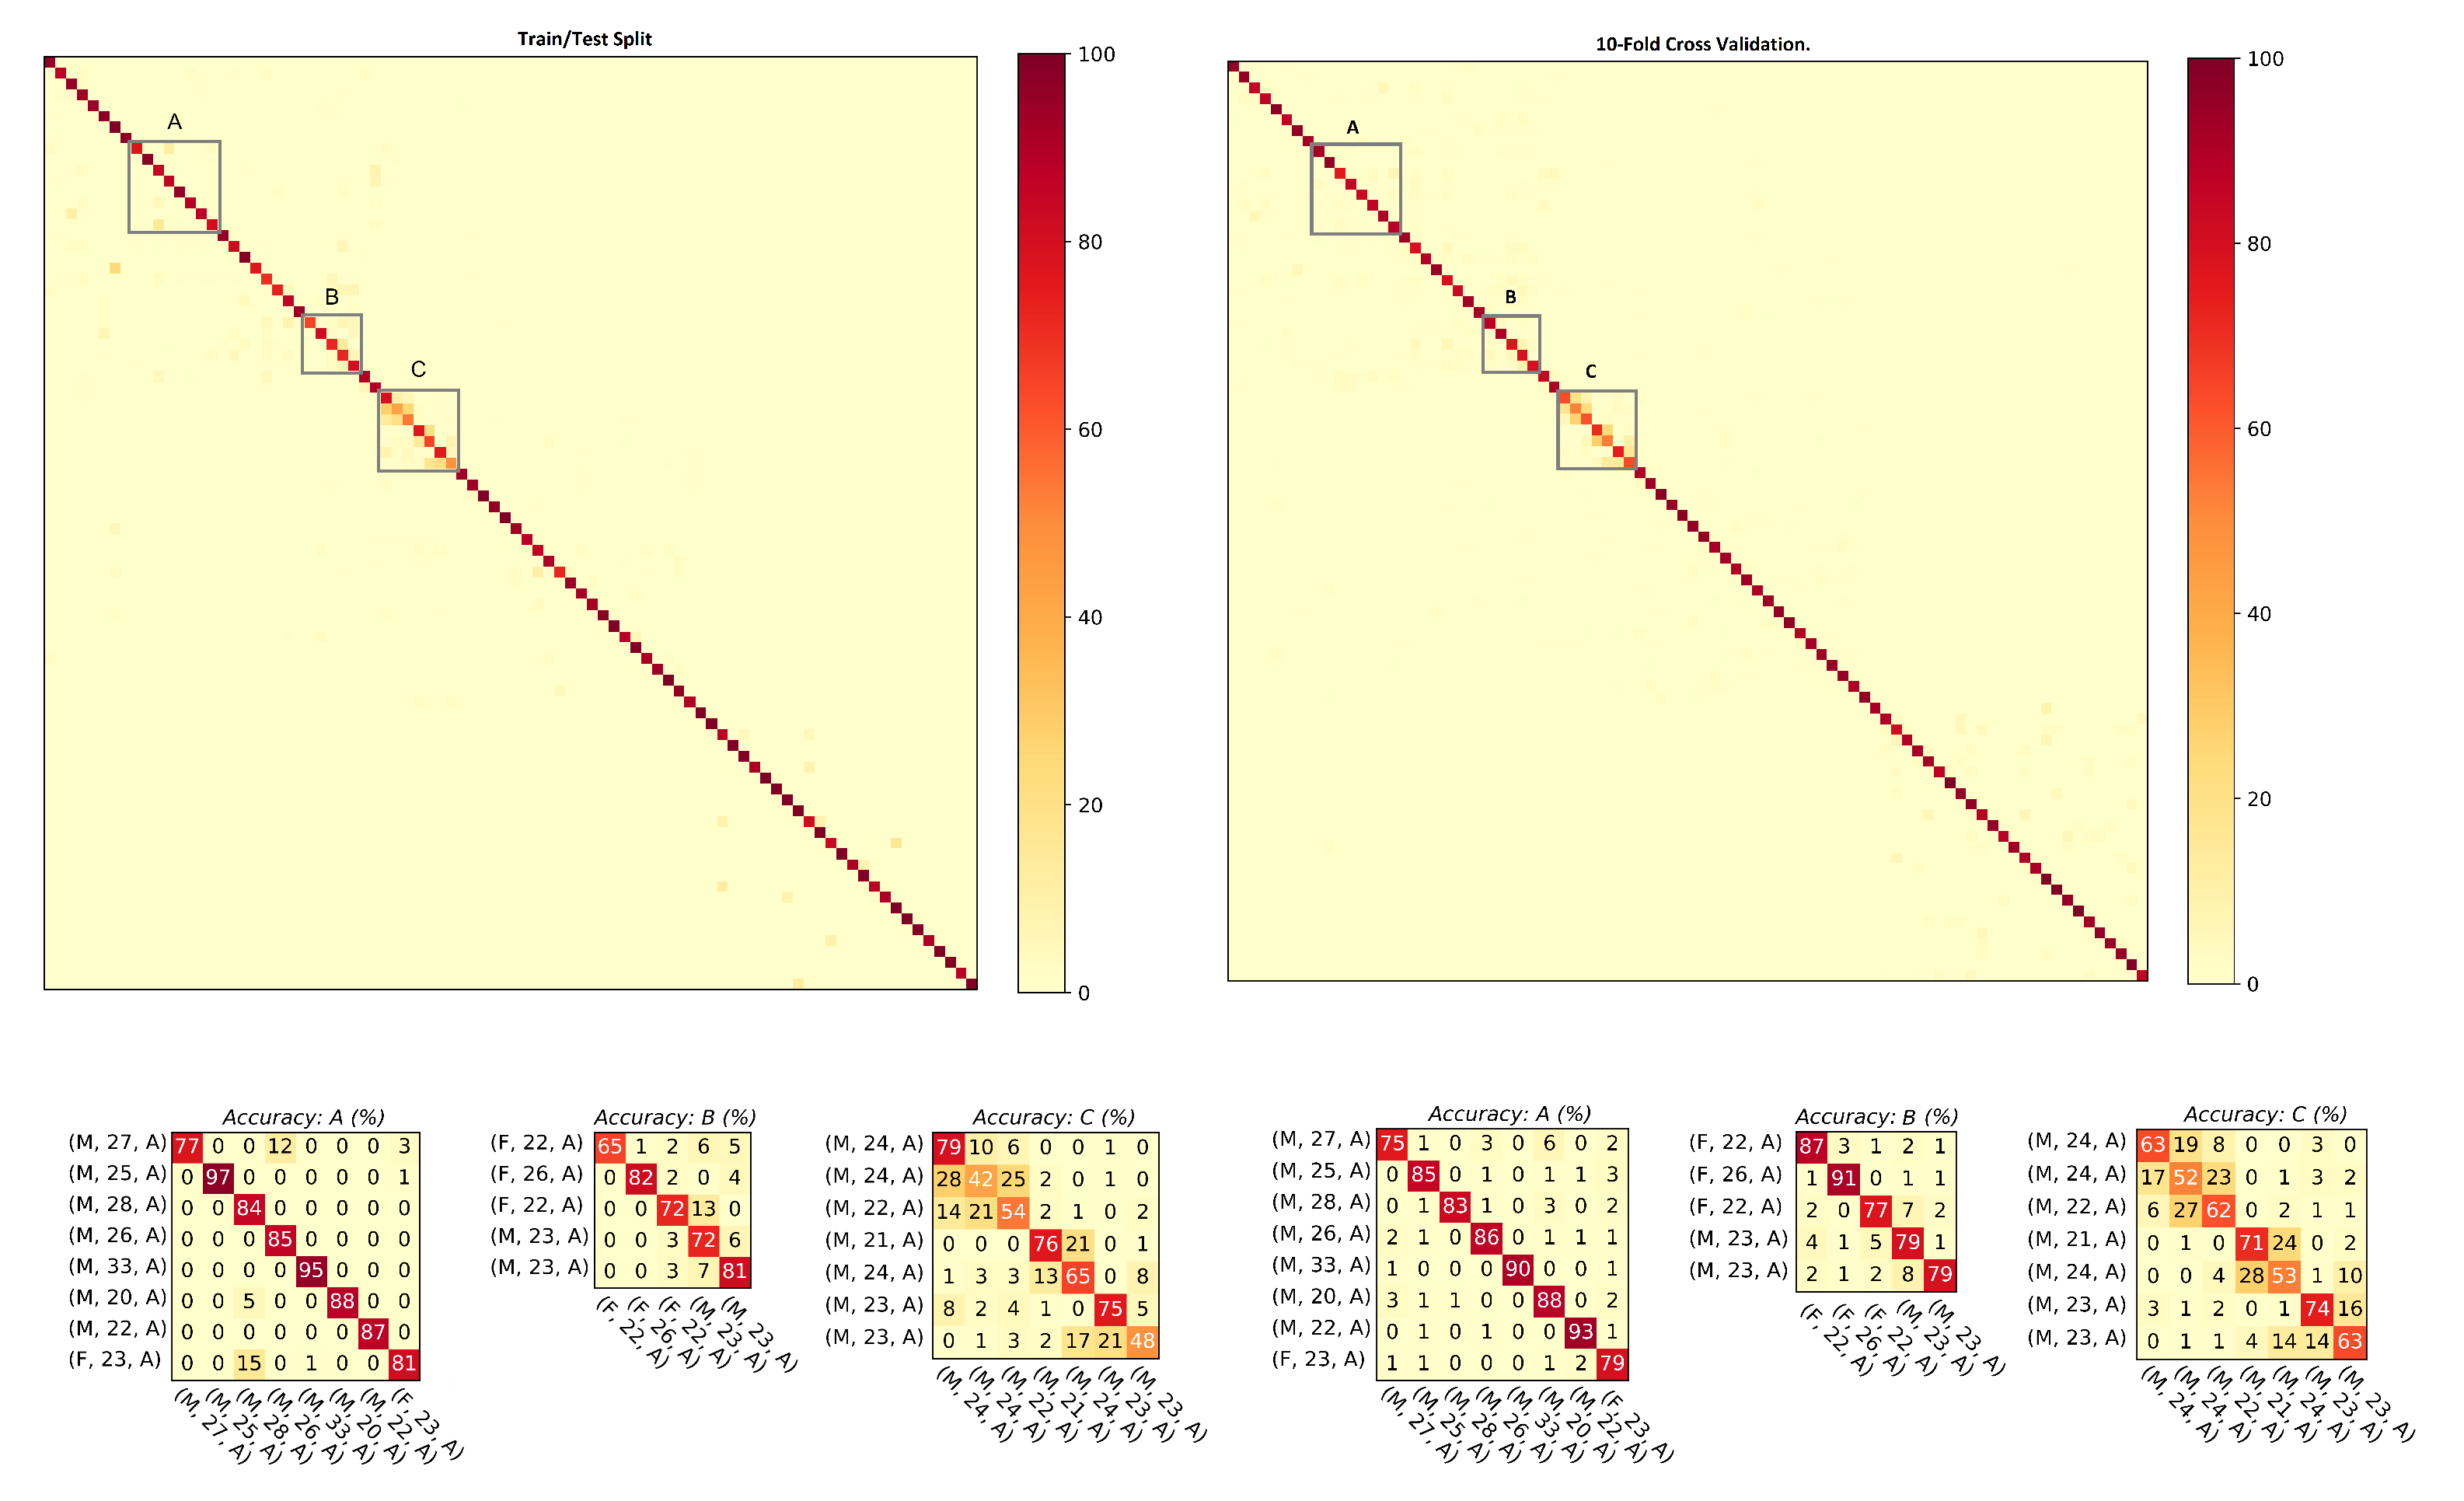
Figure 8.
Confusion matrices computed from the strides using hybrid data: (left) train/test split; and (right) 10-fold cross validation. The convention of notations used in the axes are (gender, age, experimental setup), e.g., (M, 27, A) means that the subject is a male who is 27 years old and the data were captured under experimental Setup A. The person re-identification accuracies remained higher for most of the subjects.
Figure 9.
The graph shows that, for both steps and strides, above 86% of the subjects were correctly re-identified in Rank-1, whereas above 98% of the subjects were correctly re-identified in Rank-5.
Figure 9.
The graph shows that, for both steps and strides, above 86% of the subjects were correctly re-identified in Rank-1, whereas above 98% of the subjects were correctly re-identified in Rank-5.
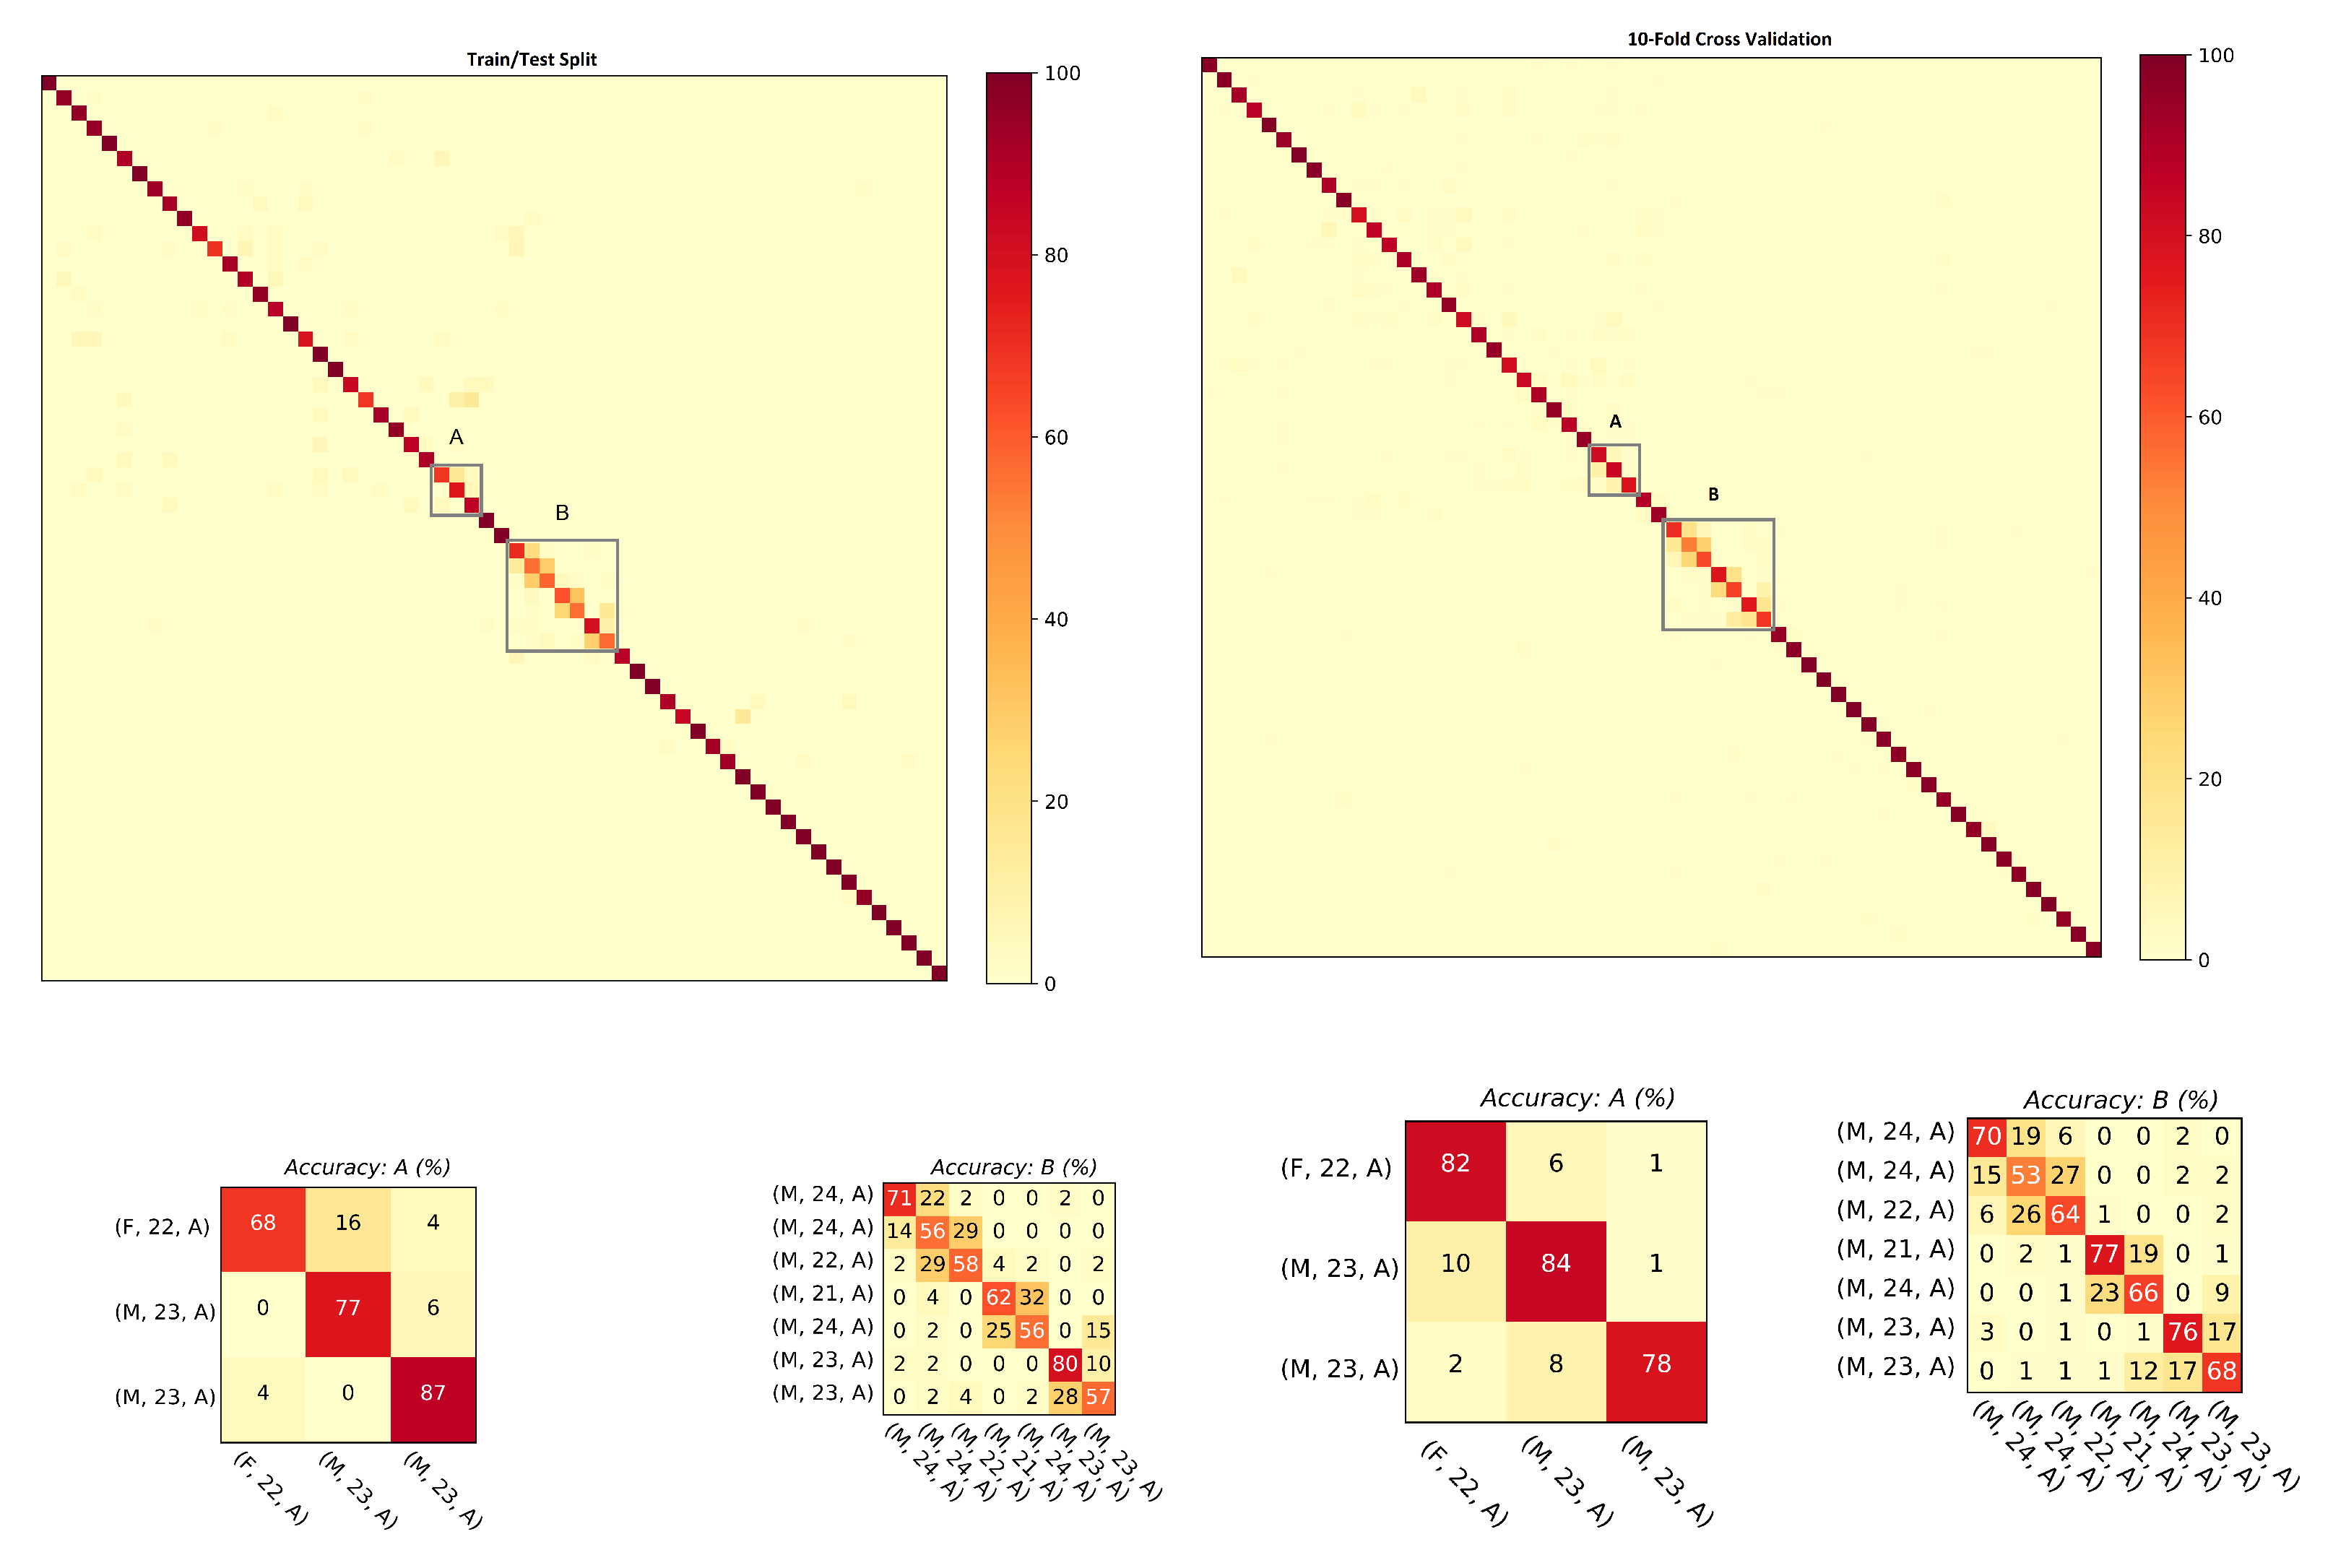
Figure 10.
Confusion matrices computed from the steps using smartphone’s IMU data: (left) train/test split; and (right) 10-fold cross validation. The convention of notations used in the axes are (gender, age, experimental setup), e.g., (F, 22, A) means that the subject is a female who is 22 years old and the data were captured under experimental Setup A. The person re-identification accuracies remained higher for most of the subjects.
Figure 11.
Confusion matrices computed from the strides using smartphone’s IMU data:(left) train/test split; and (right) 10-fold cross validation. The convention of notations used in the axes are (gender, age, experimental setup), e.g., (F, 22, A) means that the subject is a female who is 22 years old and the data were captured under experimental Setup A. The person re-identification accuracies remained higher for most of the subjects.
Figure 12.
The combined curves for steps and strides is shown for comparison using wearable data.
Figure 12.
The combined curves for steps and strides is shown for comparison using wearable data.
Figure 13.
Confusion matrices computed from the wearable IMU data for: steps (left); and strides (right). The dataset consists of 26 subjects and it was collected under Setup C. The person re-identification accuracies remained higher for most of the subjects.
Figure 13.
Confusion matrices computed from the wearable IMU data for: steps (left); and strides (right). The dataset consists of 26 subjects and it was collected under Setup C. The person re-identification accuracies remained higher for most of the subjects.
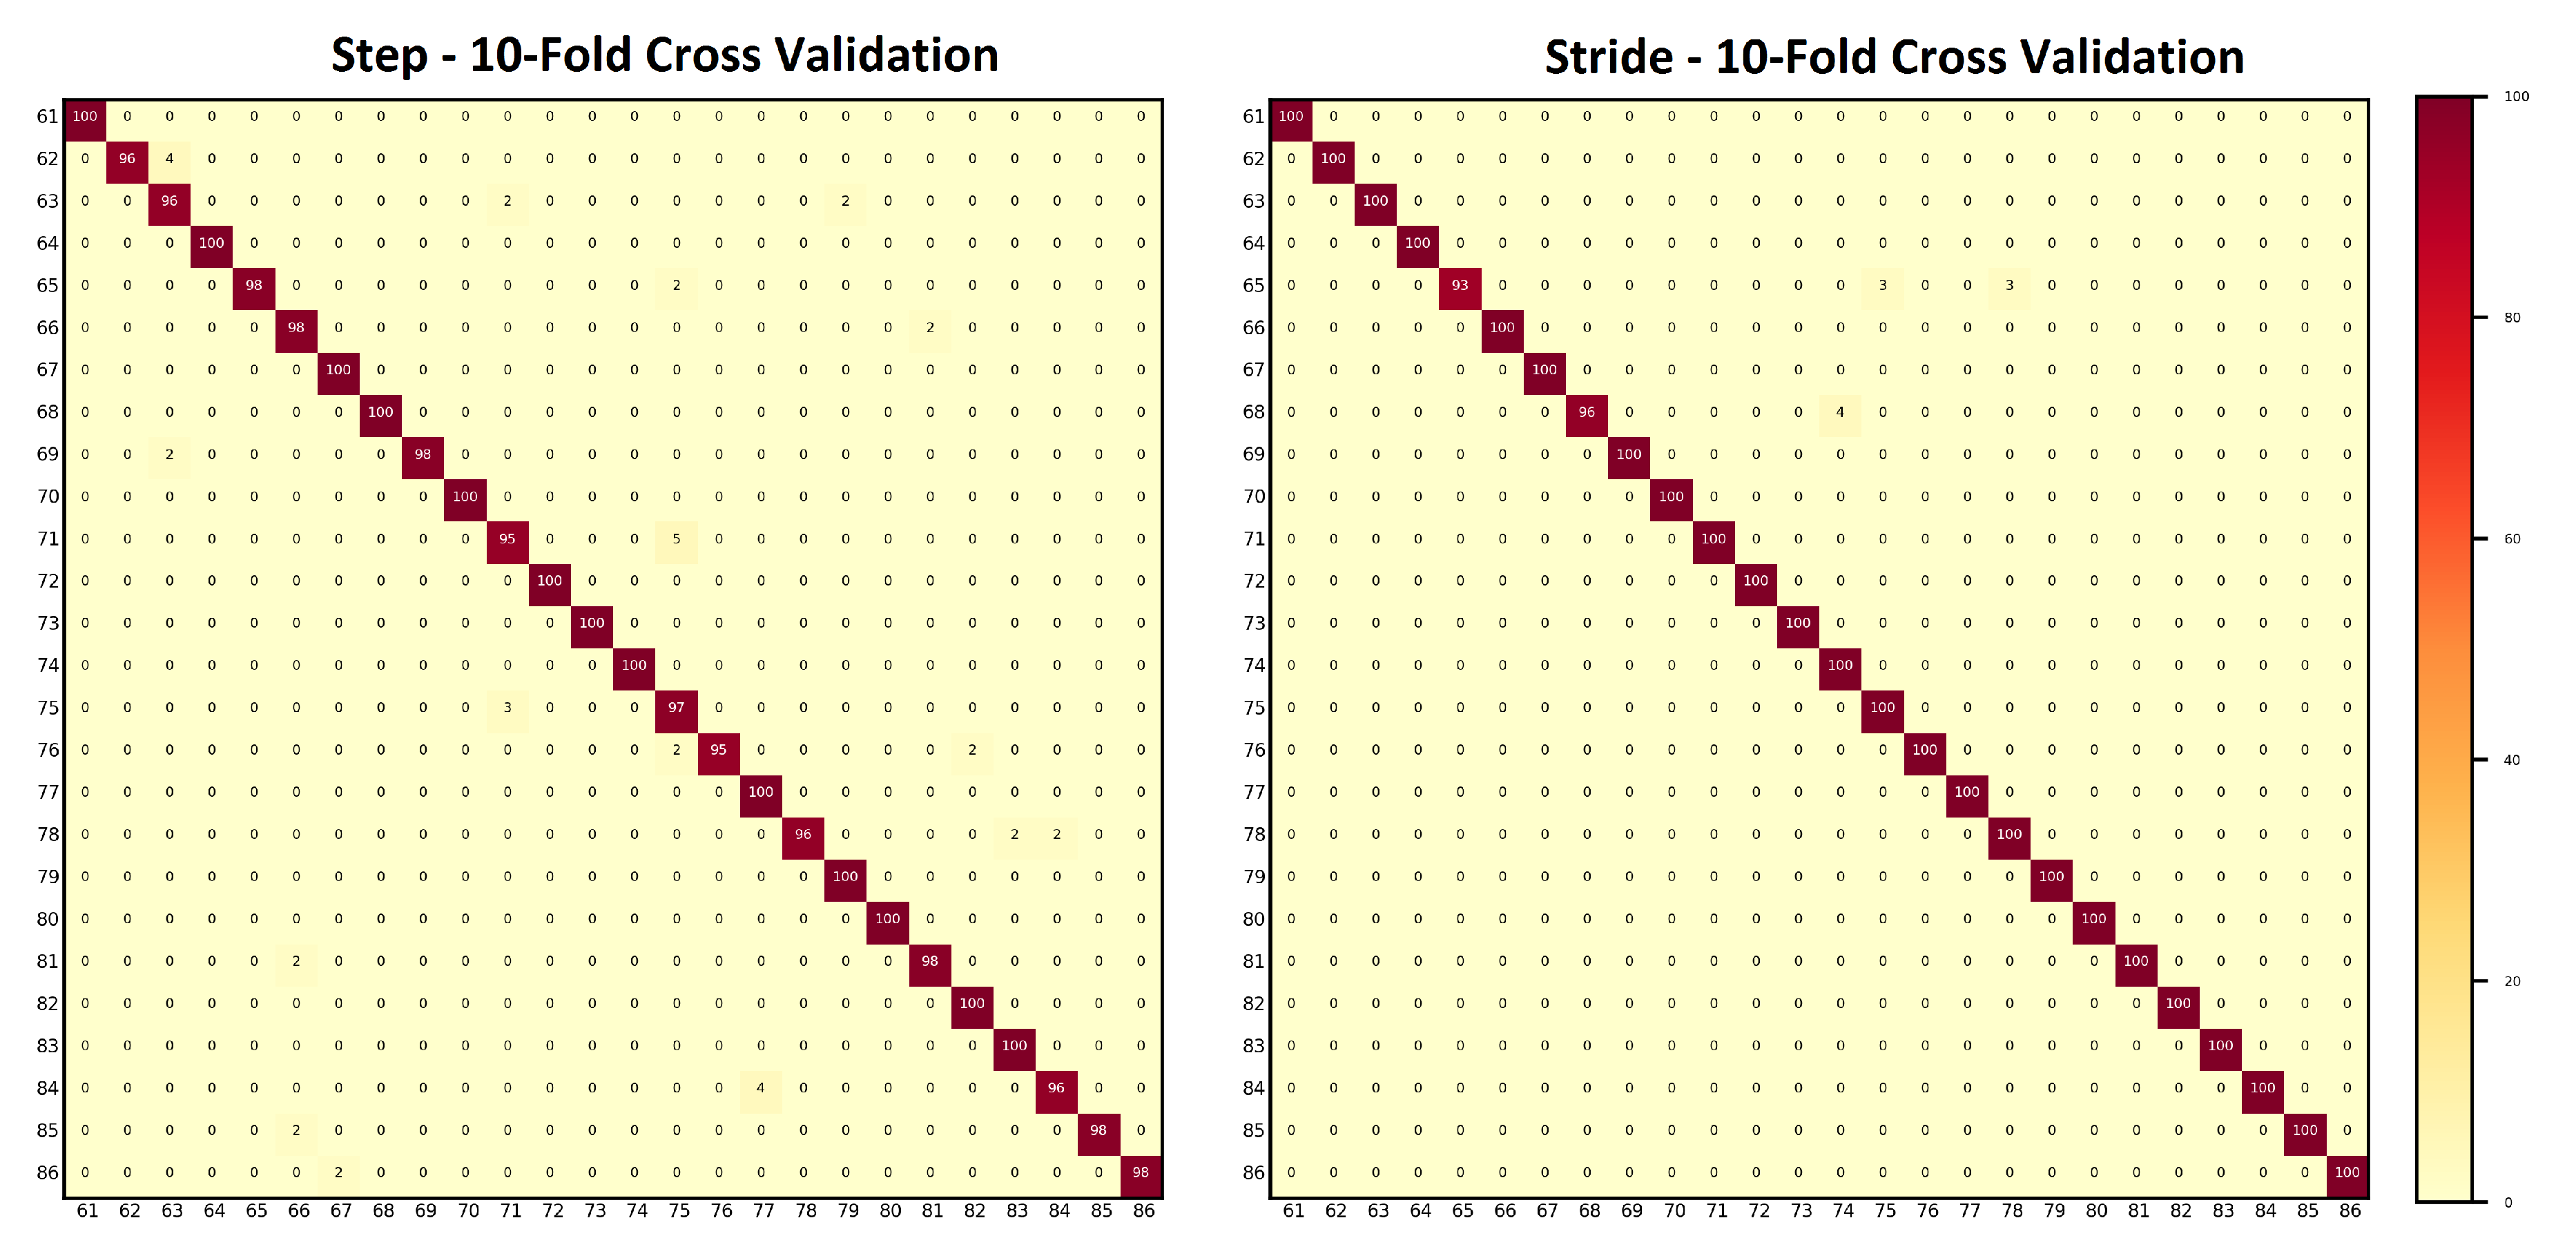
Figure 14.
Confusion matrices computed from the wearable IMU data with 10 fold cross validation for: steps (left); and strides (right). The dataset consists of 26 subjects and it was collected under Setup C. The person re-identification accuracies remained higher for most of the subjects.
Figure 14.
Confusion matrices computed from the wearable IMU data with 10 fold cross validation for: steps (left); and strides (right). The dataset consists of 26 subjects and it was collected under Setup C. The person re-identification accuracies remained higher for most of the subjects.
Figure 15.
Bar graph shows the effect of age-groups on: (a) step data; and (b) stride data. In general, higher classification accuracies were achieved with the stride data.
Figure 15.
Bar graph shows the effect of age-groups on: (a) step data; and (b) stride data. In general, higher classification accuracies were achieved with the stride data.
Figure 16.
This bar graph shows the effect of gender on steps and strides for hybrid data.
Figure 16.
This bar graph shows the effect of gender on steps and strides for hybrid data.
Figure 17.
(a) Scatter plot; and (b) radar graph show the performance of models trained and tested on our gait data. The results show higher accuracies for the stride dataset (200 timesteps) than the step dataset (100 timesteps).
Figure 17.
(a) Scatter plot; and (b) radar graph show the performance of models trained and tested on our gait data. The results show higher accuracies for the stride dataset (200 timesteps) than the step dataset (100 timesteps).
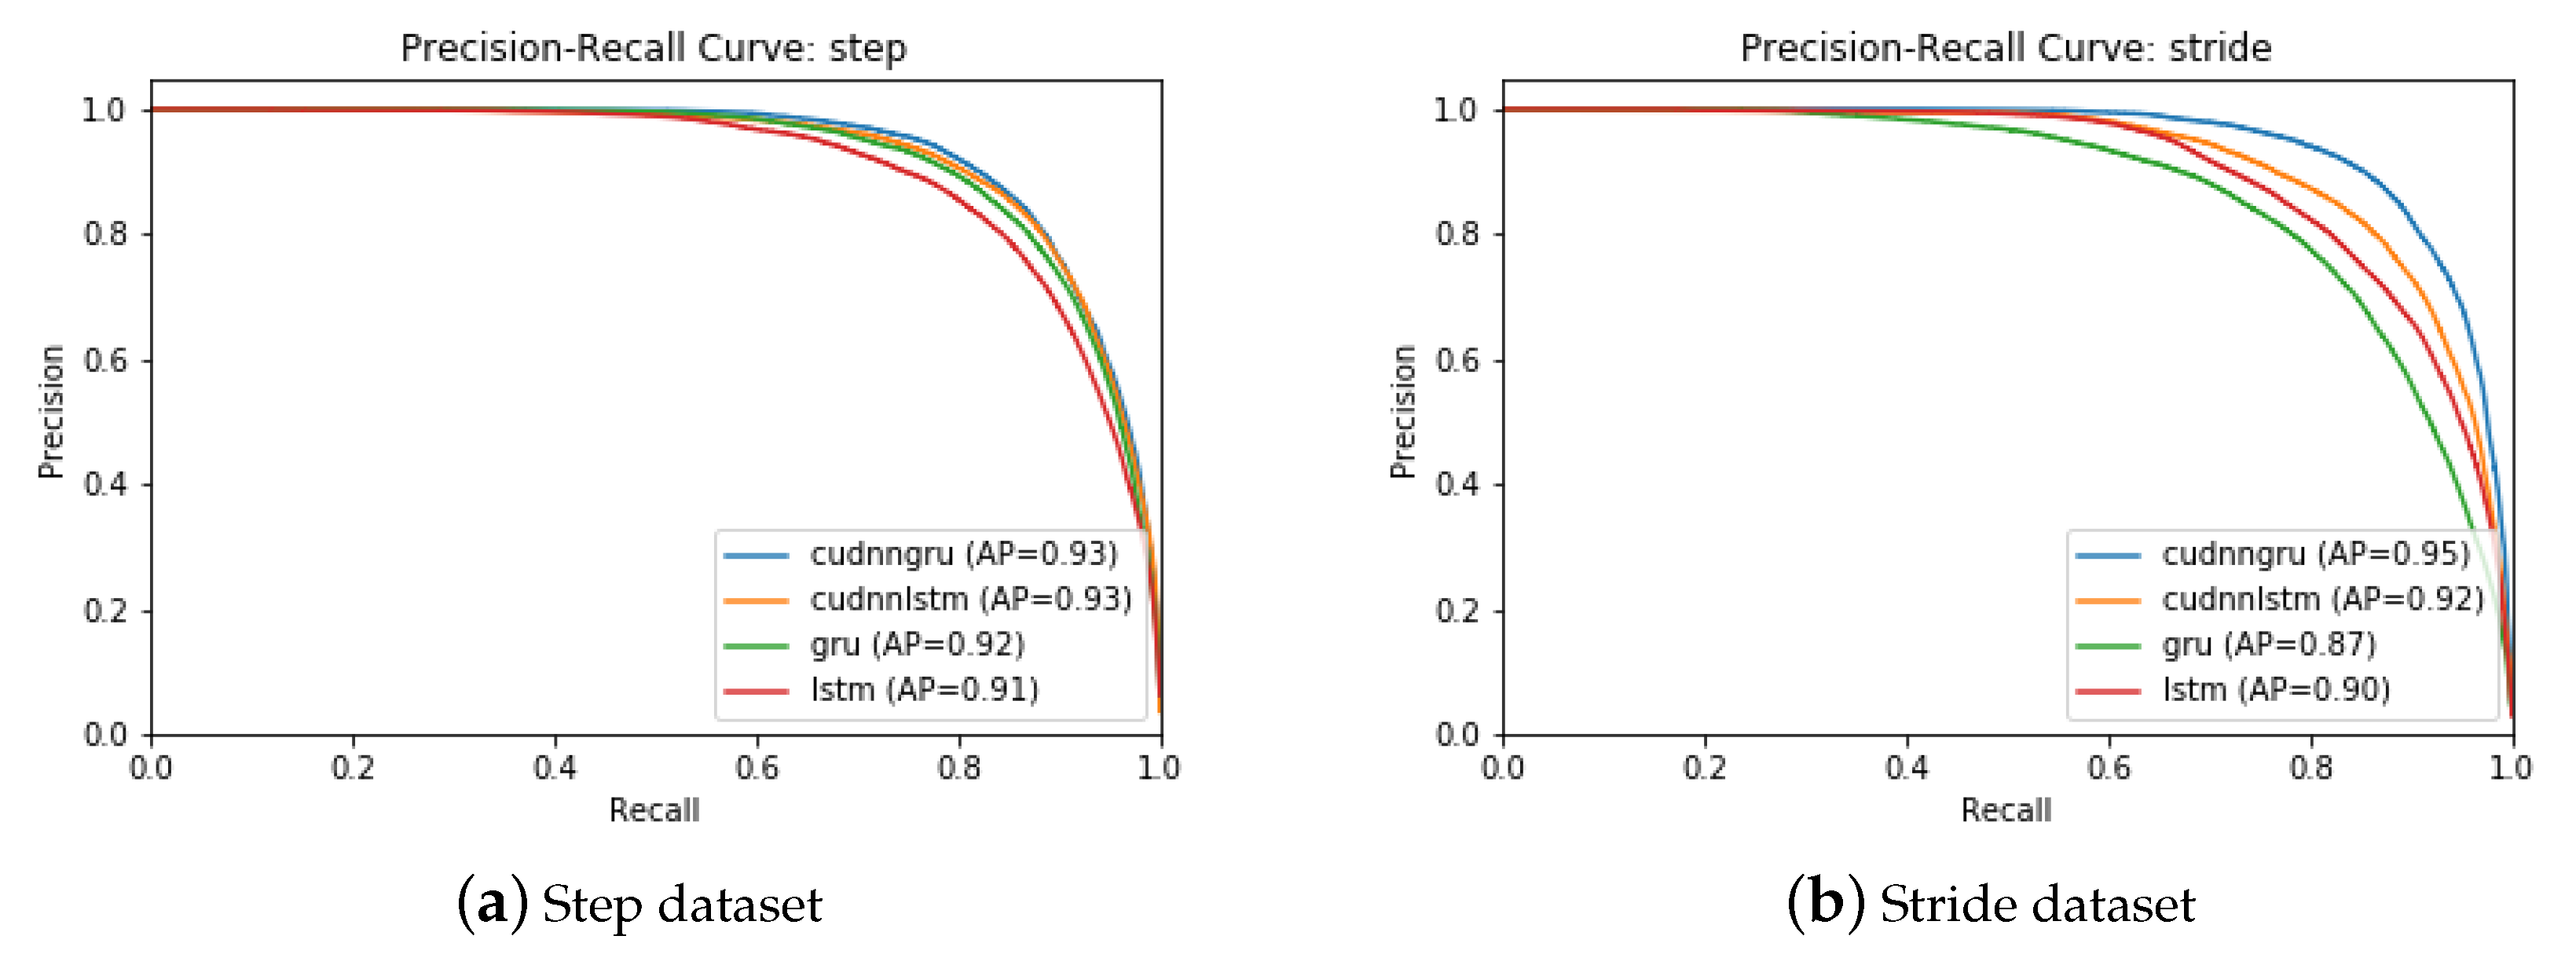
Figure 18.
Precision–recall graphs computed by four different deep models (CuDNNGRU, GRU, CuDNNLSTM, and LSTM) from: (a) step data; and (b) stride data. CuDNNGRU outperformed the rest of the models in all cases.
Figure 18.
Precision–recall graphs computed by four different deep models (CuDNNGRU, GRU, CuDNNLSTM, and LSTM) from: (a) step data; and (b) stride data. CuDNNGRU outperformed the rest of the models in all cases.
Figure 19.
The effect of different hyperparameters including size of the network (specified by the number of neurons), drop-out rate, learning rate, and number of epochs are shown here. The optimal network parameters were 512 neurons trained for 30 epochs with a learning rate of 0.001 and a dropout value of 0.5.
Figure 20.
The relationship between the network recognition effect and its training times from: (a) step data; and (b) stride data. The model was trained for 100 epochs.
Figure 20.
The relationship between the network recognition effect and its training times from: (a) step data; and (b) stride data. The model was trained for 100 epochs.
Table 1.
Characteristics of the population. The data were collected by Riaz et al. [
8] under three different setups: Setups A and B using smartphone’s on-board IMU (MPU-6500) and Setup C using the APMD Opal IMU.
Table 1.
Characteristics of the population. The data were collected by Riaz et al. [
8] under three different setups: Setups A and B using smartphone’s on-board IMU (MPU-6500) and Setup C using the APMD Opal IMU.
| | All Setups | Setup A | Setup B | Setup C |
|---|
| Participants | 86 | 40 | 20 | 26 |
| Male:Female | 49:37 | 26:14 | 11:9 | 12:14 |
| Age (years, ) | 33.8 ± 14.8 | 25.2 ± 5.9 | 32.6 ± 13.7 | 48.1 ± 12.7 |
| Height (cm, ) | 172.1 ± 8.9 | 171.6 ± 8.4 | 169.8 ± 7.9 | 174 ± 10.2 |
Table 2.
The ranking results along with mean average precision computed with the steps and the strides hybrid data are shown. For both steps and strides, above 86% of the subjects were correctly re-identified in Rank-1, whereas above 97.50% of the subjects were correctly re-identified in Rank-5.
Table 2.
The ranking results along with mean average precision computed with the steps and the strides hybrid data are shown. For both steps and strides, above 86% of the subjects were correctly re-identified in Rank-1, whereas above 97.50% of the subjects were correctly re-identified in Rank-5.
| | Rank-1 (%) | Rank-5 (%) | Rank-10 (%) | Rank-20 (%) | mAP (%) |
|---|
| Step | 86.23 | 98.36 | 99.6 | 99.91 | 90.33 |
| Stride | 87.15 | 97.89 | 99.16 | 99.70 | 91.77 |
Table 3.
The ranking results and mean average precision computed with the steps and the stride data collected using the smartphone’s IMU are shown. For both steps and strides, above 86% of the subjects were correctly re-identified in Rank-1, whereas above 98% of the subjects were correctly re-identified in Rank-5.
| | Rank-1 (%) | Rank-5 (%) | Rank-10 (%) | Rank-20 (%) | mAP (%) |
|---|
| Step | 86.18 | 98.13 | 99.05 | 99.93 | 91.36 |
| Stride | 86.95 | 98.09 | 99.02 | 99.07 | 91.09 |
Table 4.
The ranking results along with mean average precision computed from the steps and the stride data collected using wearable IMU are shown here. For both steps and strides, above 98% of the subjects were correctly re-identified in Rank-1, whereas above 99% of the subjects were correctly re-identified in Rank-5.
| | Rank-1 (%) | Rank-5 (%) | Rank-10 (%) | Rank-20 (%) | mAP (%) |
|---|
| Step | 98.06 | 99.96 | 99.99 | 100.00 | 99.26 |
| Stride | 98.73 | 99.98 | 100.00 | 100.00 | 99.34 |
Table 5.
The subjects participated in the data collection sessions are placed in six age groups. The number of subjects in each age group under different datasets, i.e., hybrid, smartphone, and wearable IMU, are shown.
Table 5.
The subjects participated in the data collection sessions are placed in six age groups. The number of subjects in each age group under different datasets, i.e., hybrid, smartphone, and wearable IMU, are shown.
| | No. of Subjects |
|---|
| | Age Groups (y) | Hybrid | Smartphone | Wearable IMU |
|---|
| G | 10–19 | 3 | 3 | 0 |
| G | 20–29 | 48 | 47 | 1 |
| G | 30–39 | 9 | 1 | 8 |
| G | 40–49 | 10 | 4 | 6 |
| G | 50–59 | 9 | 4 | 5 |
| G | 60–69 | 7 | 1 | 6 |
Table 6.
Results of test accuracies computed with the models trained on steps and strides hybrid data when applying age restriction are shown here. The numbers in parentheses indicate the number of subjects in the respective group.
Table 6.
Results of test accuracies computed with the models trained on steps and strides hybrid data when applying age restriction are shown here. The numbers in parentheses indicate the number of subjects in the respective group.
| | Test Accuracies (%) |
|---|
| G (3) | G (48) | G (9) | G (10) | G (9) | G (7) |
|---|
| Step | 93.03 | 83.58 | 90.53 | 89.13 | 97.23 | 97.59 |
| Stride | 98.57 | 85.55 | 94.31 | 98.07 | 97.36 | 100.00 |
Table 7.
Results of test accuracies computed with the models trained on steps and strides smartphone’s IMU data when applying age restriction are shown here. The numbers in parentheses indicate the number of subjects in the respective group.
Table 7.
Results of test accuracies computed with the models trained on steps and strides smartphone’s IMU data when applying age restriction are shown here. The numbers in parentheses indicate the number of subjects in the respective group.
| | Test Accuracies (%) |
|---|
| G (3) | G (47) | G (1) | G (4) | G (4) | G (1) |
|---|
| Step | 90.74 | 84.17 | 98.55 | 93.53 | 94.82 | 96.43 |
| Stride | 98.59 | 85.86 | 96.43 | 95.83 | 100.00 | 100.00 |
Table 8.
Results of test accuracies computed with the models trained on step and stride wearable IMU data when applying age restriction are shown here. The numbers in parentheses indicate the number of subjects in the respective group.
Table 8.
Results of test accuracies computed with the models trained on step and stride wearable IMU data when applying age restriction are shown here. The numbers in parentheses indicate the number of subjects in the respective group.
| | Test Accuracies (%) |
|---|
| G (1) | G (8) | G (6) | G (5) | G (6) |
|---|
| Step | 98.97 | 100.00 | 93.53 | 98.55 | 100.00 |
| Stride | 100.00 | 100.00 | 95.83 | 100.00 | 100.00 |
Table 9.
This table shows that, using step and stride data, the accuracy of female subjects was about 1% greater than male subjects.
Table 9.
This table shows that, using step and stride data, the accuracy of female subjects was about 1% greater than male subjects.
| | Test Accuracies (%) |
|---|
| Male (49) | Female (37) |
|---|
| Step | 85.67 | 86.50 |
| Stride | 88.34 | 89.12 |
Table 10.
This table shows the accuracies of 37 male and 23 female subjects.
Table 10.
This table shows the accuracies of 37 male and 23 female subjects.
| Test Accuracies (%) |
|---|
| | Male (37) | Female (23) |
|---|
| Step | 85.71 | 86.75 |
| Stride | 87.25 | 90.12 |
Table 11.
This table shows the re-identification accuracies of 12 male and 14 female subjects. The accuracy was above 99% on step data while 100% on stride data.
Table 11.
This table shows the re-identification accuracies of 12 male and 14 female subjects. The accuracy was above 99% on step data while 100% on stride data.
| Test Accuracies (%) |
|---|
| | Male (12) | Female (14) |
|---|
| Step | 99.32 | 99.36 |
| Stride | 100.00 | 100.00 |
Table 12.
Results comparison of CuDNNGRU with Convolutional Neural Network (CNN) using same parameters.
Table 12.
Results comparison of CuDNNGRU with Convolutional Neural Network (CNN) using same parameters.
| Accuracy | CuDNNGRU | CNN |
|---|
| Step | 87.15% | 69.05% |
| Stride | 86.23% | 76.04% |

 ,
, 


