1. Introduction
Global Navigation Satellite System (GNSS) is a satellite system that produces and transmits radio signals for navigation and positioning purposes at global coverage level [
1,
2]. Up to the year 2020, modernization restructuring of the main GNSS systems, i.e., GPS, GLONASS, Galileo, and Compass (Beidou), will be completed. Throughout existing research works in GNSS area, there already has a wide range of surveys with respect to improving navigation and positioning accuracy on the basis of direct signals. However, in the last decade, the utility of multi-path GNSS signal, known as GNSS reflected signal, gained much attention. Passive GNSS-based radar (GNSS radar) [
3,
4] is a typical system that uses the reflected GNSS signal as source of opportunity for environmental surveillance. Compared to traditional active radar [
5], as there is no need to construct a radar transmission platform, GNSS radar has a lower cost budget and is more flexible for installation under many environmental sensing scenarios. Compared to other passive radar, such as DVT-B based radar [
6], because GNSS signals are global coverage and the transmission never failed, GNSS radar can perform all day all weather surveillance.
GNSS radar technique originates from GNSS Reflectometry (GNSS-R). The conventional GNSS-R technique contains two modes—non-geometric mode and geometric mode. Non-geometric mode is carried out based on received reflected signal strength or signal-to-noise ratio (SNR), whereas geometric mode is carried out based on the correlator output between reflected and direct signals [
7]. As spatial information of targets cannot be provided by GNSS-R, recently, the technique is further developed into GNSS radar imaging. For stationary object, generally GNSS-synthetic aperture radar (GNSS-SAR) image is formatted, whereas for moving target identification, generally a Range Doppler (RD) map is formed. Based on the GNSS radar platform, at first, direct signal is synchronized for generating imaging matched filer signal. Then, conventional bistatic GNSS-SAR image formation stage contains two separated compressions, i.e., range compression and azimuth compression [
8]. In terms of bistatic GNSS radar RD map formation, the only difference is that azimuth domain is processed by Fourier Transform (FT) [
9]. On the basis of GNSS-SAR image formation scheme and GNSS radar RD map forming scheme, the feasibility of GNSS radar imaging was demonstrated under many environmental scenarios [
9,
10,
11,
12,
13,
14,
15]. Meanwhile, in recent years, multi-static radar scheme was used for image formation in [
9,
13,
16,
17,
18,
19] based on multiple bistatic images fusion, which is considered as state-of-the-art imaging scheme in the relevant researches for GNSS radars.
Additionally, resolution of GNSS radar is investigated in the literatures [
20,
21,
22,
23,
24,
25]. For instance, the authors of [
22] employed joint Galileo E5 signals to achieve range resolution at 3 meter level. Meanwhile, to separate multiple targets within one pseudorandom noise (PRN) code length, the first author’s previous works [
24,
25] improved range resolution based on the reflected signals at intermediate frequency (IF) level and performed secondary order differentiation operator on range compressed signals, respectively. In terms of azimuth resolution for GNSS-SAR, it mainly depends on the receiver moving trace and dwell time. For example, the authors of [
20,
23] improved azimuth resolution by fusion the bistatic images from different azimuth angles. The authors of [
21] showed that using the dwell time 5 min, the azimuth resolution can be obtained at the level of 3–4 meters.
At the same time, there has the implementation based works with respect to GNSS radar. For instance, the authors of [
26,
27,
28] demonstrated the applicability of GNSS-SAR for surface change detection based on carrier phase of reflected GNSS signals or correlation coefficient of two GNSS-SAR images obtained at the same time slot of different days. The work [
29] implemented GPS signals for ocean surveillance, in which, the respective backscattering property of reflected signals is investigated. The authors of [
30] investigated the applicability of aircraft detection using passive GNSS-based radar.
Among the existing GNSS radar related works, weak reflected signal remains one of the essential problems. As the distance between GNSS satellites and earth surface is approximately 22,200 km, the power flux density of direct signal at ground can be as low as
dBm to
dBm. The situation can become even worse for reflected signal. With such low power density, in many cases, a noisy bistatic GNSS-SAR image or a noisy bistatic GNSS radar RD map occurs. Although multi-image fusion scheme based on different satellites [
9,
13,
16,
18,
19] can bring some enhancement in image SNR, as multiple full preliminary GNSS radar images are required, it will add a large amount of computational burden for the system. Meanwhile, multi-image fusion is a noncoherent integration scheme, and the respective imaging gain is still lower compared to coherent integration.
This paper proposes a new GNSS radar imaging scheme that uses coherently integrated multiple satellites signals. In the proposed scheme, the satellites in the backscattering geometric mode are selected as source of opportunity. Based on the individual range compressed result of each selected satellite, one is used as a benchmark, then range coordinates alignment operator is generated and performed to align range axis of other satellites to the benchmark. Thereafter, the aligned range compressed signals are coherently accumulated for performing azimuth compression or azimuth FT, where the signal magnitude of the targeted scene center are coherently accumulated and azimuth processing can be accomplished in one state operation. Both theoretical analysis and proof of concept field experiments under land and ocean surveillance scenarios reveal that the proposed imaging scheme can provide a higher imaging gain and lower computational complexity compared to the state-of-the-art multi-image fusion scheme.
This paper is organized as follows. The considered geometry and signal model is given in
Section 2.
Section 3 analyzed imaging gain and computational complexity of the conventional bistatic imaging scheme and state-of-the-art multi-image fusion scheme, whereas the respective analysis for the proposed imaging scheme is provided in
Section 4. Field experimental confirmation of the proposed imaging scheme is shown in
Section 5.
Section 6 discusses the associated problems in this research and the respective future improvements.
Section 7 concludes the whole paper.
2. The Considered Geometry and Signal Model
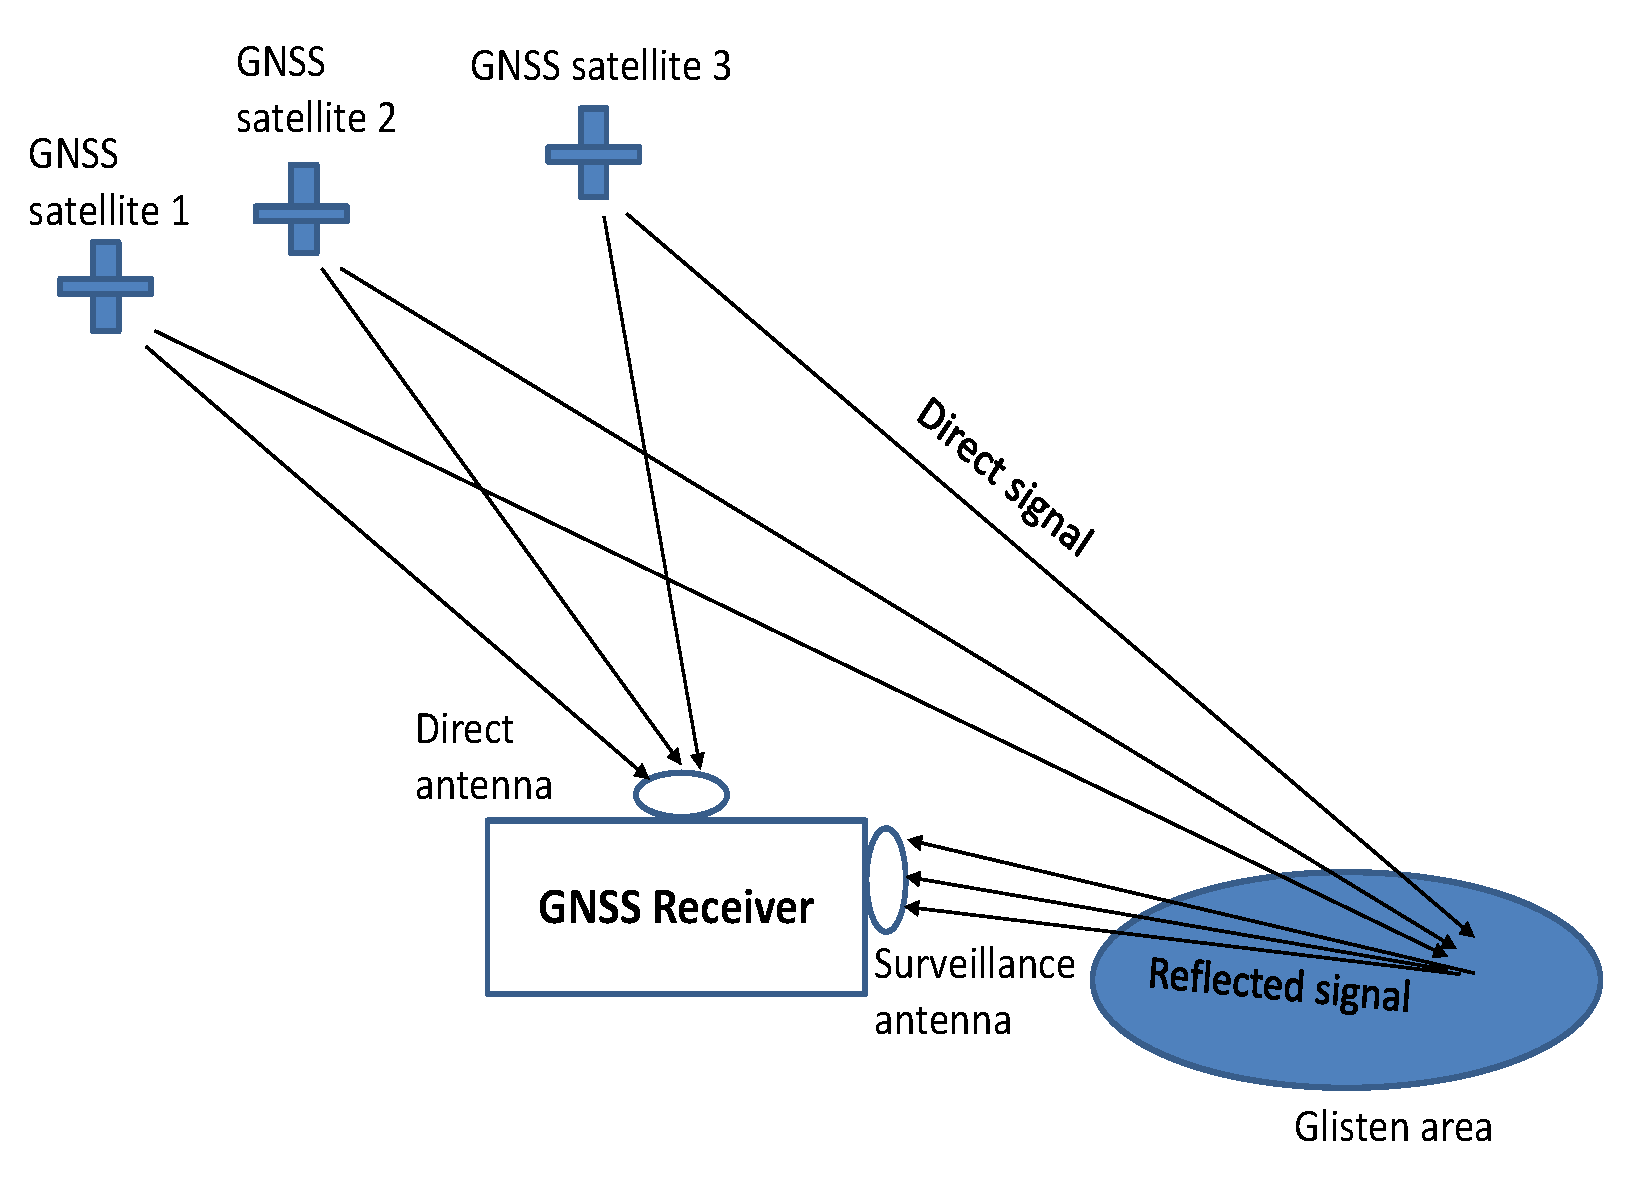
In this research, two separated antennas, i.e., direct antenna and surveillance antenna, are used for collecting direct and reflected GNSS signals, respectively. To avoid direct signal interference at surveillance channel for GNSS radar imaging, similar to [
29], the satellites in the geometric position of backscattering are chosen as sources of opportunity. The geometry model is shown in
Figure 1.
In
Figure 1, for the ease of calibrating range migration when receiver is moving within certain trace for forming SAR image, both direct and surveillance antennas are mounted on the same platform. The signals received at direct antenna are used for synchronization, whereas the signals collected by surveillance antenna are used for radar imaging. At GNSS receiver, the received signals are digitized, downconverted to base-band and formed into range and azimuth domains. The respective mathematical model with respect to received direct signal for each satellite is given as
where
i represents the index for each satellite;
represents the signal magnitude;
C presents PRN code;
D represents navigation message;
t represents range domain, which is upper bounded by the length of PRN code;
u represents azimuth domain, which is upper bounded by data collection duration or receiver moving duration;
presents the transmission delay between receiver and each satellite;
represents Doppler frequency of each satellite;
represents carrier phase of each satellite; and
represents noise at direct antenna. The parameters
and
can be considered as constants in the same range domain.
Each reflected signal can be considered as delayed version of the respective direct signal, which can be expressed as Equation (
2)
where
k represents the index of each reflected signal at range domain,
represents the reflected signal delay compared to the respective direct signal each satellite,
represents Doppler frequency of reflected signal,
represents carrier phase of reflected signal, and
represents background noise at surveillance antenna. For stationary target,
, whereas for moving target,
represents Doppler frequency caused by the object velocity. The parameters
and
can be considered as constants with the same range domain as well.
3. Analysis of Conventional Bi-Static Imaging Scheme and State of Art Multi-Images Fusion Scheme
GNSS radar is a passive radar, the transmitter and receiver should be located on separated platforms, thus only bistatic imaging scheme and multi-static imaging scheme are appropriate for such kind of system. In the GNSS radar-related research, bistatic imaging scheme [
8] is regarded as a conventional scheme, which consists of the stages signal synchronization and radar imaging for individual satellite. Multi-static imaging scheme [
9,
13,
16,
18,
19], known as the multi-image fusion scheme, is the state-of-the-art scheme, which is functions primarily on the basis of fusing multiple bistatic GNSS radar images. The detailed analysis of these two schemes are given as follows.
First, direct signal synchronization is carried out by tracking the received direct signal (
1) from all the visible satellites. Using decoded navigation message, the satellite that satisfy the backscattering geometric model as
Figure 1 is selected. In bistatic imaging, only one satellite that satisfied the geometric model in
Figure 1 is selected as transmission of opportunity. Based on tracked code delay, carrier phase, and navigation bits for the selected satellite, the local replica is generated as
Thereafter, for imaging stage, range compression is performed by correlating
with
per range domain along azimuth. The range compressed signal can be expressed as
where
denotes the range samples used for compression,
denotes the respective samples quantity, * represents conjugate operator,
, and
represents the bistatic range compressed carrier phase of the
i-th satellite. The value
in
is due to the fact that the quantity of samples is doubled after performing correlation operator.
For stationary object imaging, generally SAR image is formed. For GNSS-SAR image formation, azimuth matched filter is obtained on the basis of the result in Equation (
4) along azimuth domain
u. Azimuth compression is identically azimuth matched filtering, which can be expressed as
where
represents azimuth samples for compression and
denotes respective azimuth samples quantity. The value
in
occurs because of the impact of azimuth correlator as well. For moving object, normally RD map is generated. The respective azimuth processing is carried out by performing FT of Equation (
4) along azimuth domain, which can be expressed as
where
represents azimuth frequency caused by the movement of object. To obtain GNSS-SAR image or GNSS radar RD map, coordinates in both range and azimuth domains are transformed into distance domains, and absolute operator
is applied on Equation (
5) or Equation (
6).
As for the state-of-the-art multi-image fusion scheme, more than one satellite are used for imaging. First, multiple bistatic images on the basis of each satellite are generated. Then, to transform the coordinates into distance domains, pseudo-range and elevating angle of each satellites are obtained on the basis of decoded navigation message. Thereafter, the scaling factor for image alignment is generated on the basis of the coordinates transformed results, which can be seen in detail in [
19]. Assuming the scaling factor for performing alignment for each satellite is
, the generation of GNSS-SAR image and GNSS radar RD map on the basis of multi-image fusion scheme can be expressed as Equations (
7) and (
8), respectively,
where
m represents the quantity of satellites used for multi-image fusion.
We investigate imaging gain for conventional bistatic imaging and multi-image fusion schemes. In bistatic GNSS-SAR imaging scheme, after performing Equation (
4), the range compression gain for individual satellite can be derived as
; For azimuth compression Equation (
5), the gain in the total dwell time can be derived as
; thus, the gain for azimuth compression can be expressed as
. Therefore, the imaging gain for bistatic GNSS-SAR imaging scheme can be expressed as
which is the same as
. For bistatic GNSS radar RD map formation, the gain in range compression is the same as bistatic GNSS-SAR imaging scheme. In terms of azimuth FT, the respective gain can be derived as
. Thus, the imaging gain can be expressed as
In terms of the multi-image fusion scheme, it can be regarded as the non-coherent integration of Equation (
5) or (
6) with coordinates alignment. Therefore, it can be easily derived that for multi GNSS-SAR images fusion, the gain is
For multi GNSS radar RD maps fusion, the gain is
From Equation (
9) to (
12), it can be seen that compared to bistatic imaging scheme, the gained strength for multi-image fusion is
larger.
Computational complexity in this paper is studied on the basis of number of operations. In signal synchronization stage of both bistatic imaging scheme and multi-image fusion scheme, as all the satellites are used for processing, the complexities are the same. Thus, only the complexity during imaging stage is considered. In terms of bistatic imaging, for local replica generation, the number of operations in code modulation and carrier modulation is the same as
, thus the respective complexity is derived as
. For range compression state, there exists number of multiplications
and number of additions
, thus the respective complexity is
. For azimuth compression for stationary object imaging, as the quantity of samples at range domain is doubled after performing compression, the number of multiplications is derived as
and the number of additions is derived as
; thus, the respective complexity is derived as
. Thereafter, the accumulated complexity for bistatic GNSS-SAR imaging stage can be derived as
As for bistatic RD map generation for moving object detection, the complexity for local replica generation and range compression is the same as bistatic GNSS-SAR imaging. However, in the azimuth FT state, there exists number of multiplications
and number of additions
. Thus, the respective complexity is derived as
. Therefore, the accumulated complexity for RD map generation stage can be derived as
For multi-image fusion scheme, through a similar theoretical analysis, the number of operations for local replica generation, range compression, azimuth compression for stationary object detection, and azimuth FT for moving object indication can be derived as
,
,
, and
, respectively. The number of operators for both coordinates alignment and images combination with respect to GNSS-SAR imaging can be derived as
, whereas for RD map forming, the respective number of operations can be derived as
. Therefore, the accumulated complexity for multi GNSS-SAR images fusion can be derived as
whereas for multi GNSS radar RD maps fusion, the complexity can be derived as
4. The Proposed Imaging Scheme Using Coherent Integrated GNSS Signals
To improve imaging gain and reduce computational burden than the state-of-the-art multi-image fusion scheme, a new imaging scheme on the basis of coherently integrating multiple GNSS satellites signals is proposed. The main principle of the proposed scheme is to coherently integrate coordinates aligned multi-satellites range compressed signals based on the compressed carrier phase difference. Thereafter, azimuth compression or azimuth FT can be performed by only once-through operation. The detailed analysis can be seen as follows.
The signal synchronization stage and range compression stage for the proposed imaging scheme is the same as multi-image fusion scheme. The criterion for selecting the multiple satellites as sources of opportunity should satisfy the model in
Figure 1 as well. The initial range compressed signal without coordinates alignment is the same as Equation (
4).
Thereafter, range coordinates alignment is performed. As it is hard to obtain the spatial information of the glisten region on the passive radar platform without generating full GNSS-SAR image or full GNSS radar RD map, unlike [
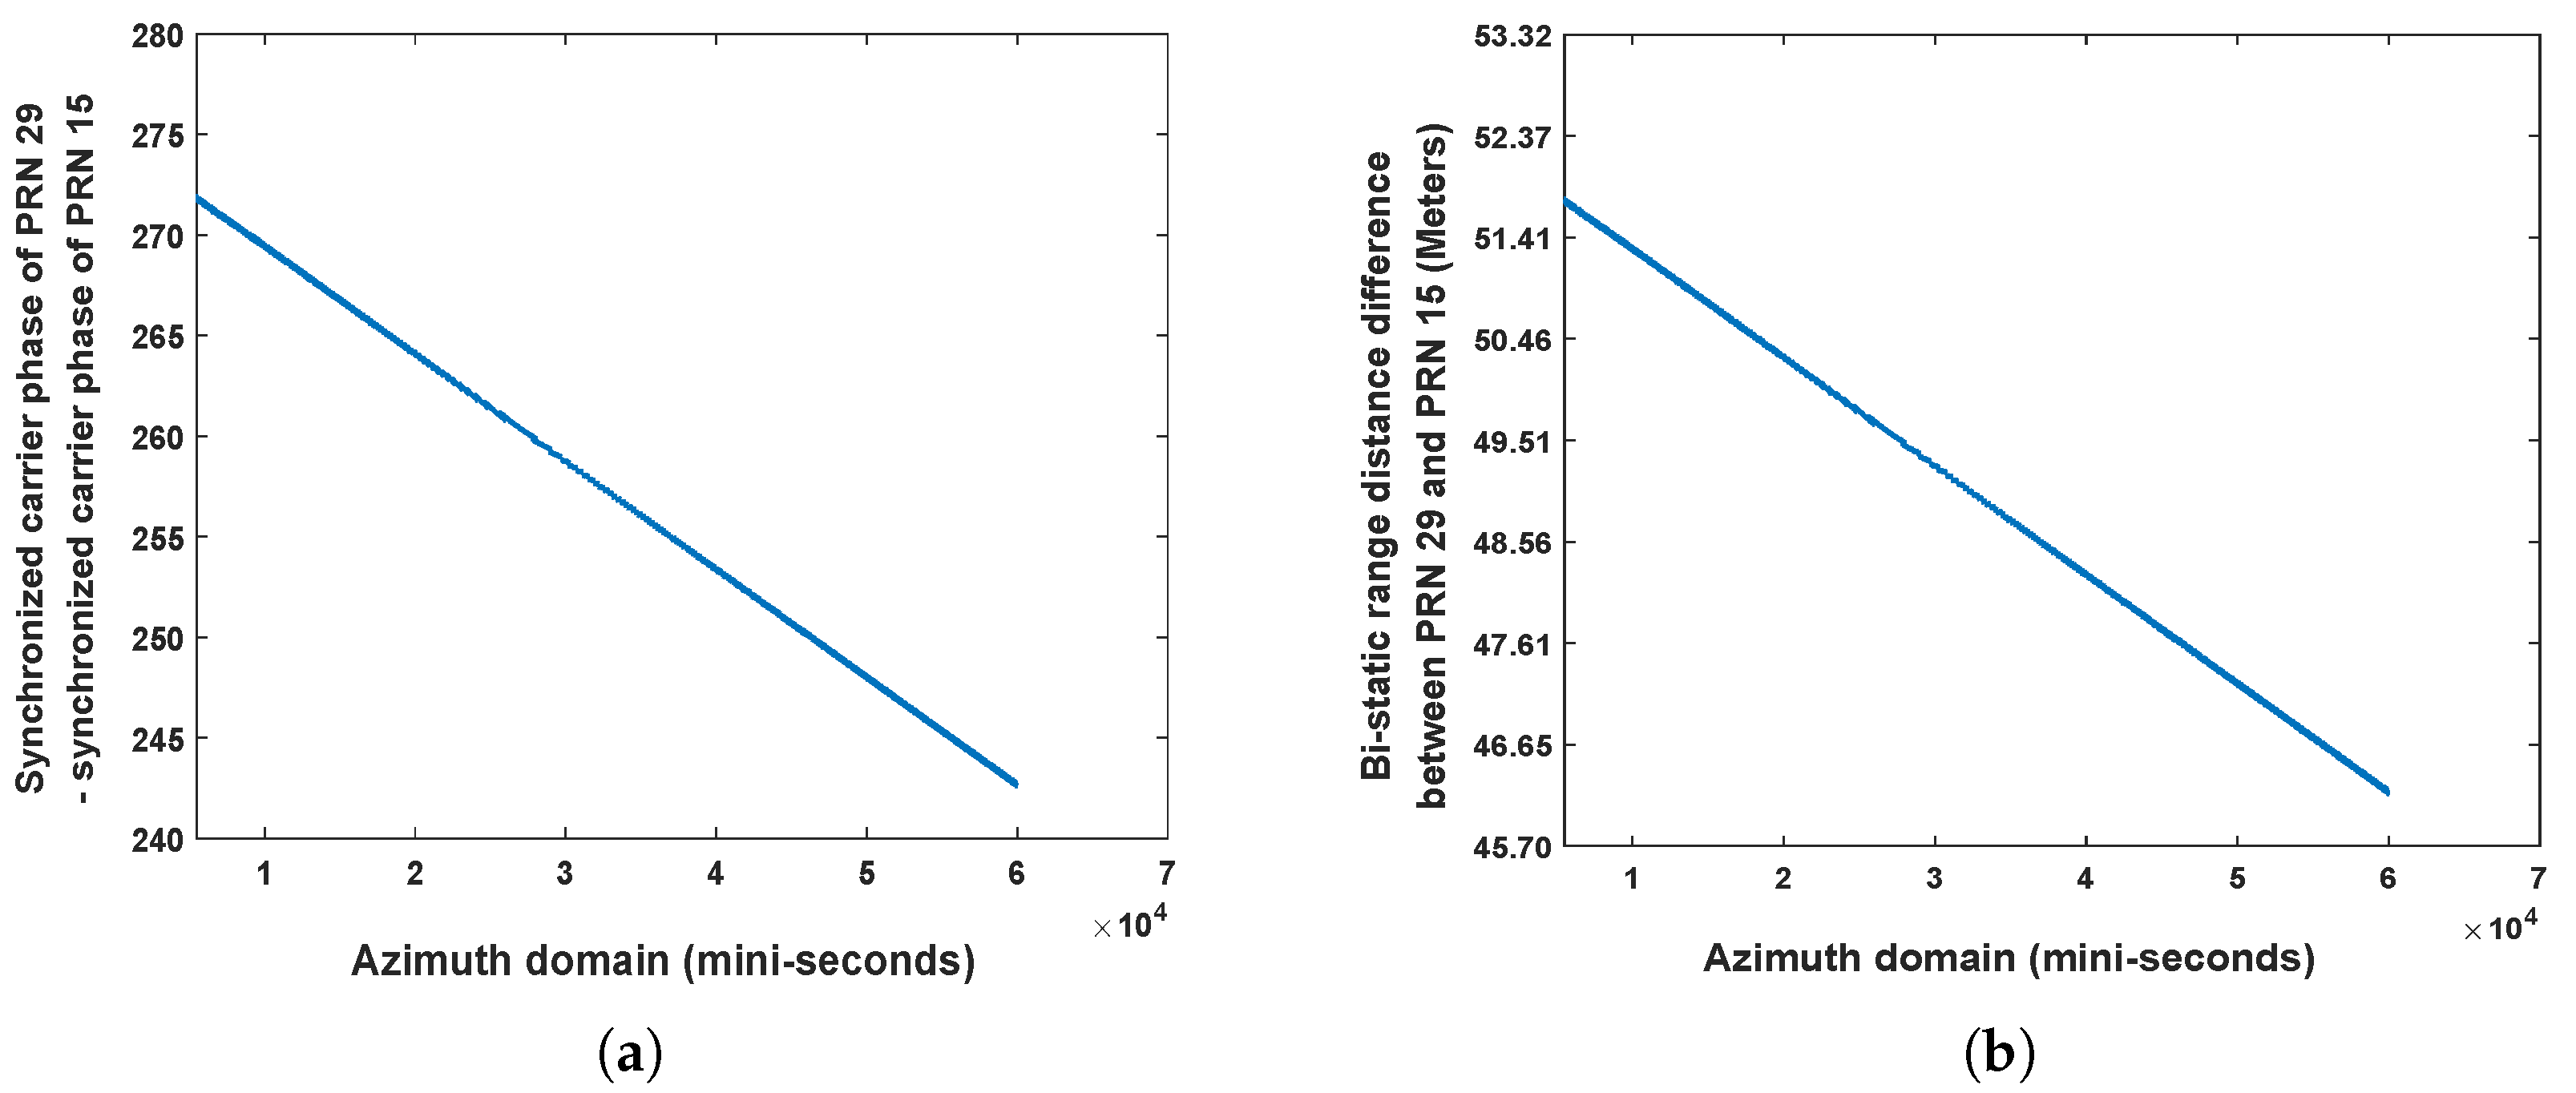
19], the range coordinates alignment in the proposed scheme is carried out based on the synchronized carrier phase difference of direct signals among the selected satellites. The detailed derivation can be seen as follows.
At first, bistatic range distance difference of the selected satellites for imaging is considered. We use one of the selected satellites as a benchmark and mark it as 0-th satellite. Assume, in the 0-th satellite, the distance between satellite and object is
and between object and receiver is
; then, the respective bistatic range can be calculated as
. Assume for the satellite
i, the distance between satellite and object is
, and between object and receiver is
; similarly, the respective bistatic range is calculated as
. Because the distance between object and receiver is not related to satellite position, we can have that
. Thus, the bistatic range difference is derived as
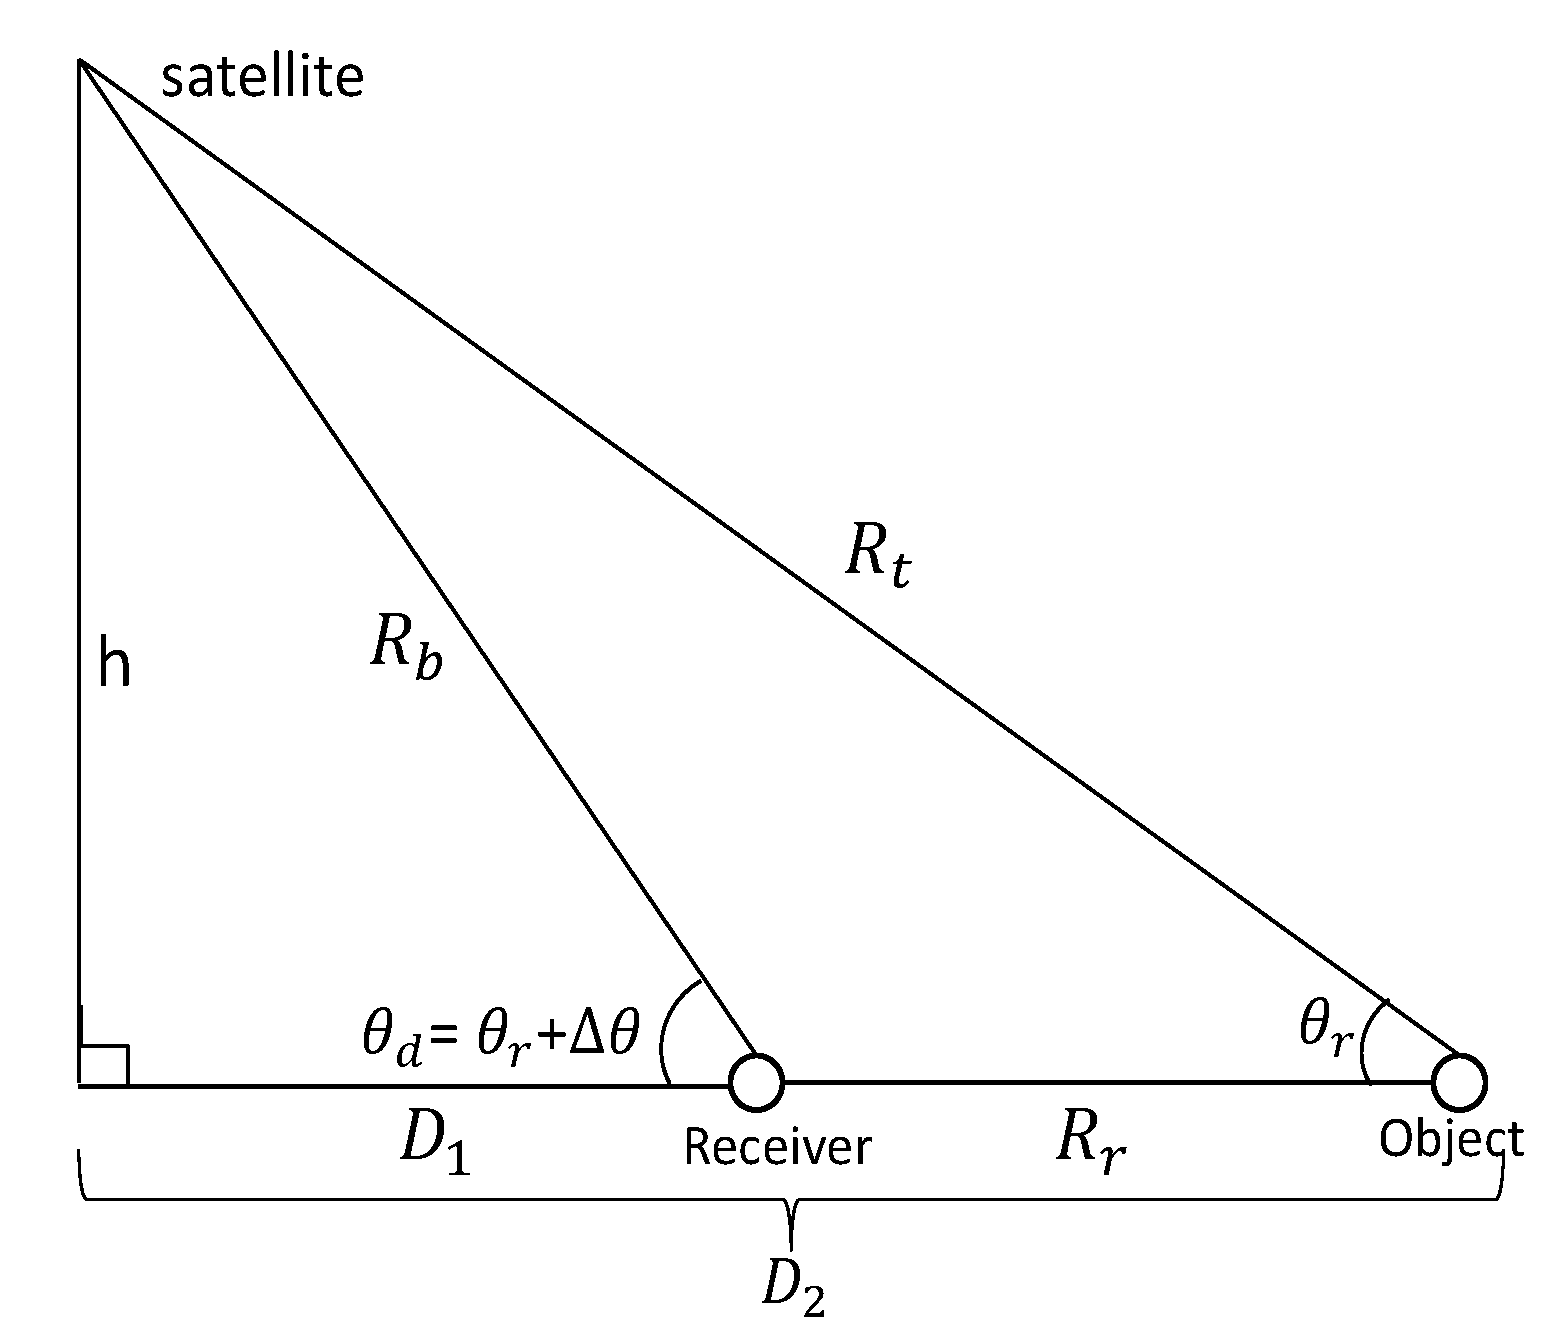
We investigate the impact in the changes of range distance between object and receiver with respect to GNSS satellite elevation angle. For the ease of analysis, we plot a respective schematic diagram in
Figure 2.
In
Figure 2,
represents the distance between satellite and receiver;
h represents vertical distance between satellite and earth surface;
and
represent elevating angles at receiver and at object, respectively; and
represents the difference between
and
. Based on
Figure 2, the changes of range distance between object and receiver
with respect to
and
is calculated as
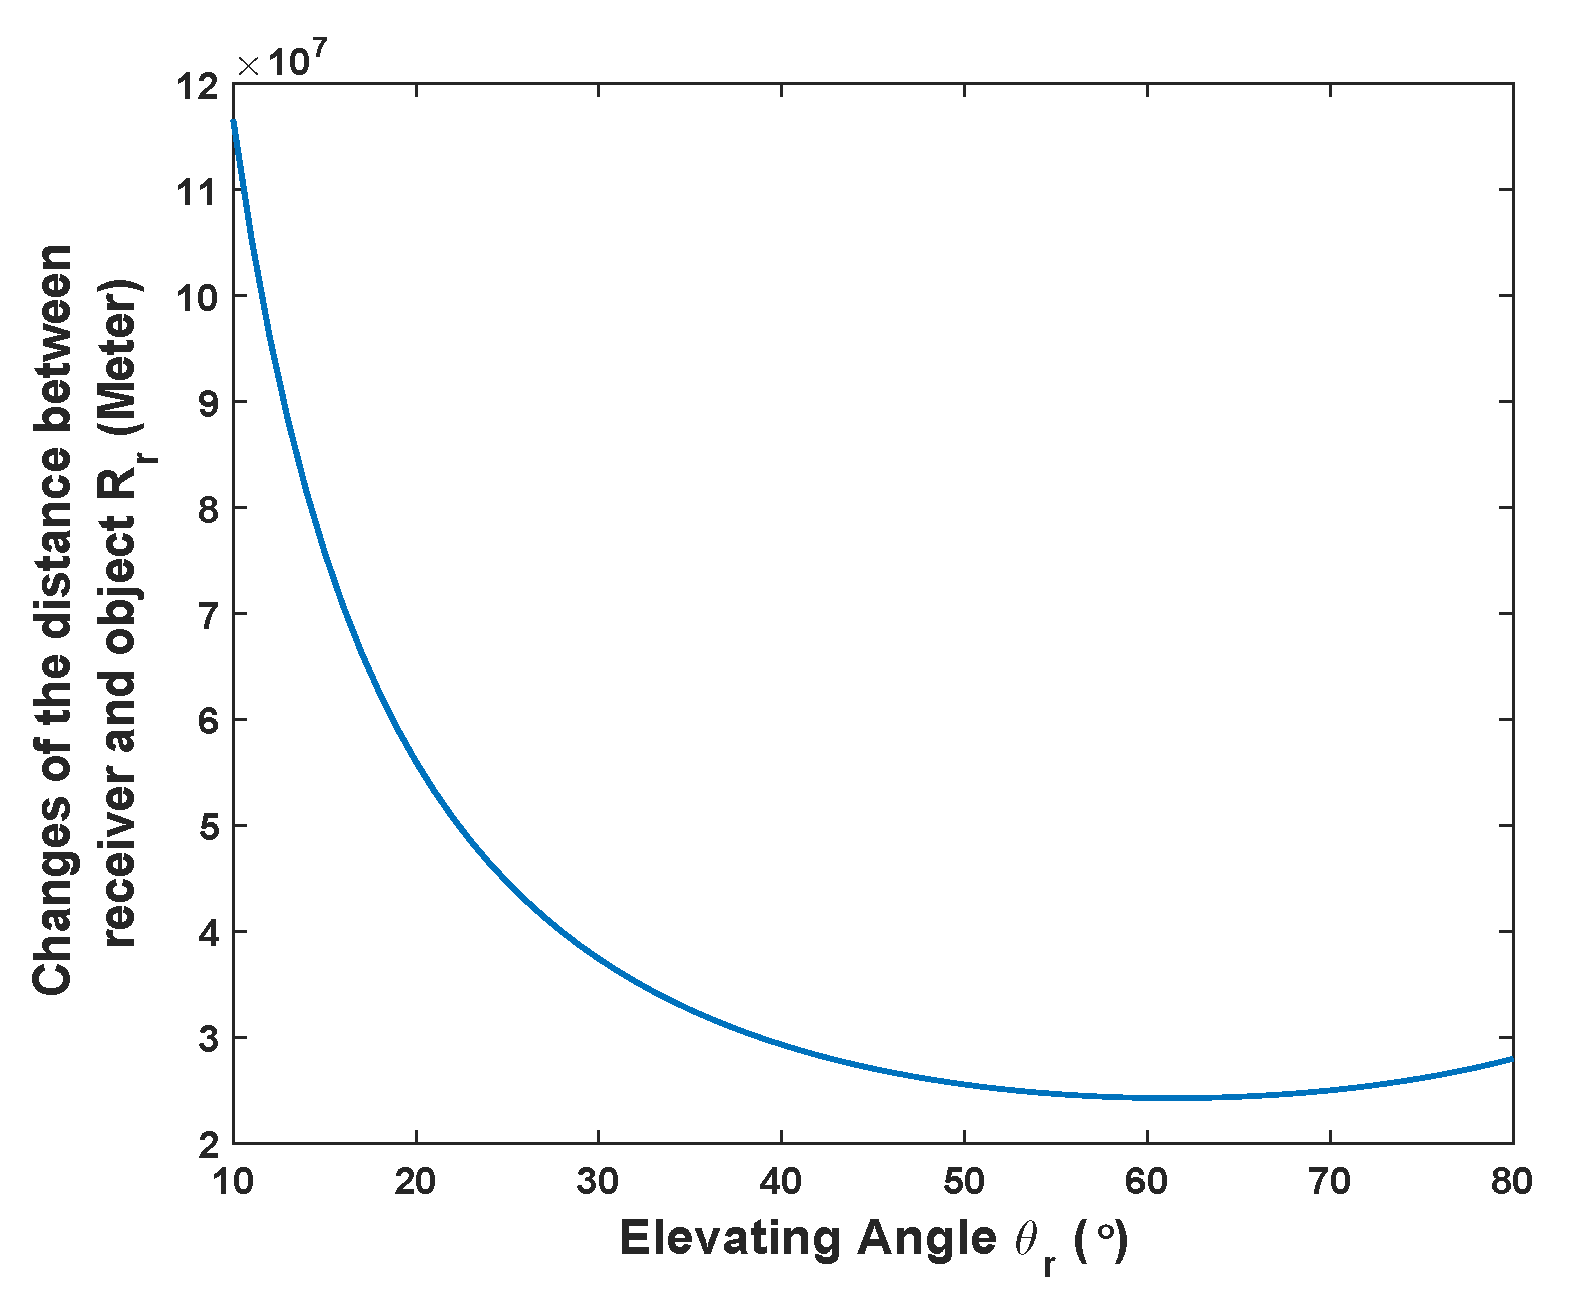
We study the changes of
when
reaches its minimum value
. Under the circumstance, GPS satellite is used as an example, in which the average vertical distance
22,200 km, the relationship between
and
is simulated in
Figure 3, where the general interval of elevating angle for GNSS satellite is between
and
[
31]. From
Figure 3, note that to reach the level of elevation angle change by only
, the change of
should be at the level more than
meter. As GNSS radar is a passive radar, it is unlikely that the sensing range can reach that level. Therefore, under majority circumstance, it can be regarded that
. Then, the expression Equation (
17) can be transformed into Equation (
19) as follows.
where
and
represent the base-line distance between receiver and the 0-th and the
i-th satellite, respectively;
c represents signal transmission speed; and
f represents signal carrier frequency. The carrier phase values
and
of the
i-th and 0-th satellites can be obtained from tracked results of Equation (
1).
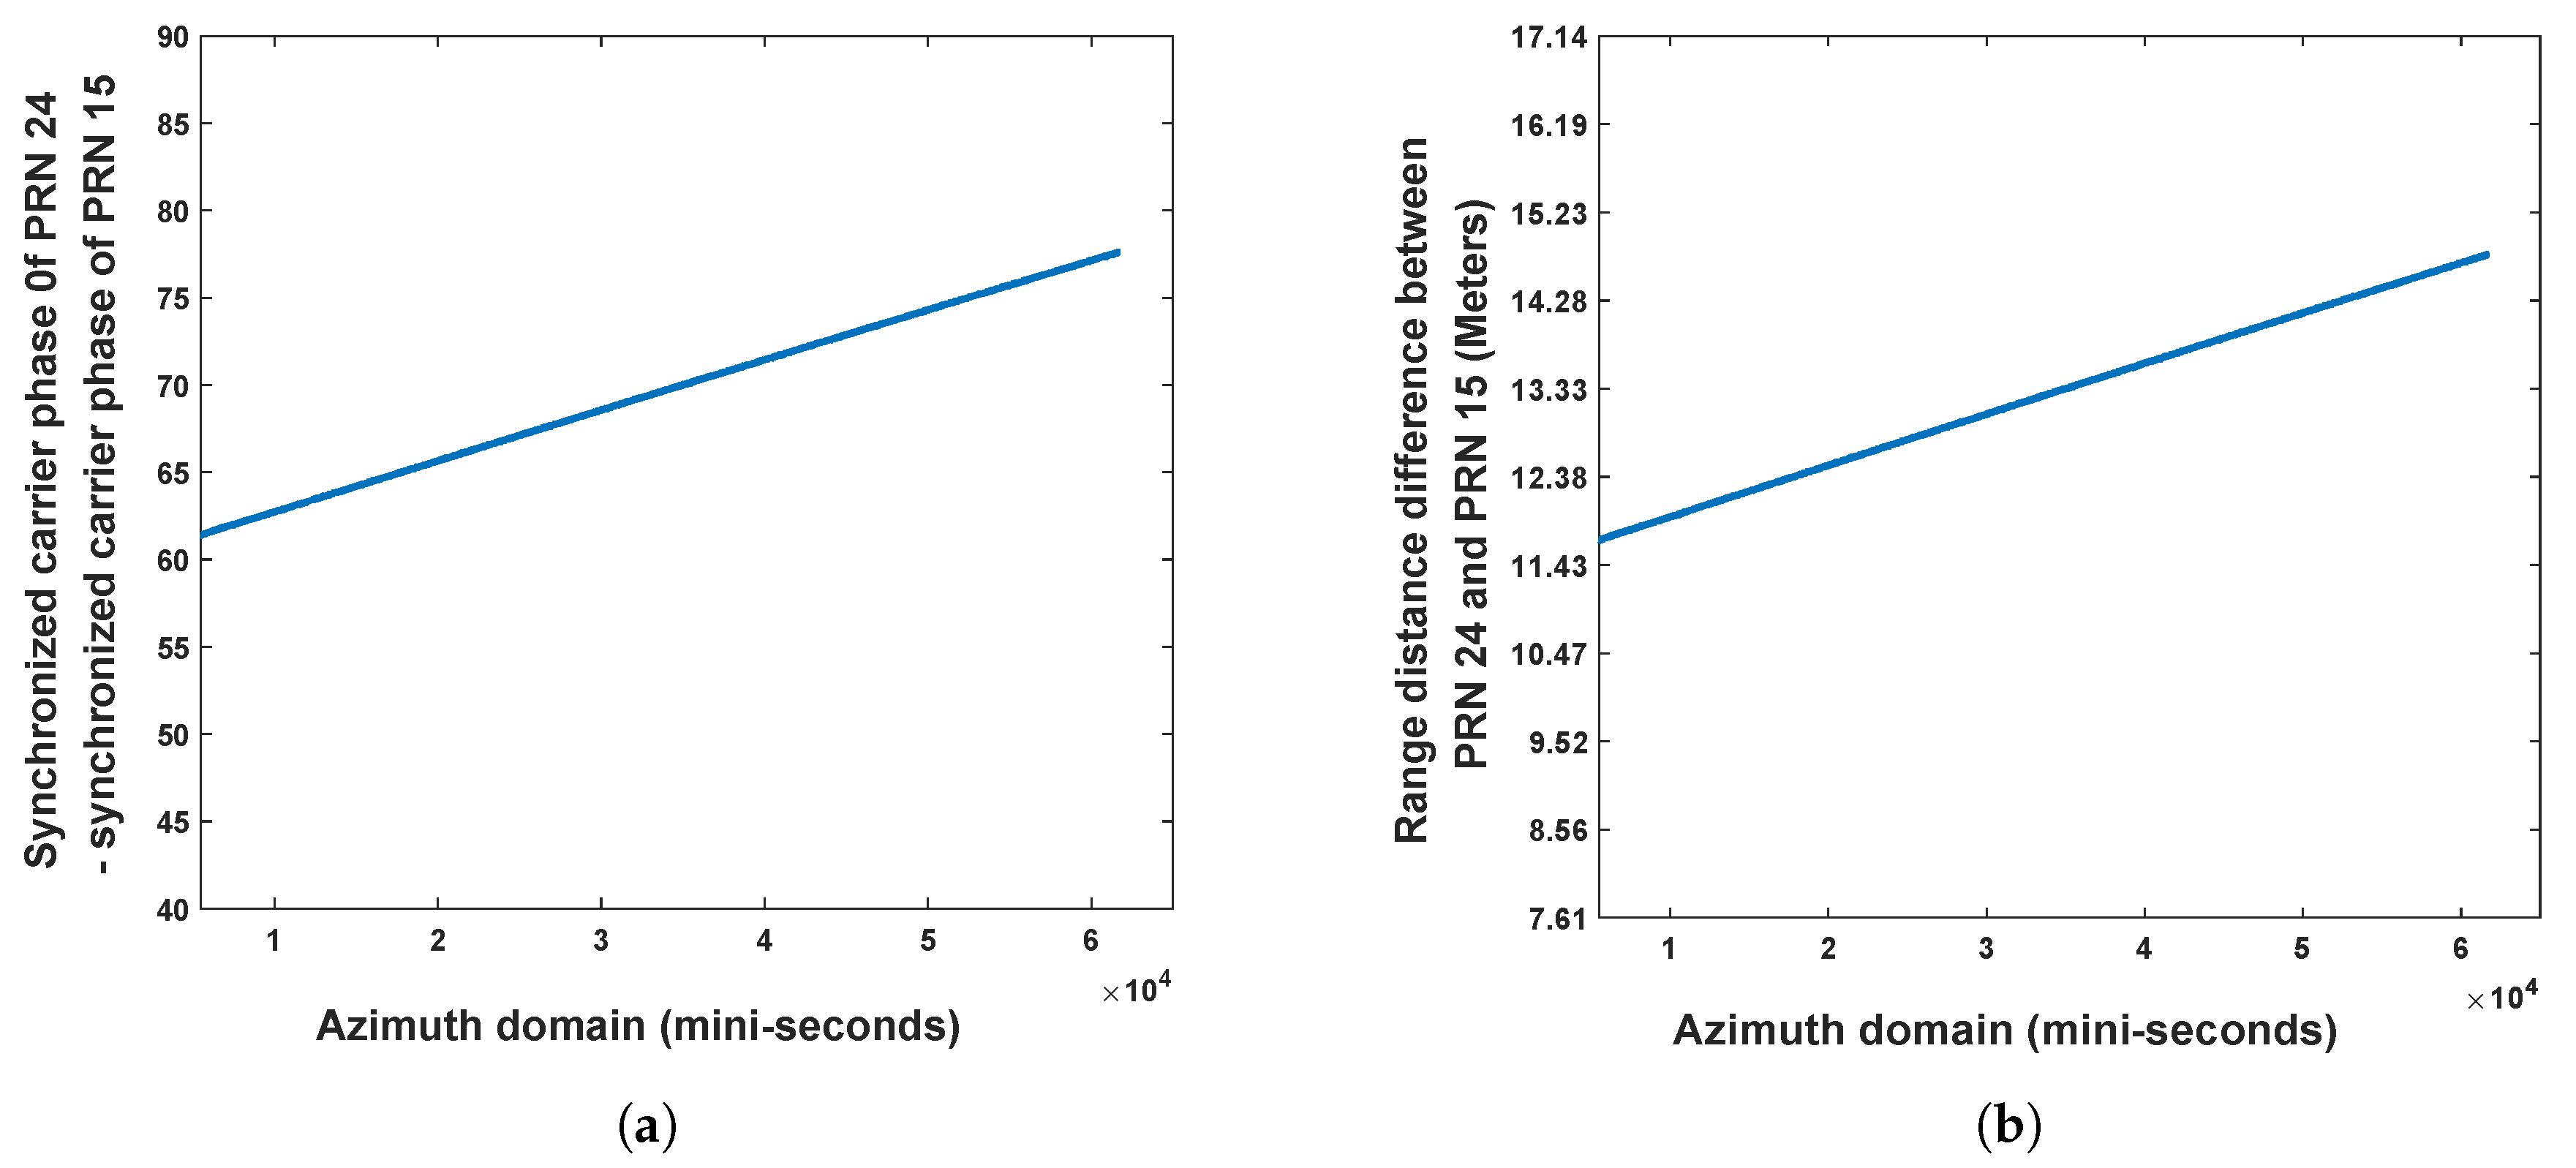
Second, the necessity for performing coordinates alignment is evaluated. If , where represents range distance between two sampling point within the period 1 ms of the PRN code for civil purpose, there is no need to perform coordinates transform; otherwise, perform coordinates alignment.
Third, the aligned coordinates using the 0-th satellite as a benchmark can be derived as Equation (
20)
After coordinates of the satellites are well aligned with the 0-th satellite, range compressed signals with respect to the satellites as illuminator of opportunity are accumulated coherently along azimuth, which can be expressed as
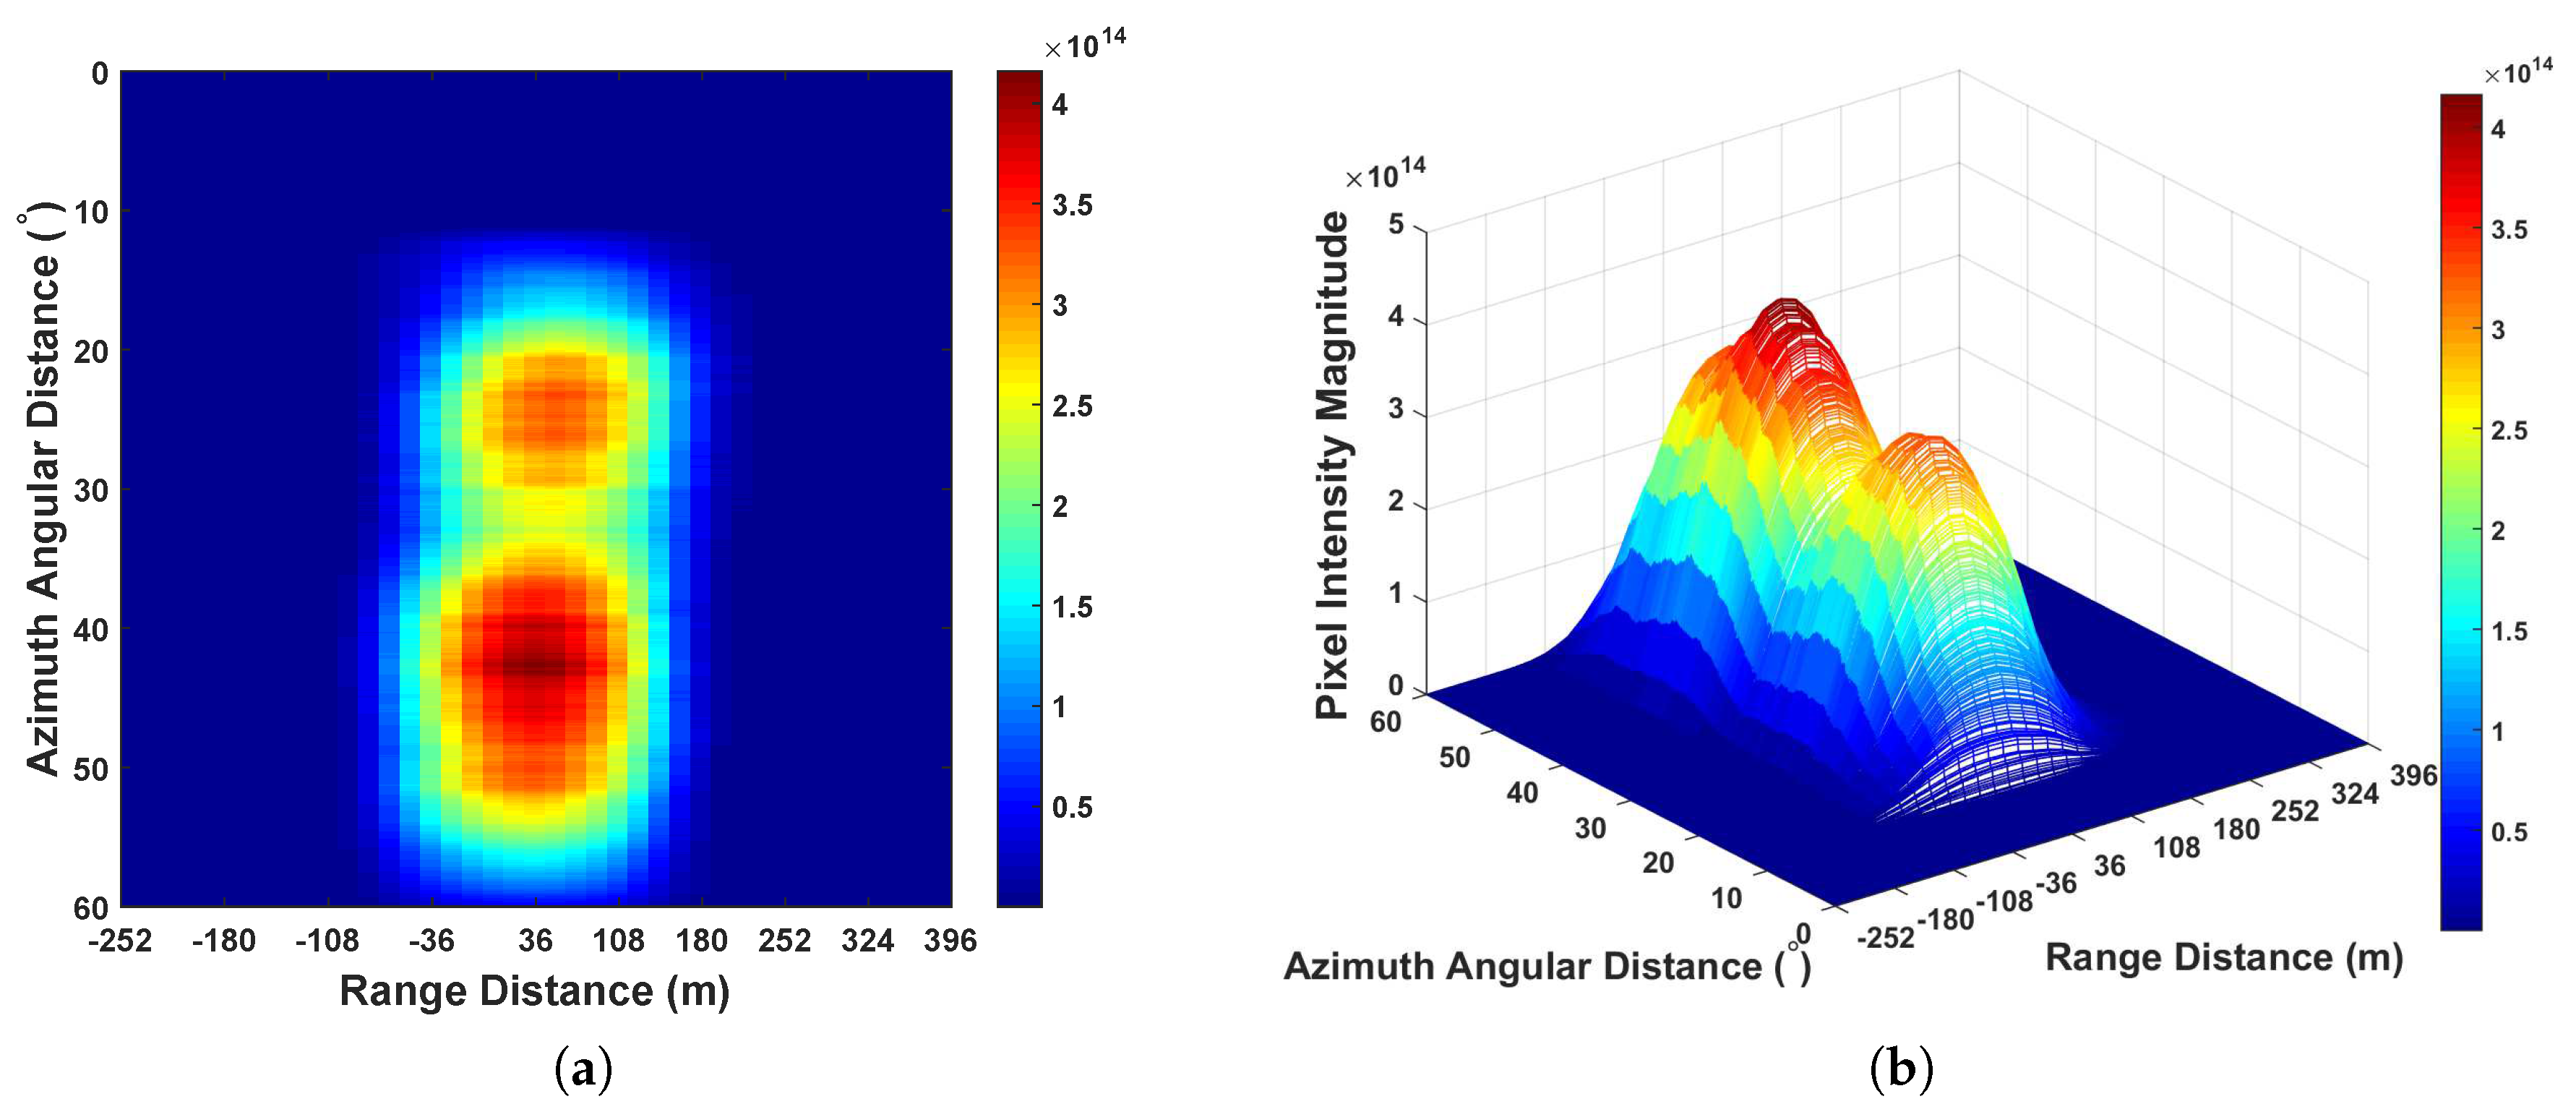
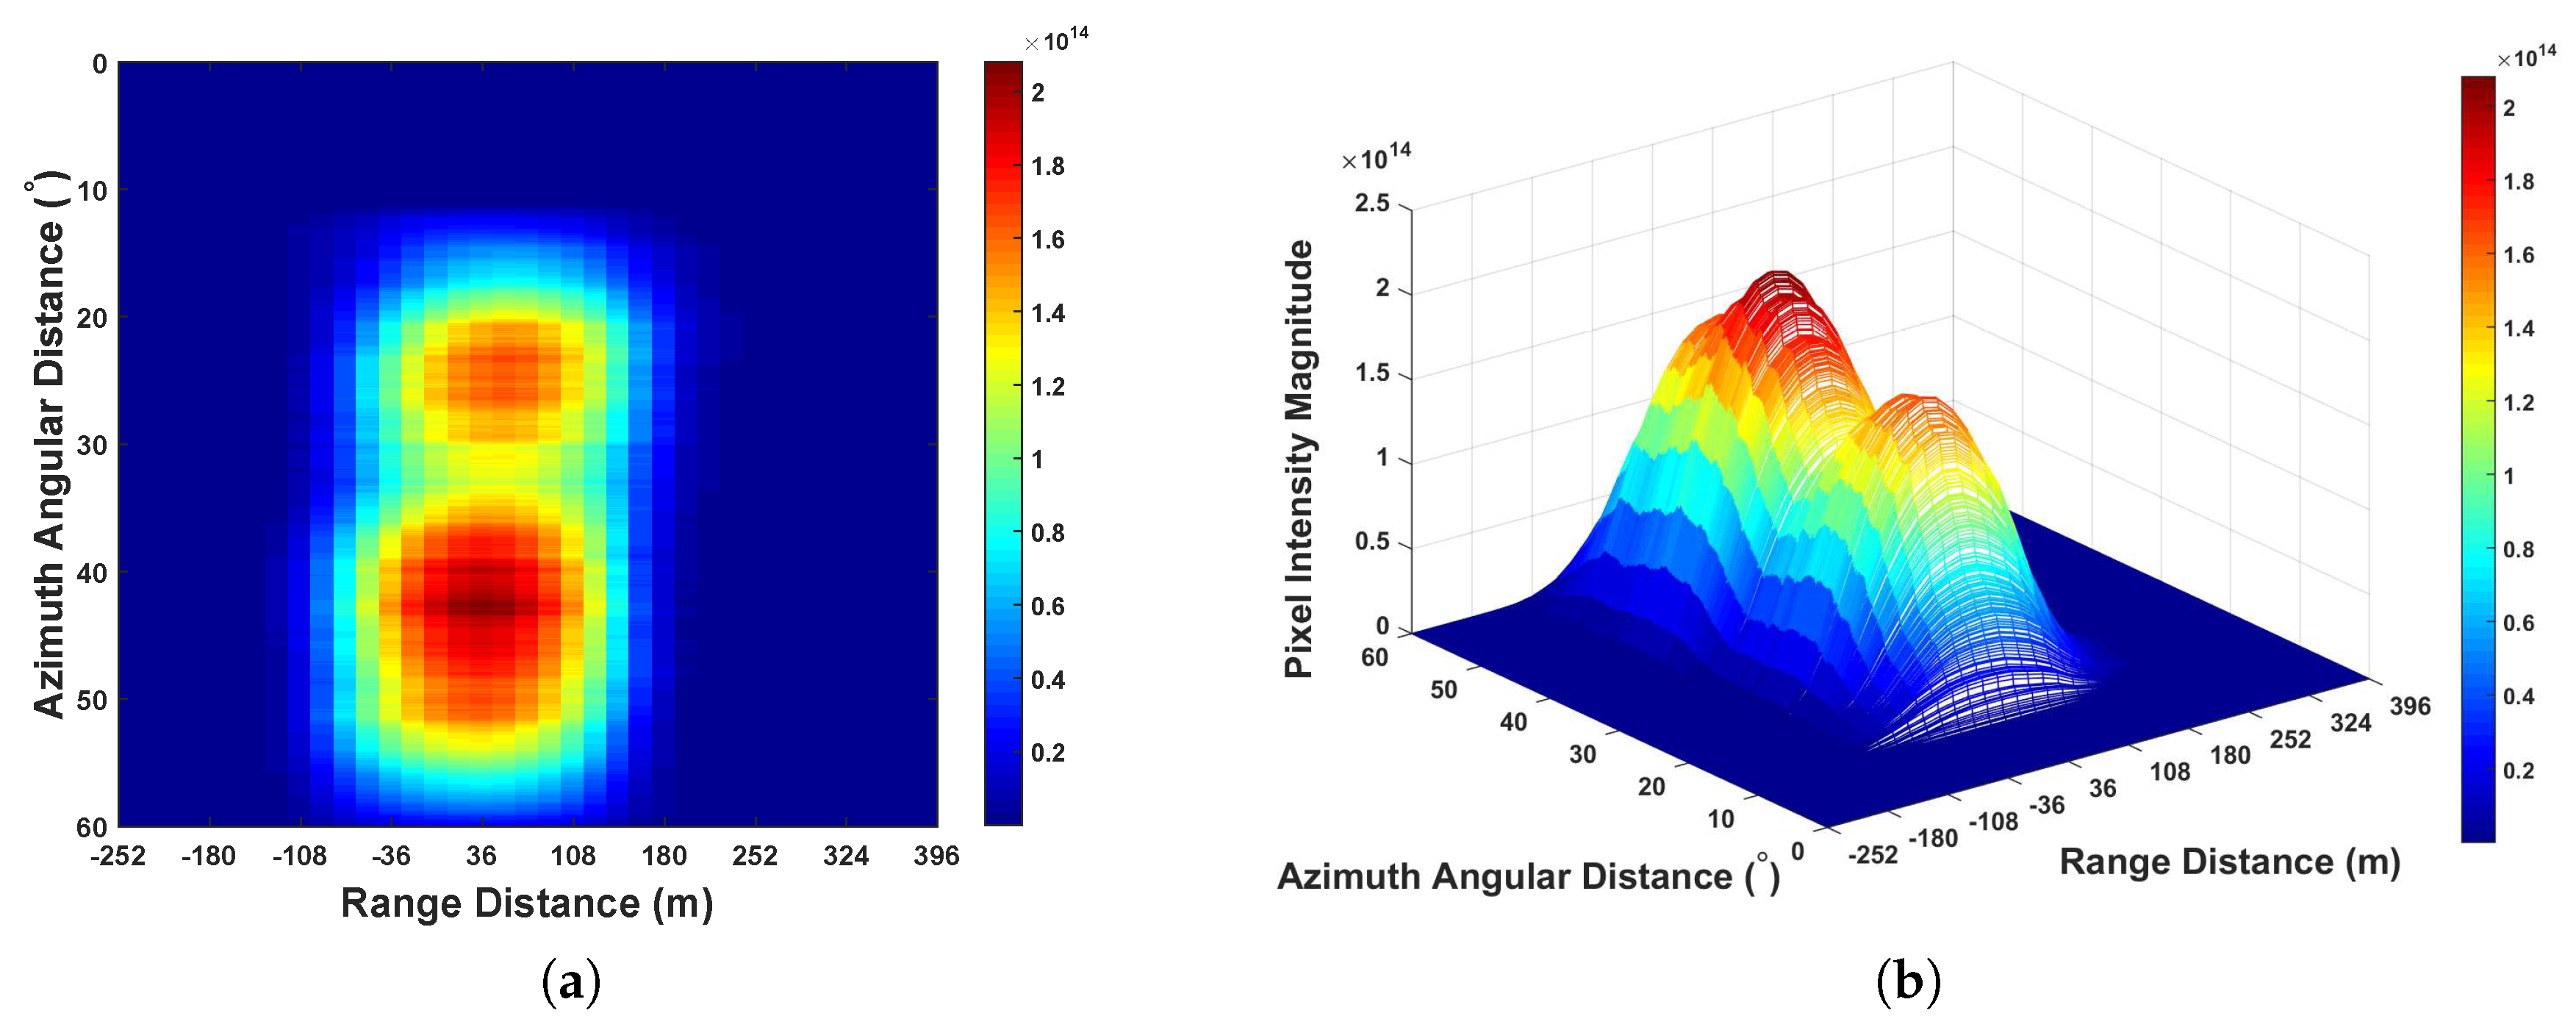
After performing Equation (
21), the scene center of the point spread function (PSF) with respect to illuminated region can be coherently accumulated. However, the illuminated ambiguity region of PSF with respect different satellites will be different. This will negatively impact on range resolution after performing Equation (
21). As the main aim in this paper is the preliminary feasibility investigation with respect to imaging on the basis of coherently integrated multiple GNSS satellites, the range resolution problem is not specifically concentrated.
For stationary object imaging, azimuth compression is carried out based on the result Equation (
21) along azimuth domain, which can be expressed as
For moving target detection, on the basis of Equation (
21), azimuth FT is performed as follows.
Applying absolute operator on Equation (
22) or (
23), final GNSS-SAR image or GNSS radar RD map with respect to coherently integrated satellites can be obtained.
In summary, the work-flow of the proposed imaging scheme is given as Algorithm 1.
| Algorithm 1 The work-flow of the proposed imaging scheme |
- 1.
Performing signal synchronization, selecting the GNSS satellites that satisfy the model as Figure 1. - 2.
On the basis of the selected satellites, generating local replica for each satellite as Equation ( 3). - 3.
Performing range compression for each selected satellite independently as Equation ( 4). - 4.
Using one of the selected satellite as a benchmark, mark it as 0-th satellite, extracting carrier phases of direct signals on the basis of the selected satellites. If , performing coordinates alignment, otherwise directly jump to step 6. - 5.
Obtaining the coordinates alignment factor as Equation ( 19), and performing range coordinates alignment along azimuth as Equation ( 20). - 6.
Coherently combining the range compressed signals along azimuth direction of the selected satellites as Equation ( 21). - 7.
For stationary target imaging, performing azimuth compression as Equation ( 22). for moving target detection, performing azimuth FT as Equation ( 23). - 8.
Applying absolute operator on Equation ( 22) or ( 23), obtaining final GNSS-SAR image or GNSS radar RD map.
|
Imaging gain and computational complexity of the proposed imaging scheme are analyzed. The gained strength for each satellite in range correlation operation for the compression is the same as the bistatic imaging scheme. However, after performing Equation (
21), the gain can be derived as
, after performing Equation (
22), and the azimuth gain can be derived as
. Thus, the gain for GNSS-SAR imaging under the proposed scheme can be derived as
After performing Equation (
23), the gain is derived as
. Thus, the imaging gain for RD map generation under the proposed scheme can be derived as
Comparing Equation (
24) with Equation (
11), it can be seen that the gained strength in GNSS-SAR imaging under the proposed scheme is
higher than multi-image fusion scheme; comparing Equation (
25) with Equation (
12), it can be seen that the gained strength for GNSS radar RD map generation under the proposed scheme is
higher than multi-image fusion scheme.
Computational complexity of the proposed scheme is investigated. Through the analysis of number of operations in each step of the proposed imaging scheme, we can have that the accumulated complexity for GNSS-SAR imaging under the proposed scheme is
whereas for GNSS radar RD map generation, it is
Comparing Equation (
26) with Equation (
15), it can be seen that the proposed scheme has less complexity by
number of operations than the multiple GNSS-SAR images fusion scheme; comparing Equation (
27) with Equation (
16), it can be seen that the proposed scheme has a less complexity by
than multiple GNSS RD maps fusion scheme.
6. Discussion
In this paper, due to the fact that it mainly focuses on the feasibility testing with respect to the proposed imaging scheme based on integrating satellites coherently, only bistatic range is considered. Thus, only the information carrier phase difference is used for range coordinates alignment. However, to estimate the objects location more precisely, the parameter values that elevating angle and pseudo-range between each satellite and receiver are still required. Therefore, in future, the authors aim to improve range coordinates alignment stage in the proposed imaging scheme for obtaining the objects range position on GNSS radar image more precisely and with a lower computational complexity than the respective state in multi-image fusion scheme.
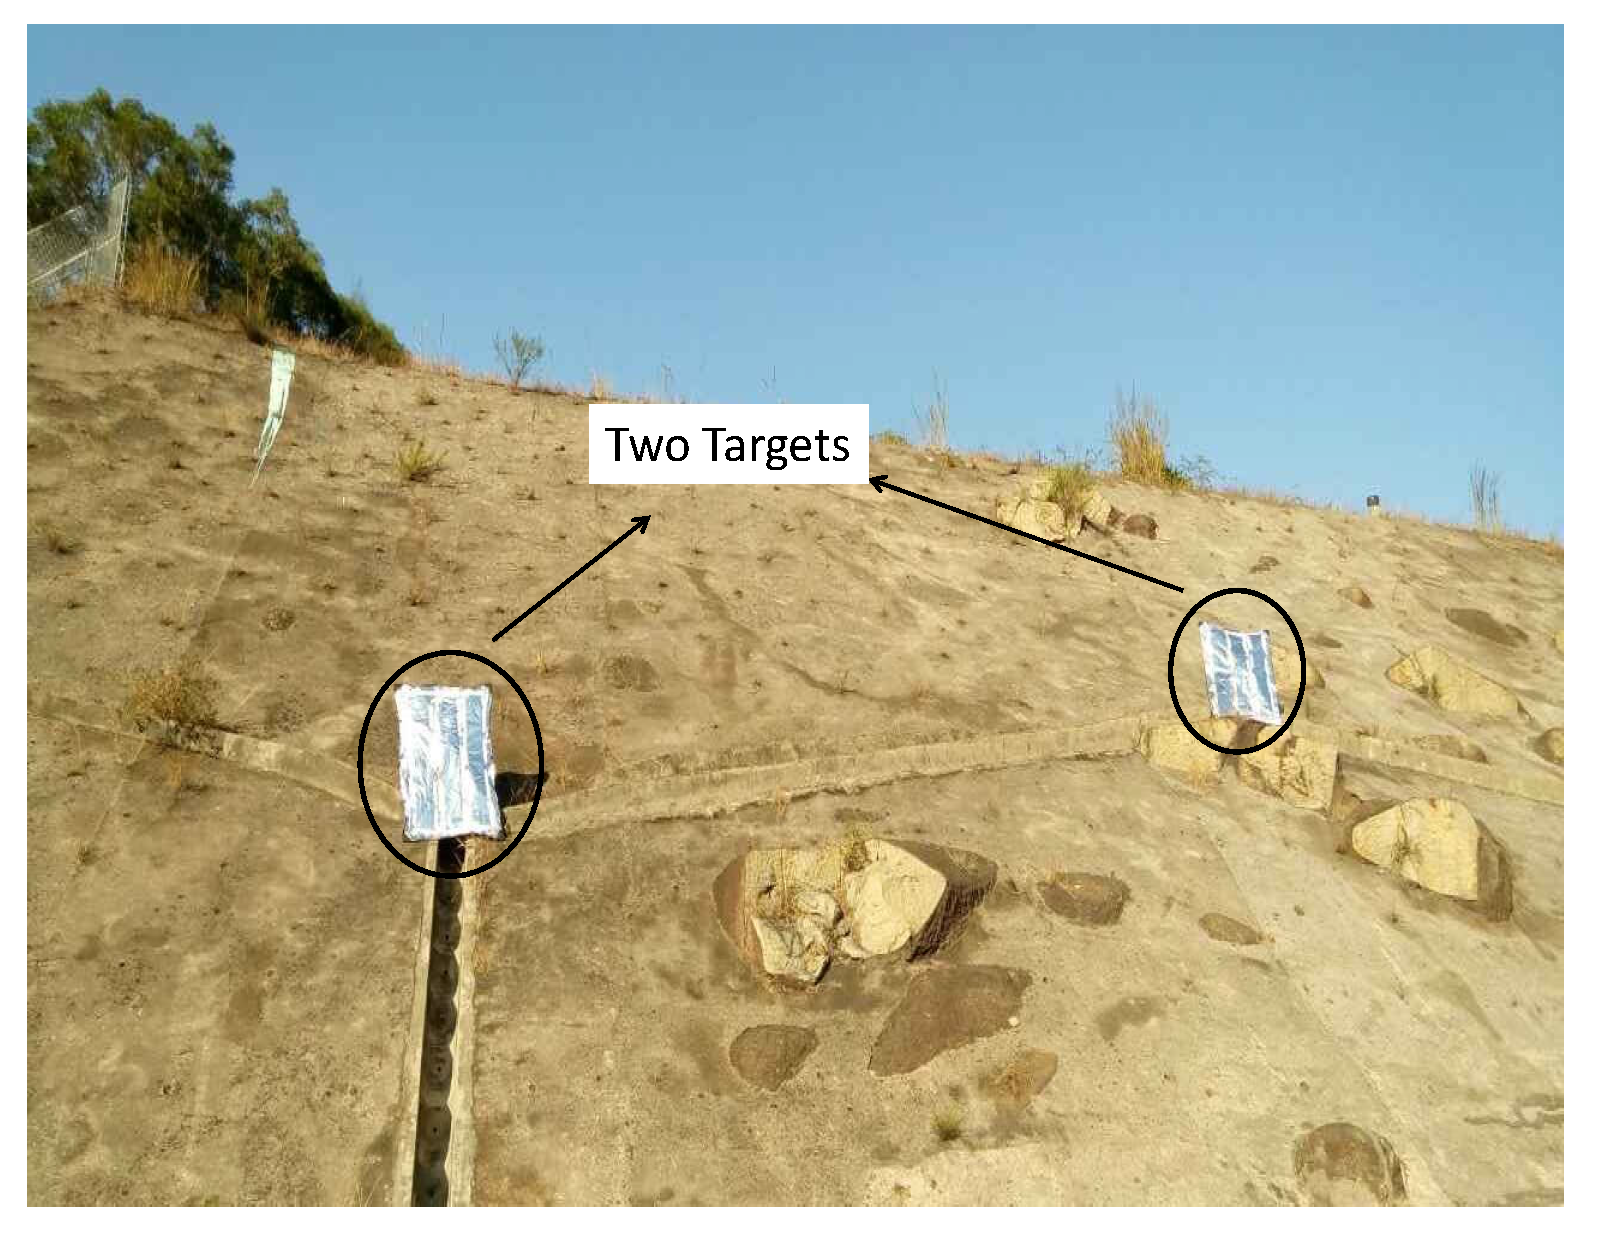
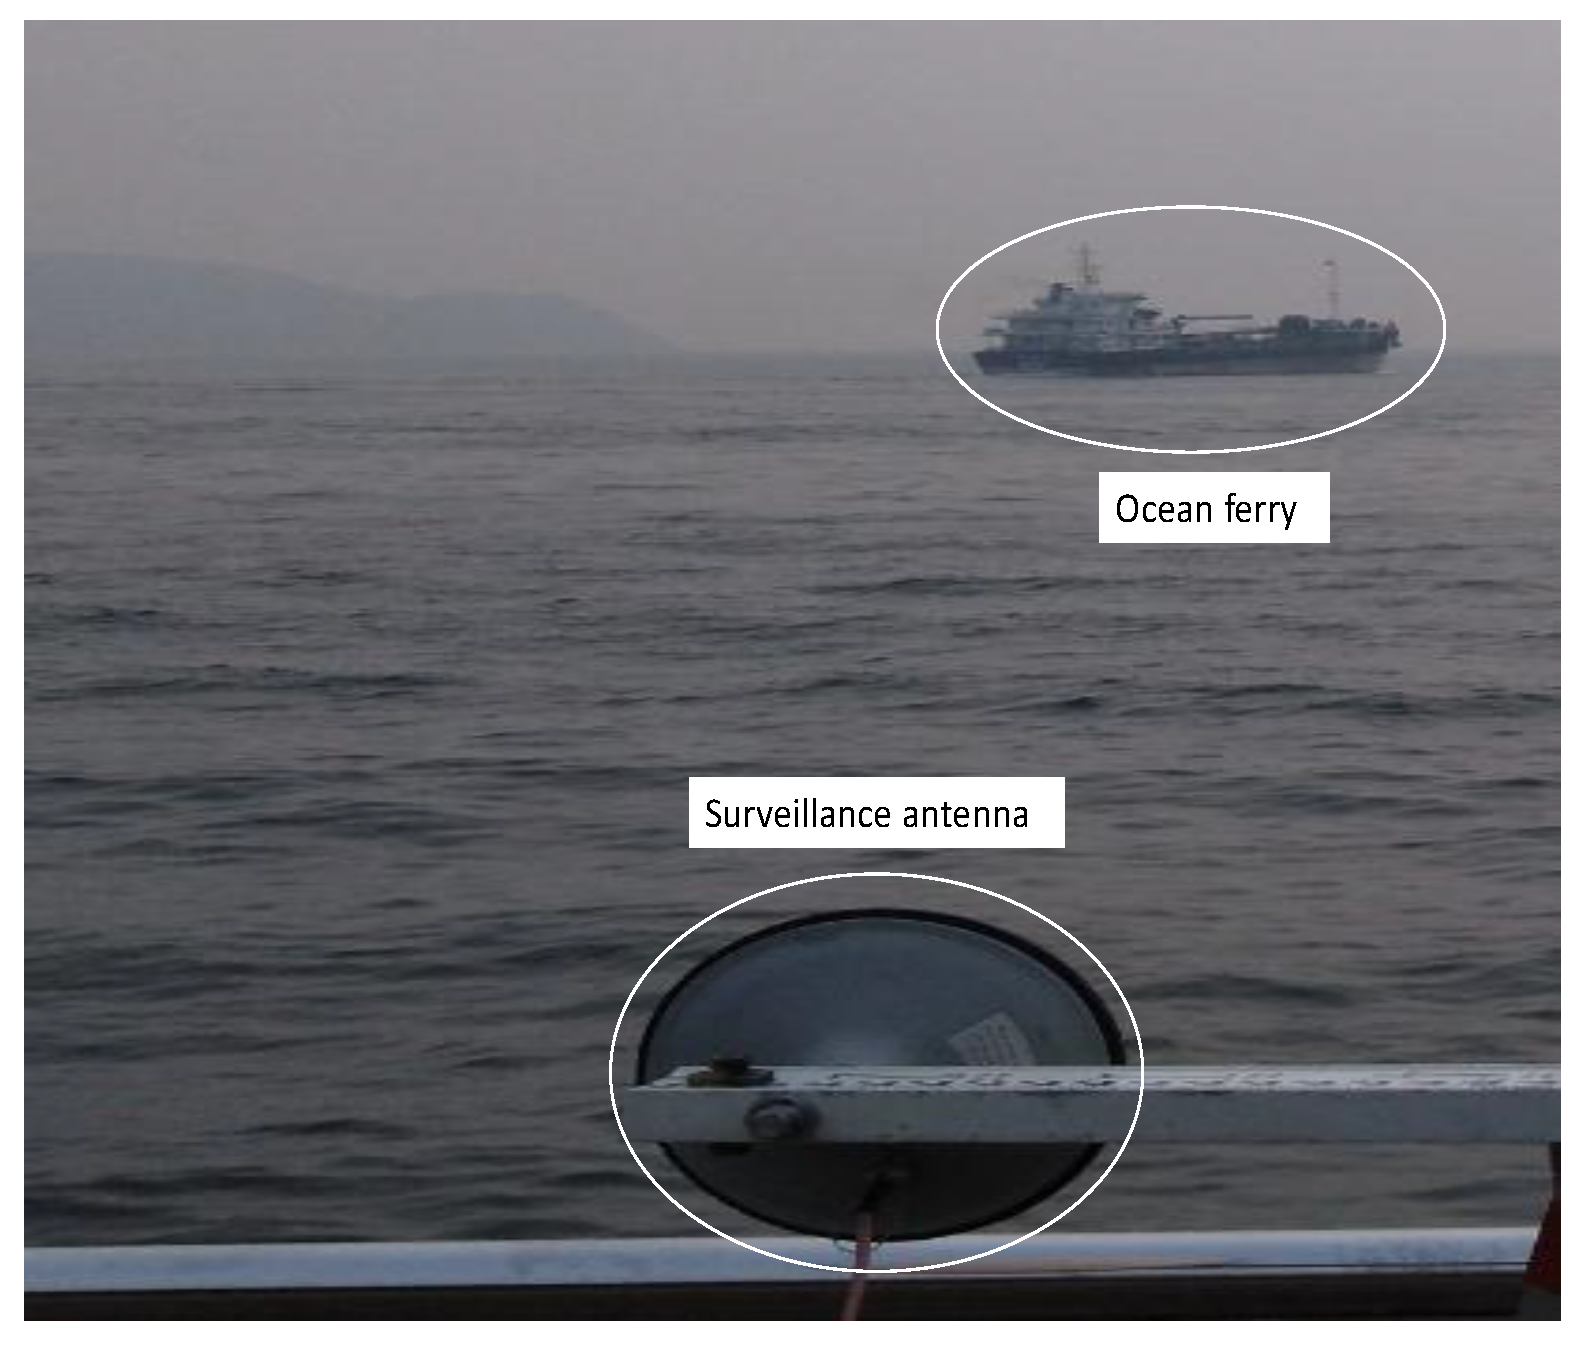
Meanwhile, the field experiments are carried out on the ground-based GNSS radar. Under many circumstances, only two satellites are satisfied backscattering geometric position as
Figure 1. Thus, to maximumly avoid direct signal interference at surveillance channel, only two satellites are used for the coherent accumulation. In the future, the authors aim to perform experiments on airborne GNSS radar platform. As all the satellites are satisfied under the geometric model, as in
Figure 1, all of them can be employed as transmitter of opportunity, in which, the advantages of the proposed imaging scheme will be more significant in field implementations. At the same time, as the PSFs around the scene center of the same target illuminated by different satellites are not the same, although the magnitude of scene center can be improved by coherently accumulating range compressed signals, the range resolution will be negatively impacted. Therefore, in future, the authors will further improve the proposed scheme by combining the range resolution enhanced mechanism in the first author’s previous work [
25]. In this remit, a range resolution enhanced GNSS-SAR or GNSS radar RD map can be obtained on the basis of coherently integrated multi-satellites.
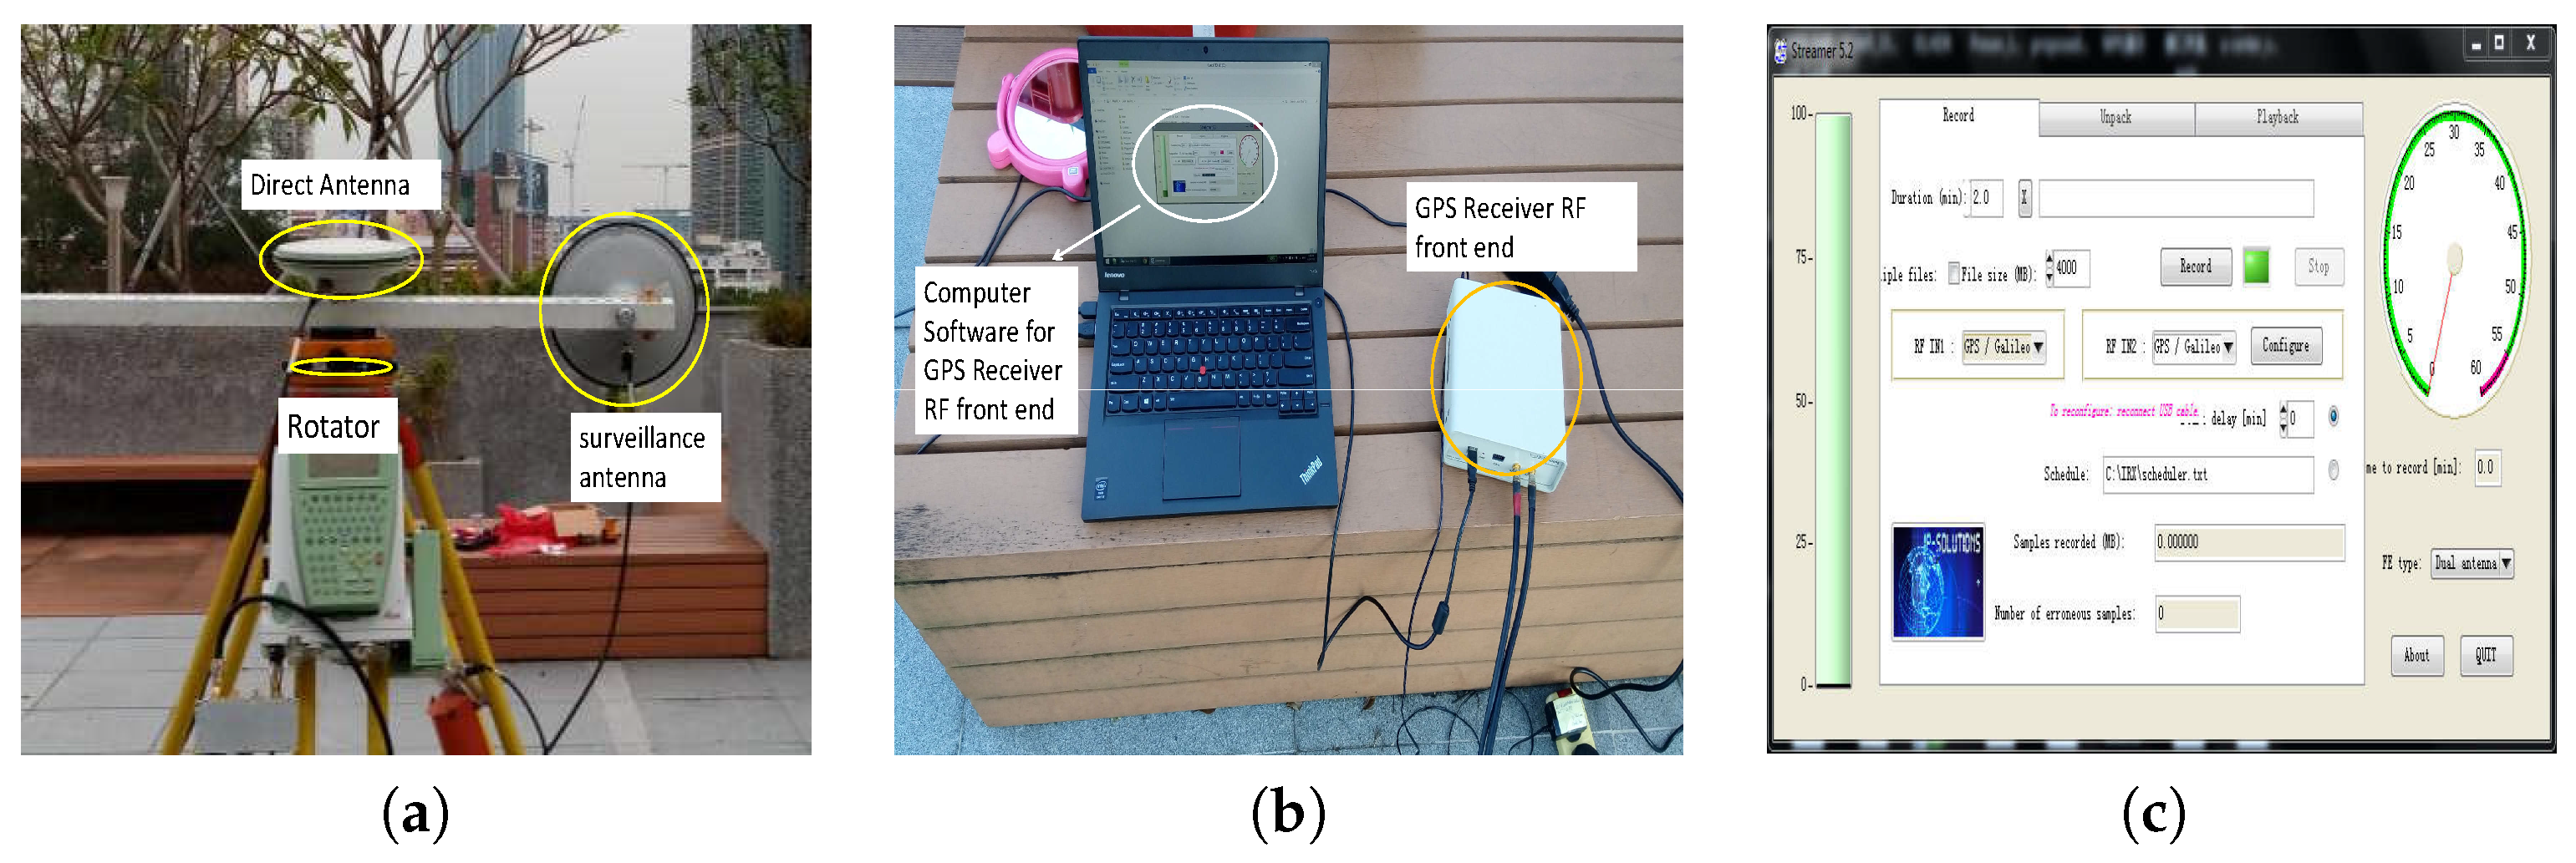
In addition, for this research, the authors only have GPS C/A code SDR receiver as shown in
Figure 4 for field experimental testing. In the future, the authors will apply the proposed imaging scheme to GLONASS, Galileo, and Beidou (Compass) signal receivers, in which, the adaptability of the proposed scheme can be enhanced.


