Article

SnO2/TiO2 Thin Film n-n Heterostructures of Improved Sensitivity to NO2

1
Faculty of Computer Science, Electronics and Telecommunications, AGH University of Science and Technology, Al. Mickiewicza 30, 30-059 Kraków, Poland
2
Faculty of Metals Engineering and Industrial Computer Science, AGH University of Science and Technology, Al. Mickiewicza 30, 30-059 Kraków, Poland
3
Faculty of Materials Science and Ceramics, AGH University of Science and Technology, Al. Mickiewicza 30, 30-059 Kraków, Poland
*
Author to whom correspondence should be addressed.
Sensors 2020, 20(23), 6830; https://doi.org/10.3390/s20236830
Submission received: 30 September 2020 / Revised: 13 November 2020 / Accepted: 25 November 2020 / Published: 29 November 2020

Abstract

:
Thin-film n-n nanoheterostructures of SnO2/TiO2, highly sensitive to NO2, were obtained in a two-step process: (i) magnetron sputtering, MS followed by (ii) Langmuir-Blodgett, L–B, technique. Thick (200 nm) SnO2 base layers were deposited by MS and subsequently overcoated with a thin and discontinuous TiO2 film by means of L–B. Rutile nanopowder spread over the ethanol/chloroform/water formed a suspension, which was used as a source in L–B method. The morphology, crystallographic and electronic properties of the prepared sensors were studied by scanning electron microscopy, SEM, X-ray diffraction, XRD in glancing incidence geometry, GID, X-ray photoemission spectroscopy, XPS, and uv-vis-nir spectrophotometry, respectively. It was found that amorphous SnO2 films responded to relatively low concentrations of NO2 of about 200 ppb. A change of more than two orders of magnitude in the electrical resistivity upon exposure to NO2 was further enhanced in SnO2/TiO2 n-n nanoheterostructures. The best sensor responses RNO2/R0 were obtained at the lowest operating temperatures of about 120 °C, which is typical for nanomaterials. Response (recovery) times to 400 ppb NO2 were determined as a function of the operating temperature and indicated a significant decrease from 62 (42) s at 123 °C to 12 (19) s at 385 °C A much smaller sensitivity to H2 was observed, which might be advantageous for selective detection of nitrogen oxides. The influence of humidity on the NO2 response was demonstrated to be significantly below 150 °C and systematically decreased upon increase in the operating temperature up to 400 °C.

1. Introduction

Nitrogen dioxide (NO2) is a highly reactive, hazardous gas and a prominent air pollutant. Despite the fact that only very high concentrations of NO2 cause immediate effects: mild irritation of the nose and throat (10–20 ppm), swelling leading to pneumonia or bronchitis (25–50 ppm), and death due to suffocation (above 100 ppm) [1], a prolonged exposure to low amounts of NO2 (even of hundreds ppb) may cause breathing problems, including airway inflammation of healthy people and respiratory inefficiency for those with asthma. The threshold limit value (TLV) was set to 3 ppm as time-weighted average (TWA), and 5 ppm as short-term exposure limit (STEL) [2]. Low-threshold, highly sensitive and selective detection of NO2 has recently appeared as a particularly important issue due to an increased global conscience of its detrimental influence on the environment [3,4]. Quite drastic measures taken in the case of indoor monitoring of NO2 in car interiors [5,6] related to the application of catalysts mounted in the automotive exhaust systems has driven the research towards new concepts of accumulative-type sensors [7].
Metal oxide semiconductors, MOS, such as SnO2 and TiO2 have been most frequently used as CO and H2 gas sensors of the resistive-type [8,9,10,11,12,13,14,15]. Applications of these n-type semiconductors to oxidizing gases are relatively scarce as the resulting high resistance is often beyond the measurement limit. Recently, it has been recognized that it is possible to construct efficient NO2 sensors based on Al doped SnO2 able to operate properly even under the humidity background [16].
A literature review of SnO2-based sensing materials for detection of NO2 synthesized by various physical and chemical methods is given in Table 1. From the data included in this table, one can conclude that the efforts are mainly focused on near to room-operating temperature and low NO2 threshold. Depending on the composition of the sensing material, even extremely high responses corresponding to the electrical resistance change up to 4 orders of magnitude were demonstrated [17].
All these efforts indicate that the development of a stable and selective NO2 gas sensor being capable of fast and accurate detection of extremely low NO2 concentrations at near to room temperature is still of prime importance for environmental monitoring, public health and automotive applications.
Recently, a dramatically increased number of publications dealing with p-n and n-n heterostructures as a promising solution to gas sensitivity improvement has been observed [32,37,38,39,40,41,42,43,44,45,46]. In particular, TiO2-SnO2 n-n heterostructures have been proposed as gas sensitive materials [38,39,45,46].
In 2010, Zeng et al. [39] explained the mechanism responsible for an improved sensitivity of n-n heterostructures. Results from independent experiments showed that the conduction (CB) and valence (VB) band edges of TiO2 are above those corresponding to SnO2. Therefore, when physical connection is made between TiO2 and SnO2 grains, a contact potential difference is established which is responsible for an electron transfer from CB of TiO2 to CB of SnO2. Then, the oxygen pre-adsorption at the surface of SnO2 grains is enhanced due to electronic charge injection. Increased concentration of adsorption sites for oxygen is treated as a decisive factor for the observed improvement of the sensing behavior of SnO2 with a small addition of TiO2 [38,47].
To date, our research performed on TiO2–SnO2 was related to the gas sensors based on solid-solutions and nanocomposites being a simple mixture of two constituents [38,46,47,48]. Thin films in a form of bi-layers have been studied with much smaller success [45] as the interfaces are usually flat, resulting in much lower surface-to-volume ratio. In order to benefit from both a planar geometry with well defined interfaces between layers and an increased surface-to-volume ratio, a combination of two methods—magnetron sputtering MS and the Langmuir-Blodgett technique—has been proposed in the present work. This innovative approach is expected to yield enhanced responses, particularly to oxidizing gases.
Recently, numerous attempts to use the Langmuir-Blodgett (L–B) technique to grow metal oxide thin films have been reported [49,50,51,52,53,54]. In contrast to Physical Vapour Deposition methods, PVD, [55,56,57,58,59], Langmuir-Blodgett is a non-destructive technique which does not change the structure of the substrate. However, it can affect its electrical properties. Moreover, the L–B deposition is carried out at room temperature and at a normal pressure.
Here, a non-destructive modification of SnO2 layer (obtained via magnetron sputtering) by a thin film of TiO2 deposited using L–B method is proposed for the construction of an efficient NO2 sensor. To the best of our knowledge, this is the first report of application of such combination of methods in the development of SnO2/TiO2 thin film n-n heterostructures for NO2 detection at low concentration and temperature.

2. Materials and Methods

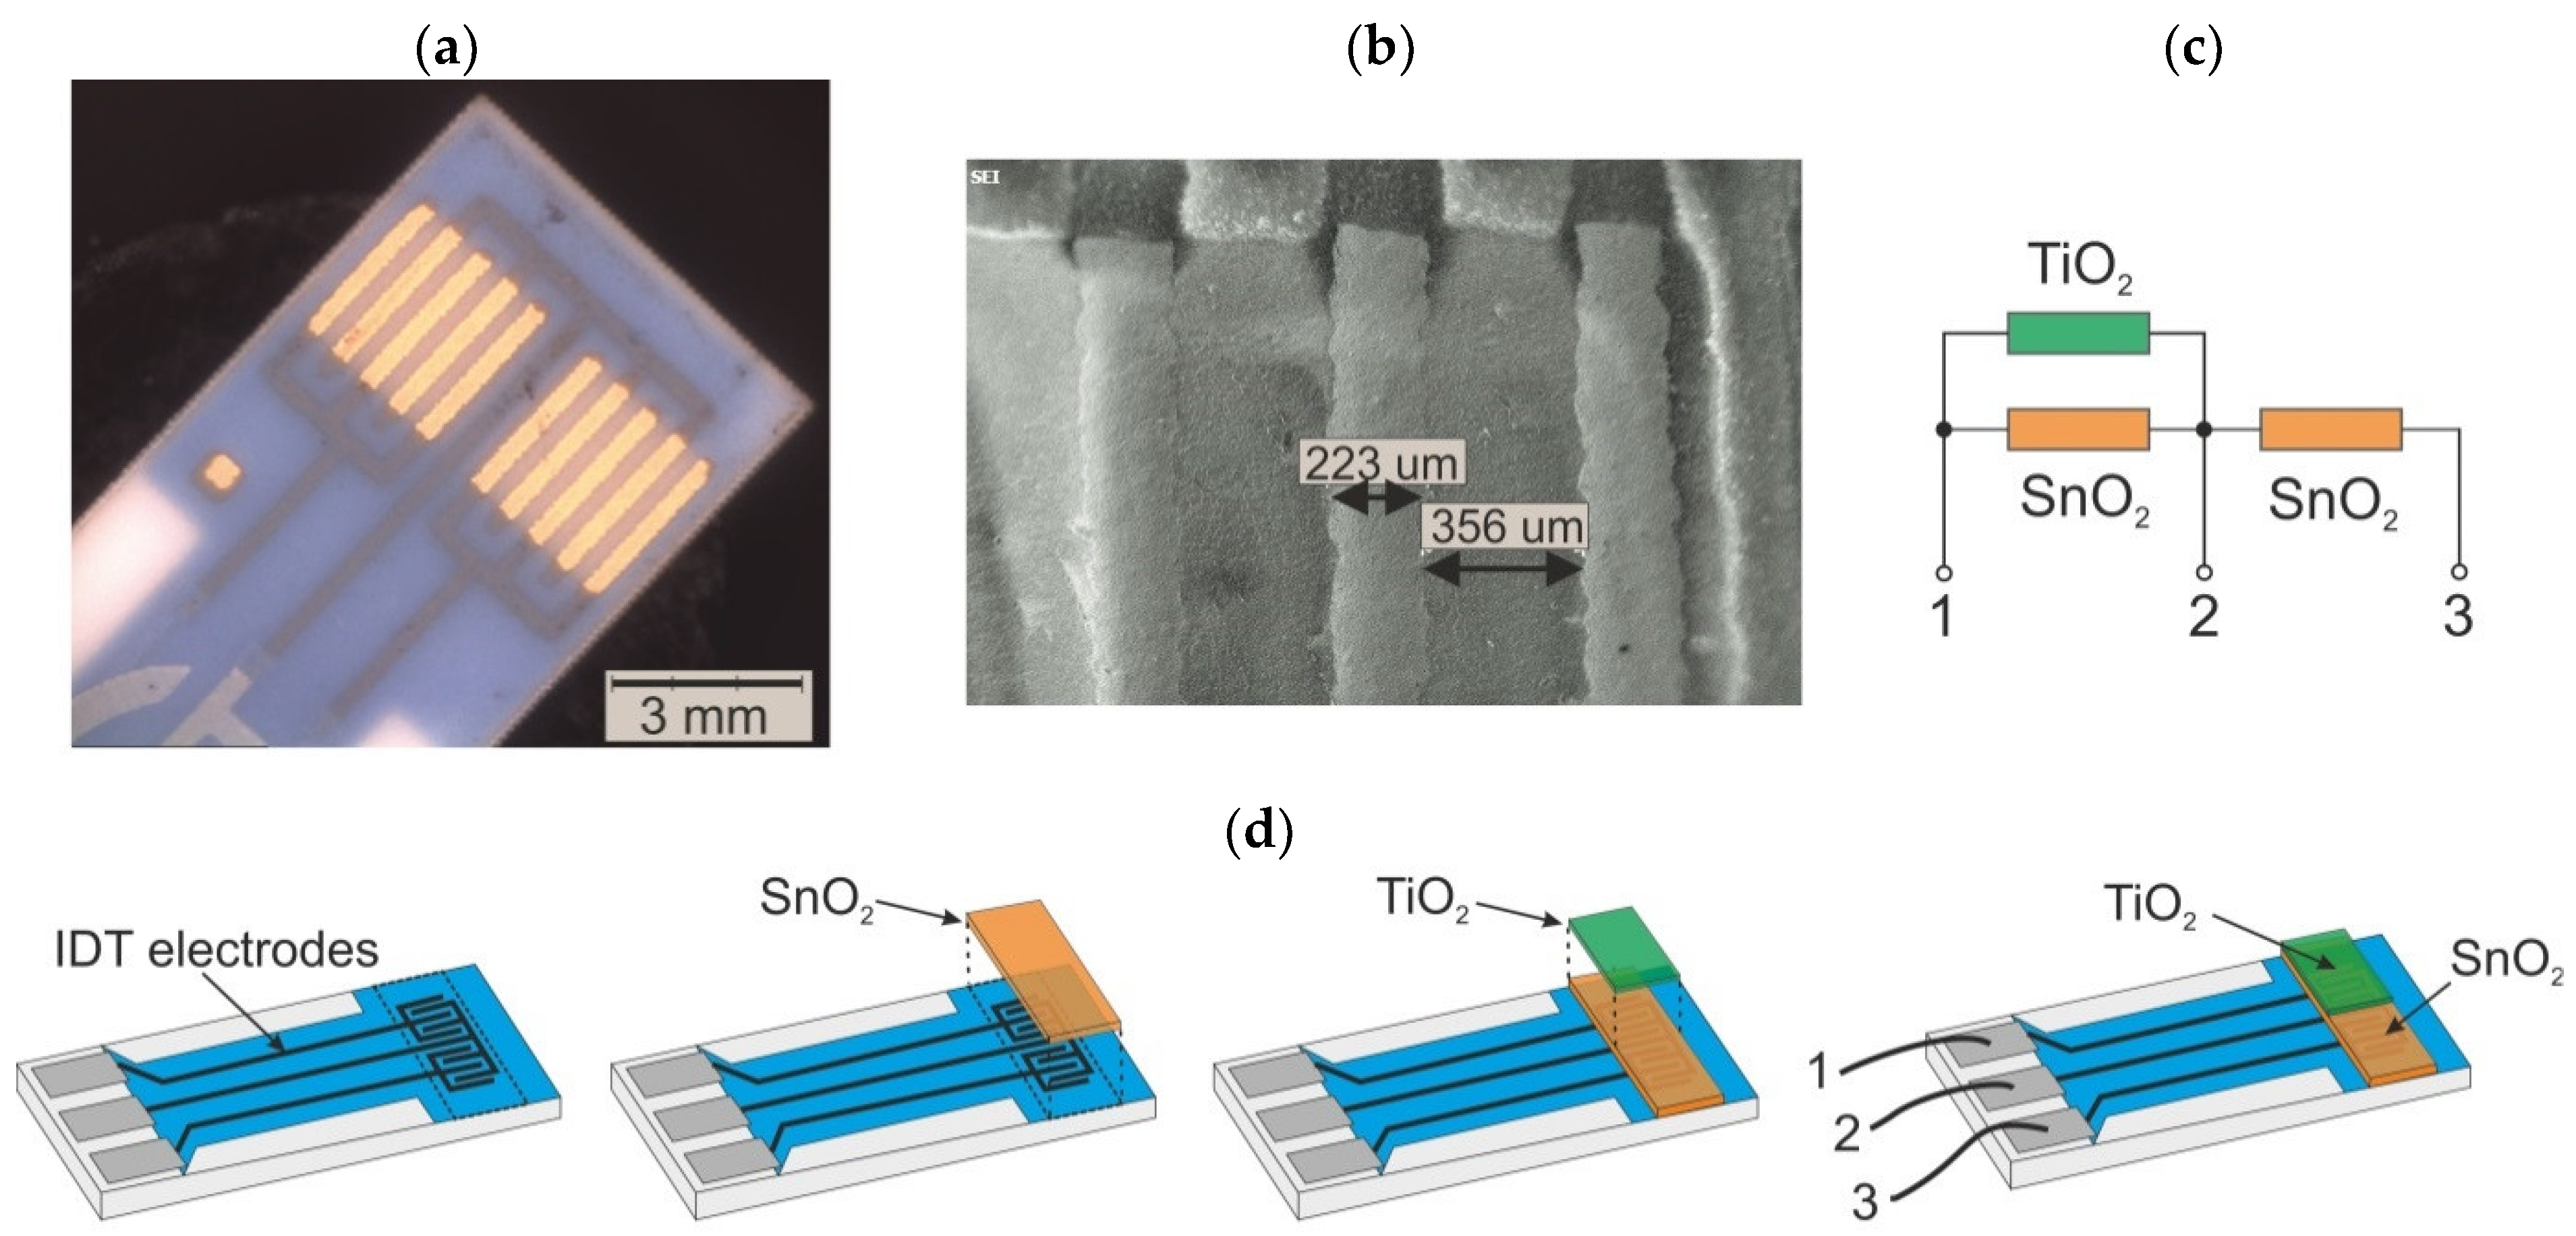
2.1. Sample Preparation

2.1.1. SnO2 Thin Films

Thin films of SnO2 were deposited by magnetron sputtering from a metallic Sn target onto corundum CC2.S type supports (BVT Technologies, Czech Republic) dedicated to sensor measurements, silicon and amorphous silica a-SiO2 substrates to study their morphological, structural and electronic properties. Reactive sputtering was performed at 50 W, in Ar + 20% O2 atmosphere, with base and working pressures of 1.0 × 10⁻⁵ mbar and 2.0 × 10⁻² mbar, respectively. Two types of SnO2 samples—a-SnO2 and c-SnO2—were prepared at a substrate temperature of 180 °C during 30 min of sputtering and at 200 °C during 120 min, respectively.

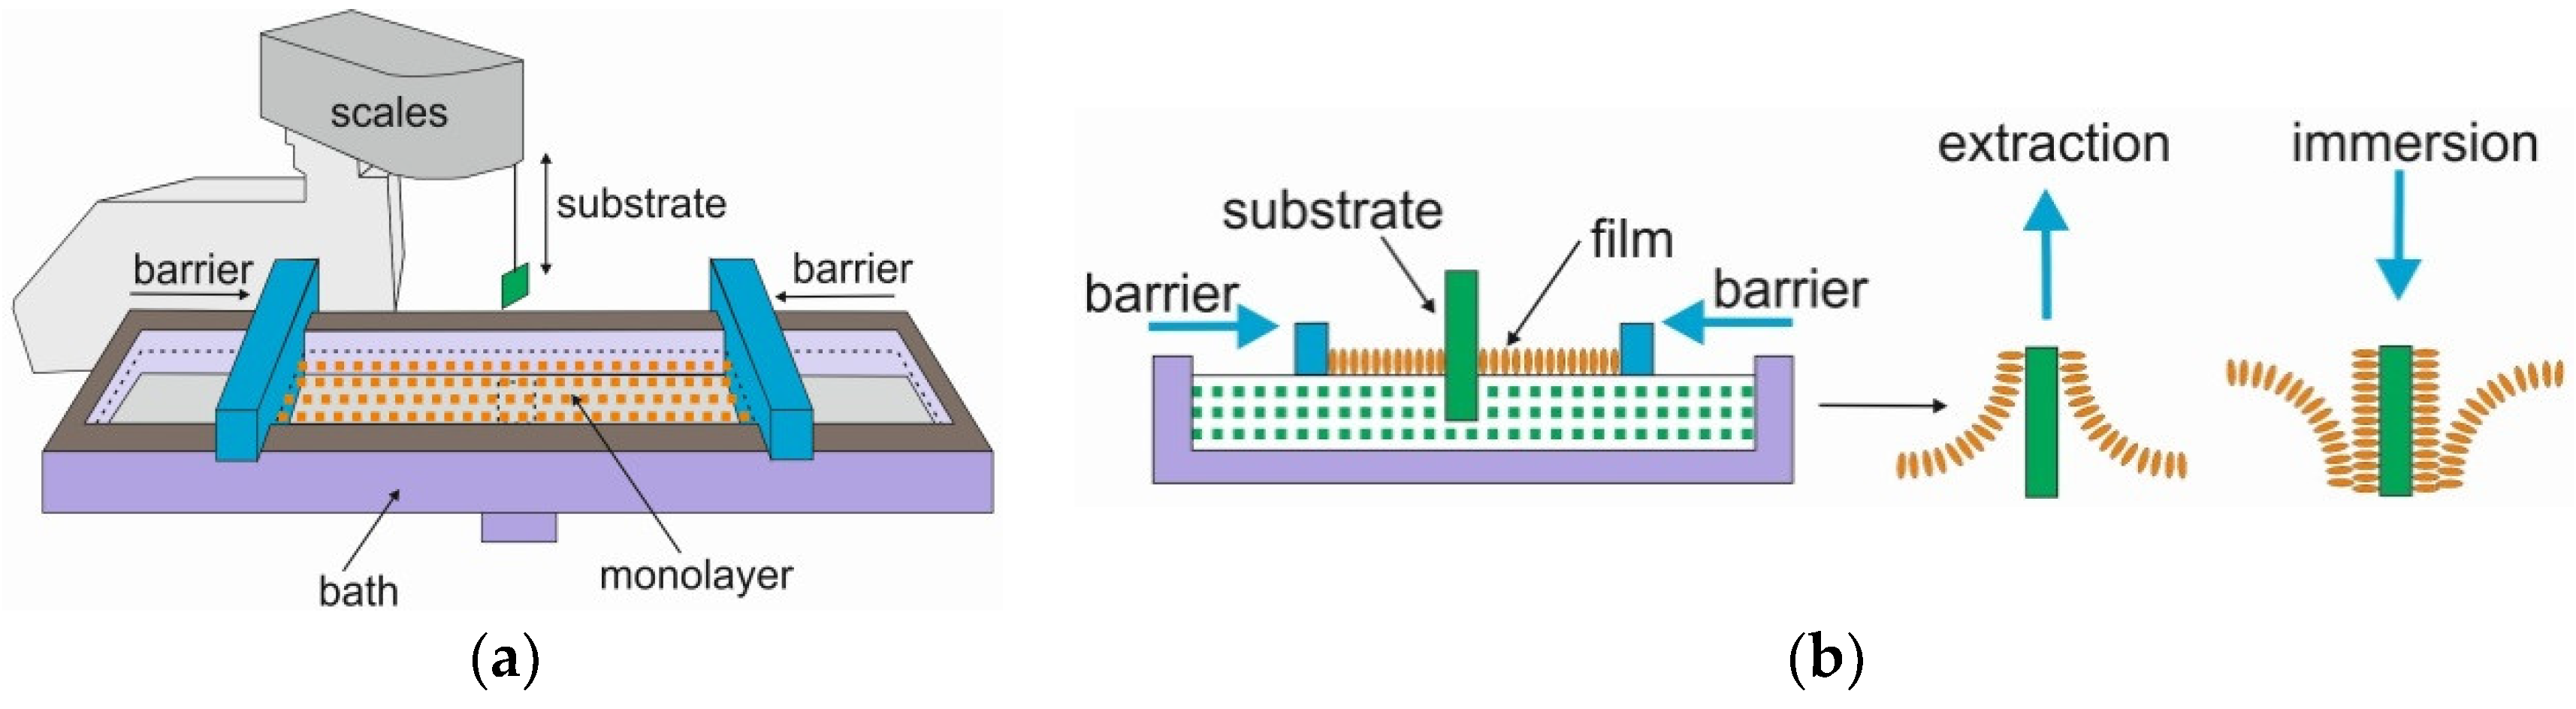
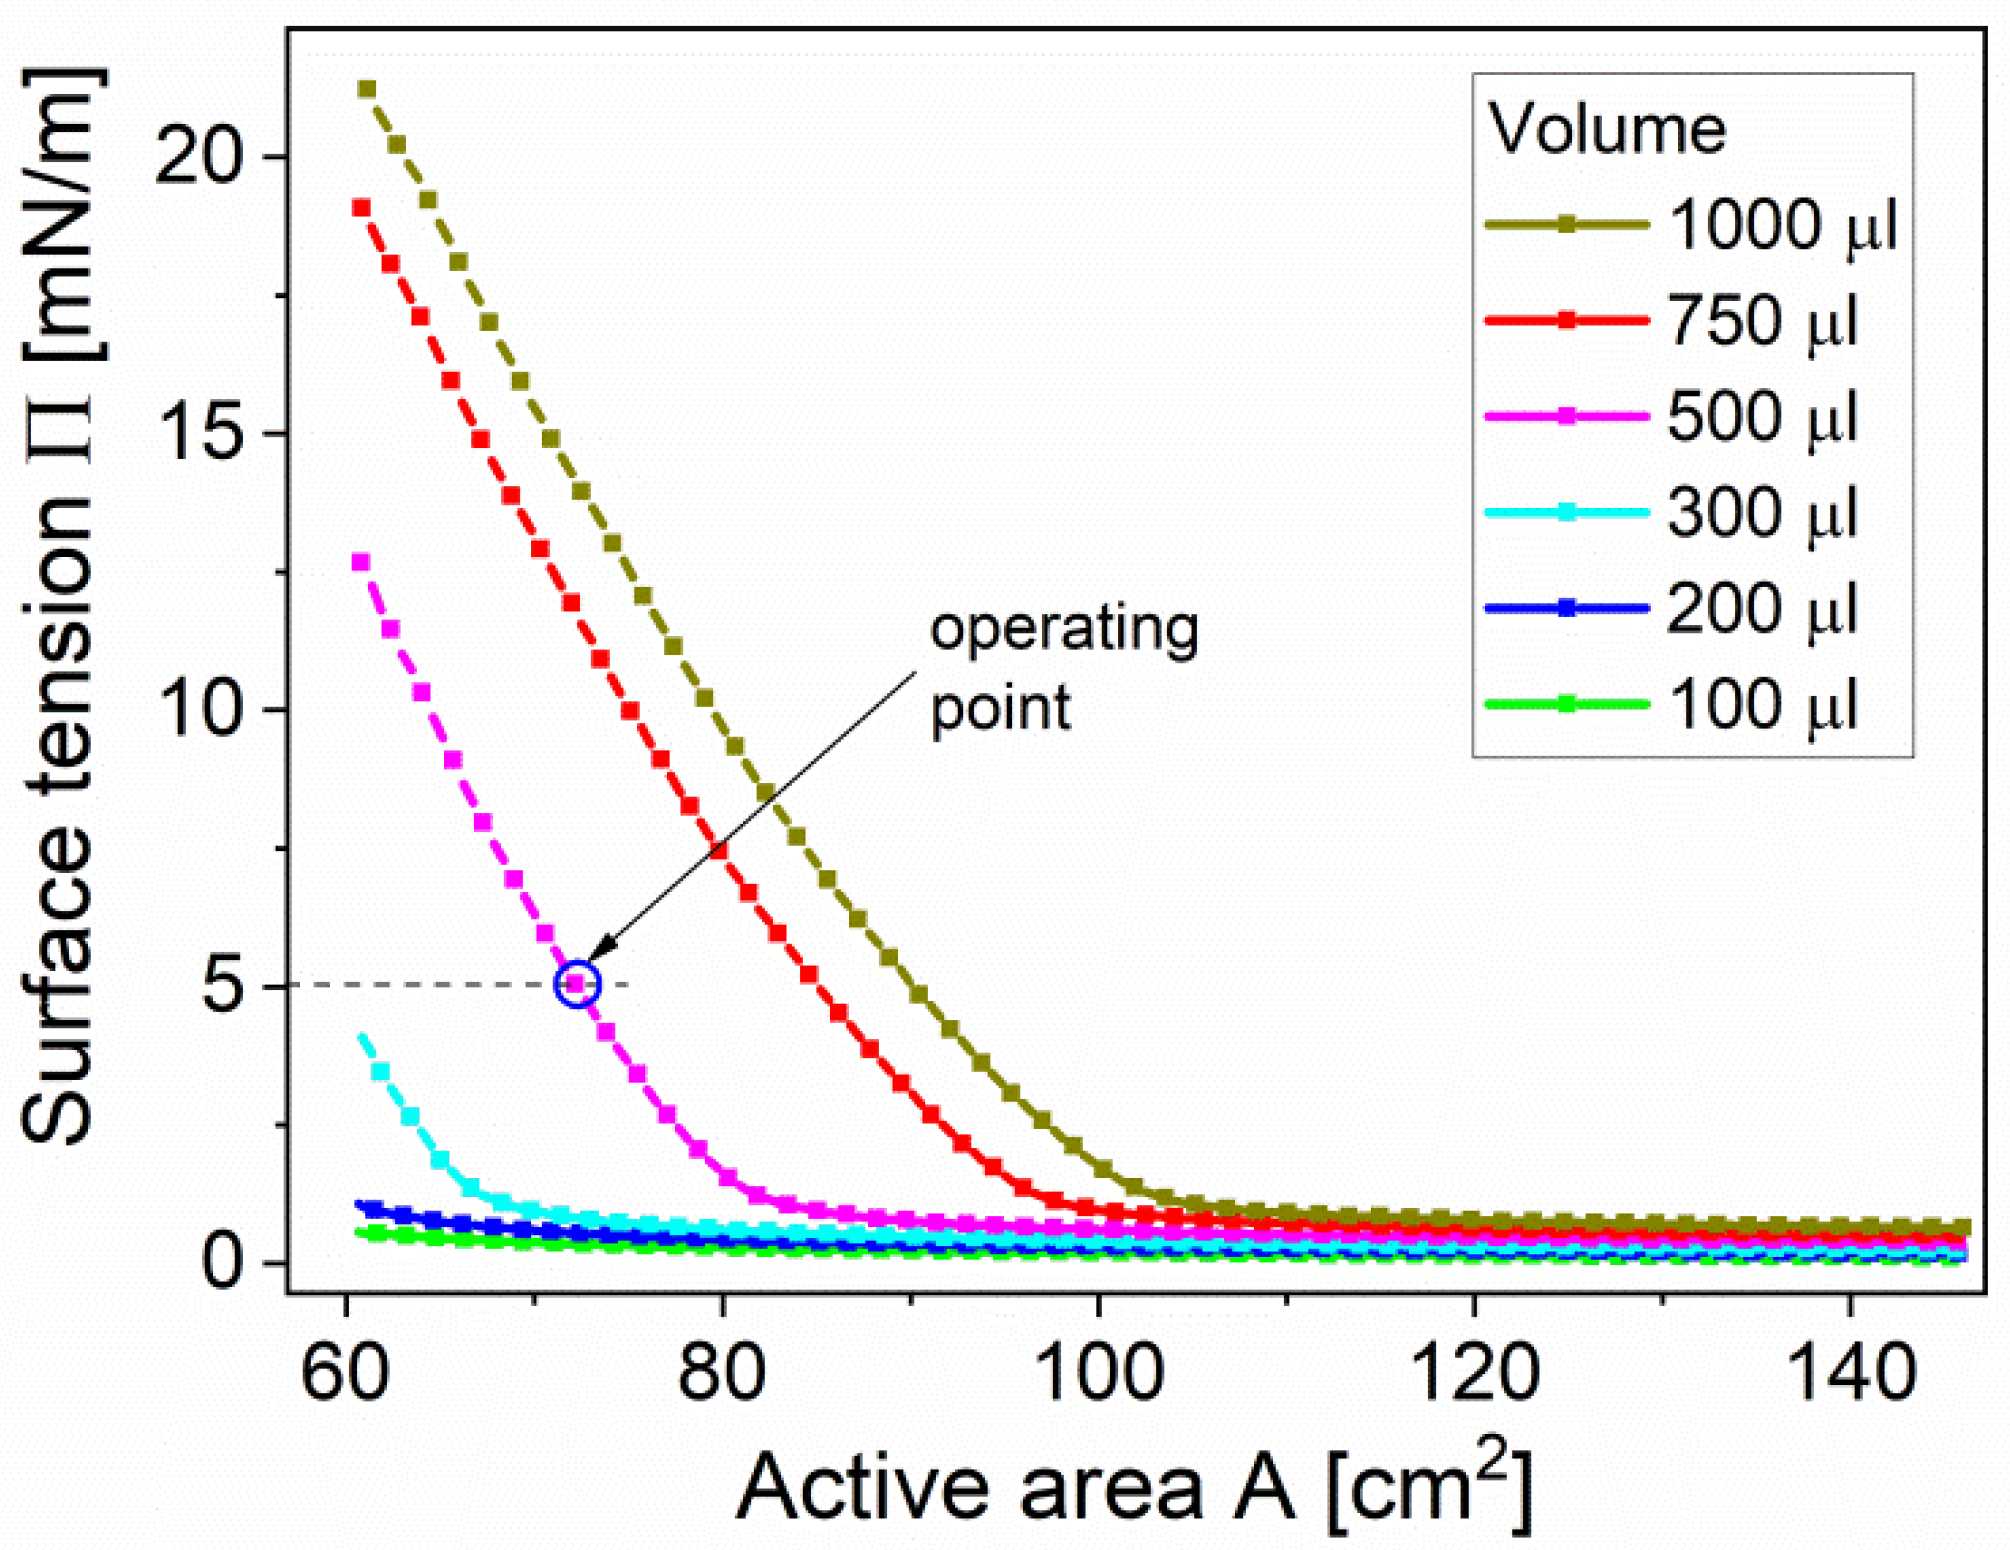
2.1.2. TiO2 Thin Films

TiO2 thin films were deposited by the L–B method on previously grown a-SnO2 thin films to form SnO2/TiO2 n-n nanoheterostructures. Morevoer, TiO2 single layers were obtained on silicon and amorphous silica substrates for XRD, XPS, SEM and optical characterisation.
Langmuir trough and the idea of L–B technique are demonstrated in Figure 1. The experimental set-up consisted of KSV NIMA bath with 270 cm2 total area by Biolin Scientific, placed on an anti-vibrational table (Figure 1a). Commercial TiO2 rutile nanopowder (Sigma-Aldrich, St. Louis, MO, USA) with a specific surface area, SSA, of 140 m2/g was spread on the surface of subphase, i.e., the deionized water with a conductance less than 0.08 μS/cm and rapidly evaporating solvent composed of chloroform:ethanol with 4:1 v/v and a typical concentration of 0.5 mg/mL. After spreading, 10 min was allowed for the solvent to evaporate, leaving a loosely packed TiO2 layer which was subsequently compressed to a certain surface tension by barriers moving with the speed of 2 mm/min. The surface tension was measured with an accuracy of ±0.1 mN/m using a Wilhelmy plate made of chromatographic paper (Whatman, Piscataway, NJ, USA).
Thin (60 nm) layers of TiO2 were obtained by a transfer from the liquid–solid interface to the solid substrates by consecutive immersion and extraction, as shown in Figure 1b. All experiments were performed at room temperature.
Prior to this transfer, Langmuir isotherms of suspensions of TiO2 rutile nanopowders spread on the surface of water in the Langmuir through were recorded. The surface tension (Π) as a function of total area between barriers (A) for different volumes (V) of spread TiO2 suspension (100–1000 μL) is presented in Figure 2.
The isotherms reveal negligible changes of Π at large A until the film is compressed at about 110 cm2. Below A = 110 cm2 for volume V of spread TiO2 suspension between 100 μL to 1000 μL the surface tension rises sharply until completely compressed in the trough at A = 60 cm2. The point of rapid growth of value is strongly dependent on V. The highest Π equals to 22 mN/m as recorded at V = 1000 μL. Even for high V values no collapse is observed, thus TiO2 layers are stable.
Finally, the TiO2 layers were deposited onto the bare substrates or SnO2 covered ones at the surface tension Π = 5 mN/m and spread volume V = 500 μL.

2.2. Characterization Methods

The properties of the prepared thin films were investigated with the use of X-ray diffraction, XRD, scanning electron microscopy, SEM, X-ray photoelectron spectroscopy, XPS, and optical methods.
X-ray diffraction, XRD at grazing incidence GID allowed us to determine the crystal structure of the deposited films. Philips X’Pert Pro diffractometer with CuKα X-ray radiation with wavelength λ = 0.154056 nm, at the incidence angle ω = 3°, was used. The crystallite size, D, was calculated from the Debye–Scherrer’s formula given by
D = k λ β cos θ
where k = 0.9, β is the full width at half maximum (FWHM) of a diffraction peak and θ is half of the angle at which a given diffraction peak occurs.
The morphology of SnO2 and TiO2 thin films grown on Si substrates was studied with a NOVA NANO SEM 200 (FEI) Scanning Electron Microscope SEM. The FEI Helios NanoLab 600i Scanning Electron Microscope was applied for the studies of growth of TiO2 films on SnO2 supports. A chemical analysis of elements was performed by means of Energy Dispersive Spectroscopy, EDS with the latter microscope.
X-ray Photoelectron Spectroscopy (XPS) was employed to assess the surface properties of deposited films. Experiments were performed with the VSW (Vacuum Systems Workshop Ltd., Crowborough, England) instrument working at Kα Mg (1253.6 eV) X-ray radiation and equipped with a concentric hemispherical electron analyser, the details of which are given in [37]. For the calibration of the binding energy BE scale, it was assumed that the position of C 1s line of the adventitious carbon, corresponding to the C–H bond, was equal to 284.6 eV.
Optical spectra of the transmittance T and reflectance R coefficients over a wide wavelength range (220–2200 nm) corresponding to uv/vis/nir regions were taken with the help of Perkin Elmer Lambda 19 double beam spectrophotometer.
The sensors’ responses were measured in a custom-made setup similar to that described elsewhere [60]. The measurements were performed on films deposited onto the final sensors’ platforms, containing double IDT electrodes made of Au and Pt alloy, presented in Figure 3. Due to the double set of electrodes, it was possible to carry out simultaneous studies in both channels and compare the results of SnO2/TiO2 with those of SnO2 under the same conditions.
The sensors were installed in a gas chamber with volume ≈ 30 cm3 on a heated workholder. The sensor temperature was determined with a Pt100 thermometer and Agilent 34970A digital multimeter. As the sensor resistance changed over few orders of magnitude, Keithley 6517 electrometer, which sourced a constant voltage U in the range of 1–10 V, was used for the measurement of sensor responses. When the current drawn by the sensor was measured, the sensor resistance was calculated. The samples were collected every 2 s with the use of LabVIEW application working on a PC computer. It controlled the system devices over IEEE 488 (GPIB) bus with the use of SCPI language. The desired gas atmosphere was prepared in a gas system comprised of bottles with synthetic air, NO2, H2, bubbler for humidifying purposes, and MKS Instruments mass flowmeters controlled with a custom-made mass flow and humidity controller. The sensors were exposed to hydrogen (H2, 1000 ppm in a bottle) and nitrogen dioxide (NO2, 100 ppm in a bottle), supplied by Air Products, Poland. The requested gas concentration was achieved by controlling the ratio of gas to air flow rate, while the humidity was set up by varying the ratio of dry to humidified air. A total gas flow of 500 cm3/min was kept constant during the whole measurement cycle. Prior to performing measurements, the sensor response was stabilized in a synthetic air under pre-set conditions (constant humidity, elevated temperature and chosen gas flow rate), following standard conditioning procedure. Then, the sensor response was measured using two scenarios. In the first one (CC-constant concentration), the sensor was exposed to a series of on/off NO2 pulses of the same concentration, with the temperature rising in well defined steps, as shown in Figure 4a. In the second scenario (CT-constant temperature), a series of on/off NO2 pulses of increasing concentrations was applied, while the temperature was kept constant (Figure 4b). From the measured sensor responses, one could calculate the basic sensor parameters: response, S, response time, tres, and recovery time, trec. The sensor responses, S, were defined differently for reducing (H2) and oxidizing (NO2) gases. In order to obtain S higher than 1, SH2 = R0/RH2 was taken as the electrical resistance in air R0 divided by that in hydrogen RH2, while the inverse ratio was used for NO2, i.e., SNO2 = RNO2/R0.
The tres and trec parameters were set up as a time required to change the electrical resistance by 90% from the base resistance measured in air (for tres) or gas (for trec) to the stable signal value obtained after the gas or air were introduced, as shown in Figure 4c,d, respectively.

3. Results and Discussion

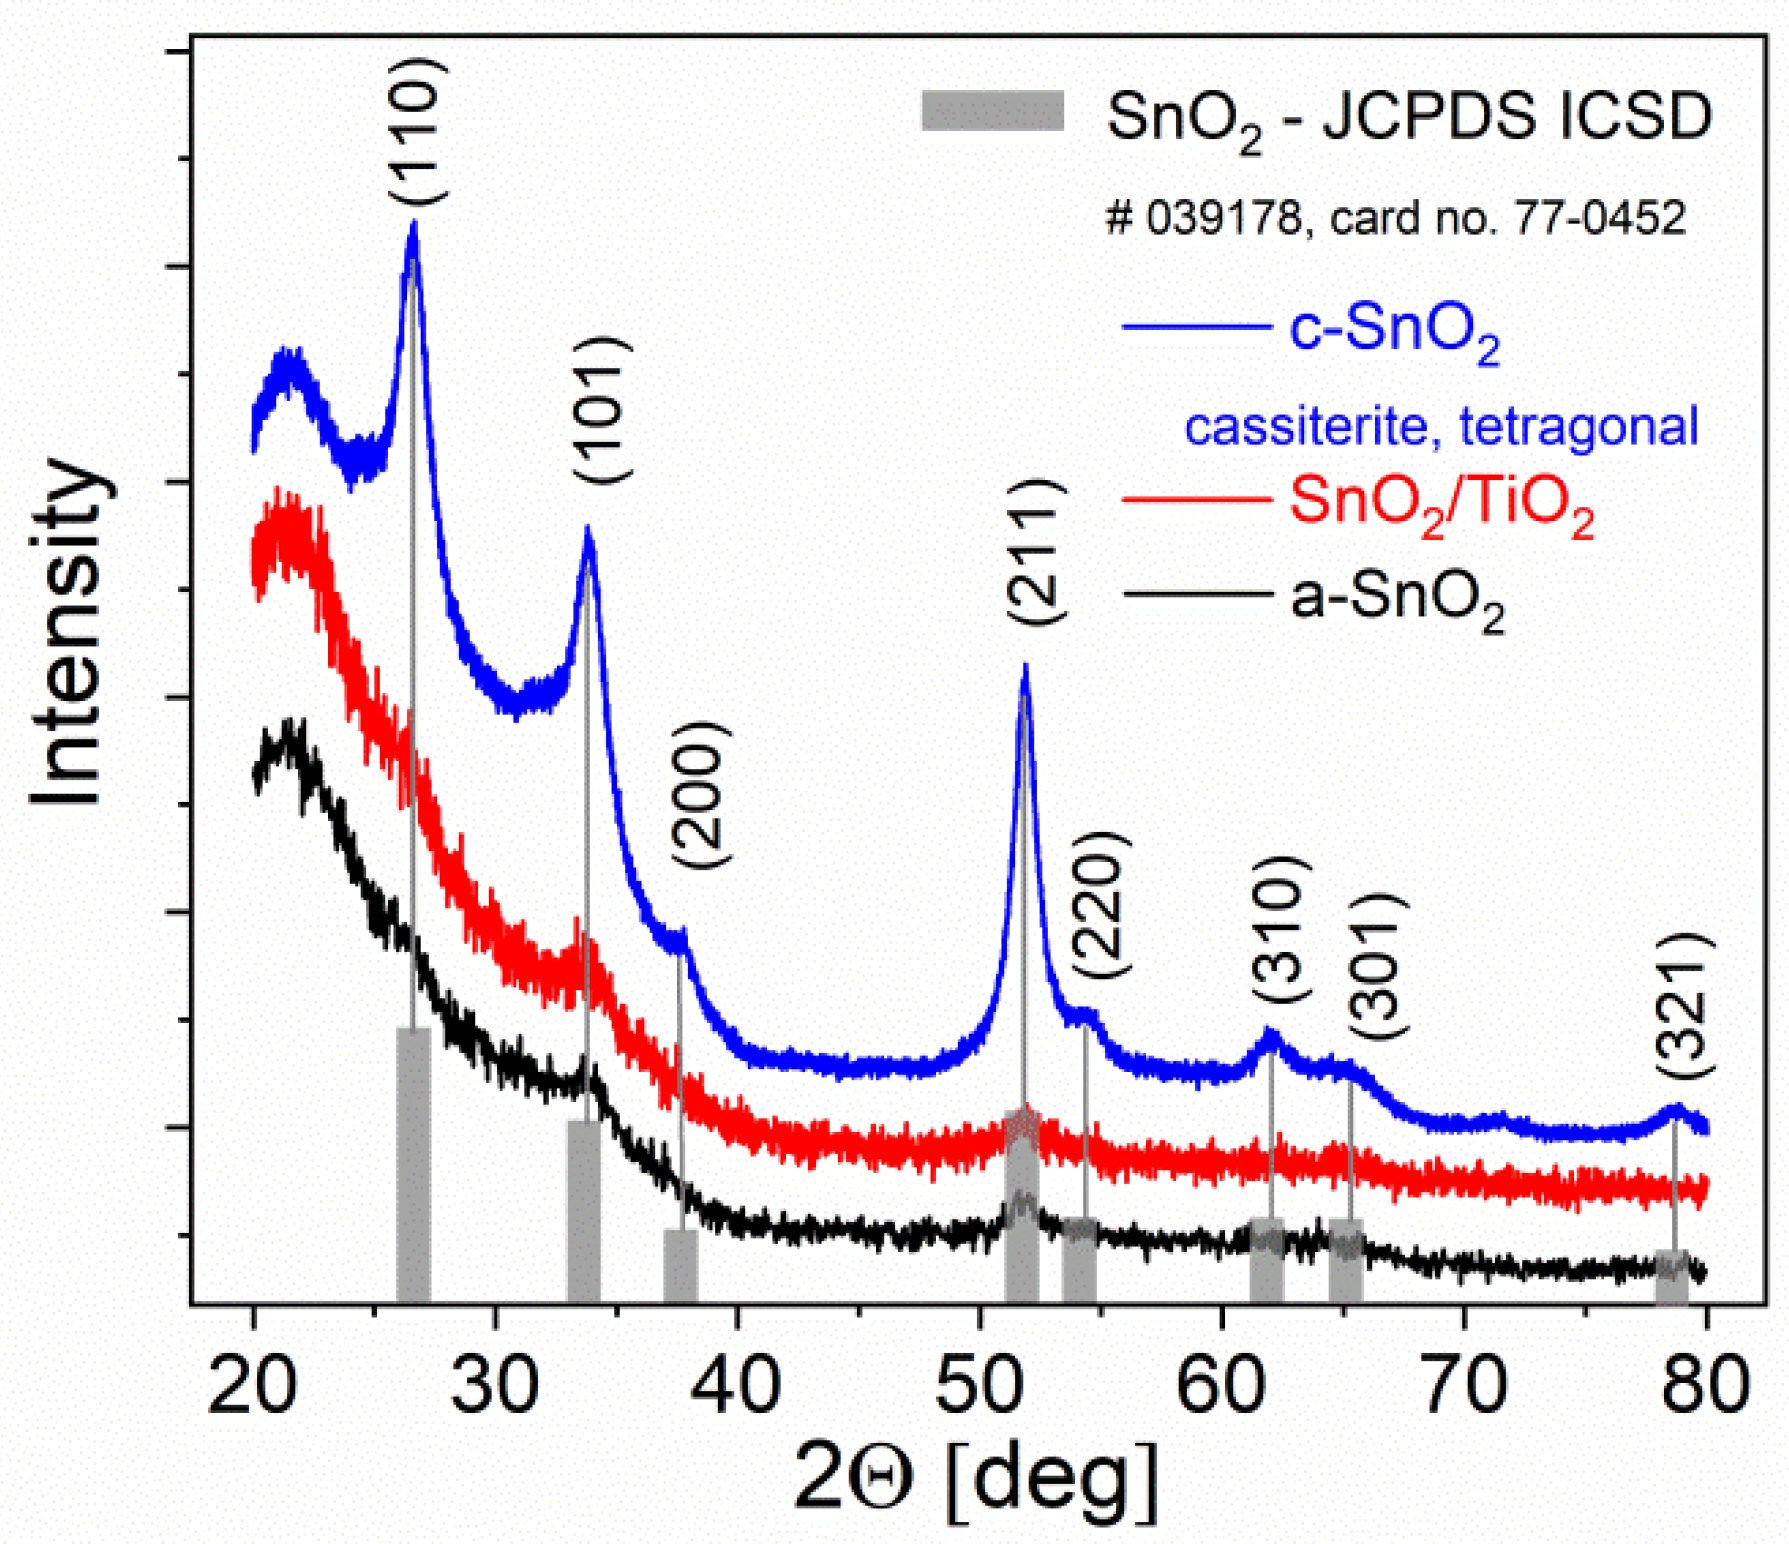
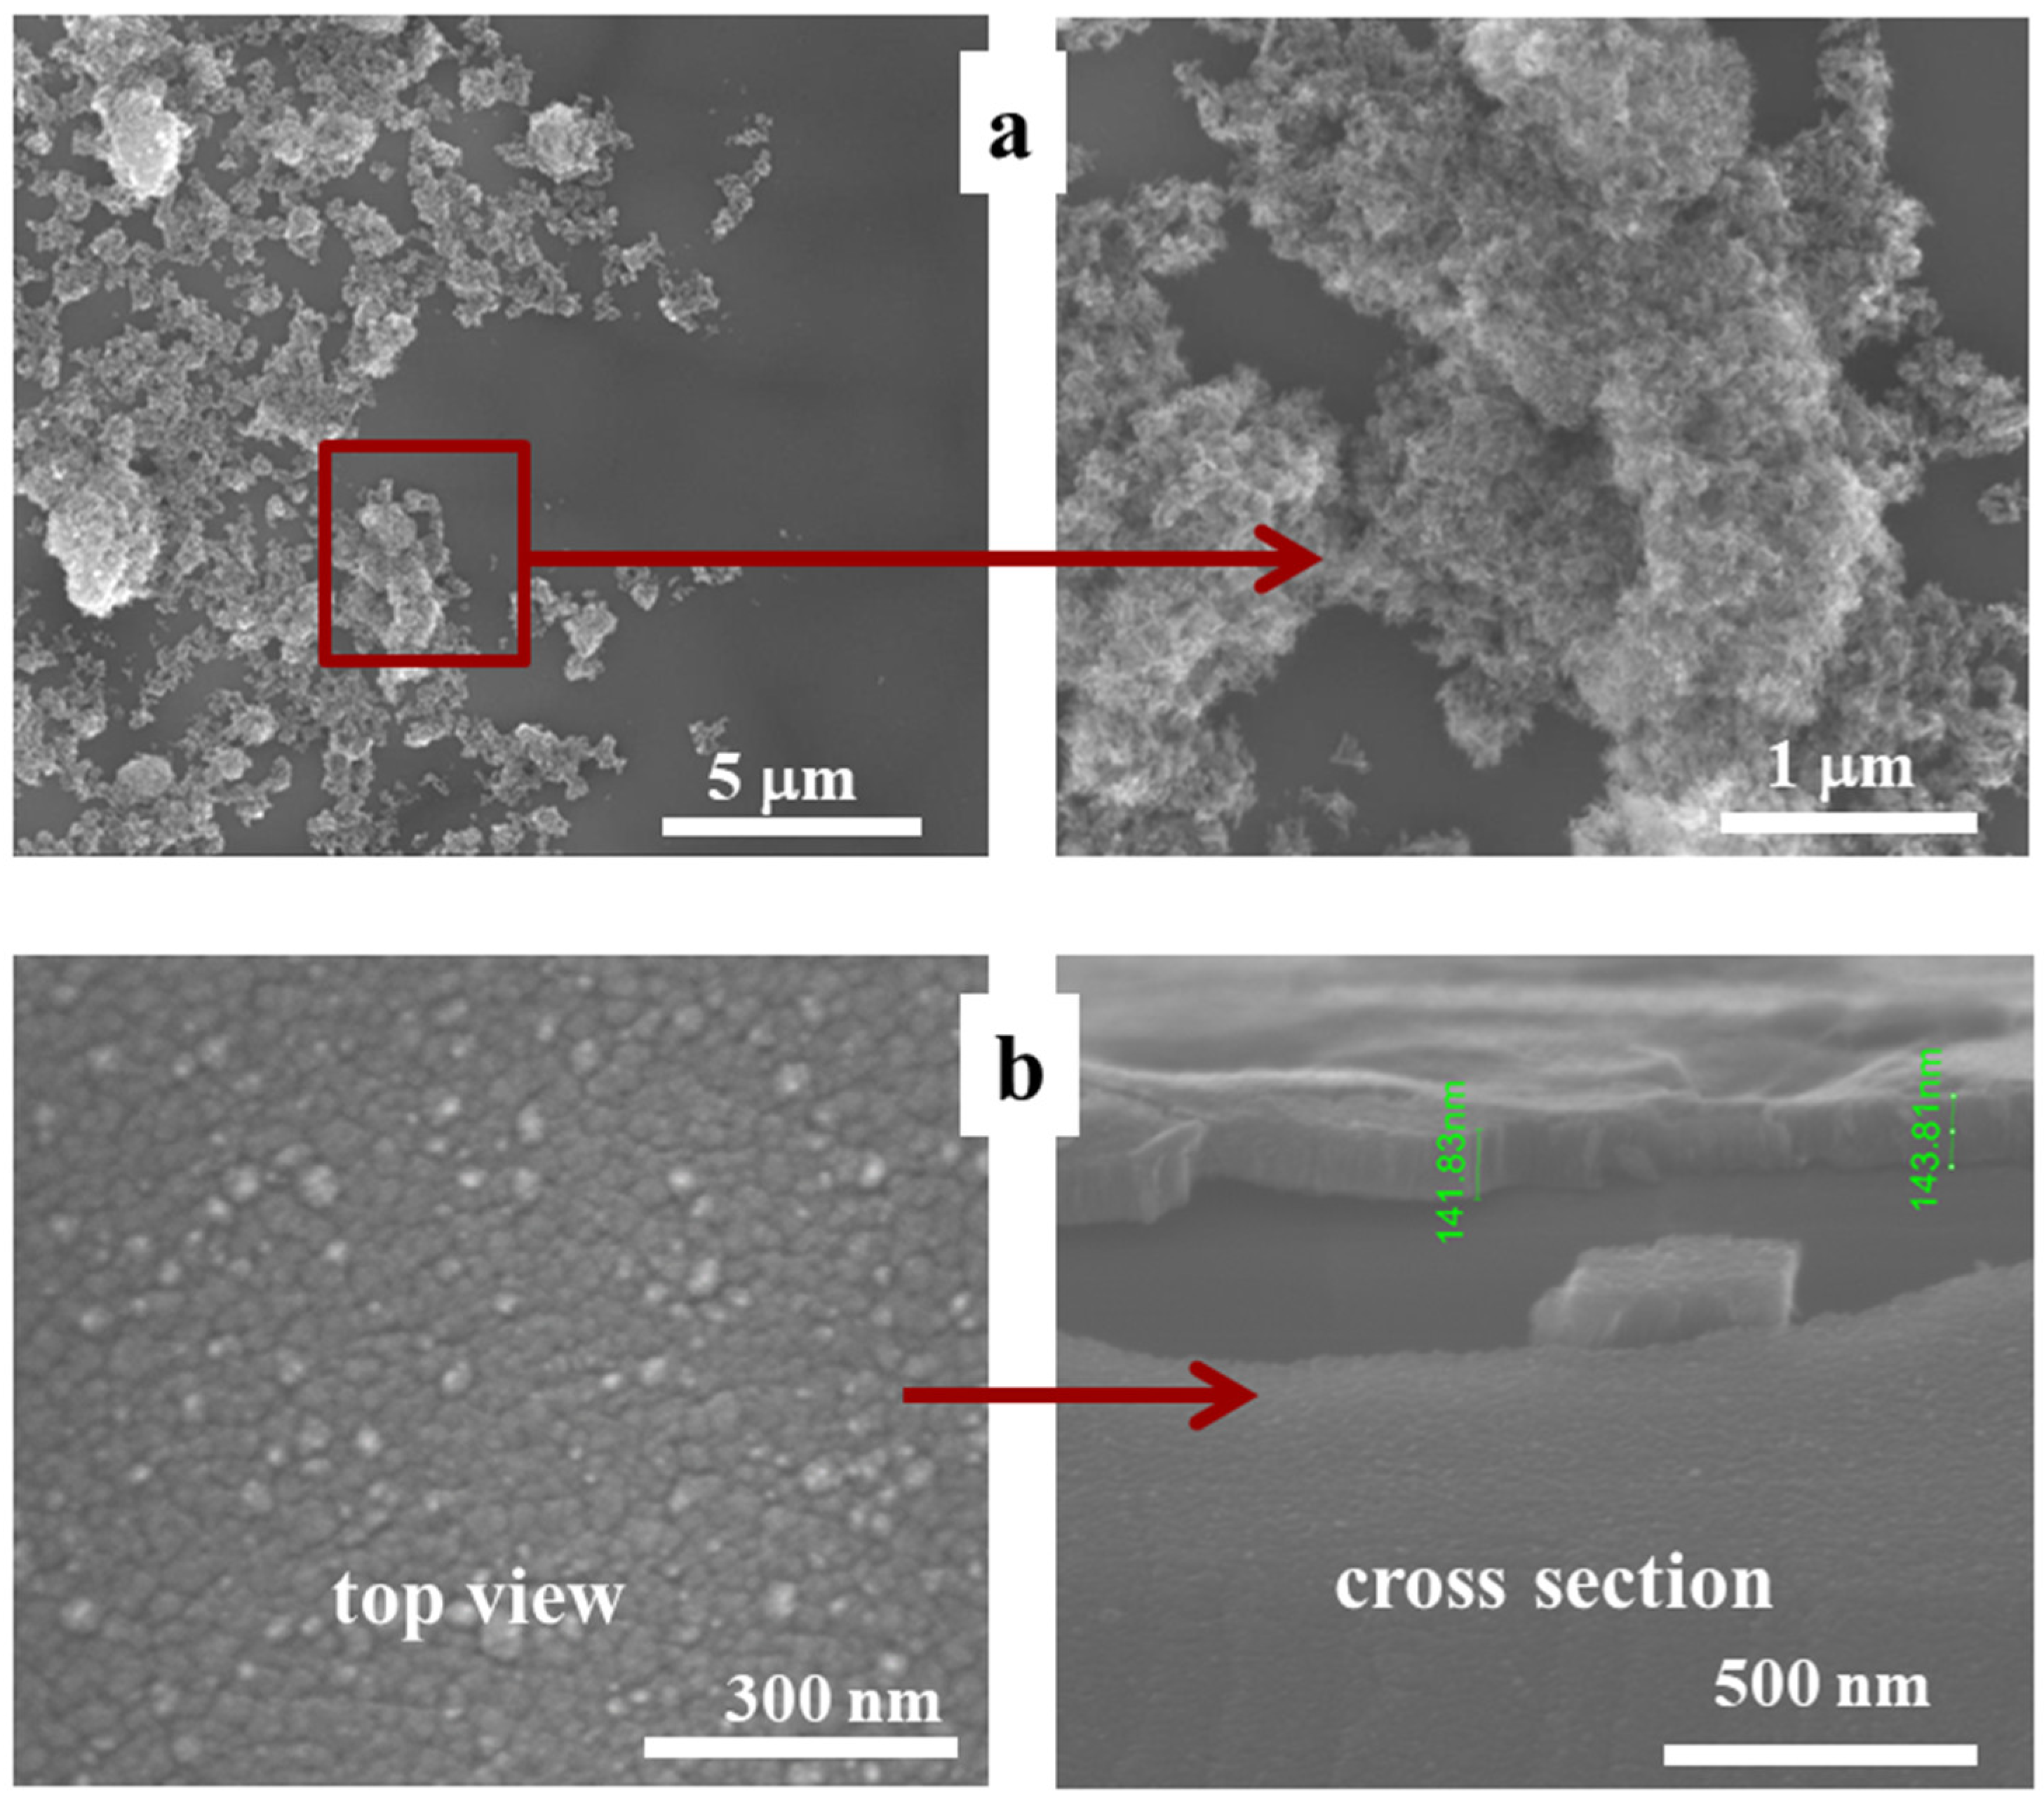
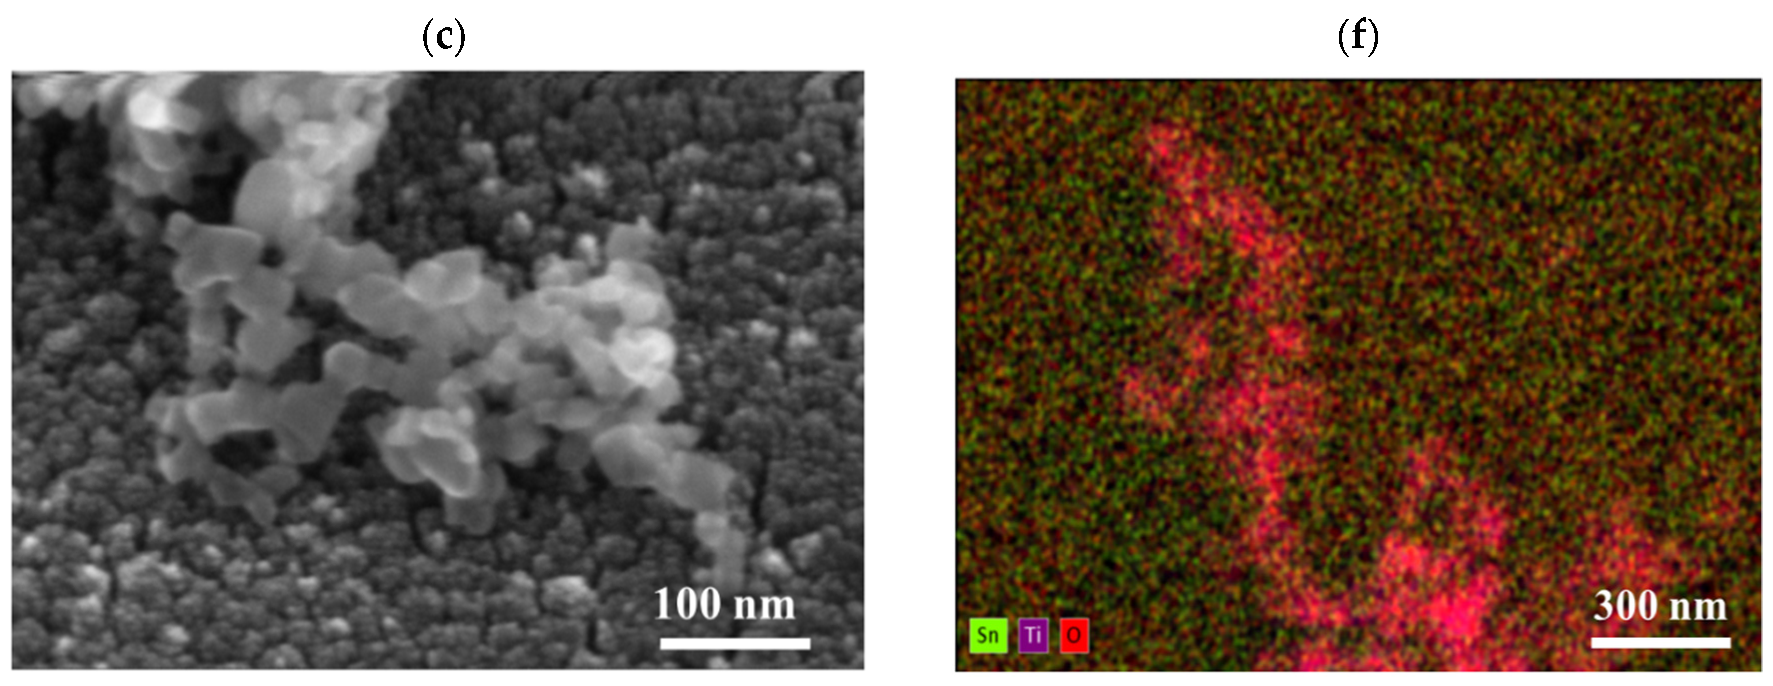
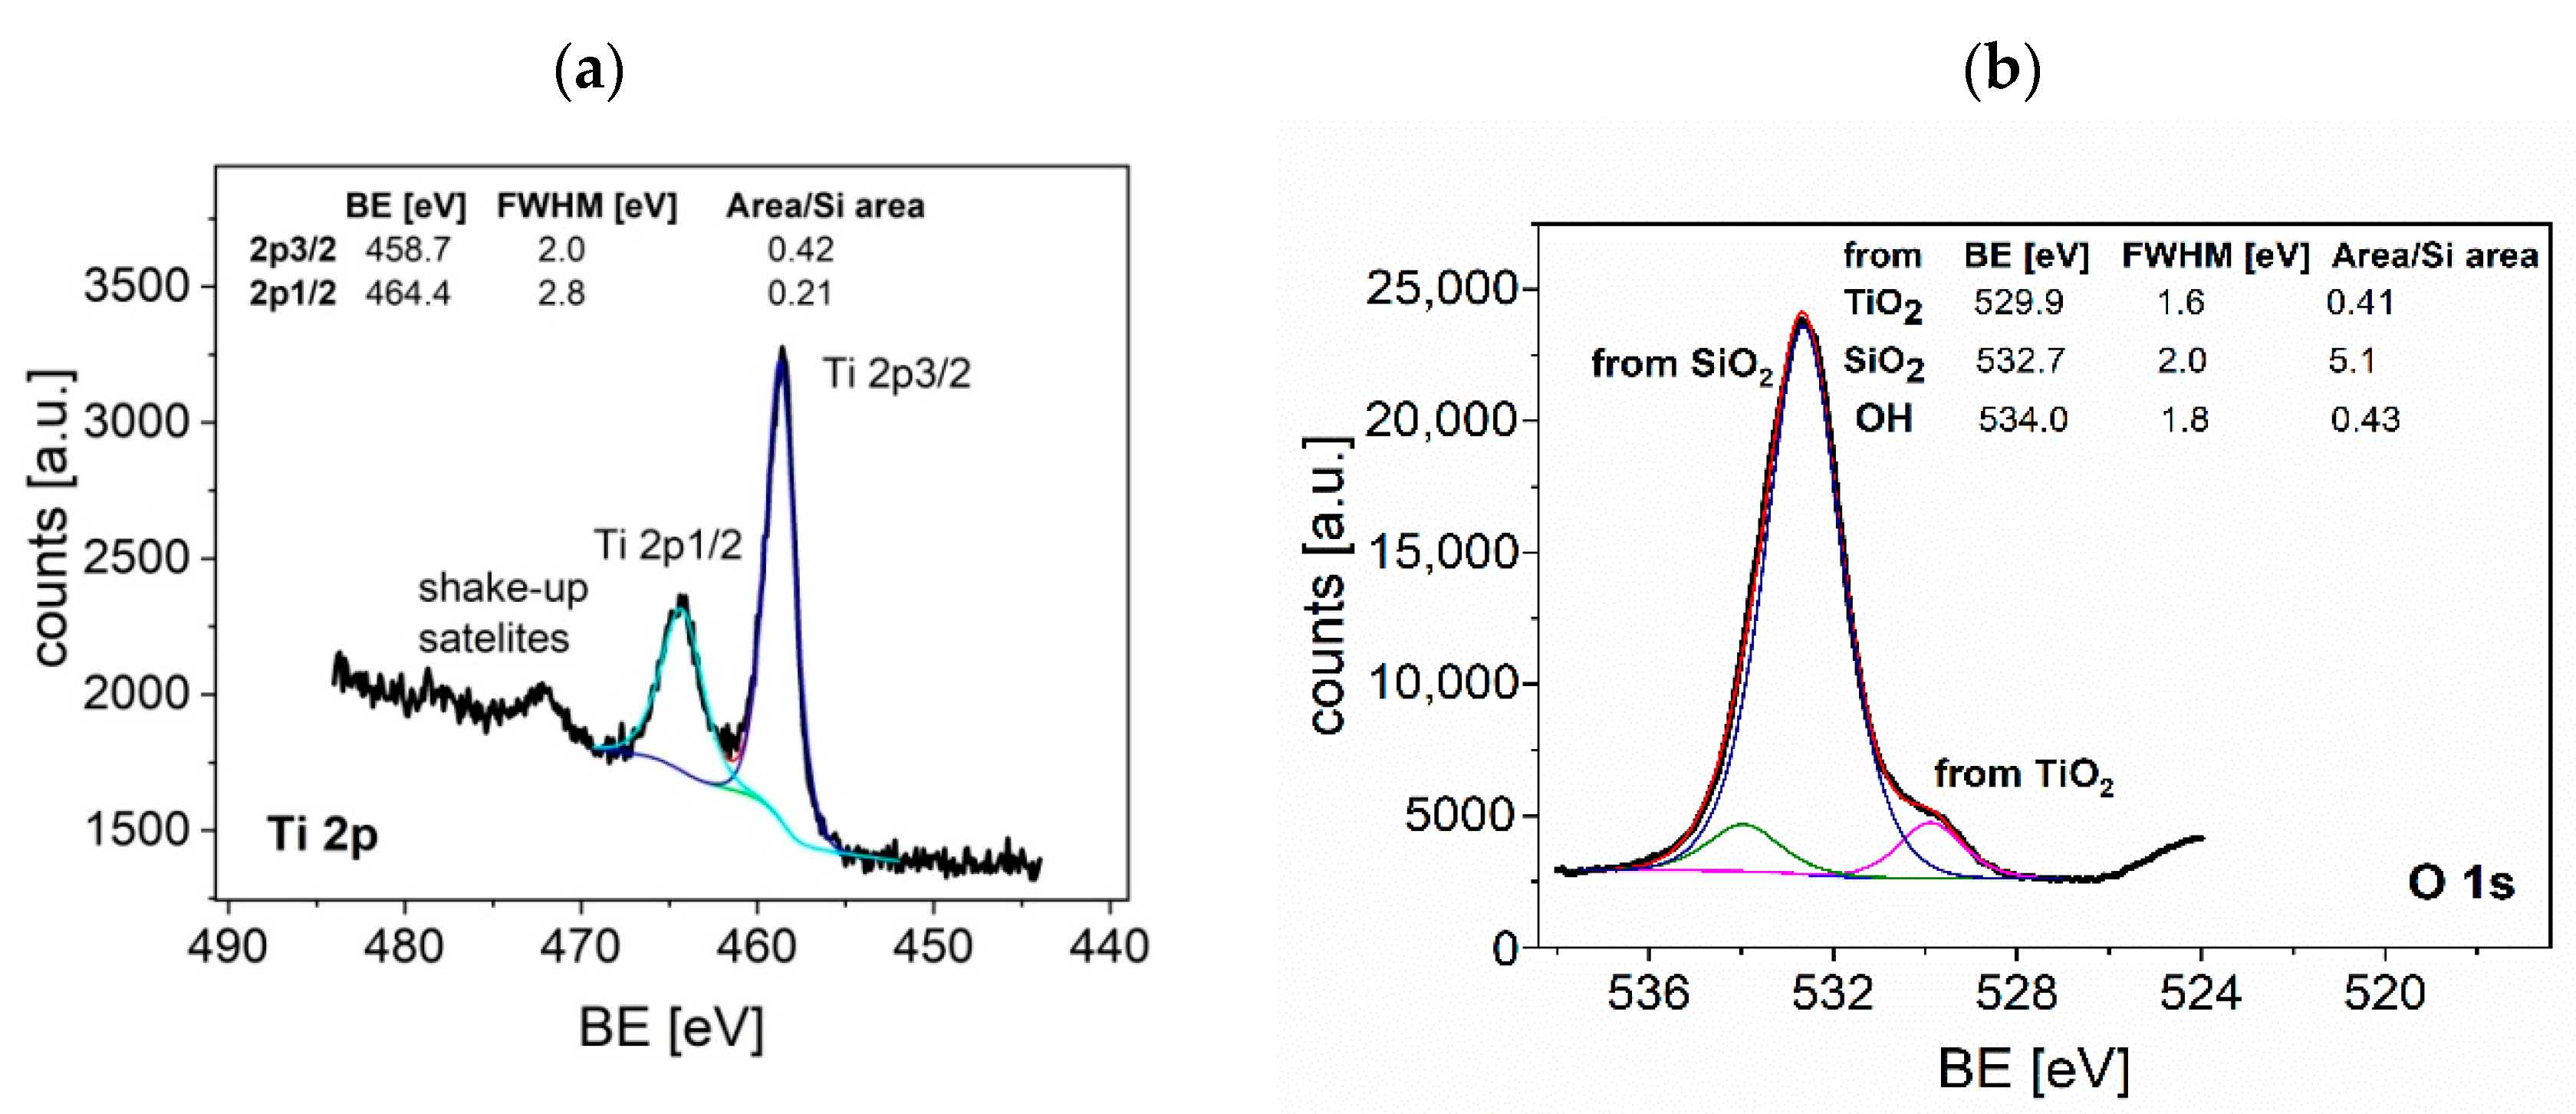
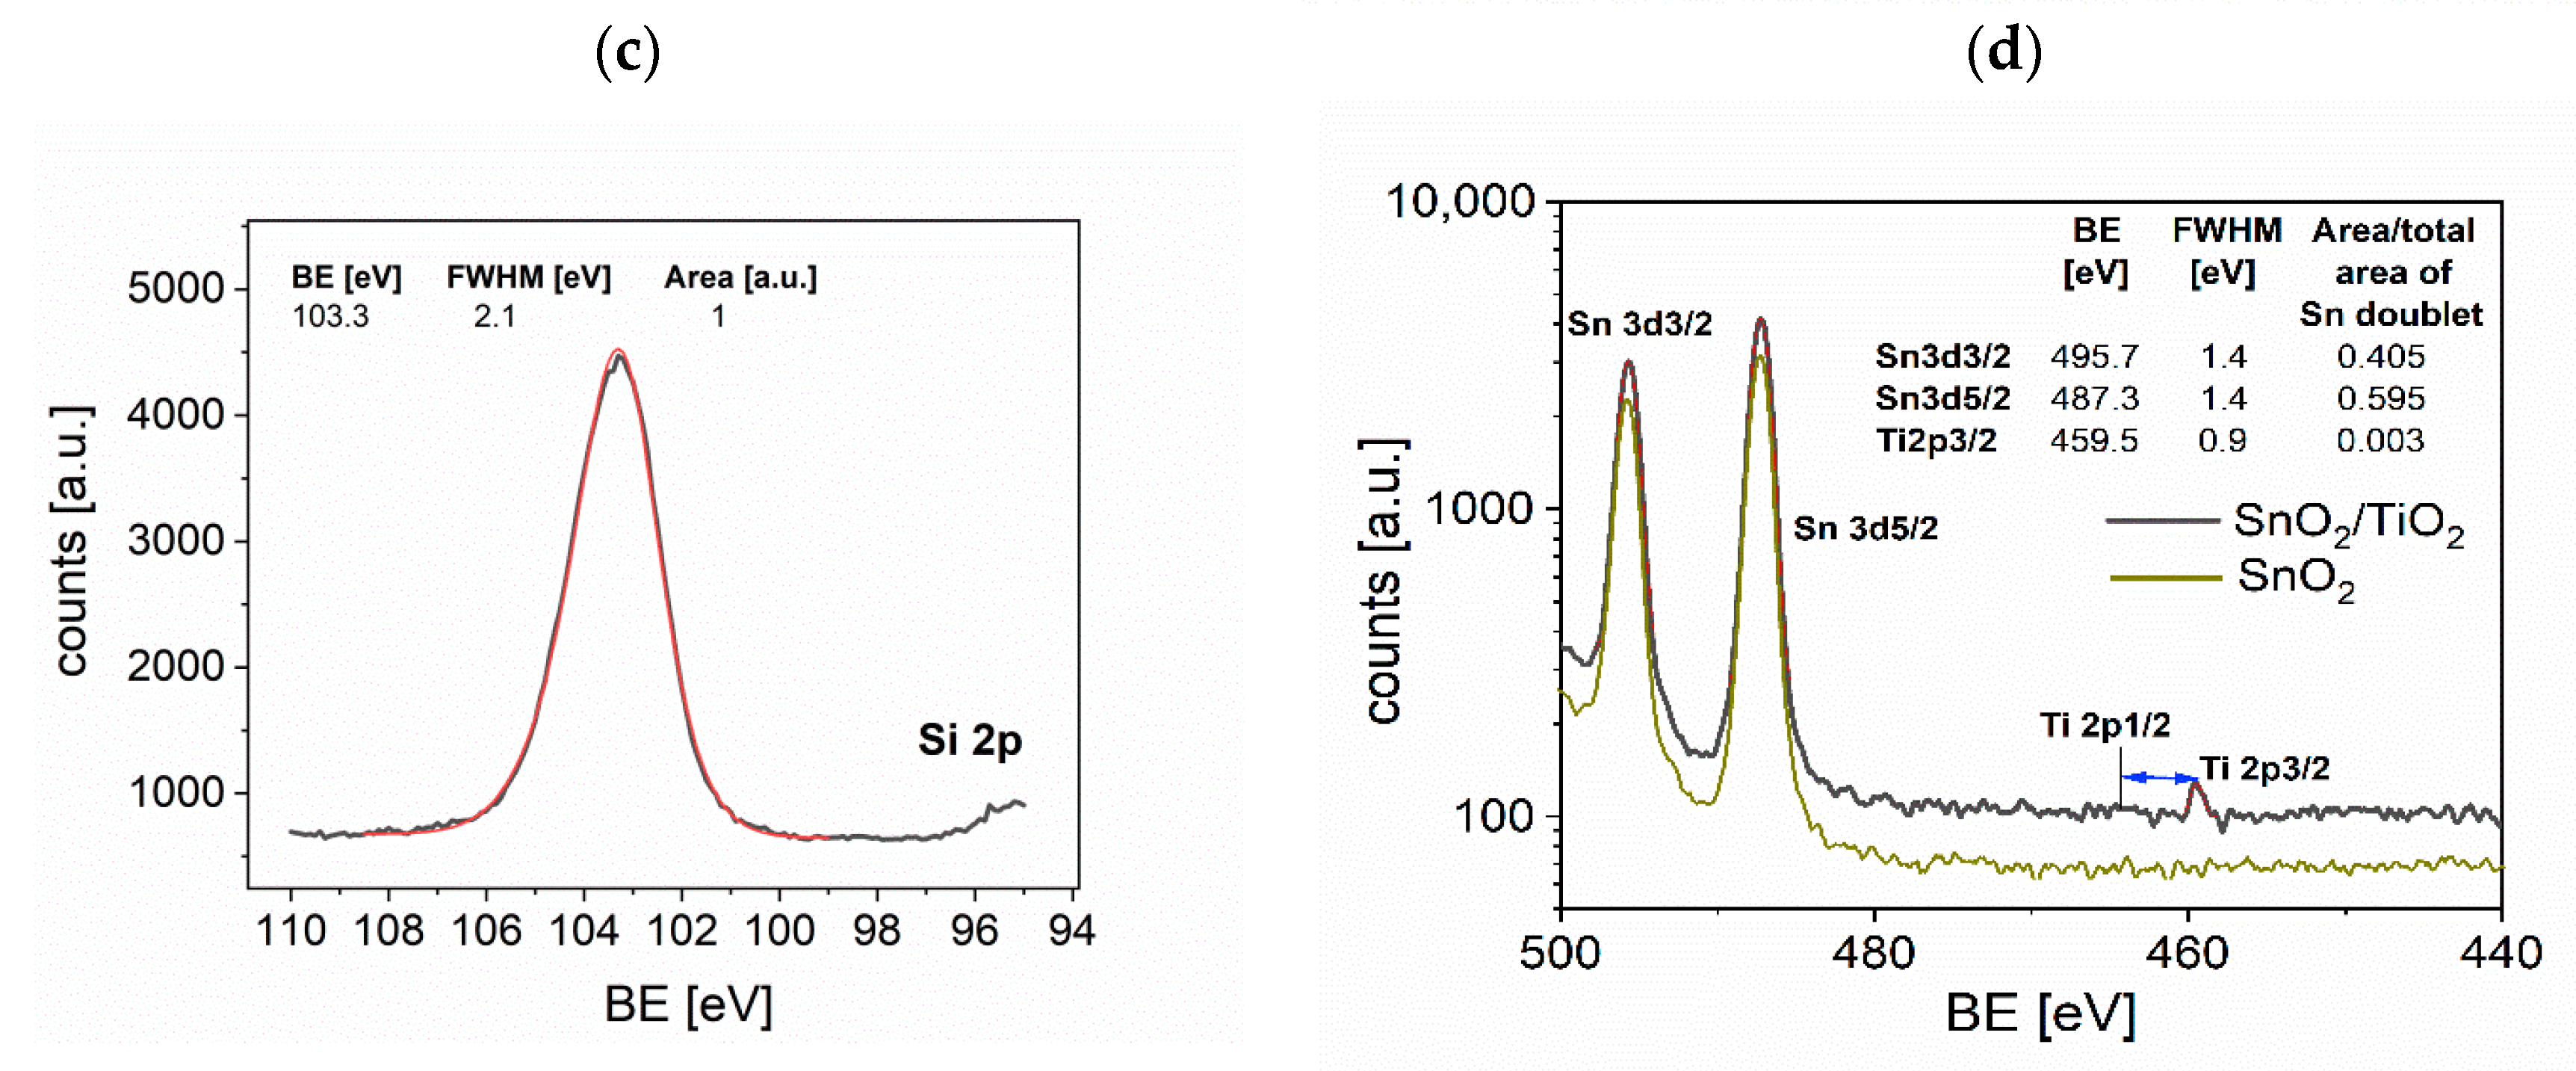
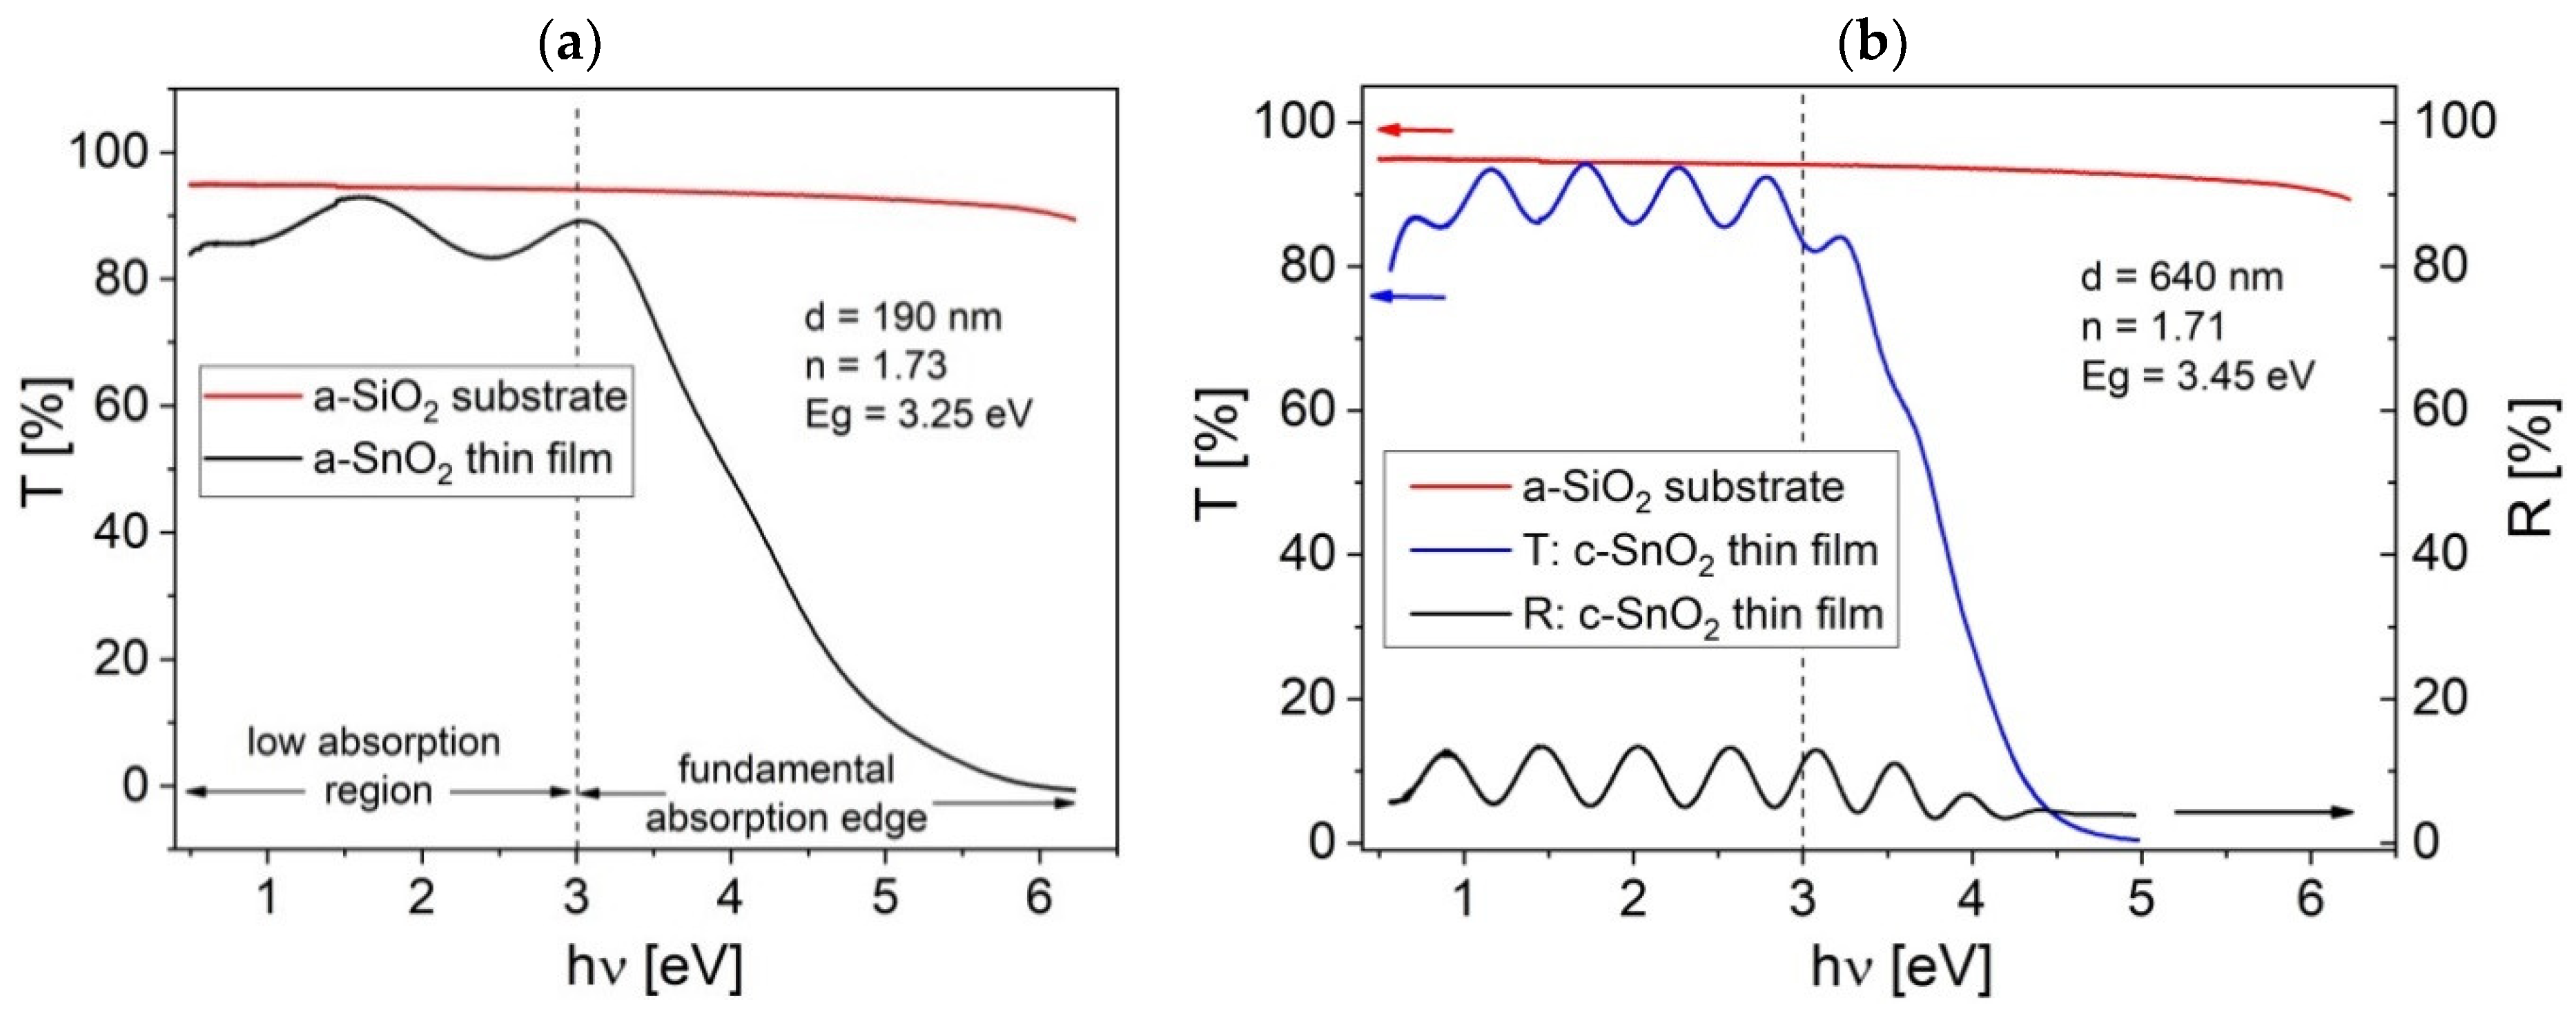
3.1. Film Characterization

Glancing incidence GID X-ray diffraction XRD patterns of the most representative samples prepared in this work are shown in Figure 5. Single SnO2 layers deposited by reactive magnetron sputtering on a-SiO2 substrate belong to two classes: weakly crystallized almost amorphous a-SnO2 and crystalline c-SnO2. This difference in the level of crystallization is due to the intentionally changed temperature and sputtering time. XRD pattern of SnO2/TiO2 bi-layer, composed of a-SnO2 thin film grown by magnetron sputtering with TiO2 deposited on top of it by the Langmuir–Blodgett method, displays no additional peaks due to TiO2 probably because of a small amount of this phase. Tetragonal tin dioxide cassiterite polymorphic form has been confirmed in c-SnO2 samples by identification of the most prominent X-ray diffraction lines of crystallographic planes of (110), (101) and (211) with the reference JCPDS data of the card no. 77-0452 (ICSD #039178).
The average crystallite size of c-SnO2 thin film was estimated from the Equation (1) as 14 nm. Very weak and wide (101) and (211) diffraction peaks in XRD patterns of a-SnO2 indicate that the crystallite size falls below 10 nm, thus the size effect in optical, electronic and sensory properties can be expected.
The morphology of TiO2 synthesized by L–B method directly on silicon substrate and that of a-SnO2 deposited by MS was investigated by SEM as shown in Figure 6. Figure 7 demonstrates SEM results for TiO2 L–B layer on a-SnO2 support. Top-view images reveal discontinuous layer composed of TiO2 agglomerates (Figure 6a and Figure 7c,d), which might result in an increased surface-to-volume ratio (Figure 7a), advantageous from the point of view of gas sensing. A similar morphology has been reported by Choudhary et al. [61] for ultrathin TiO2 layers grown by the same technique.
As far as the morphology of SnO2 thin films deposited by sputtering is concerned, it is typical to observe a columnar mode of growth [37]. The cross-sectional images presented in Figure 6b and Figure 7b reveal distinct columns of the diameter increasing in the direction towards the surface. The top view (Figure 6b) shows the relatively smooth surface of a-SnO2 with much bigger grains of TiO2 nanopowder deposited on top of a-SnO2 (Figure 7c,d). EDS mapping (Figure 7e,f) combined with the morphological image in Figure 7d confirms that the discontinuous form observed on the surface of a-SnO2 is composed of oxidized titanium.
Further proof of the stoichiometry of the layers deposited by the Langmuir–Blodgett technique has been given by X-ray photoelectron spectroscopy. The oxidation state of Ti ions at the surface of thin films obtained by the L–B method was established by XPS. The Ti2p and O1s spectra are presented in Figure 8a,b, respectively, and the Si peak coming from the substrate is shown in Figure 8c. Moreover, a doublet of Sn 3d5/2 and Sn 3d3/2 peaks from the a-SnO2 layer below can be seen in Figure 8d, supporting the SEM observation of discontinuous growth of TiO2. The total area under the Si peak was used as a reference to calculate the relative area of Ti and O peaks. XPS spectra reveal two Ti peaks: Ti2p3/2 and Ti2p1/2 (at the position 458.7 eV and 464.4 eV, respectively) associated with spin-orbit splitting and assigned to Ti4+. Binding energies BE: 487.3 eV and 495.7 eV corresponding to Sn3d5/2 and Sn3d3/2 XPS peaks, respectively, indicate the presence of Sn4+. Recorded O1s XPS peaks are characteristic of the configuration: Ti-O and Si-O (coming from the substrate) with the binding energy 529.9 eV and 532.7 eV, respectively. The O1s peak at 534.0 eV peak can be attributed to –OH groups bounded to the surface of the sample. The O/Ti atomic ratio (calculated by taking into account the respective relative sensitivity factors [62] for the Ti2p3/2 peak and O1s peak) is equal to 2.63. The excess of oxygen indicates that the surface of TiO2 is over-oxidized as a consequence of adsorption of oxygen, which is important in the first step of gas sensing process.
Figure 9a,b present the transmittance and reflectance spectra of a-SnO2 and c-SnO2 thin films. The interference fringes of transmittance spectrum over low absorption region enabled us to determine the refractive index, n, using the envelope method proposed by Manifacier et al. [63]. Knowing the wavelength positions of extrema in the transmittance spectrum and analysing the amplitude of transmittance coefficient, it is possible to find the film thickness. For a-SnO2 sample, refractive index n = 1.73 at wavelength λ = 700 nm and the film thickness d = 190 nm were found.
For c-SnO2 film, the transmittance spectrum is richer in extrema because of an increased film thickness d = 640 nm. Moreover, the extrema of the reflectance spectra extend over a wider spectral range than those corresponding to the transmittance. The refractive indices for a-SnO2 and c-SnO2 thin films are very close, which indicates a similar film density. However, both refractive indices are lower than those usually reported for SnO2 (n > 2.0) [64]. This may have been caused by the specific columnar growth observed in the SEM cross-sectional images (Figure 6b and Figure 7b). The voids between the columns are probably filled with adsorbed oxygen and water molecules [64].

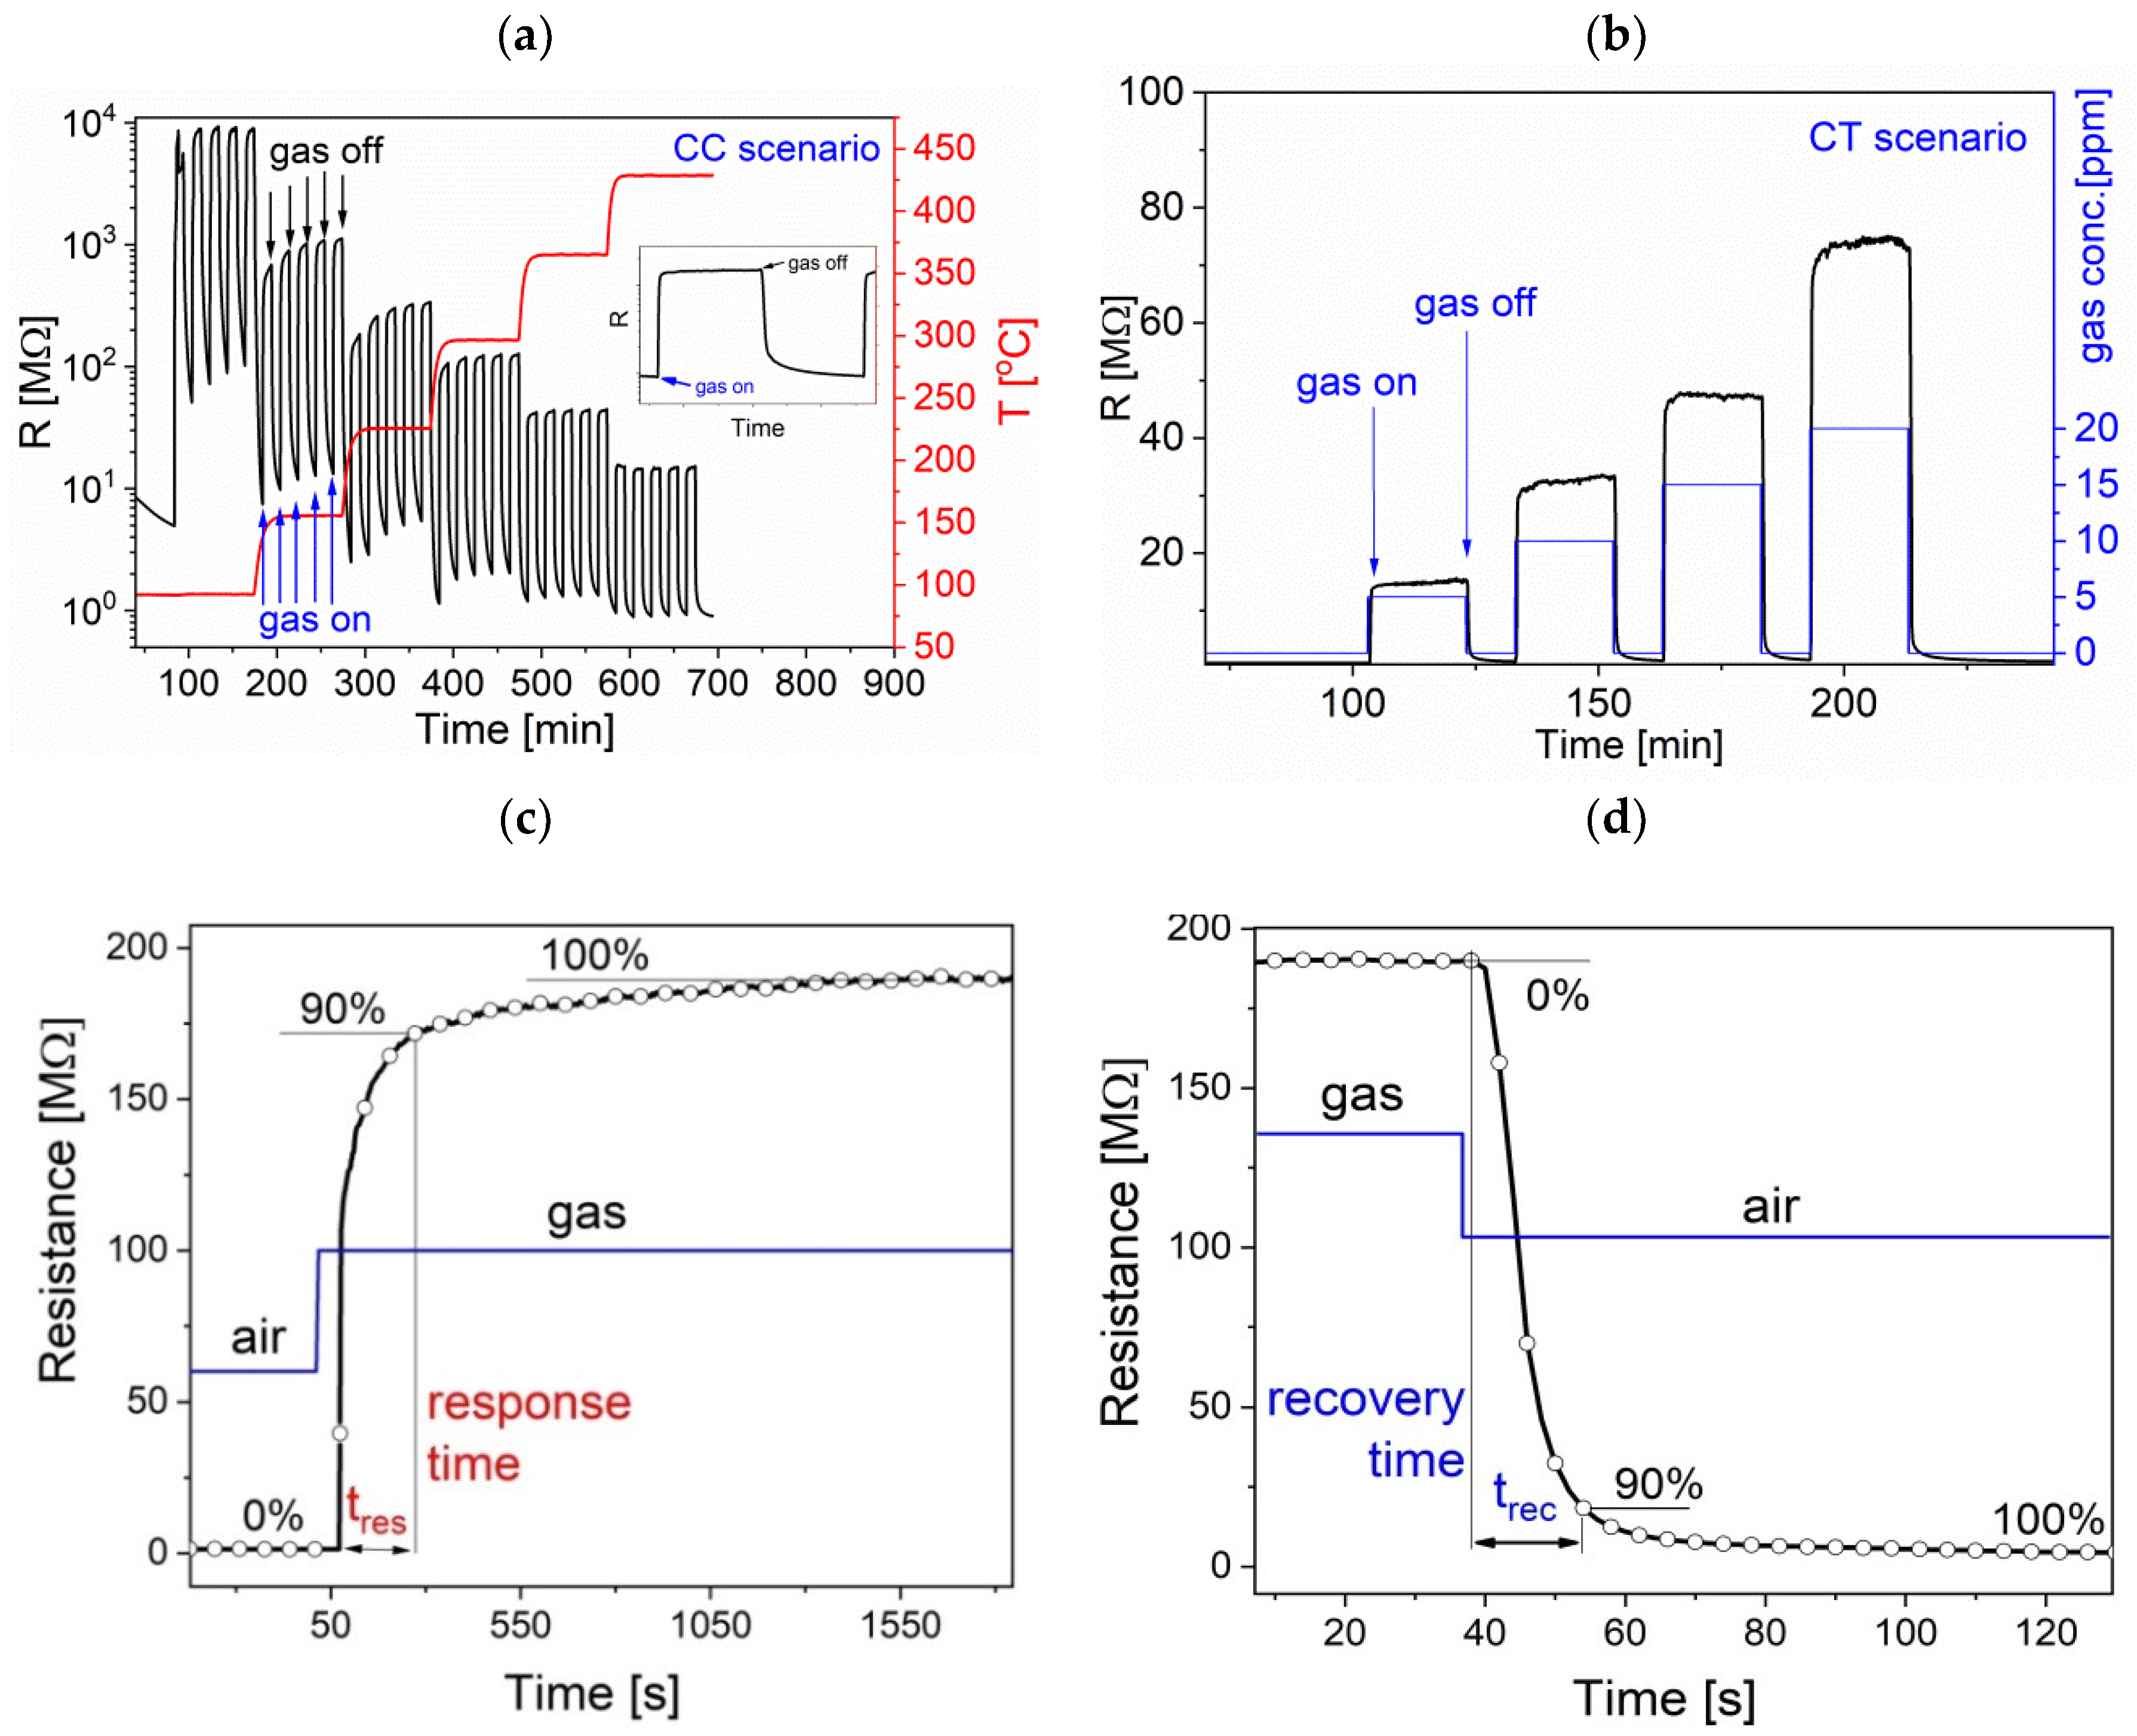
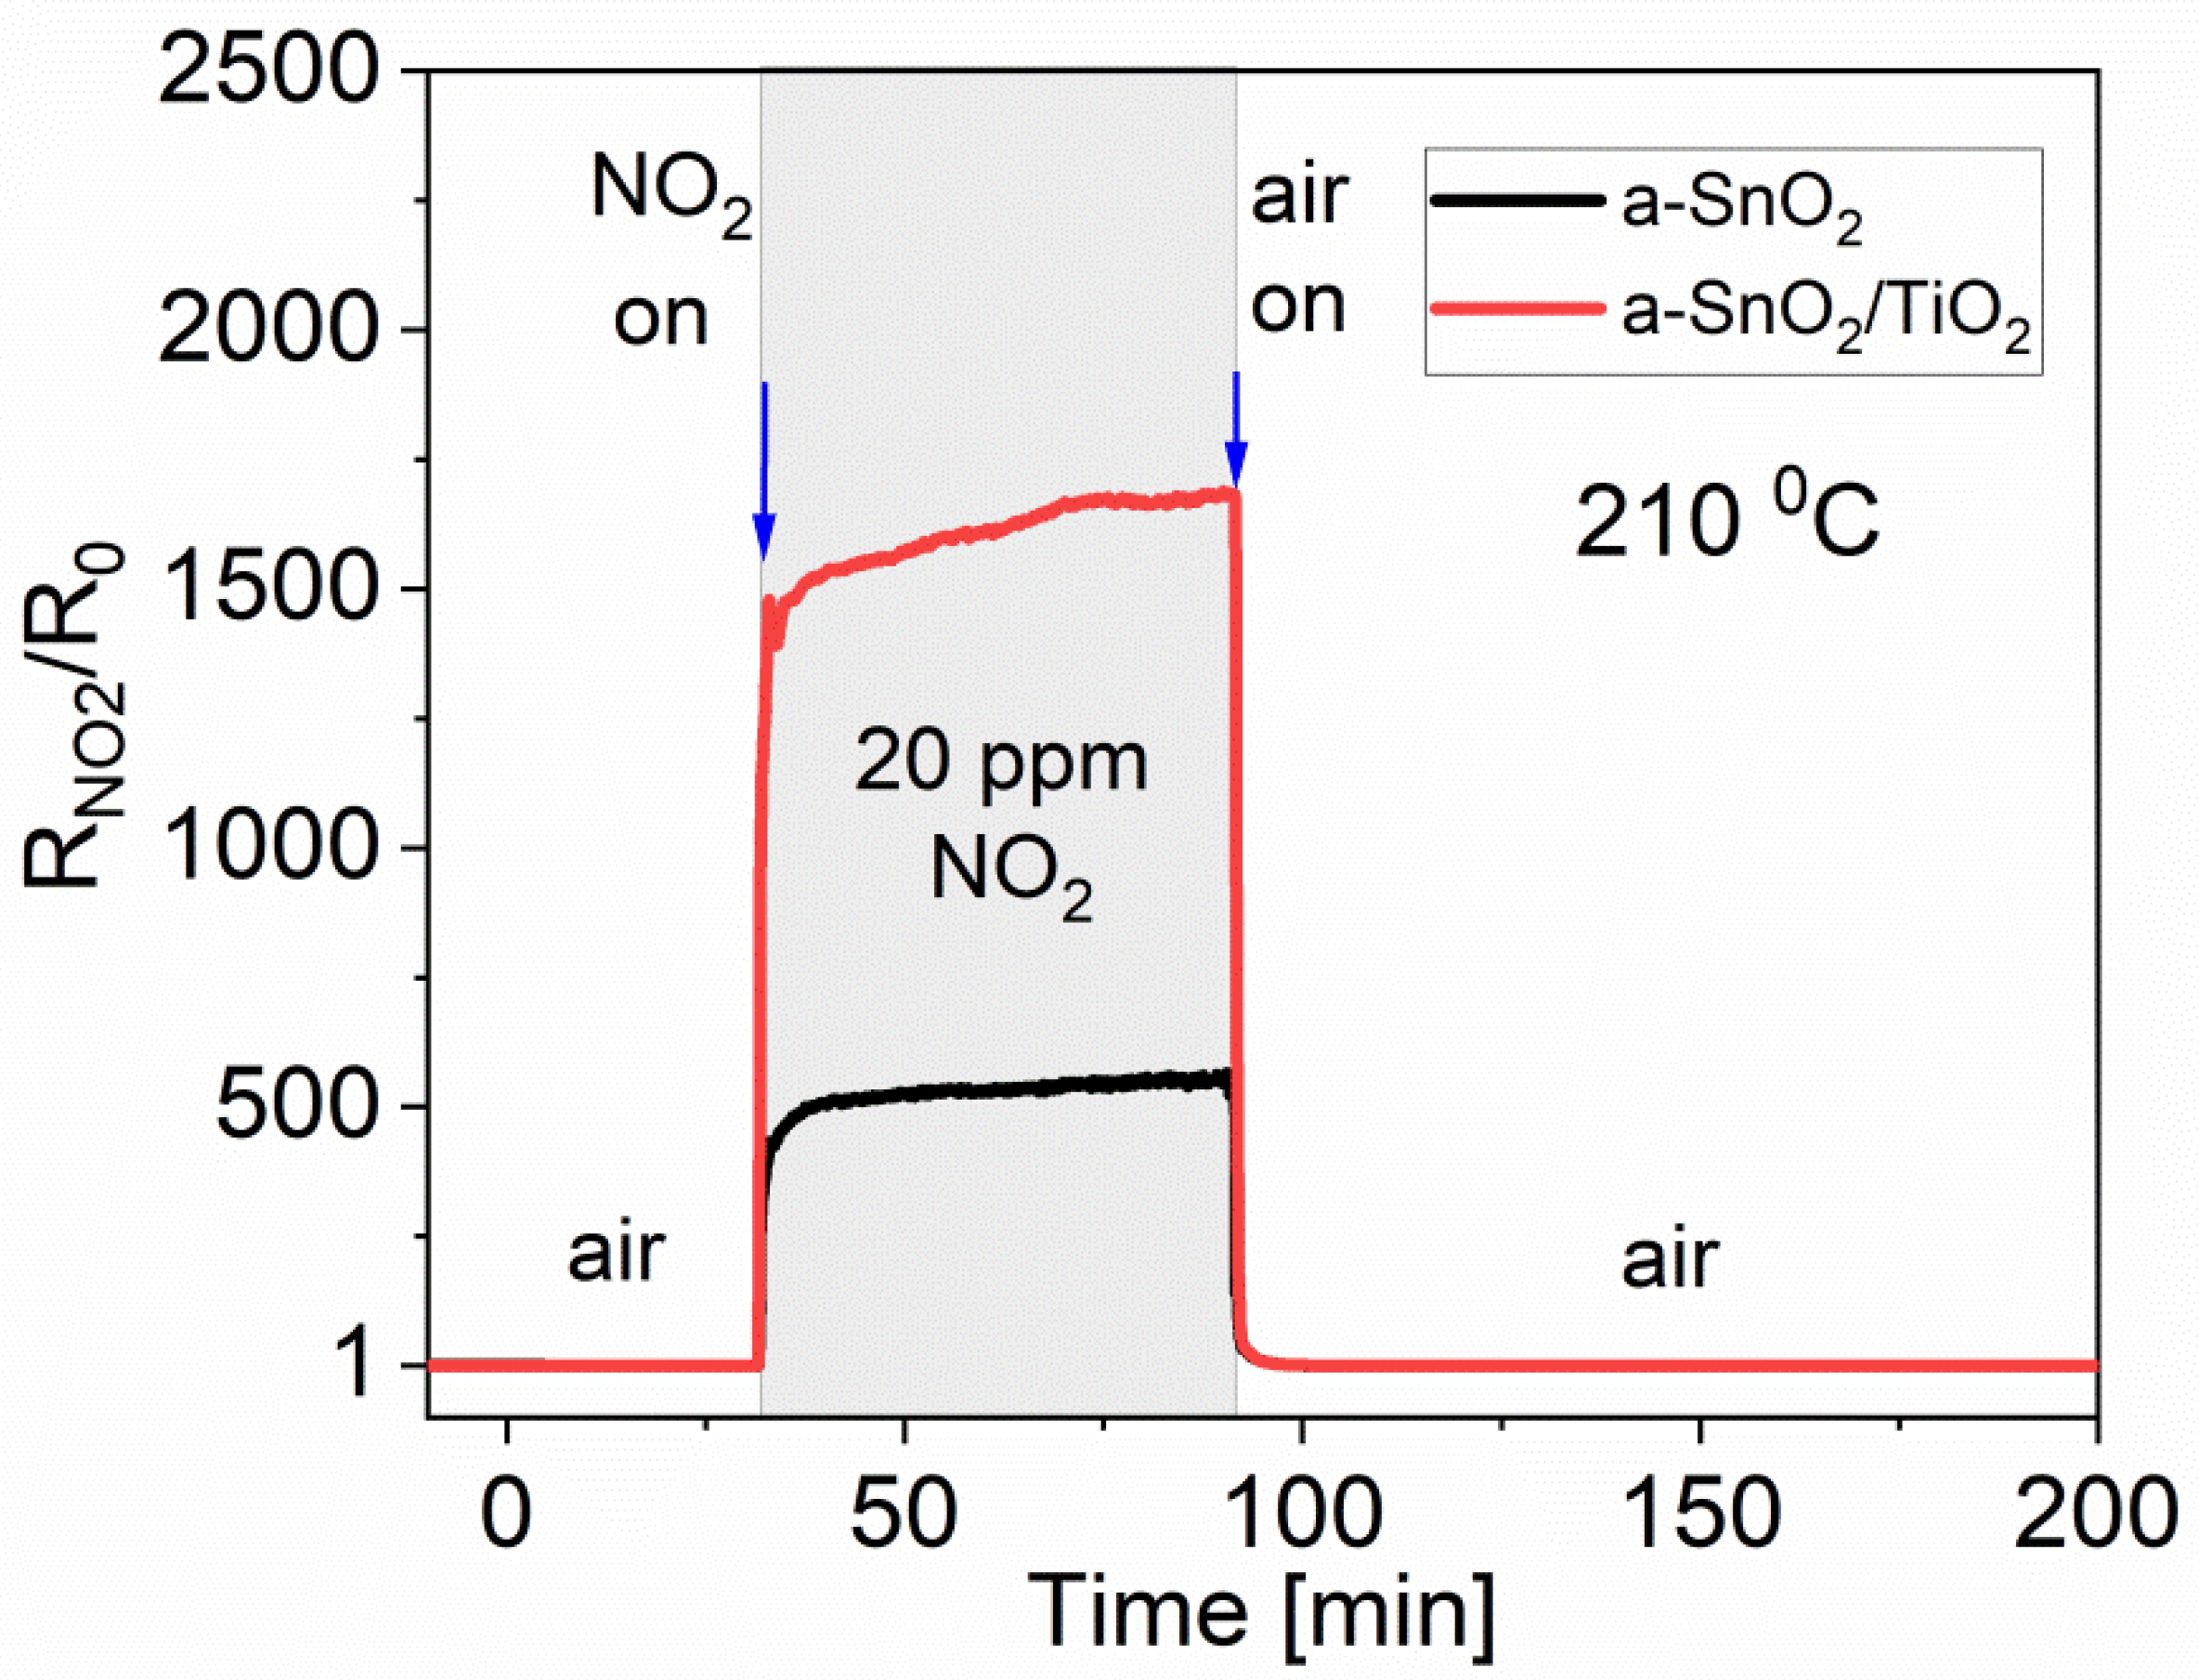
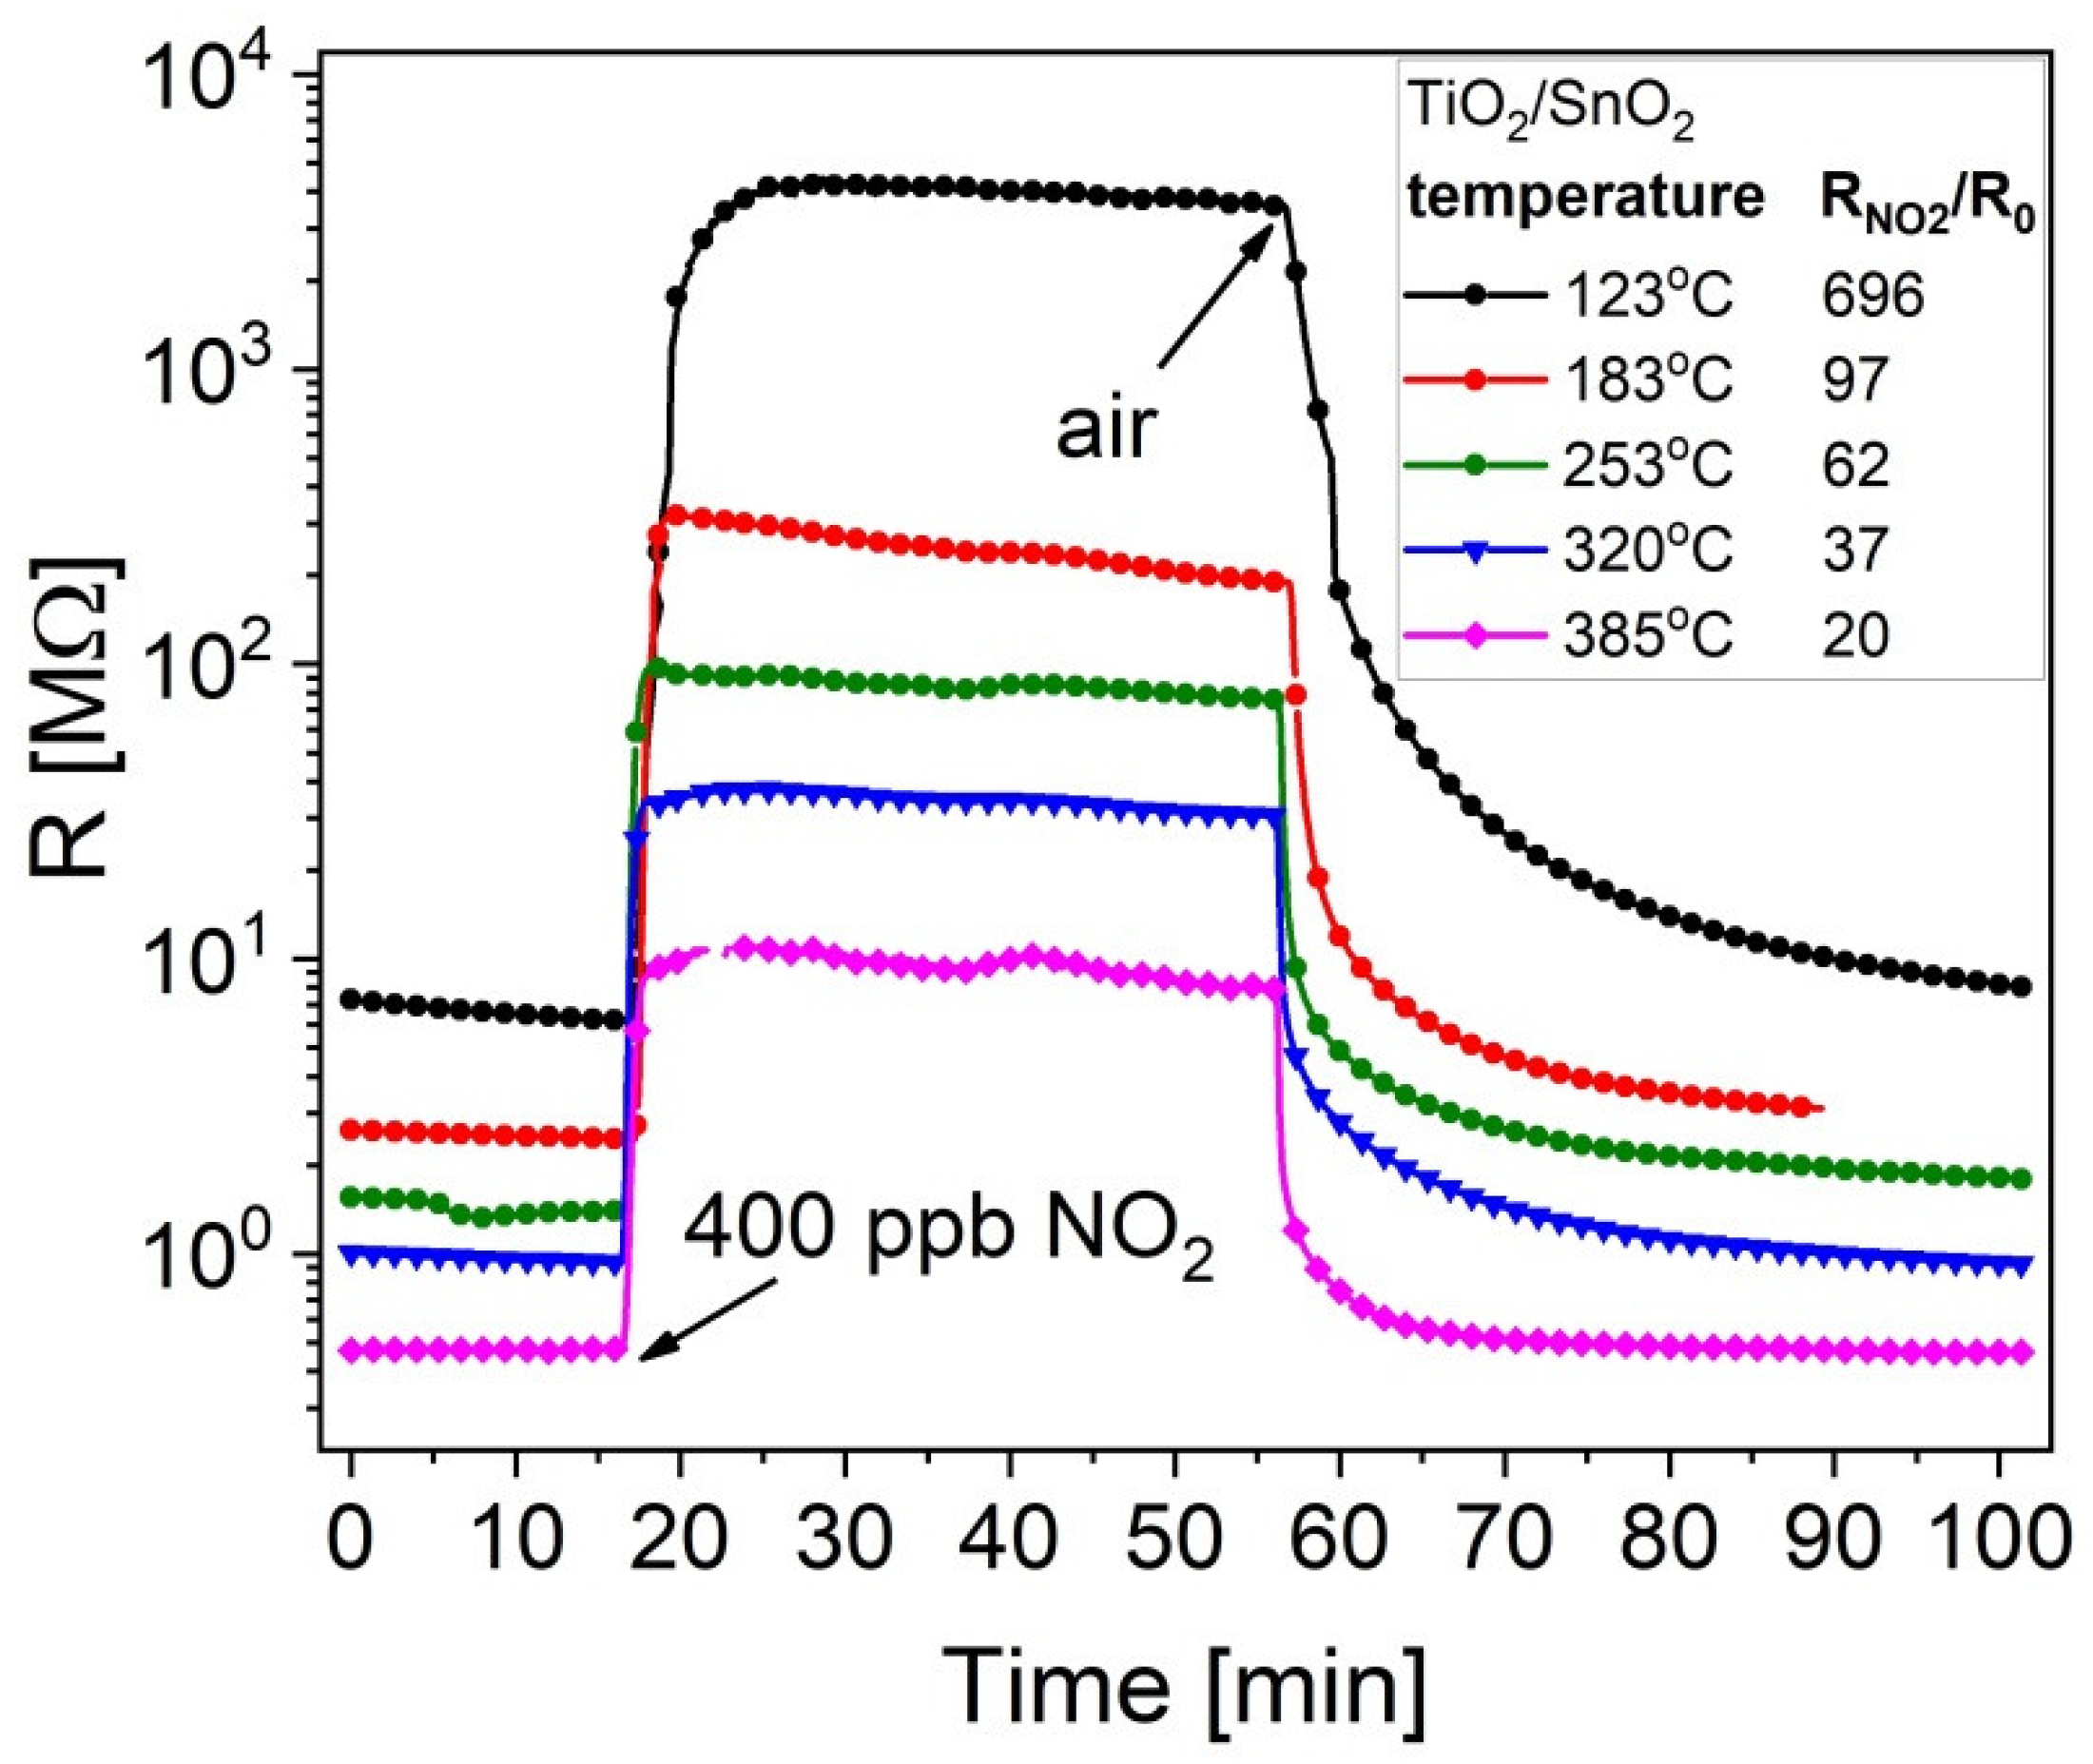
3.2. Gas Sensor Measurements

Gas sensor studies were carried out by following the procedure described in Section 2.2.
As one can see in Figure 10, both a-SnO2 and SnO2/TiO2 thin film sensors exhibit remarkable RNO2/R0 responses to 20 ppm NO2 at 210 °C of about 500 and 1650, for pure a-SnO2, and SnO2/TiO2 thin films, respectively. Deposition of TiO2 onto SnO2 improves not only the absolute value of the response but its kinetics as well. Moreover, SnO2/TiO2 thin films reveal lower resistance in air R0, probably due to the injection of electrons from TiO2 to SnO2, which suggests formation of n-n heterojunction.
The response, RNO2/R0, increases systematically when the working temperature decreases, as shown in Figure 11. This indicates a possible interference due to the physisorption of water molecules, which somehow helps in the detection of the oxidizing gas.
The same tendency is preserved for lower (400 ppb) concentration of NO2 in the case of TiO2/SnO2 (Figure 12). At 138 °C, the response of a-SnO2 to 20 ppm NO2 reaches a very high value of about 3000 (Figure 11) while at 123 °C, the response of SnO2/TiO2 to 400 ppb NO2 is as high as 700 (Figure 12). The electrical resistance R0 in air decreases systematically with temperature, which is typical for semiconducting behaviour.
Over the temperature range extending from 200 to 350 °C, SnO2/TiO2 thin film exhibits a higher response than that of a-SnO2. As can be seen in Figure 11, within this temperature range, the response RNO2/R0 is 2.5 to 3 times higher for SnO2/TiO2 compared with that of a-SnO2. It can be seen that amorphous SnO2 demonstrates much better sensing properties than crystalline SnO2, probably due to the well known size effect [9] but at the same time, one cannot exclude the influence of film thickness on the gas response.
Figure 13 illustrates the responses of SnO2/TiO2 thin films as a function of NO2 concentration down to 200 ppb at constant temperatures chosen within the range extending from 120 °C to 400 °C. Bi-layers of SnO2/TiO2 are sensitive even to 200 ppb NO2 with the responses of 390@123 °C and 6.6@385 °C.
Based on the results discussed above, the analysis of kinetics of the response and the signal recovery was performed. As Table 2 shows, both response tresp and recovery trec times gradually decrease with the increasing temperature and gas concentration. At all operating temperatures above 150 °C, tresp is rather small and equals to about 4–12 s. The SnO2/TiO2 sensor recovers relatively quickly, trec amounts to 9–28 s above 150 °C. Such a fast reaction to NO2 and recovery in air are typical for low amounts of NO2 and suggest a dominant role of the surface adsorption processes due to the small film thickness.
Small values of tresp and trec along with very good responses, observed at very low NO2 concentrations, make such a sensor very promising for environmental applications.
The effects of interfering agents, such as a reducing gas and humidity, were taken into account, as demonstrated in Figure 14 and Figure 15, respectively.
The responses of both a-SnO2 and SnO2/TiO2 to the reducing gas H2 are much smaller than those to NO2. The highest response to H2 was observed at 350–400 °C, but even at 314 ppm the SH2 = 3.9 for a-SnO2 layer and SH2 = 4.5 for SnO2/TiO2 bi-layer. The decoration of SnO2 with TiO2 thin film improved the response to H2 by only 18%.
As mentioned in Section 2.2, all the gas sensing measurements were performed at relative humidity RH = 50%. This level of humidity is treated as ‘normal’ because the sensors usually work under such environmental conditions. In order to investigate the influence of humidity on the sensing characteristics, a-SnO2 sample was tested also at lower RH values, as shown in Figure 15 and Table 3. One can conclude that a higher humidity improves the response to NO2. The effect is the quite pronounced at lower operating temperature of 150 °C. The humidity interference is negligible at higher operating temperatures, which suggests a predominant role of the physisorption of molecular water over the chemisorption of OH groups [16,65].

4. Discussion

SnO2 and TiO2 are both n-type metal oxide semiconductors. Their sensing mechanism is controlled by the surface phenomena and their resistance changes upon exposure to different gas atmospheres. In the first step of gas sensing, it is usually assumed that oxygen is adsorbed in different atomic or molecular forms, i.e., O2−, O, and O2 [66,67]. Such behaviour can be expressed by the following reactions (2–5):
O2(gas) → O2(ads)
O2(ads) + e → O2(ads)
O2(ads) + e → 2O(ads)
O(ads) + e → O2−(ads)
The ionized oxygen O2 species dominate at temperatures below 150 °C [16], while for temperatures above 150 °C, the predominant oxygen forms are O and O2−. When the sensor is exposed to pure air atmosphere at a constant temperature, the oxygen molecules adsorb at the sensing material surface, and capture free electrons from the conduction band. As a result, the sensor conductance decreases. After some time, an equilibrium is reached and the sensor resistance stabilizes. After exposure to NO2 oxidizing gas, the effect of electron capturing proceeds further (reaction 6). Moreover, NO2 ions can be created in reaction with previously adsorbed oxygen ions O2−(ads) (reaction 7). Reactions 6 and 7 cause a reduction of the sensor conductance. At the same time, a reverse reaction 8 with NO2(ads) losing an electron may take place.
NO2 + e → NO2(ads)
NO2 + O2−(ads) + 2e →NO2(ads) + 2O(ads)
NO2(ads) + O(ads) → NO2(gas) + O2−(ads)
It should be stressed that reaction with NO2 can take place (reaction 6) without the presence of air (and therefore oxygen) because NO2 itself contains oxygen and forms an oxidizing agent. Reaction to NO2 in an oxygen-free atmosphere is therefore stronger than in an oxygen-rich one, because the oxygen molecules adsorbing at the surface reduce the number of free sites where NO2 adsorption can occur.
Tin dioxide, SnO2 has been successfully applied to NO2 detection, as can be concluded based on the publications listed in Table 1. Santos et al. [18] demonstrated the selective NO2 detection of low concentrations down to 100 ppb by thin films of SnO2 at 200 °C. The technology of SnO2 affects its morphology, which, as a consequence, influences the gas response and its kinetics. The examples of different methods of SnO2 synthesis—sol gel [19], chemical spray deposition [24], chemical vapor deposition [25] and vapor phase deposition [11]—were given. Modification of SnO2 by other metal oxides such as ZnO, WO3, and TiO2 was demonstrated as an efficient means to enhance the sensing performance. A very high response (as high as 12800) to 5 ppm NO2 at relatively low temperature of 150 °C was reported by Sukunta et al. [17] for heterostructures of SnO2 nanoparticles-WO3 nanotubes. A specific morphology providing well developed surface is required for an improved gas sensing response. It is believed that the higher surface-to-volume ratio of the sensing material results in an increased density of active centers for chemisorption. Sharma et al. [23] published the results of extended studies on gas sensing with various structures: WO3/SnO2, TeO2/SnO2, CuO/SnO2, ZnO/SnO2 among which one can find TiO2 nano-thin micro-clusters loaded over SnO2 that manifested a relatively high response of 825 to 10 ppm NO2 at a low temperature of 90 °C.
The Langmuir–Blodgett technique is usually applied to form monolayers of amphiphilic molecules. Therefore, in attempts to use this method in gas-sensing applications, organic compounds such as porphyrin [68,69], benzenedicarboxylic acids [70], and polypyrrole [71] have been most frequently employed. Formation of TiO2 or SnO2 thin films is often associated with using precursors of metal oxides, e.g., titanium alkoxides [72], polianiline-TiO2 [73] or complexes of metal salts of fatty acid or amines, e.g., ODA-stannate complexes [74], or ODA-KTiO2 [75]. Obtained films are then subject to a thermal decomposition which removes the organic part. Another method is to deposit organic amphiphilic particles with a chemical affinity to TiO2 or SnO2 derivatives. Then, the previously obtained layer is immersed in the proper solution (e.g., potassium titanium oxalate, PTO [76,77] or SnO2 derivatives) and thermally treated. There are few reports on using the L–B method to form thin films directly from crystallites of metal oxides [61,78,79].
Choudhary et al. [61] demonstrated the well developed surface morphology of TiO2 layers grown using the Langmuir–Blodgett technique. The aggregation of nanoparticles and surface coverage can be tuned by the target surface pressure. It has been claimed [61] that discontinuous TiO2 layers such as those observed in the course of our studies contain large amount of defects that favourably affect the sensor response. The same group from Bhabha Atomic Research Center, Mumbai, India published a series of papers [77,79] on SnO2 and SnO2-TiO2 thin films deposited by L–B method for gas sensing and photoelectrochemical application.
It is well known [65] that as the gas sensors usually operate in the atmosphere containing water, two processes can be responsible for H2O surface adsorption:
  • physisorption of water in its molecular form that occurs at lower temperatures
  • chemisorption of OH taking place at higher temperatures above 300 °C
However, if both oxygen and water molecules are present in the atmosphere, there is a competitive adsorption between O2- and H2O-related surface species. As a result, MOS responses to gases are distinctly different under dry and humidified atmospheres [80,81,82].
A decrease in the gas sensor response in the presence of elevated level of humidity is usually explained by a reduction of the effective sensing area. However, the opposite behaviour can also be seen when the detected molecule directly reacts with active hydroxyl groups OH­, thus improving the sensor response [16]. In view of the results presented here, it can be assumed that the physisorption of water molecules is probably responsible for an increase in the NO2 response as the most pronounced influence of humidity is observed at 150 °C. It is possible that at this relatively low temperature, there is a strong competition between oxygen and water adsorption. The elimination of the adsorption of oxygen species might be beneficial to NO2 gas sensing, as already discussed (eq.6) the presence of oxygen is not necessary to form NO2 sites at the sensor surface.

5. Conclusions

The SnO2/TiO2 n-n thin film nanoheterostructures were obtained by depositing discontinuous TiO2 thin films on previously sputtered thicker SnO2 layers using the Langmuir–Blodgett technique with a nanopowder of rutile as a starting material. The morphological, structural and electronic properties of pure SnO2 and SnO2/TiO2 heterostructures and their responses to NO2 gases were studied. The most important results of this research can be summarized as follows:
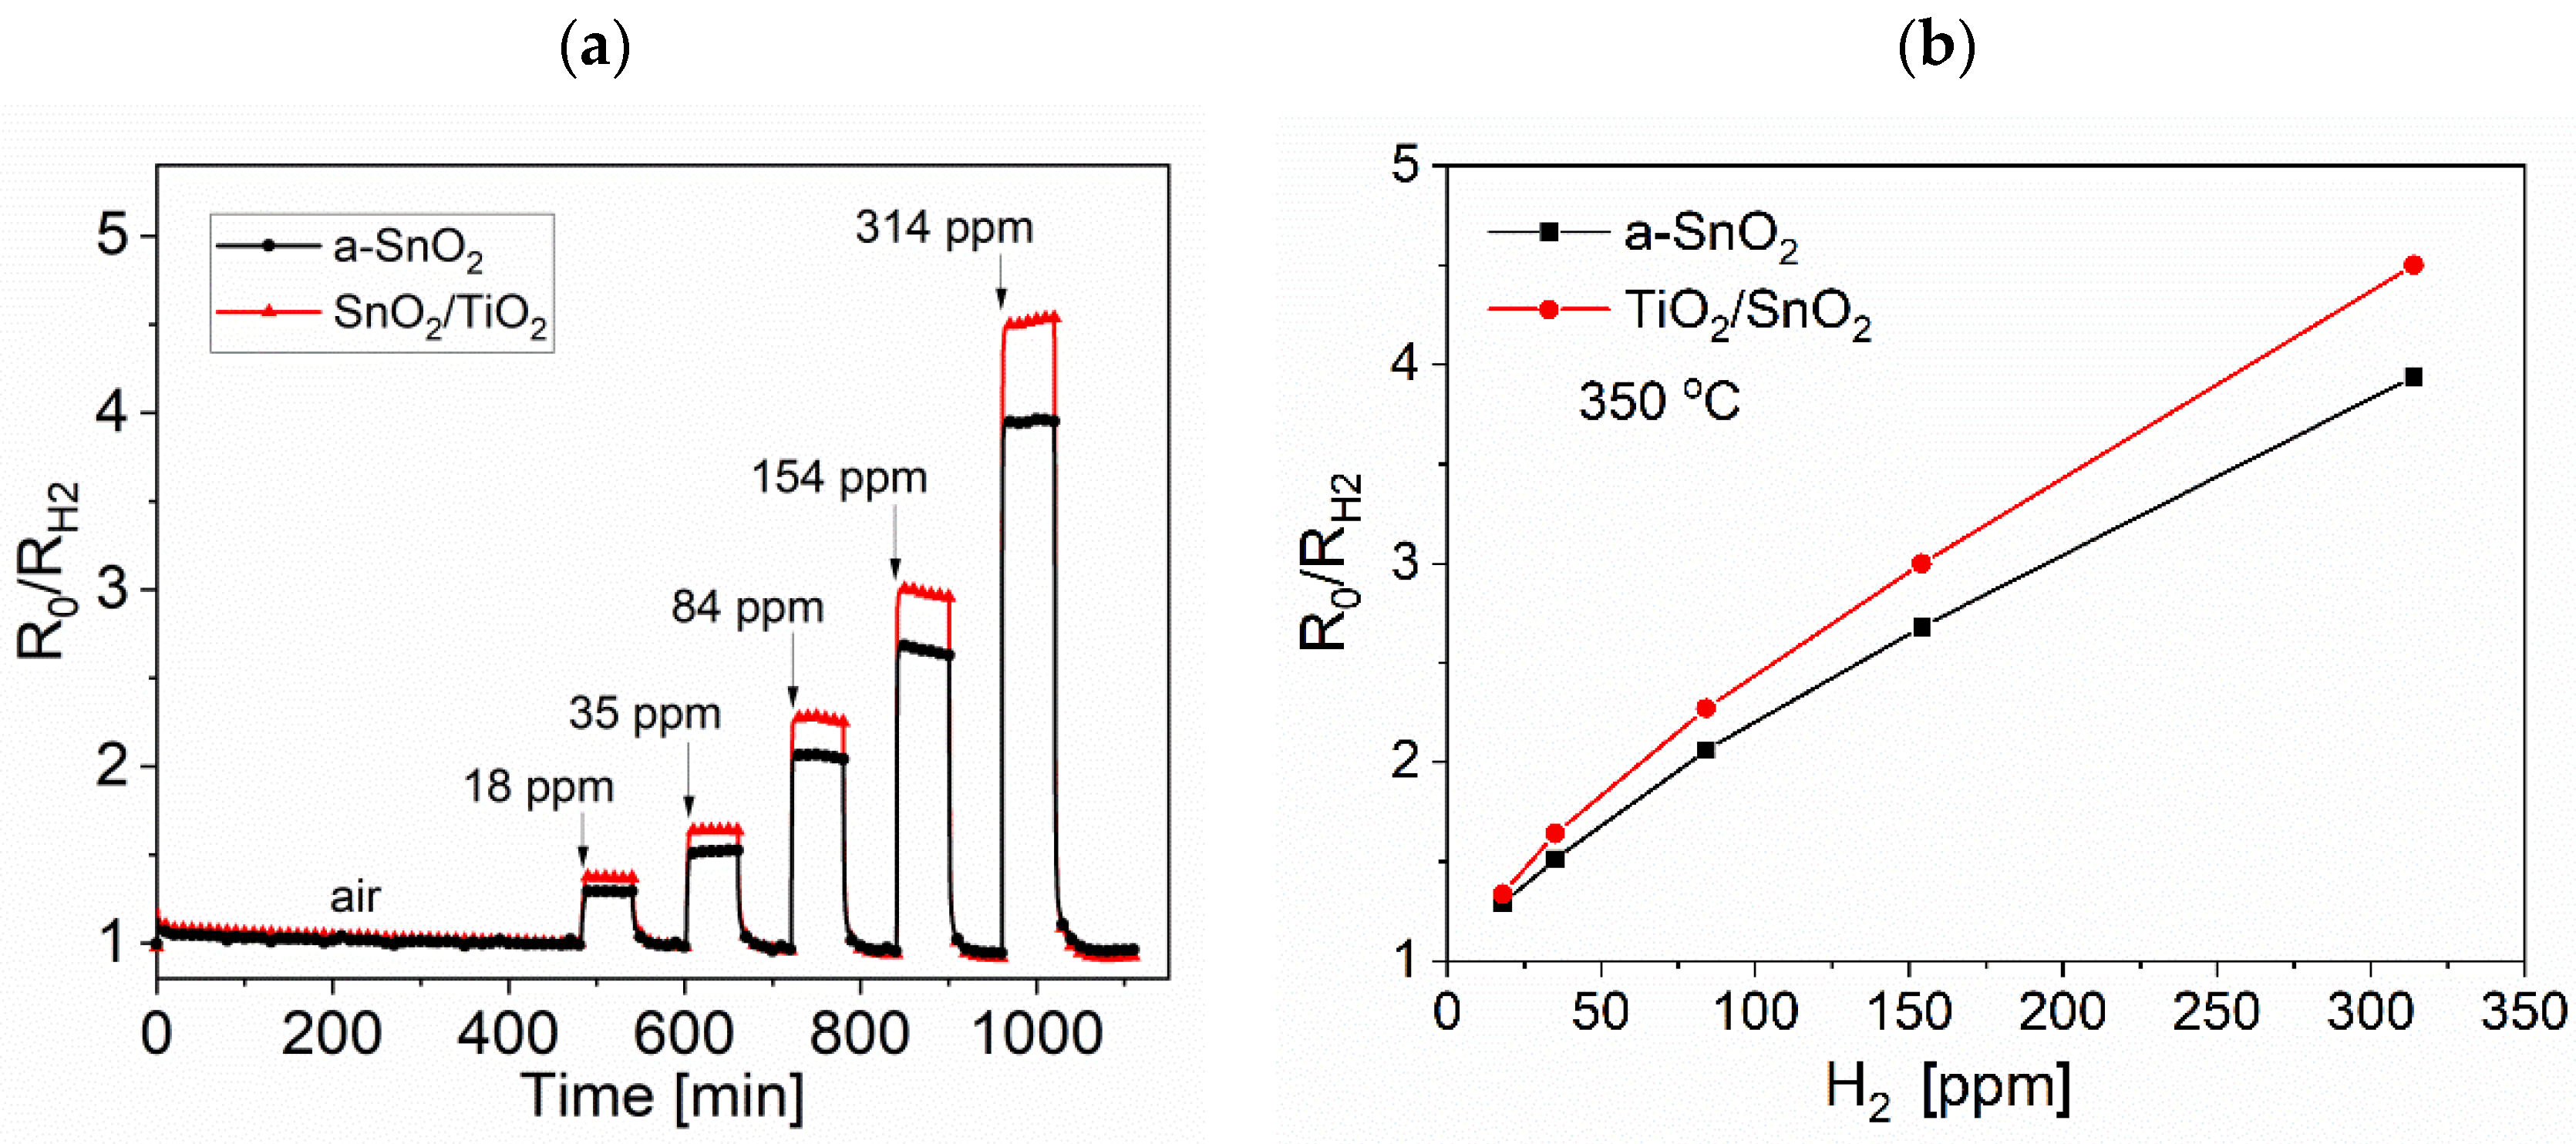
  • The heterostructures composed of TiO2 agglomerated discontinuous layer on the SnO2 thin film with a columnar mode of growth have a higher gas response than pure SnO2 for both reducing (H2) and oxidizing (NO2) gases.
  • Amorphous a-SnO2 demonstrate a much higher response to NO2 than their crystalline counterparts c-SnO2, probably because of the size effect.
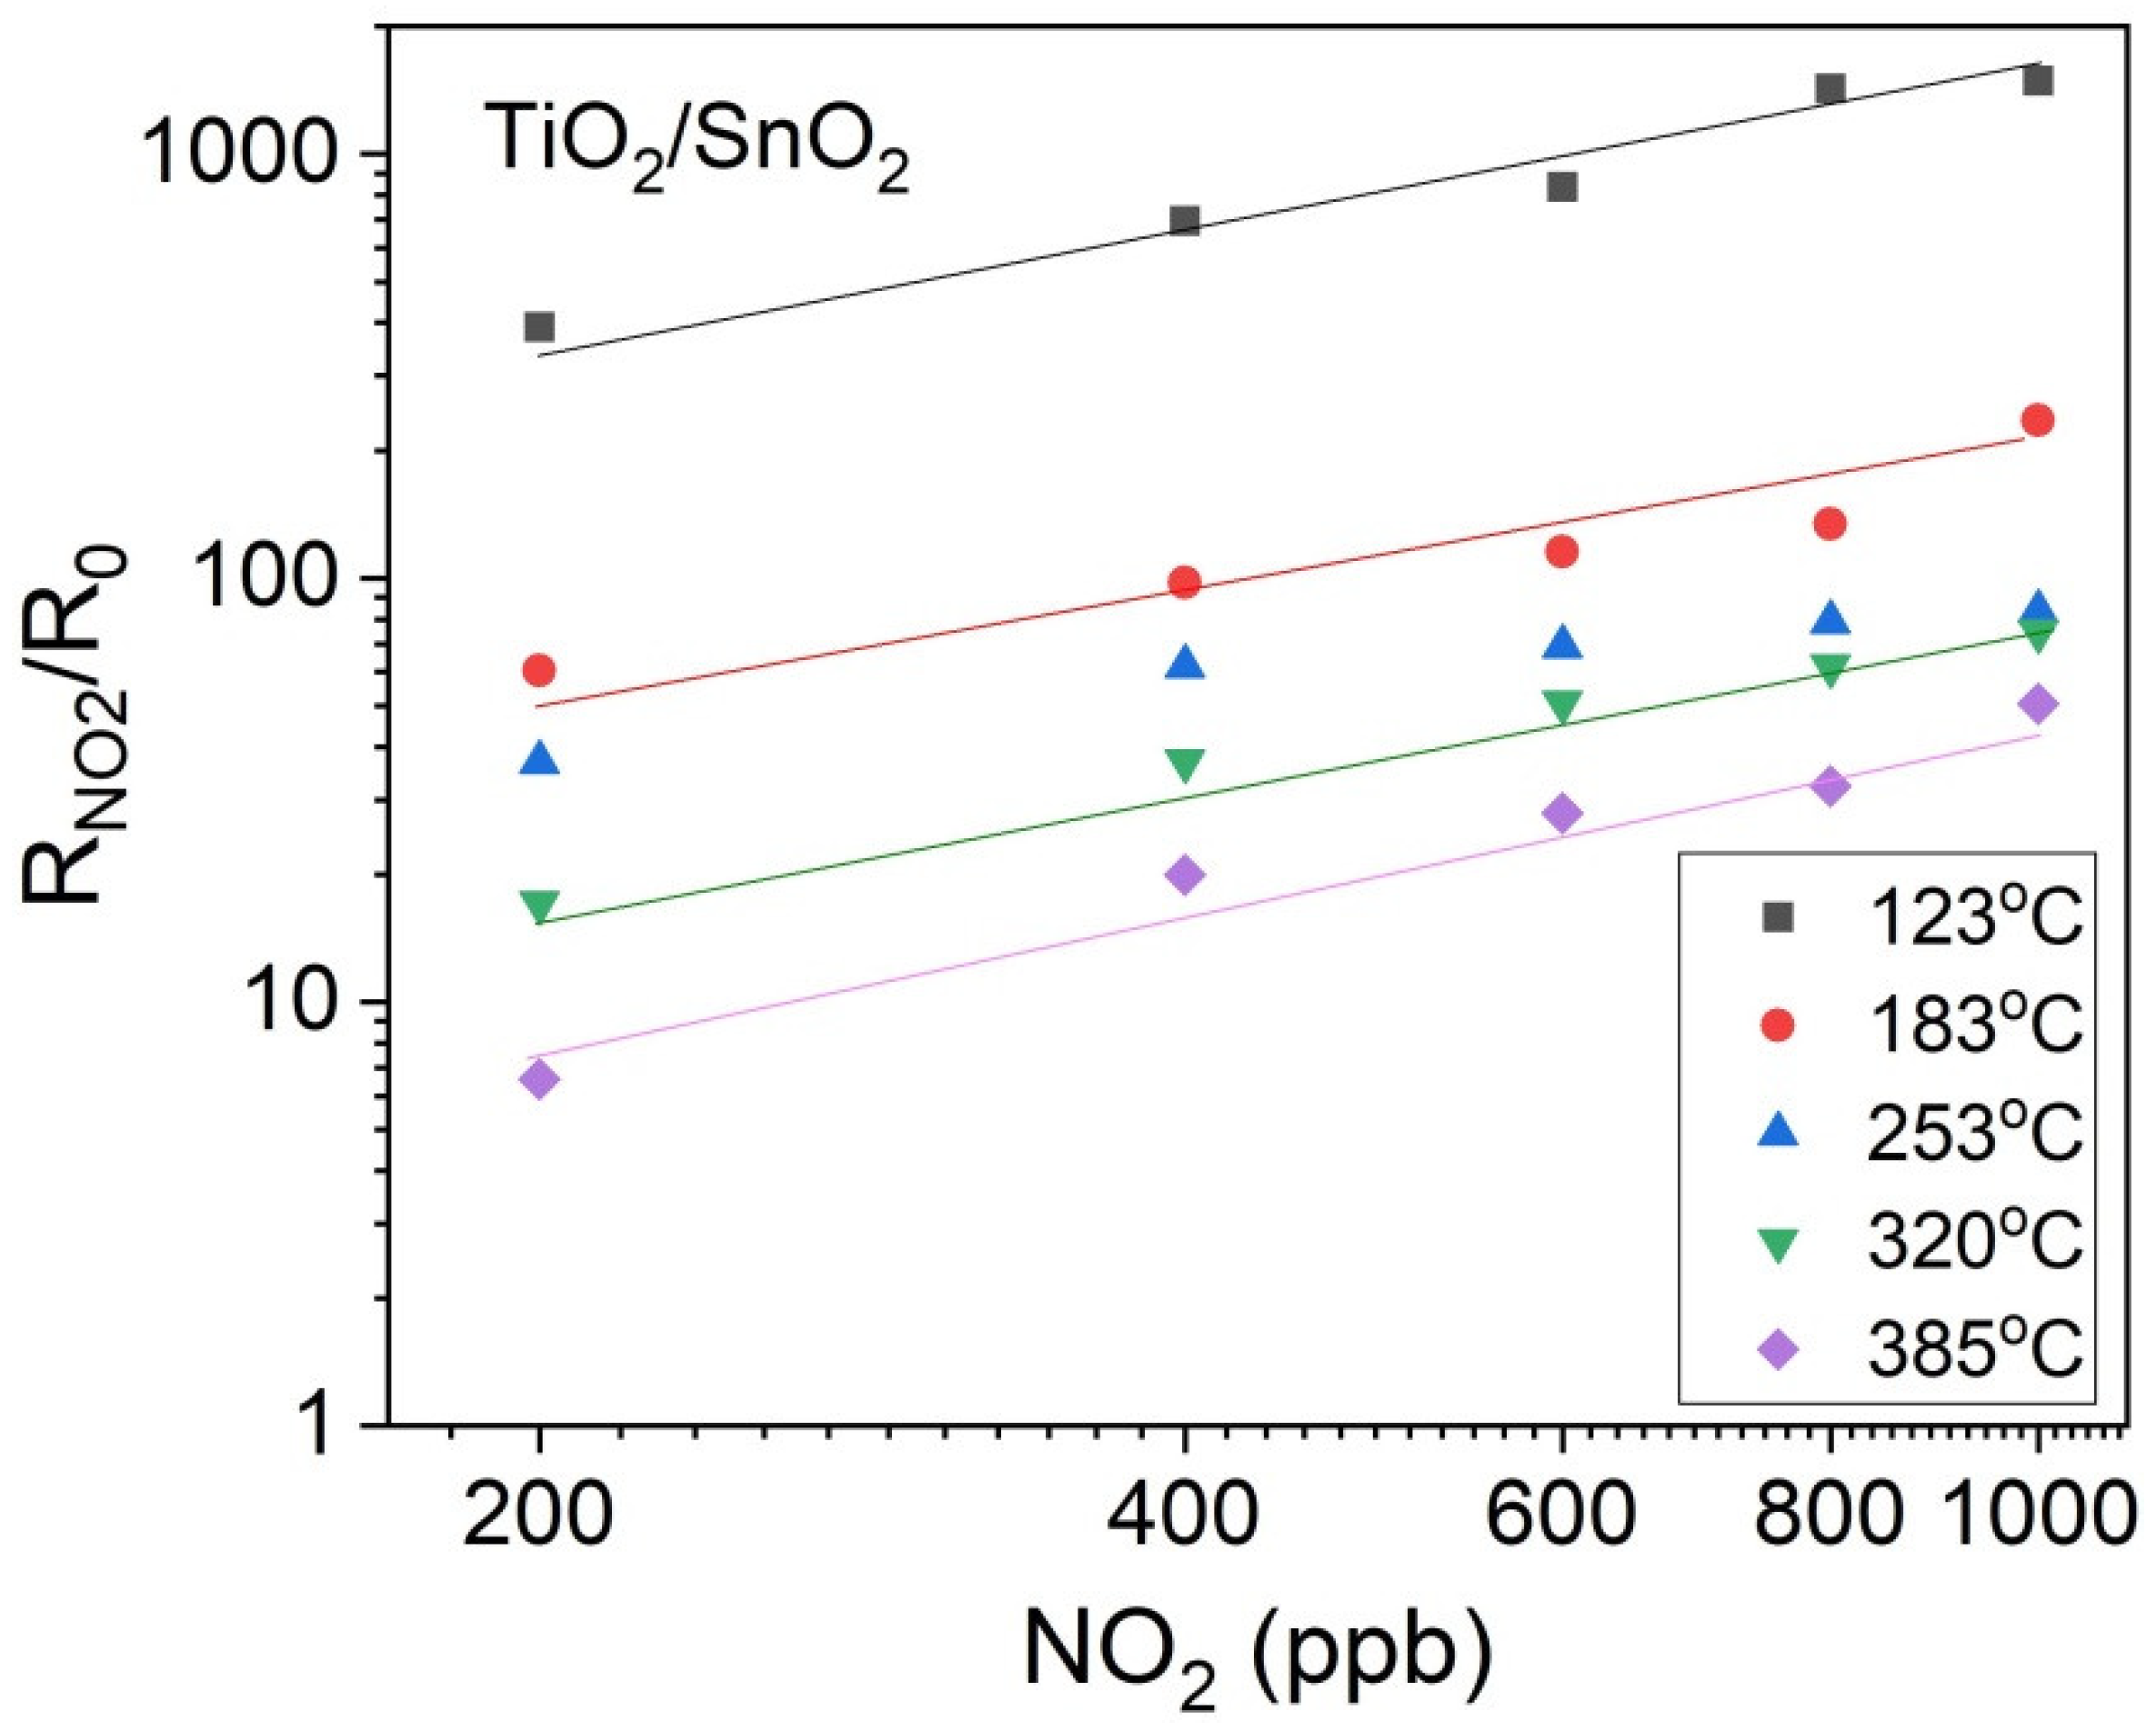
  • SnO2/TiO2 heterostructures are selective and sensitive even to low concentrations of NO2 which can be attributed to the electron injection from the conduction band CB of TiO2 to CB of SnO2.
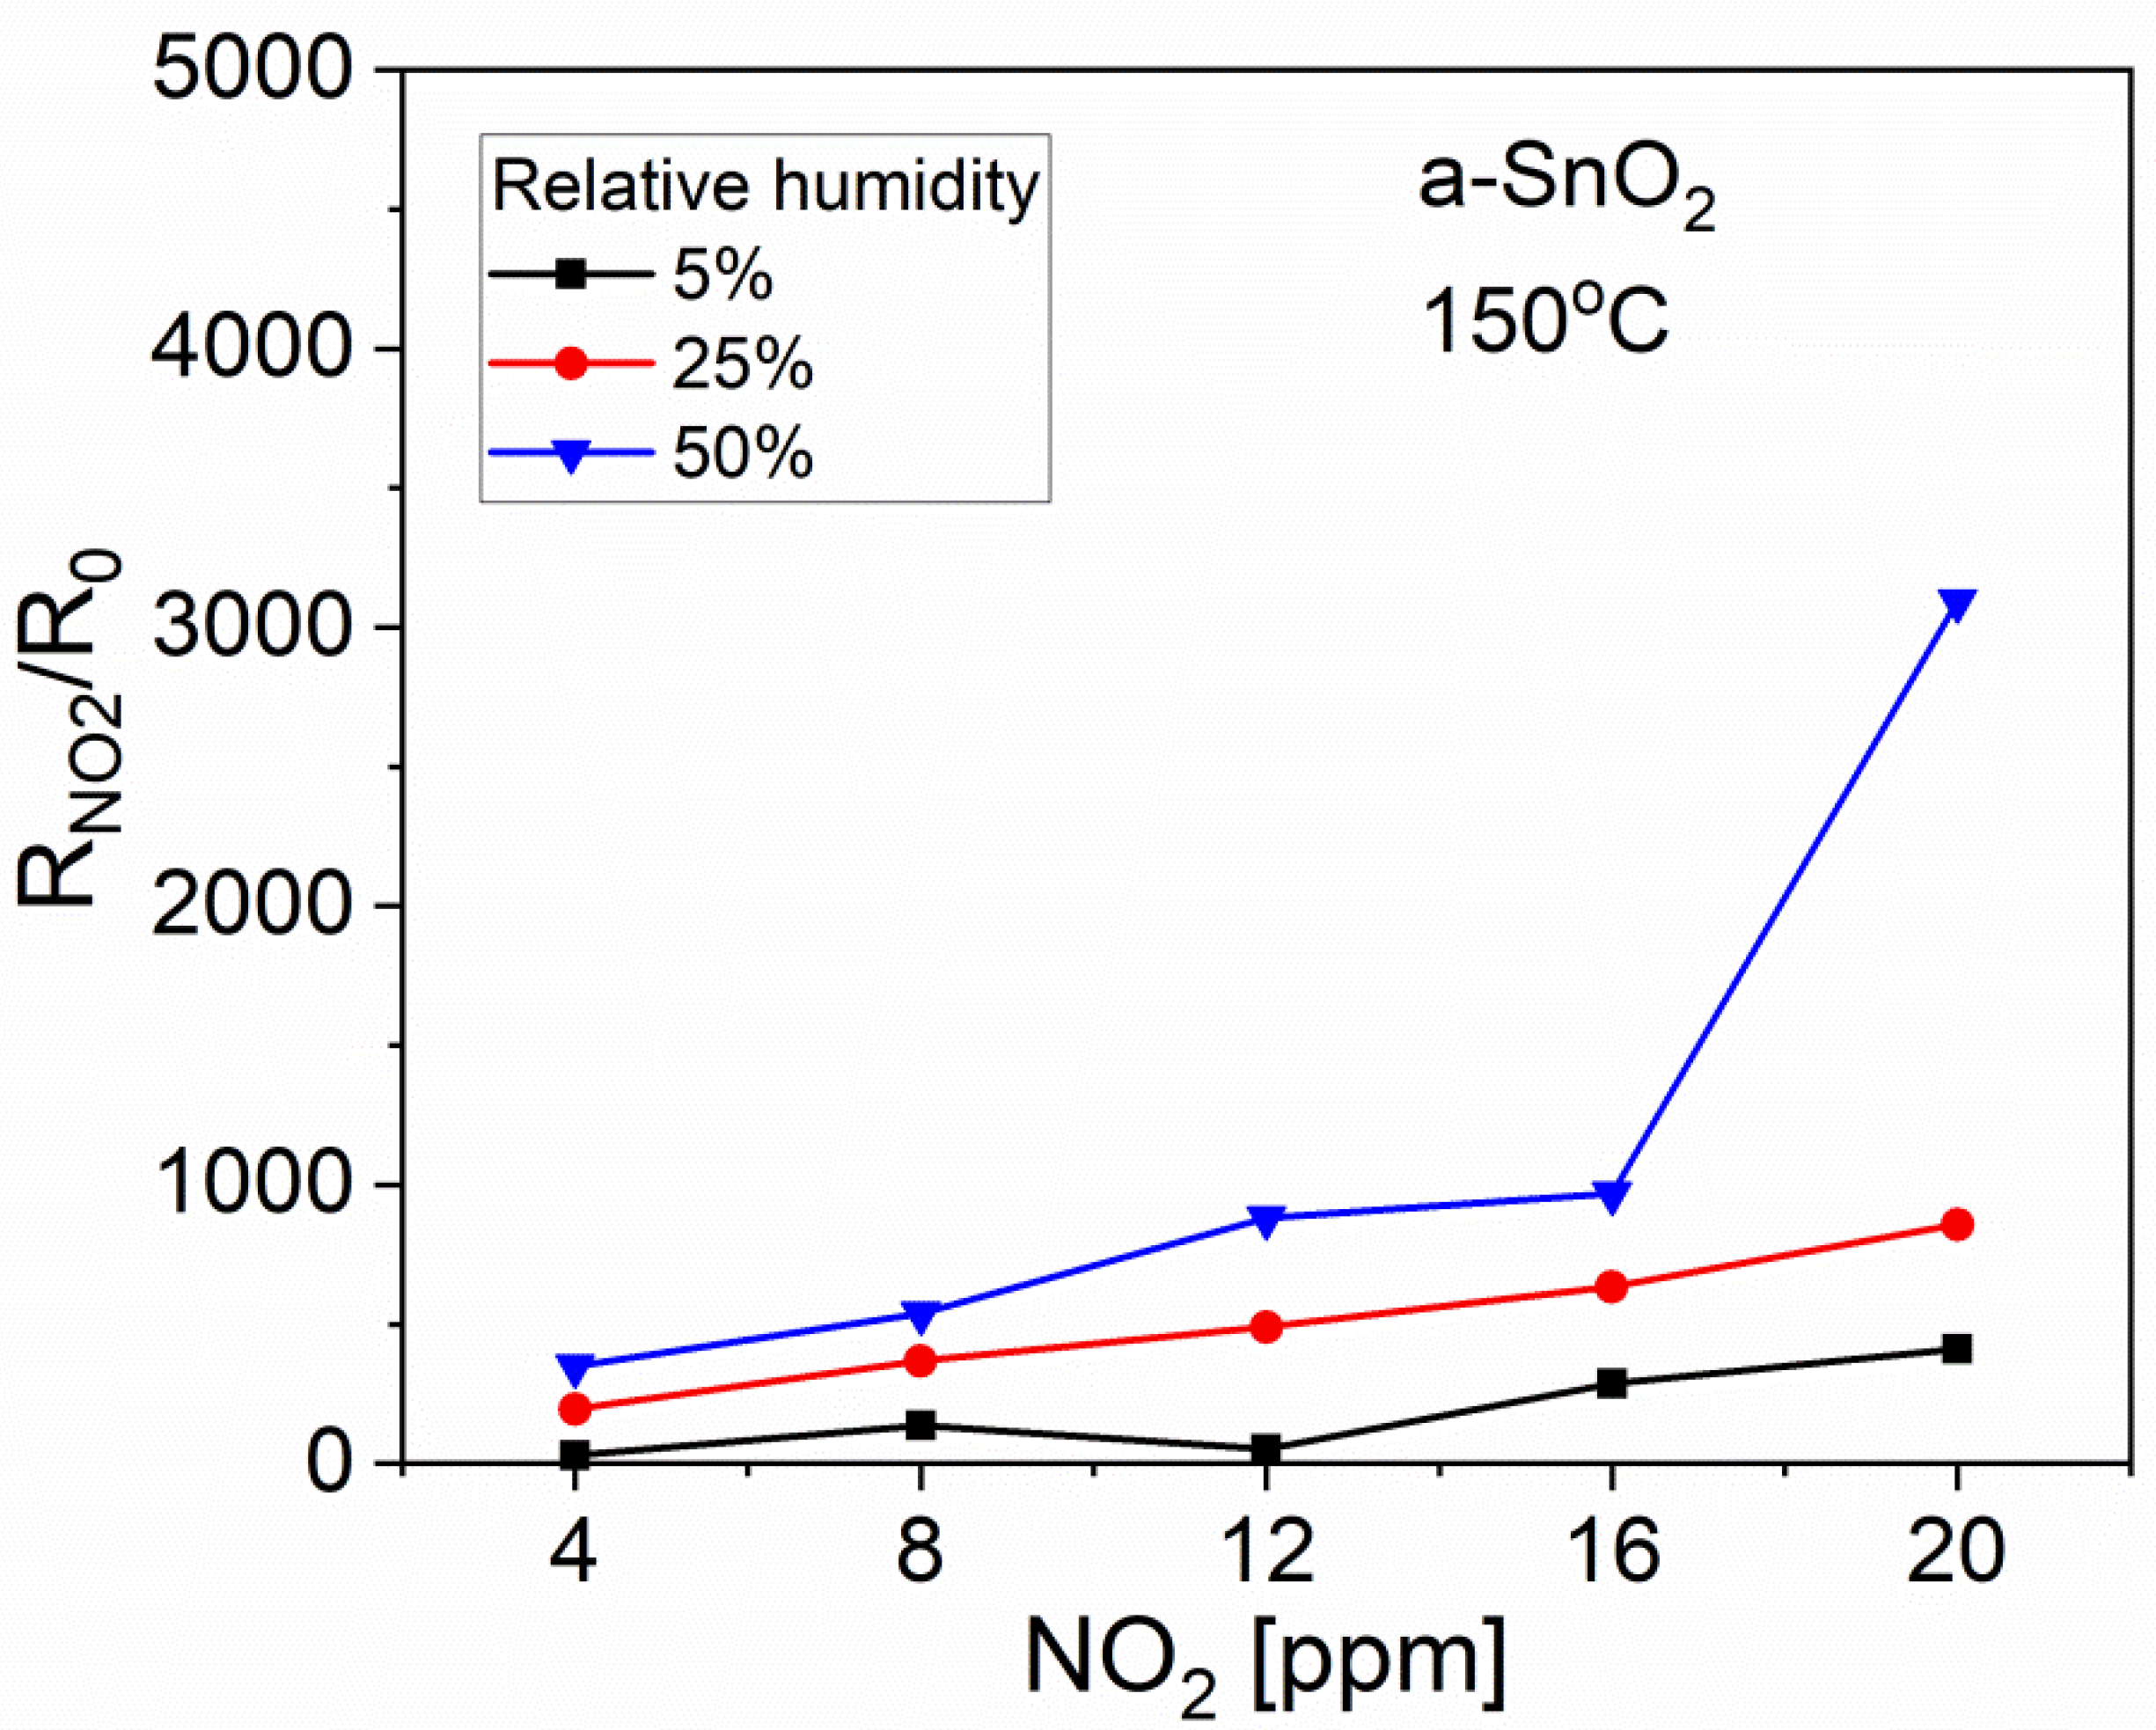
  • The significant increase in NO2 response occurs at an operating temperature below 150 °C where a considerable influence of humidity has been demonstrated; this effect is probably due to the competitive physisorption of water against chemisorption of oxygen and hydroxyl groups.
  • SnO2/TiO2 n-n nanoheterostructures in a form of thin films have proven to be highly sensitive and selective to NO2 with a threshold lower than 200 ppb.

Author Contributions

Conceptualization, K.Z., P.N., W.M.; methodology, W.M., A.R., K.K., M.Z., P.N.; validation, K.Z., W.M., A.R., K.K.; investigation, W.M., A.R., K.K., M.Z., P.N.; writing—original draft preparation, W.M., K.Z., P.N., K.K.; writing—review and editing, W.M., K.Z., P.N.; visualization, W.M.; supervision, K.Z., W.M.; project administration, P.N. All authors have read and agreed to the published version of the manuscript.

Funding

This research was funded by National Science Centre, Poland, grant number UMO-2016/23/B/ST7/00894 and the APC was funded by Ministry of Science and Higher Education, Poland, (program “Excellence initiative–research university” for the AGH University of Science and Technology).

Conflicts of Interest

The authors declare that they have no conflict of interest.

References

  1. U.S. National Library of Medicine, TOXNET—Toxicology Data Network, (n.d.). Available online: https://toxnet.nlm.nih.gov (accessed on 26 November 2018).
  2. The National Institute for Occupational Safety and Health (NIOSH), Nitrogen Dioxide—International Chemical Safety Cards, (n.d.). Available online: https://www.cdc.gov/niosh/ipcsneng/neng0930.html (accessed on 26 November 2018).
  3. Ielpo, P.; Mangia, C.; Marra, G.P.; Comite, V.; Rizza, U.; Uricchio, V.F.; Fermo, P. Outdoor spatial distribution and indoor levels of NO2 and SO2 in a high environmental risk site of the South Italy. Sci. Total Environ. 2019, 648, 787–797. [Google Scholar] [CrossRef] [PubMed]
  4. Casquero-Vera, J.A.; Lyamani, H.; Titos, G.; Borrás, E.; Olmo, F.J.; Alados-Arboledas, L. Impact of primary NO2 emissions at different urban sites exceeding the European NO2 standard limit. Sci. Total Environ. 2019, 646, 1117–1125. [Google Scholar] [CrossRef] [PubMed]
  5. Salthammer, T.; Schieweck, A.; Gu, J.; Ameri, S.; Uhde, E. Future trends in ambient air pollution and climate in Germany—Implications for the indoor environment. Build. Environ. 2018, 143, 661–670. [Google Scholar] [CrossRef]
  6. Mölter, A.; Lindley, S.; de Vocht, F.; Agius, R.; Kerry, G.; Johnson, K.; Ashmore, M.; Terry, A.; Dimitroulopoulou, S.; Simpson, A. Performance of a microenviromental model for estimating personal NO2 exposure in children. Atmos. Environ. 2012, 51, 225–233. [Google Scholar] [CrossRef]
  7. Beulertz, G.; Groß, A.; Moos, R.; Kubinski, D.J.; Visser, J.H. Determining the total amount of NOx in a gas stream—Advances in the accumulating gas sensor principle. Sens. Actuators B 2012, 175, 157–162. [Google Scholar] [CrossRef]
  8. Keskinen, H.; Tricoli, A.; Marjamäki, M.; Mäkelä, J.M.; Pratsinis, S.E. Size-selected agglomerates of SnO2 nanoparticles as gas sensors. J. Appl. Phys. 2009, 106, 084316. [Google Scholar] [CrossRef] [Green Version]
  9. Xu, C.; Tamaki, J.; Miura, N.; Yamazoe, N. Grain size effects on gas sensitivity of porous SnO2-based elements. Sens. Actuators B 1991, 3, 147–155. [Google Scholar] [CrossRef]
  10. Korotcenkov, G.; Brinzari, V.; Han, S.H.; Gulina, L.B.; Tolstoy, V.P.; Cho, B.K. SnO2 films decorated by Au clusters and their gas sensing properties. Mater. Sci. Forum 2015, 827, 251–256. [Google Scholar] [CrossRef]
  11. Comini, E.; Faglia, G.; Sberveglieri, G.; Calestani, D.; Zanotti, L.; Zha, M. Tin oxide nanobelts electrical and sensing properties. Sens. Actuators B 2005, 111–112, 2–6. [Google Scholar] [CrossRef]
  12. Shukla, S.; Patil, S.; Kuiry, S.C.; Rahman, Z.; Du, T.; Ludwig, L.; Parish, C.; Seal, S. Synthesis and characterization of sol–gel derived nanocrystalline tin oxide thin film as hydrogen sensor. Sens. Actuators B 2003, 96, 343–353. [Google Scholar] [CrossRef]
  13. Alberti, A.; Renna, L.; Sanzaro, S.; Smecca, E.; Mannino, G.; Bongiorno, C.; Galati, C.; Gervasi, L.; Santangelo, A.; La Magna, A. Innovative spongy TiO2 layers for gas detection at low working temperature. Sens. Actuators B 2018, 259, 658–667. [Google Scholar] [CrossRef]
  14. Huang, L.; Liu, T.; Zhang, H.; Guo, W.; Zeng, W. Hydrothermal synthesis of different TiO2 nanostructures: Structure, growth and gas sensor properties. J. Mater. Sci. Mater. Electron. 2012, 23, 2024–2029. [Google Scholar] [CrossRef]
  15. Wang, C.; Yin, L.; Zhang, L.; Qi, Y.; Lun, N.; Liu, N. Large scale synthesis and gas-sensing properties of anatase TiO2 three-dimensional hierarchical nanostructures. Langmuir 2010, 26, 12841–12848. [Google Scholar] [CrossRef] [PubMed]
  16. Haidry, A.A.; Kind, N.; Saruhan, B. Investigating the influence of Al-doping and background humidity on NO2 sensing characteristics of magnetron-sputtered SnO2 sensors. J. Sens. Sens. Syst. 2015, 4, 271–280. [Google Scholar] [CrossRef] [Green Version]
  17. Sukunta, J.; Wisitsoraat, A.; Tuantranont, A.; Phanichphant, S.; Liewhiran, C. WO3 nanotubes−SnO2 nanoparticles heterointerfaces for ultrasensitive and selective NO2 detections. Appl. Surf. Sci. 2018, 458, 319–332. [Google Scholar] [CrossRef]
  18. Santos, J.; Serrini, P.; O’Beirn, B.; Manes, L. A thin film SnO2 gas sensor selective to ultra-low NO2 concentrations in air. Sens. Actuators B 1997, 43, 154–160. [Google Scholar] [CrossRef]
  19. Kaur, J.; Kumar, R.; Bhatnagar, M.C. Effect of indium-doped SnO2 nanoparticles on NO2 gas sensing properties. Sens. Actuators B 2007, 126, 478–484. [Google Scholar] [CrossRef]
  20. Liangyuan, C.; Shouli, B.; Guojun, Z.; Dianqing, L.; Aifan, C.; Liu, C.C. Synthesis of ZnO–SnO2 nanocomposites by microemulsion and sensing properties for NO2. Sens. Actuators B 2008, 134, 360–366. [Google Scholar] [CrossRef]
  21. Bai, S.; Li, D.; Han, D.; Luo, R.; Chen, A.; Chung, C.L. Preparation, characterization of WO3–SnO2 nanocomposites and their sensing properties for NO2. Sens. Actuators B 2010, 150, 749–755. [Google Scholar] [CrossRef]
  22. Chen, A.; Huang, X.; Tong, Z.; Bai, S.; Luo, R.; Liu, C.C. Preparation, characterization and gas-sensing properties of SnO2-In2O3 nanocomposite oxides. Sens. Actuators B 2006, 115, 316–321. [Google Scholar] [CrossRef]
  23. Sharma, A.; Tomar, M.; Gupta, V. Enhanced response characteristics of SnO2 thin film based NO2 gas sensor integrated with nanoscaled metal oxide clusters. Sens. Actuators B 2013, 181, 735–742. [Google Scholar] [CrossRef]
  24. Leo, G.; Rella, R.; Siciliano, P.; Capone, S.; Alonso, J.C.; Pankov, V.; Ortiz, A. Sprayed SnO2 thin films for NO2 sensors. Sens. Actuators B 1999, 58, 370–374. [Google Scholar] [CrossRef]
  25. Sauvan, M.; Pijolat, C. Selectivity improvement of SnO2 films by superficial metallic films. Sens. Actuators B 1999, 58, 295–301. [Google Scholar] [CrossRef]
  26. Bang, J.H.; Choi, M.S.; Mirzaei, A.; Kwon, Y.J.; Kim, S.S.; Kim, T.W.; Kim, H.W. Selective NO2 sensor based on Bi2O3 branched SnO2 nanowires. Sens. Actuators B 2018, 274, 356–369. [Google Scholar] [CrossRef]
  27. Srivastava, V.; Jain, K. At room temperature graphene/SnO2 is better than MWCNT/SnO2 as NO2 gas sensor. Mater. Lett. 2016, 169, 28–32. [Google Scholar] [CrossRef]
  28. Wang, Y.; Liu, C.; Wang, Z.; Song, Z.; Zhou, X.; Han, N.; Chen, Y. Sputtered SnO2:NiO thin films on self-assembled Au nanoparticle arrays for MEMS compatible NO2 gas sensors. Sens. Actuators B 2019, 278, 28–38. [Google Scholar] [CrossRef]
  29. Kamble, D.L.; Harale, N.S.; Patil, V.L.; Patil, P.S.; Kadam, L.D. Characterization and NO2 gas sensing properties of spray pyrolyzed SnO2 thin films. J. Anal. Appl. Pyrolysis 2017, 127, 38–46. [Google Scholar] [CrossRef]
  30. Gu, D.; Li, X.; Zhao, Y.; Wang, J. Enhanced NO2 sensing of SnO2/SnS2 heterojunction based sensor. Sens. Actuators B 2017, 244, 67–76. [Google Scholar] [CrossRef]
  31. Hyodo, T.; Urata, K.; Kamada, K.; Ueda, T.; Shimizu, Y. Semiconductor-type SnO2-based NO2 sensors operated at room temperature under UV-light irradiation. Sens. Actuators B 2017, 253, 630–640. [Google Scholar] [CrossRef] [Green Version]
  32. Yu, H.; Yang, T.; Wang, Z.; Li, Z.; Zhao, Q.; Zhang, M. p-N heterostructural sensor with SnO-SnO2 for fast NO2 sensing response properties at room temperature. Sens. Actuators B Chem. 2018, 258, 517–526. [Google Scholar] [CrossRef]
  33. Wang, Z.; Jia, Z.; Li, Q.; Zhang, X.; Sun, W.; Sun, J.; Liu, B.; Ha, B. The enhanced NO2 sensing properties of SnO2 nanoparticles/reduced graphene oxide composite. J. Colloid Interface Sci. 2019, 537, 228–237. [Google Scholar] [CrossRef]
  34. Li, Z.; Yi, J. Synthesis and enhanced NO2-sensing properties of ZnO-decorated SnO2 microspheres. Mater. Lett. 2019, 236, 570–573. [Google Scholar] [CrossRef]
  35. Liu, D.; Tang, Z.; Zhang, Z. Visible light assisted room-temperature NO2 gas sensor based on hollow SnO2@SnS2 nanostructures. Sens. Actuators B 2020, 324, 128754. [Google Scholar] [CrossRef]
  36. Sharma, B.; Sharma, A.; Joshi, M.; Myung, J. Sputtered SnO2/ZnO heterostructures for improved NO2 gas sensing properties. Chemosensors 2020, 8, 67. [Google Scholar] [CrossRef]
  37. Maziarz, W. TiO2/SnO2 and TiO2/CuO thin film nanoheterostructures as gas sensors. Appl. Surf. Sci. 2019, 480, 361–370. [Google Scholar] [CrossRef]
  38. Kusior, A.; Radecka, M.; Zych, Ł.; Zakrzewska, K.; Reszka, A.; Kowalski, B.J. Sensitization of TiO2/SnO2 nanocomposites for gas detection. Sens. Actuators B 2013, 189, 251–259. [Google Scholar] [CrossRef]
  39. Zeng, W.; Liu, T.; Wang, Z. Sensitivity improvement of TiO2-doped SnO2 to volatile organic compounds. Phys. E Low-Dimens. Syst. Nanostruct. 2010, 43, 633–638. [Google Scholar] [CrossRef]
  40. Park, S.; Kim, S.; Kheel, H.; Park, S.E.; Lee, C. Synthesis and hydrogen gas sensing properties of TiO2-decorated CuO nanorods. Bull. Korean Chem. Soc. 2015, 36, 2458–2463. [Google Scholar] [CrossRef]
  41. Shao, F.; Hoffmann, M.W.G.; Prades, J.D.; Zamani, R.; Arbiol, J.; Morante, J.R.; Varechkina, E.; Rumyantseva, M.; Gaskov, A.; Giebelhaus, I.; et al. Heterostructured p-CuO (nanoparticle)/n-SnO2 (nanowire) devices for selective H2S detection. Sens. Actuators B 2013, 181, 130–135. [Google Scholar] [CrossRef]
  42. Kaur, M.; Dadhich, B.K.; Singh, R.; Kailasaganapathi, S.; Bagwaiya, T.; Bhattacharya, S.; Debnath, A.K.; Muthe, K.P.; Gadkari, S.C. RF sputtered SnO2: NiO thin films as sub-ppm H2S sensor operable at room temperature. Sens. Actuators B 2017, 242, 389–403. [Google Scholar] [CrossRef]
  43. Poloju, M.; Jayababu, N.; Ramana Reddy, M.V. Improved gas sensing performance of Al doped ZnO/CuO nanocomposite based ammonia gas sensor. Mater. Sci. Eng. B Solid-State Mater. Adv. Technol. 2018, 227, 61–67. [Google Scholar] [CrossRef]
  44. Larin, A.; Womble, P.C.; Dobrokhotov, V. Hybrid SnO2/TiO2 nanocomposites for selective detection of ultra-low hydrogen sulfide concentrations in complex backgrounds. Sensors 2016, 16, 1373. [Google Scholar] [CrossRef] [PubMed]
  45. Miller, D.R.; Akbar, S.A.; Morris, P.A. Nanoscale metal oxide-based heterojunctions for gas sensing: A review. Sens. Actuators B Chem. 2014, 204, 250–272. [Google Scholar] [CrossRef]
  46. Lyson-Sypien, B.; Kusior, A.; Rekas, M.; Zukrowski, J.; Gajewska, M.; Michalow-Mauke, K.; Graule, T.; Radecka, M.; Zakrzewska, K. Nanocrystalline TiO2/SnO2 heterostructures for gas sensing. Beilstein J. Nanotechnol. 2017, 8, 108–122. [Google Scholar] [CrossRef] [PubMed] [Green Version]
  47. Zakrzewska, K.; Radecka, M. TiO2-SnO2 system for gas sensing-photodegradation of organic contaminants. Thin Solid Films 2007, 515, 8332–8338. [Google Scholar] [CrossRef]
  48. Zakrzewska, K.; Radecka, M. TiO2-based nanomaterials for gas sensing—influence of anatase and rutile contributions. Nanoscale Res. Lett. 2017, 12, 89. [Google Scholar] [CrossRef] [Green Version]
  49. McNamee, C.E.; Yamamoto, S.; Butt, H.J.; Higashitani, K. A straightforward way to form close-packed TiO2 particle monolayers at an air/water interface. Langmuir 2011, 27, 887–894. [Google Scholar] [CrossRef]
  50. Ganguly, P.; Paranjape, D.V.; Sastry, M. Novel structure of Langmuir-Blodgett films of chloroplatinic acid using n-octadecylamine: Evidence for interdigitation of hydrocarbon chains. J. Am. Chem. Soc. 1993, 115, 793–794. [Google Scholar] [CrossRef]
  51. Choudhury, S.; Bagkar, N.; Dey, G.K.; Subramanian, H.; Yakhmi, J.V. Crystallization of prussian blue analogues at the air-water interface using an octadecylamine monolayer as a template. Langmuir 2002, 18, 7409–7414. [Google Scholar] [CrossRef]
  52. Amm, D.T.; Johnson, D.J.; Laursen, T.; Gupta, S.K. Fabrication of ultrathin metal oxide films using Langmuir-Blodgett deposition. Appl. Phys. Lett. 1992, 61, 522–524. [Google Scholar] [CrossRef]
  53. Paranjape, D.V.; Sastry, M.; Ganguly, P. Deposition of thin films of TiO2 from Langmuir-Blodgett film precursors. Appl. Phys. Lett. 1993, 63, 18–20. [Google Scholar] [CrossRef]
  54. Schurr, M.; Hassmann, J.; Kügler, R.; Tomaschko, C.; Voit, H. Ultrathin layers of rare earth oxides from Langmuir-Blodgett films. Thin Solid Films 1997, 307, 260–265. [Google Scholar] [CrossRef]
  55. Kwon, H.; Yoon, J.S.; Lee, Y.; Kim, D.Y.; Baek, C.K.; Kim, J.K. An array of metal oxides nanoscale hetero p-n junctions toward designable and highly-selective gas sensors. Sens. Actuators B Chem. 2018, 255, 1663–1670. [Google Scholar] [CrossRef]
  56. Nowak, P.; Maziarz, W.; Rydosz, A.; Kowalski, K.; Zakrzewska, K. SnO2/TiO2 thin film n-n heterostructures for H2 and NO2 gas sensor. In Proceedings of the 17th International Meeting on Chemical Sensors—IMCS 2018, Vienna, Austria, 15–19 July 2018; pp. 549–550. [Google Scholar] [CrossRef]
  57. Zakrzewska, K.; Maziarz, W.; Schneider, K.; Mazur, M.; Wojcieszak, D.; Kaczmarek, D. Cu2O/CuO thin film p-p nano-heterostructures for gas sensing. In Proceedings of the 17th International Meeting on Chemical Sensors—IMCS 2018, Vienna, Austria, 15–19 July 2018; pp. 789–790. [Google Scholar] [CrossRef]
  58. Rydosz, A.; Maziarz, W.; Brudnik, A.; Czapla, A.; Zakrzewska, K. CuO and CuO/TiO2-y thin-film gas sensors of H2 and NO2. In Proceedings of the XV International Scientific Conference on Optoelectronic and Electronic Sensors (COE), Warsaw, Poland, 17–20 June 2018; pp. 2016–2019. [Google Scholar]
  59. Xu, H.; Ju, J.; Li, W.; Zhang, J.; Wang, J.; Cao, B. Superior triethylamine-sensing properties based on TiO2/SnO2 n-n heterojunction nanosheets directly grown on ceramic tubes. Sens. Actuators B 2016, 228, 634–642. [Google Scholar] [CrossRef]
  60. Maziarz, W.; Kusior, A.; Trenczek-Zajac, A. Nanostructured TiO2-based gas sensors with enhanced sensitivity to reducing gases. Beilstein J. Nanotechnol. 2016, 7, 1718–1726. [Google Scholar] [CrossRef] [Green Version]
  61. Choudhary, K.; Manjuladevi, V.; Gupta, R.K.; Bhattacharyya, P.; Hazra, A.; Kumar, S. Ultrathin films of TiO2 nanoparticles at interfaces. Langmuir 2015, 31, 1385–1392. [Google Scholar] [CrossRef]
  62. Briggs, D.; Seah, M.P. (Eds.) Practical Surface Analysis, 2nd ed.; Wiley: Chichester, UK; New York, NY, USA, 1990. [Google Scholar]
  63. Manifacier, J.C.; Gasiot, J.; Fillard, J.P. A simple method for the determination of the optical constants n, k and the thickness of a weakly absorbing thin film. J. Phys. E 1976, 9, 1002. [Google Scholar] [CrossRef]
  64. Goldsmith, S.; Çetinörgü, E.; Boxman, R.L. Modeling the optical properties of tin oxide thin films. Thin Solid Films 2009, 517, 5146–5150. [Google Scholar] [CrossRef]
  65. Barsan, N.; Weimar, U. Understanding the fundamental principles of metal oxide based gas sensors; The example of CO sensing with SnO2 sensors in the presence of humidity. J. Phys. Condens. Matter. 2003, 15, R813–R839. [Google Scholar] [CrossRef]
  66. Barsan, N.; Weimar, U. Conduction model of metal oxide gas sensors. J. Electroceram. 2001, 7, 143–167. [Google Scholar] [CrossRef]
  67. Bielański, A.; Haber, J. Oxygen in catalysis on transition metal oxides. Catal. Rev. 1979, 19, 1–41. [Google Scholar] [CrossRef]
  68. Giancane, G.; Valli, L. State of art in porphyrin Langmuir-Blodgett films as chemical sensors. Adv. Colloid Interface Sci. 2012, 171–172, 17–35. [Google Scholar] [CrossRef] [PubMed]
  69. Capan, İ.; Tarımcı, Ç.; Capan, R. Fabrication of Langmuir–Blodgett thin films of porphyrins and investigation on their gas sensing properties. Sens. Actuators B 2010, 144, 126–130. [Google Scholar] [CrossRef]
  70. Balcerzak, A.; Aleksiejuk, M.; Zhavnerko, G.; Agabekov, V. Sensing properties of two-component Langmuir-Blodgett layer and its porous derivative in SAW sensor for vapors of methanol and ethanol. Thin Solid Films 2010, 518, 3402–3406. [Google Scholar] [CrossRef]
  71. Penza, M.; Milella, E.; Musio, F.; Alba, M.B.; Cassano, G.; Quirini, A. AC and DC measurements on Langmuir-Blodgett polypyrrole films for selective NH3 gas detection. Mater. Sci. Eng. C. 1998, 5, 255–258. [Google Scholar] [CrossRef]
  72. Oswald, M.; Hessel, V.; Riedel, R. Formation of ultra-thin ceramic TiO2 films by the Langmuir-Blodgett technique—A two-dimensional sol-gel process at the air-water interface. Thin Solid Films 1999, 339, 284–289. [Google Scholar] [CrossRef]
  73. Bhullar, G.K.; Kaur, R.; Raina, K.K. Hybrid polyaniline-TiO2 nanocomposite Langmuir-Blodgett thin films: Self-assembly and their characterization. J. Appl. Polym. Sci. 2015, 132. [Google Scholar] [CrossRef]
  74. Choudhury, S.; Betty, C.A.; Girija, K.G.; Kulshreshtha, S.K. Room temperature gas sensitivity of ultrathin SnO2 films prepared from Langmuir-Blodgett film precursors. Appl. Phys. Lett. 2006, 89, 071914. [Google Scholar] [CrossRef]
  75. Ganguly, P.; Paranjape, D.V.; Sastry, M. Studies on the deposition of titanyl oxalate ions using long-chain hydrocarbon amines. Langmuir 1993, 9, 577–579. [Google Scholar] [CrossRef]
  76. Takahashi, M.; Kobayashi, K.; Tajima, K. Structural characterization and photocatalytic activity of ultrathin TiO2 films fabricated by Langmuir–Blodgett technique with octadecylamine. Thin Solid Films 2011, 519, 8077–8084. [Google Scholar] [CrossRef]
  77. Choudhury, S.; Betty, C.A. A heterostructured SnO2–TiO2 thin film prepared by Langmuir–Blodgett technique. Mater. Chem. Phys. 2013, 141, 440–444. [Google Scholar] [CrossRef]
  78. Betty, C.A.; Choudhury, S.; Girija, K.G. Discerning specific gas sensing at room temperature by ultrathin SnO2 films using impedance approach. Sens. Actuators B 2012, 173, 781–788. [Google Scholar] [CrossRef]
  79. Betty, C.A.; Choudhury, S.; Girija, K.G. Reliability studies of highly sensitive and specific multi-gas sensor based on nanocrystalline SnO2 film. Sens. Actuators B 2014, 193, 484–491. [Google Scholar] [CrossRef]
  80. Sahm, T.; Gurlo, A.; Bârsan, N.; Weimar, U.; Mädler, L. Fundamental studies on SnO2 by means of simultaneous work function change and conduction measurements. Thin Solid Films 2005, 490, 43–47. [Google Scholar] [CrossRef]
  81. Hahn, S.; Bârsan, N.; Weimar, U.; Ejakov, S.; Visser, J.; Soltis, R. CO sensing with SnO2 thick film sensors: Role of oxygen and water vapour. Thin Solid Films 2003, 436, 17–24. [Google Scholar] [CrossRef]
  82. Korotcenkov, G.; Blinov, I.; Brinzari, V.; Stetter, J.R. Effect of air humidity on gas response of SnO2 thin film ozone sensors. Sens. Actuators B 2007, 122, 519–526. [Google Scholar] [CrossRef]
Figure 1. Langmuir–Blodgett deposition technique: (a) the setup, (b) the method idea.
Sensors 20 06830 g001
Figure 2. The surface tension vs. active inter-barrier area (Π-A Langmuir isotherms) during deposition of TiO2 thin film by L–B.
Sensors 20 06830 g002
Figure 3. Gas sensor used in experiment: (a) SEM photograph of substrate with interdigital Au electrodes and (b) electrodes in magnification, (c) simplified equivalent circuit of the sensor, and (d) successive steps of gas sensor preparation, with sputtered SnO2 layer and TiO2 thin film deposited by the L–B technique.
Sensors 20 06830 g003
Figure 4. Gas sensor response measurements scheme according to (a) CC (constant concentration) and (b) CT (constant temperature) scenarios, and definitions of (c) response tres and (d) recovery trec times.
Sensors 20 06830 g004
Figure 5. X-ray of diffraction, XRD, patterns of cassiterite, tetragonal SnO2 phase, c-SnO2, amorphous a-SnO2 and SnO2/TiO2 heterostructured thin films.
Sensors 20 06830 g005
Figure 6. SEM images of thin films on Si substrate: (a) TiO2, and (b) a-SnO2.
Sensors 20 06830 g006
Figure 7. SEM images for TiO2 grown by the Langmuir–Blodgett method on the surface of a-SnO2 thin films deposited by magnetron sputtering MS: cross sections (a,b), top view (c,d) and EDS maps of Sn, Ti, O elements (e,f).
Sensors 20 06830 g007aSensors 20 06830 g007b
Figure 8. XPS spectra (ac) of TiO2 thin film deposited on Si substrate by the L–B technique: (a) Ti2p, (b) O1s, (c) Si2p, (d) TiO2 thin film deposited on SnO2 thin film by L–B technique; BE-binding energy.
Sensors 20 06830 g008aSensors 20 06830 g008b
Figure 9. Spectral dependence of the transmittance, T, and reflectance, R, for (a) a-SnO2, (b) c-SnO2 thin films; n—calculated refractive index, d—thickness derived from optical spectra; Eg—band gap.
Sensors 20 06830 g009
Figure 10. The gas sensor responses, RNO2/R0, of a-SnO2 and SnO2/TiO2 upon exposure to 20 ppm NO2 at 210 °C.
Sensors 20 06830 g010
Figure 11. The RNO2/R0 responses to 20 ppm NO2 of a-SnO2, c-SnO2 and SnO2/TiO2 thin films vs. operating temperature.
Sensors 20 06830 g011
Figure 12. Dynamic changes in the electrical resistance of SnO2/TiO2 thin films at different operating temperatures, upon exposure to 400 ppb NO2.
Sensors 20 06830 g012
Figure 13. The SnO2/TiO2 thin film response to low NO2 concentrations at different operating temperatures.
Sensors 20 06830 g013
Figure 14. Responses R0/RH2 of a-SnO2 and SnO2/TiO2 thin films to step changes in H2 measured according to scenario CT: (a) dynamic characteristics at 350 °C and (b) response as a function of H2 concentration at 350 °C.
Sensors 20 06830 g014
Figure 15. Influence of humidity on the RNO2/R0 responses of a-SnO2 thin films to varying NO2 concentrations at a constant operating temperature 150 °C.
Sensors 20 06830 g015
Table 1. Survey of NO2-sensing materials based on SnO2 prepared by various physical and chemical methods.
NO2-Sensing MOSSynthesis MethodOperating TemperatureRNO2/RairConcentration
[ppm]
Reference, Year
SnO2rf-sputtering200 °C180.1[18], 1997
SnO2sol-gel150 °C72500[19], 2007
ZnO–SnO2reversed microemulsion250 °C34.5500[20], 2008
WO2–SnO2sol precipitation200 °C186200[21], 2010
In2O3–SnO2co-precipitation200 °C7.51000[22], 2006
TiO2/SnO2e-beam evaporation90 °C82510[23], 2013
SnO2chemical spray deposition350 °C60500[24], 1999
SnO2vapor phase deposition300 °C90.2[11], 2005
SnO2chemical vapor deposition450 °C0.9310[25], 1999
SnO2+Bi2O3vapor-liquid-solid method250 °C56.92[26], 2018
SnO2 + graphene
SnO2+MWCNT
sol–gel methodRT~9.5
~4.5
20[27], 2016
Au/SnO2:NiOsputtering200 °C∼1855[28], 2019
SnO2spray pyrolysis150 °C55640[29], 2017
SnO2/SnS2high temperature oxidation80 °C58[30], 2017
Pd/SnO2
Pt/SnO2
co-precipitation30 °C + 7mW uv3400
1500
5[31], 2017
SnO-SnO2hydrothermal methodRT2.5
4.5
15
0.2
1
100
[32], 2018
SnO2-WO3thermal decomposition150 °C128005[17], 2018
SnO2-graphenehydrothermal method75 °C2250.35[33], 2019
ZnO+SnO2electrospinning200 °C258100[34], 2019
SnO2@SnS2hydrothermal methodRT,
blue light
5.2
57.3
0.2
5
[35], 2020
SnO2/ZnOsputtering100 °C67100[36], 2020
RT—room temperature, uv—ultraviolet irradiation, MWCNT—multiwall carbon nanotubes; NT—nanotubes.
Table 2. Kinetics of the SnO2/TiO2 thin film response to NO2 of two different concentrations; tresp—response time, trec—recovery time.
Temperature [°C]400 ppb NO22000 ppb NO2
tresp [s]trec [s]RNO2/R0tresp [s]trec [s]RNO2/R0
12362426962658847
183112297109350
253101762410136
320122837411101
3851219204--
Table 3. RNO2/R0 responses of a-SnO2 sensor to 12 ppm NO2 at various temperatures and for different relative humidity values.
RH %RNO2/R0
150 °C220 °C235 °C335 °C
551--13
25489135127-
50881147128-
75-9460-
Publisher’s Note: MDPI stays neutral with regard to jurisdictional claims in published maps and institutional affiliations.

