PADL: A Modeling and Deployment Language for Advanced Analytical Services †

 ,
, 
 and
and
Abstract
:1. Introduction
- Smart sensors enable the collection of the necessary data and transform the city into a smart city. They maintain the city connected and the stakeholders informed, and without them, the rest of subsystems would not be able to function correctly.
- Smart citizens are undoubtedly the fundamental part of a smart city since their active involvement makes it possible to perform these initiatives.
- Smart services enable citizens and administrative entities to actively participate in the control of the city. They are based on information technologies that help to control the different subsystems that comprise the smart city.
2. Deploying Data Analytics in Smart Cities
2.1. Analytic Services for Smart Cities
2.2. Technological Background
- Deployment frameworks: In this field, there are novel works such as MLflow [25], which provides tools for packaging and deploying analytical pipelines in different environments. ML.NET [26] is another open-source framework proposed by Microsoft to deploy machine learning pipelines. For typical operational workflow operationalization, on the other hand, Verma et al. [27] proposed a cluster manager to execute hundreds of workloads across thousands of machines. This project was the cornerstone for Kubernetes [28]. Another effort towards the orchestration of workloads in distributed environments is Docker Swarm [29], which offers less features than Kubernetes, but at a lower technological footprint. However, both Kubernetes and Docker Swarm are general-purpose deployment frameworks and do not focus specifically on ML or AI.
- Description languages: In the machine learning domain, the Predictive Model Markup Language (PMML) [30] was one of the first solutions that tackled the problems associated with the operationalization of AI and ML models. Subsequently, Portable Format for Analytics (PFA) [31] was conceptualized claiming that, in contrast to PMML, it is an extensible language for the definition of pre-processing and post-processing code, provides better features to create analytical workflows, integrates easily with distributed and event-based data processing platforms, and is safer to use within IT operational environments.
- Deployment awareness, allowing for the definition of the restrictions an analytical pipeline needs to adhere to when deployed in production.
- Domain orientation, providing annotations specific for the analytical domain.
- Permits the definition of the entire pipeline alongside the annotations in a single text file, so it can be versioned and integrated into continuous integration and delivery workflows.
- Has a low technological footprint, facilitating the use of existing infrastructures with heterogeneous devices.
- Enables the deployment of analytical pipelines in different layers of the architecture (i.e., edge, fog, cloud).
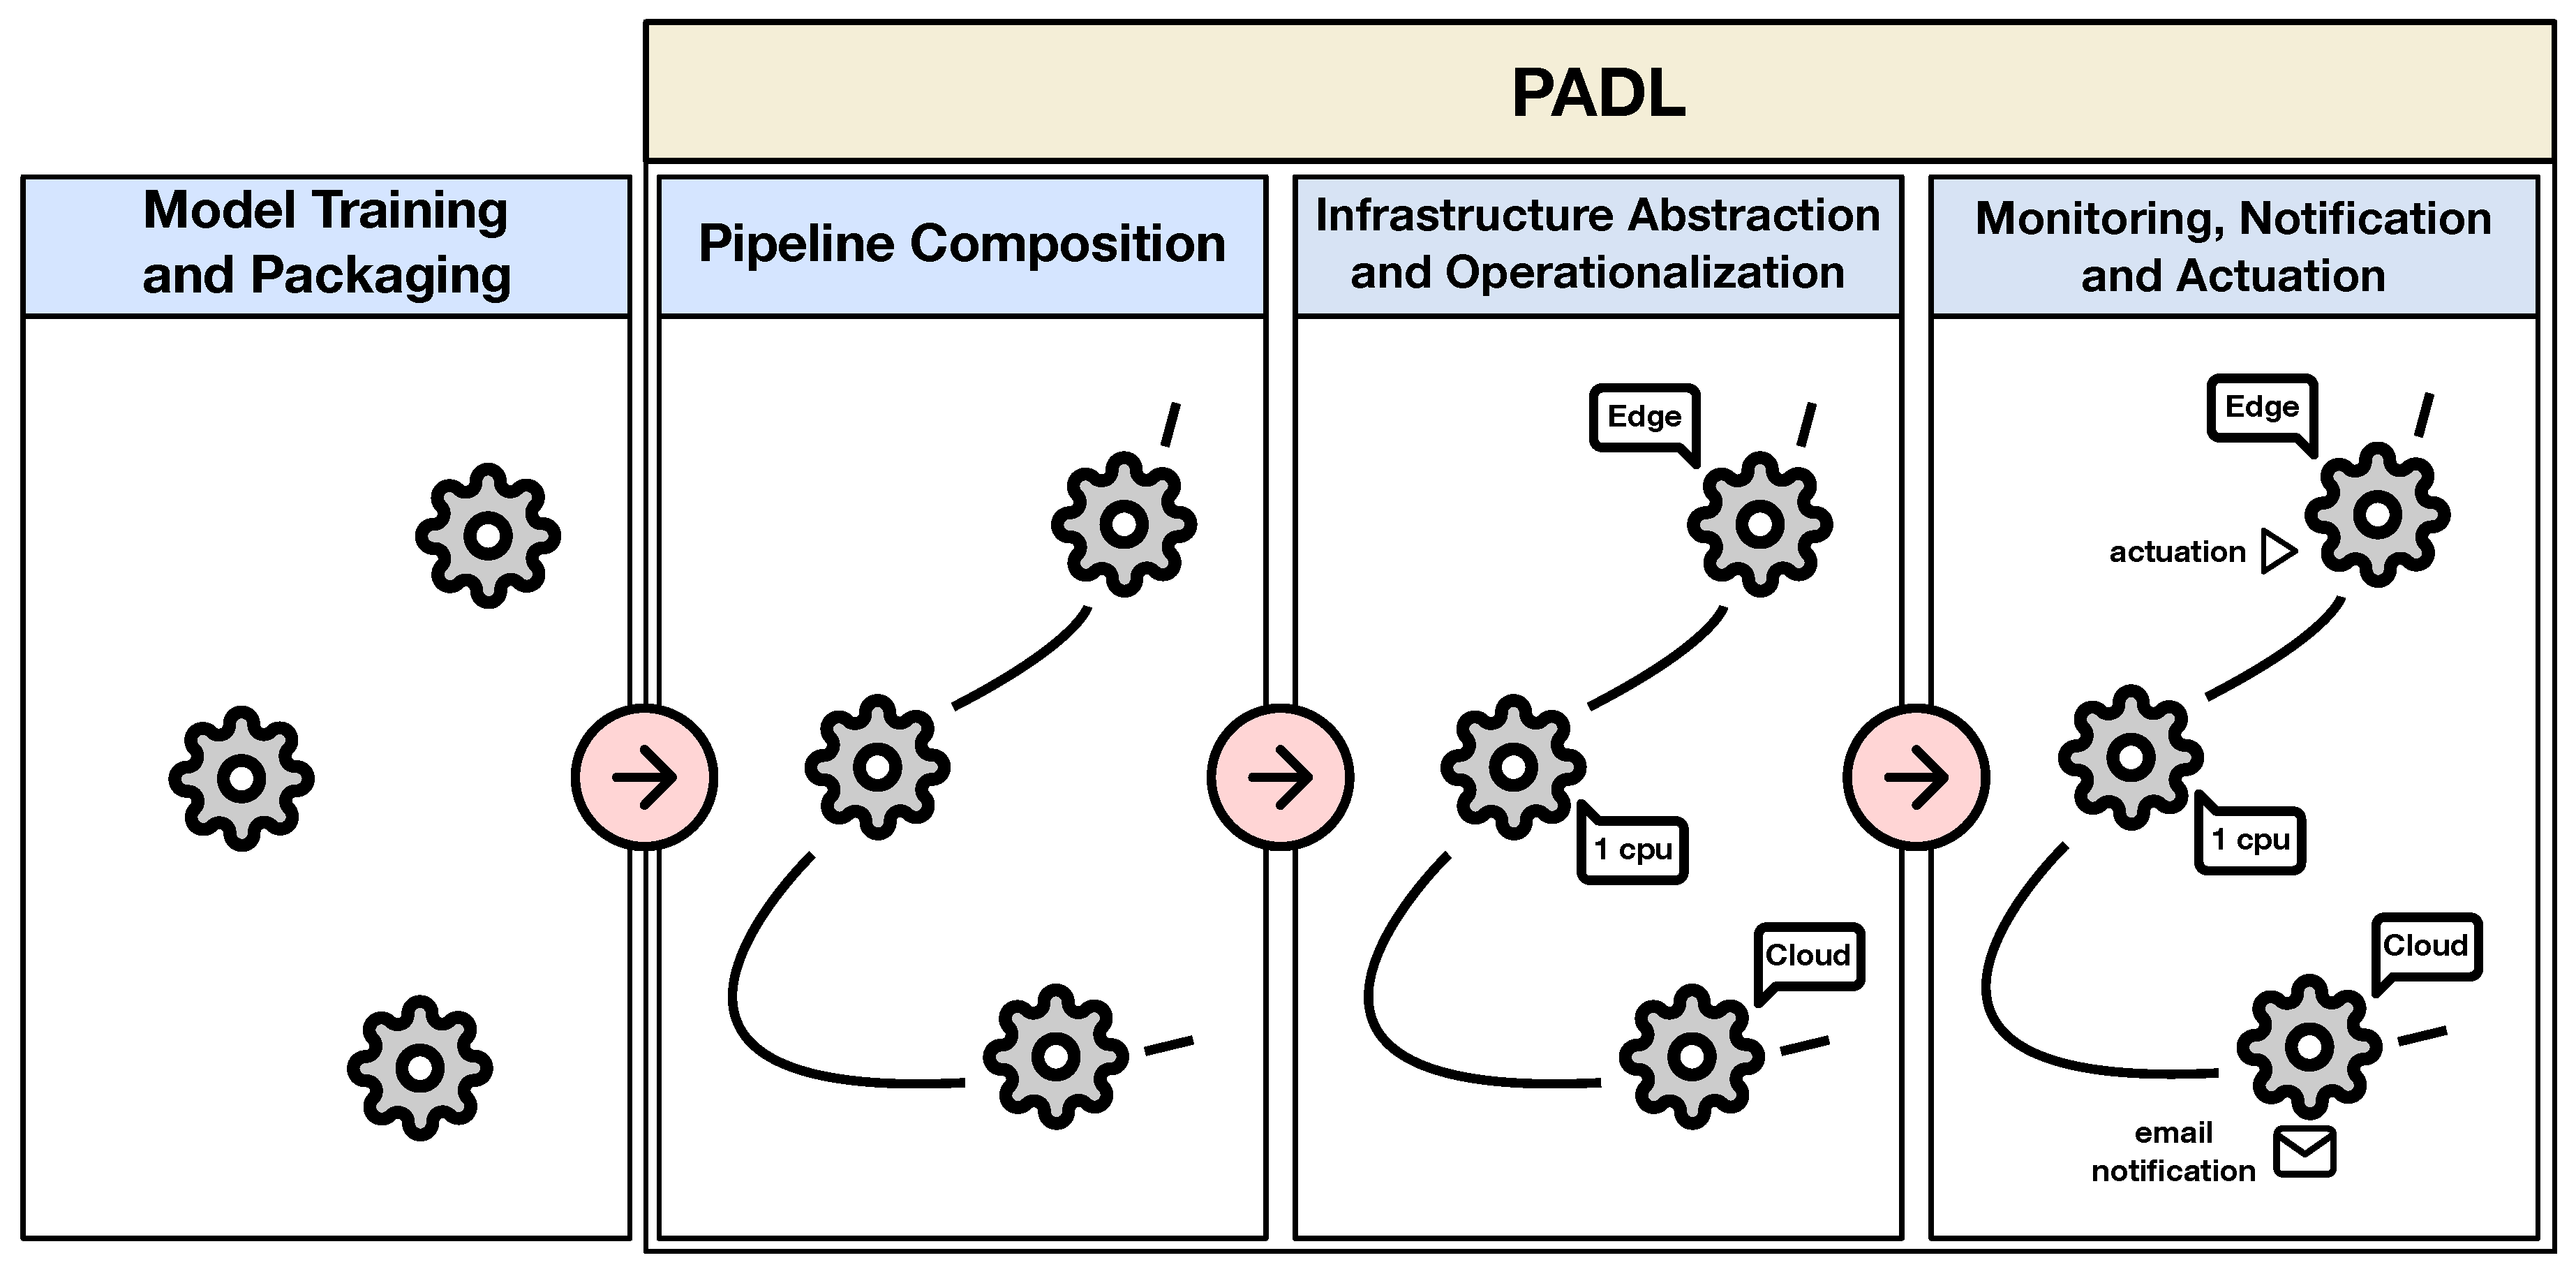
3. PADL Specification
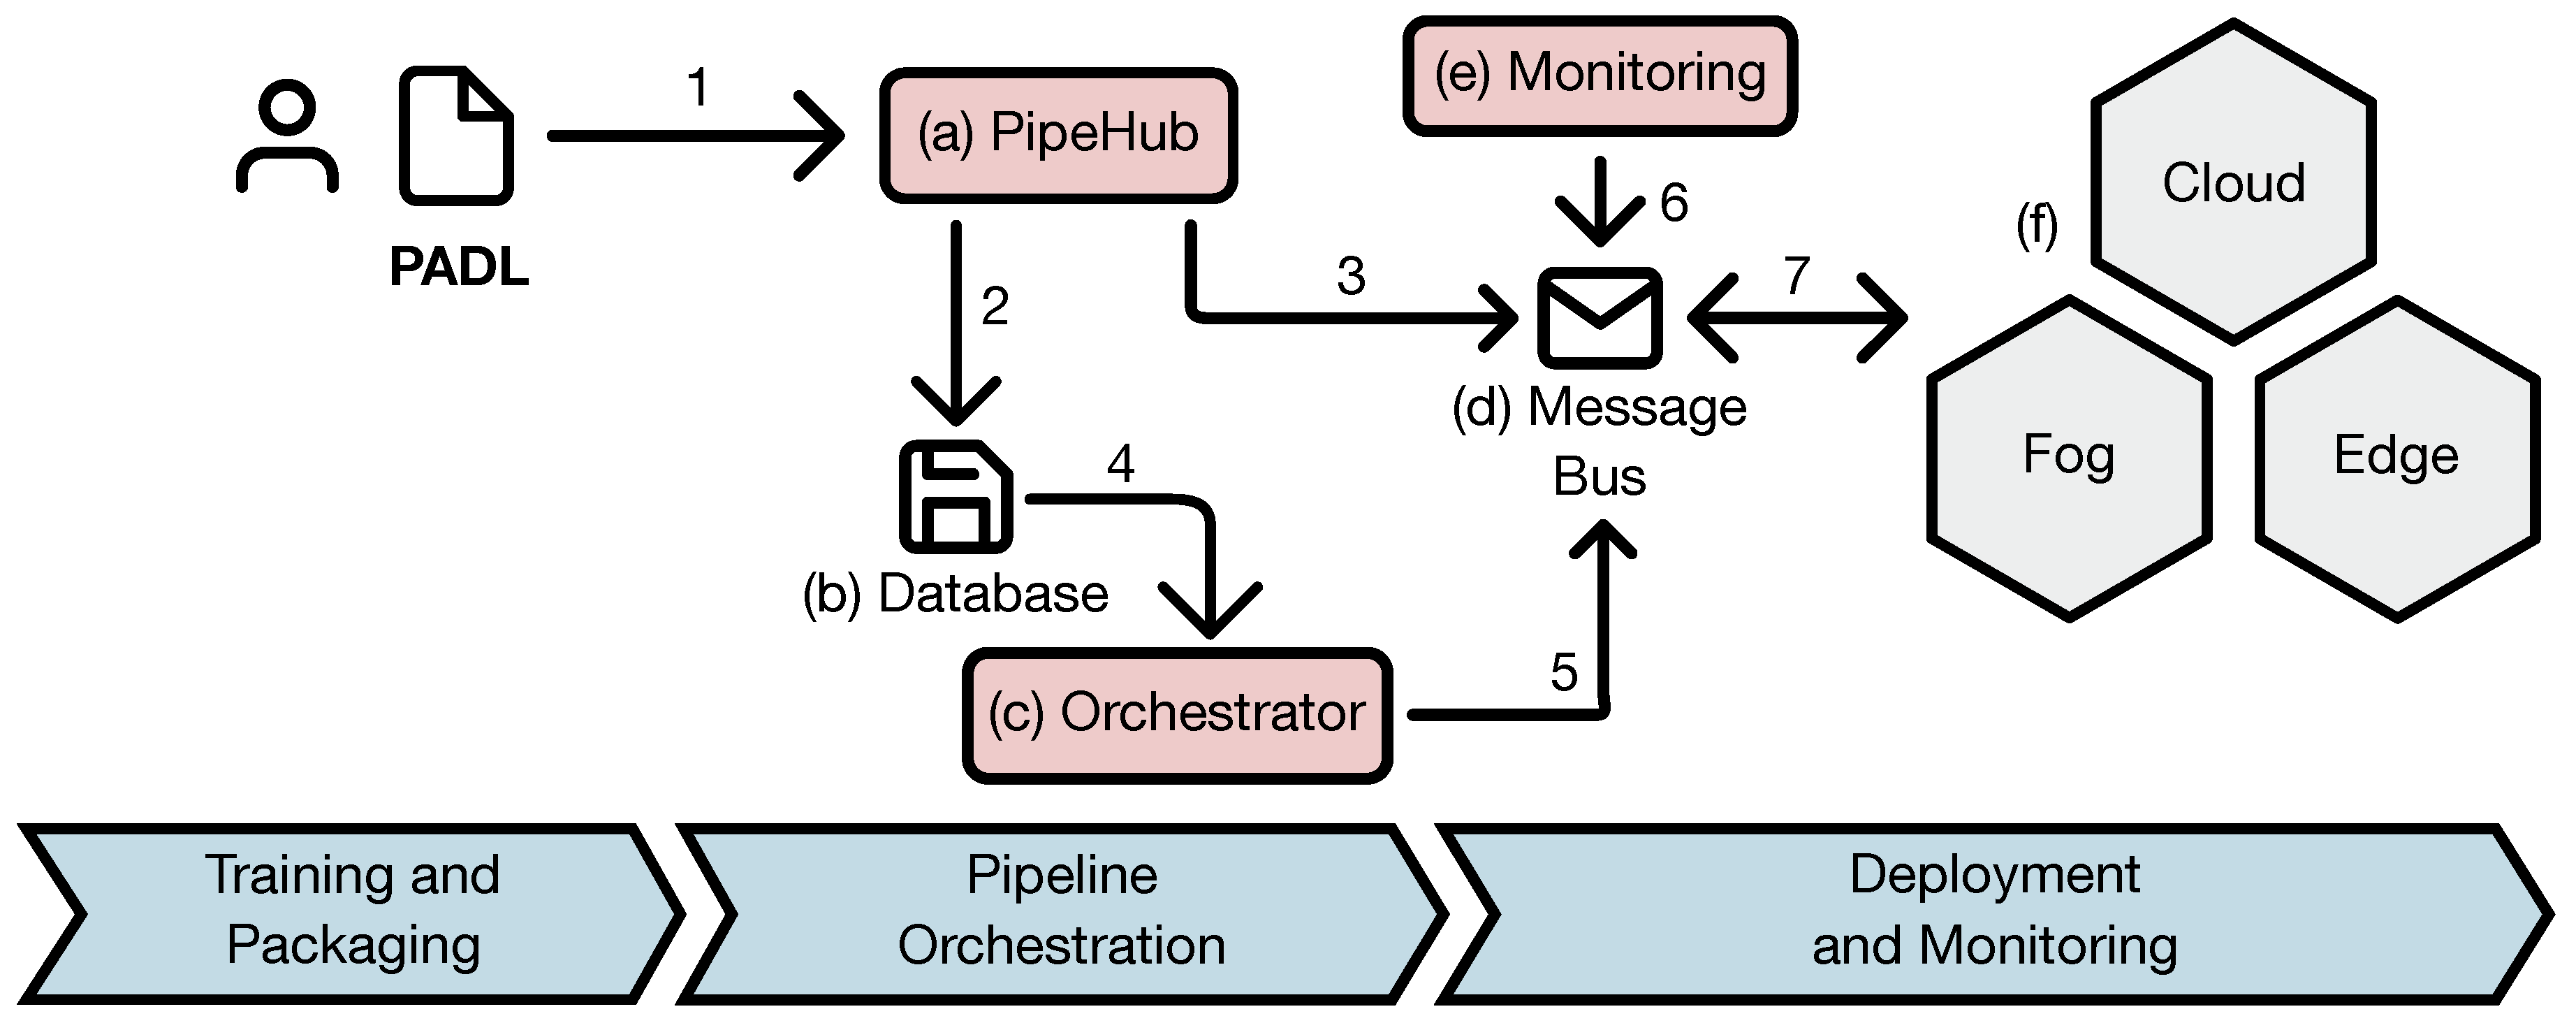
3.1. Ecosystem
3.2. Language Details and Application Preconditions
- It should aspire to become a standard for the definition of analytical process flows.
- It should help data analysts and domain experts overcome the technological barriers that prevent greater success in the operationalization of analytical processes.
- It must be expressive enough to allow the definition of analytical pipelines as a chain of processing stages, in which each stage represents a model and its characteristics.
- It must be able to be easily integrated into different analytical platforms and systems responsible for the operation of large analytical workloads.
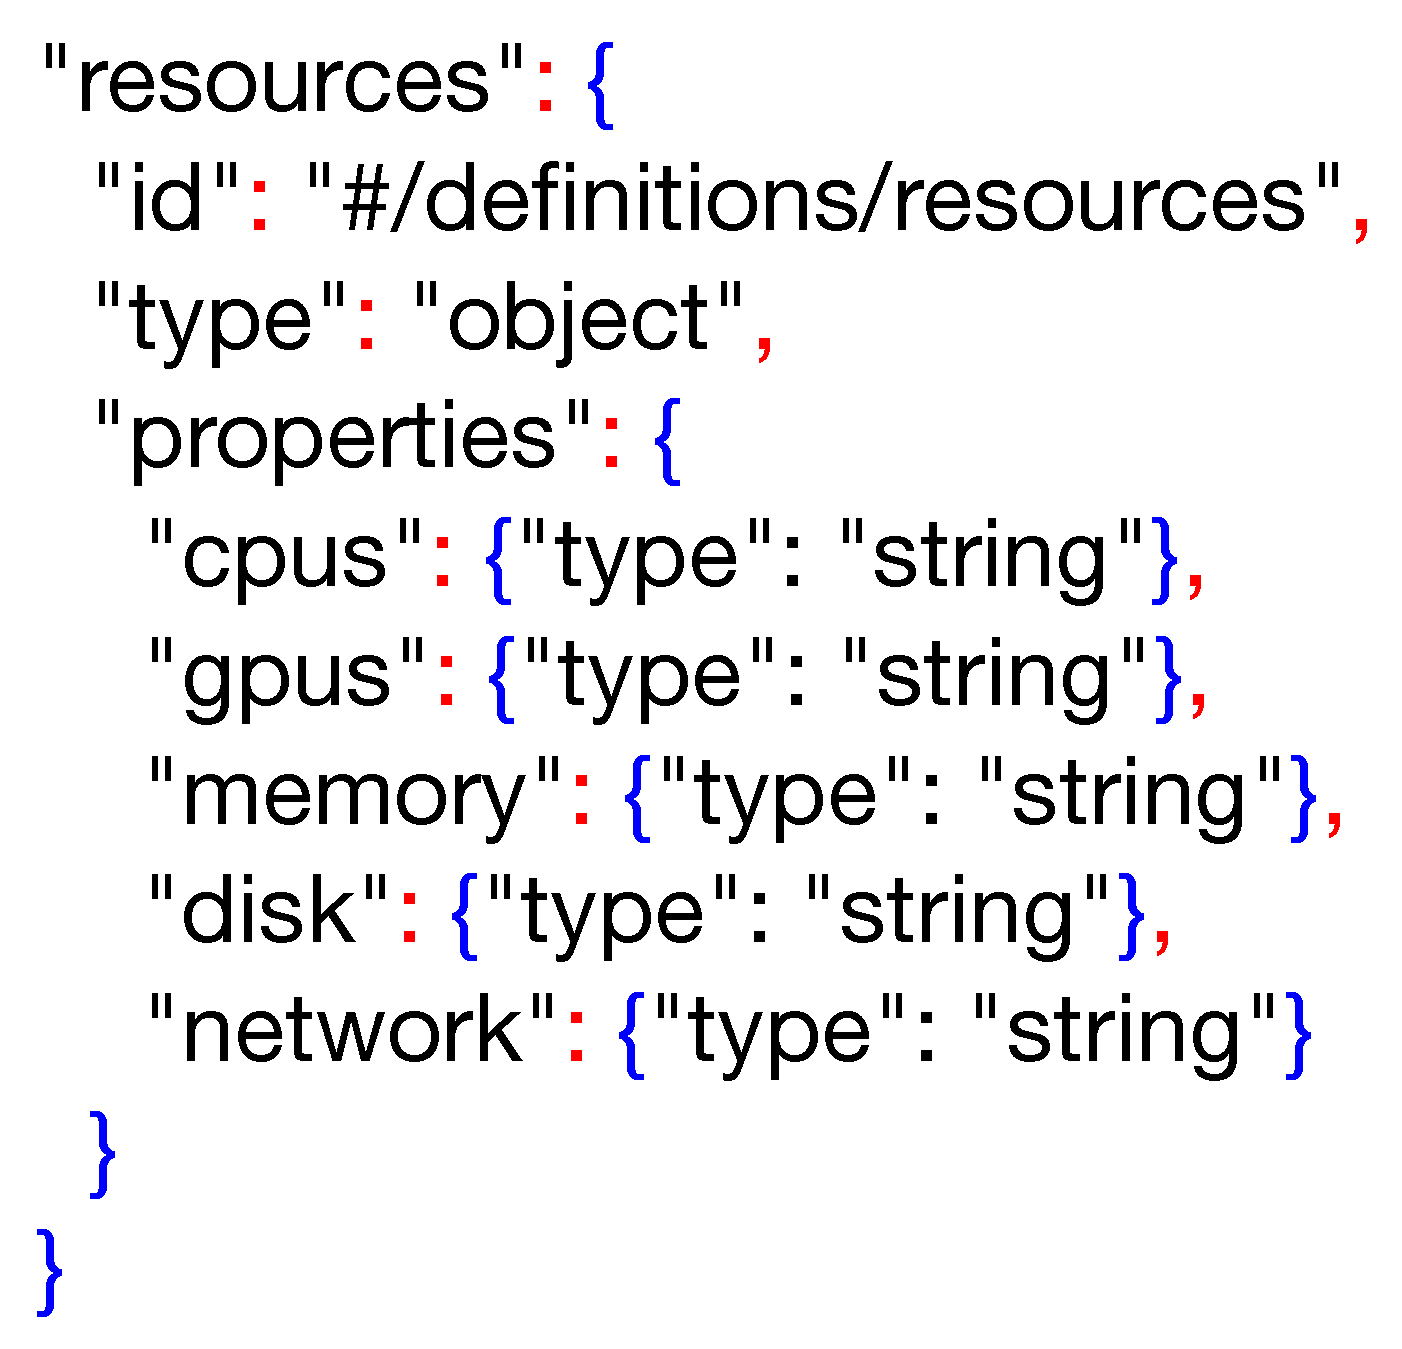
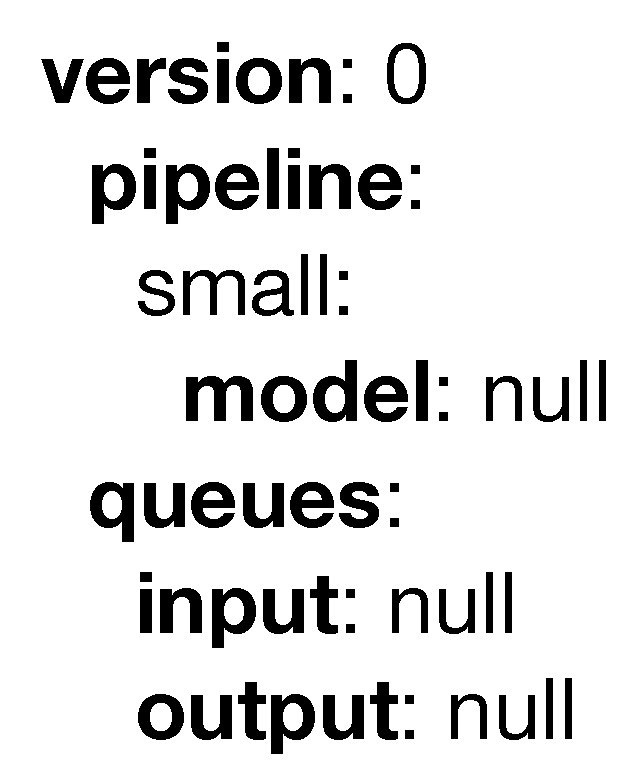
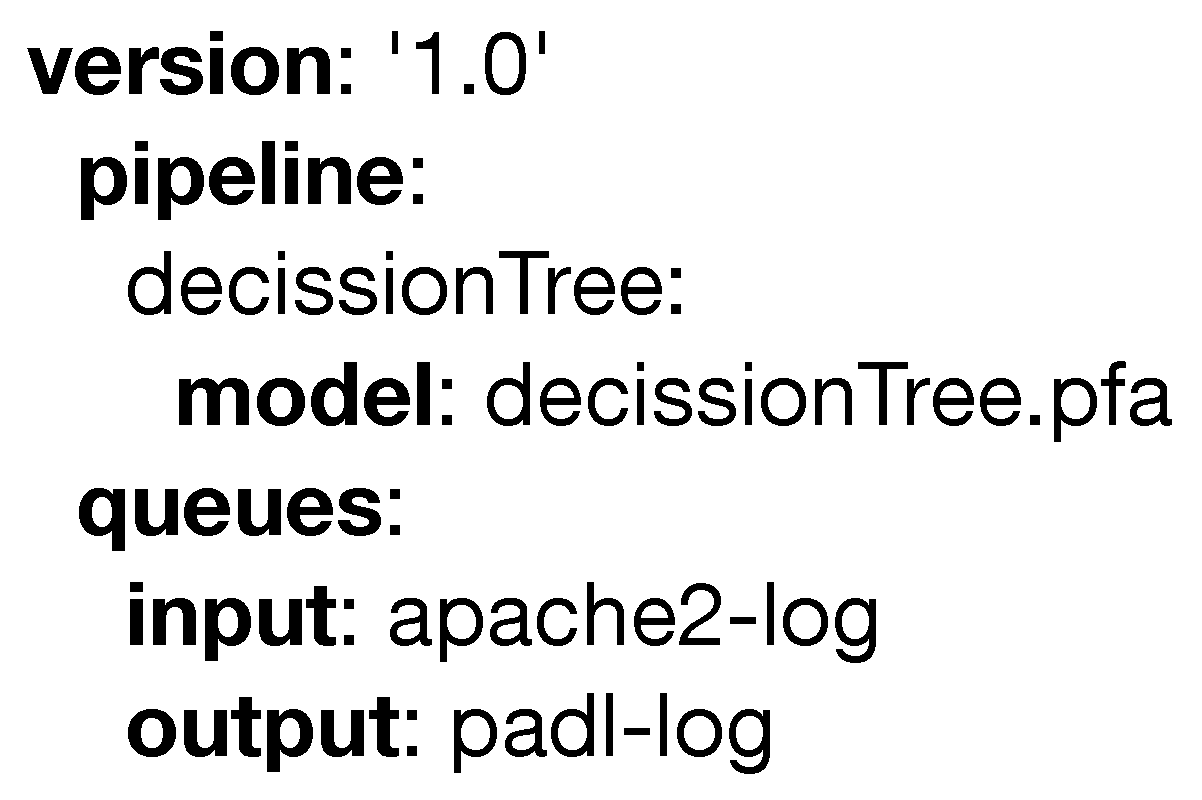
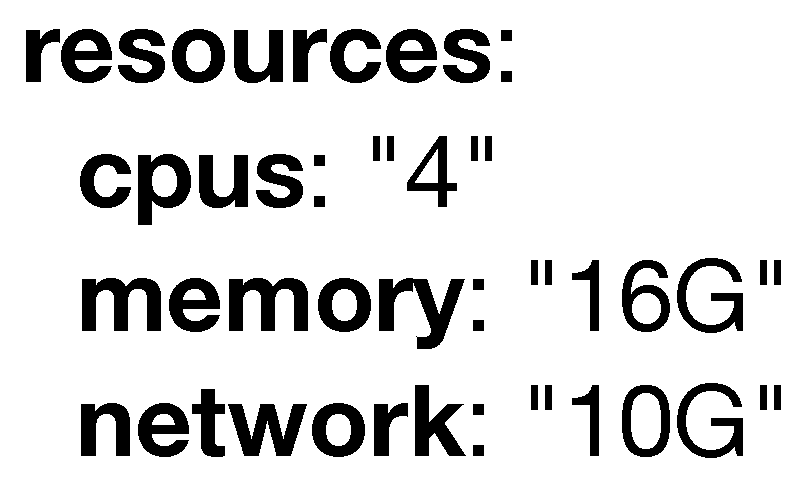
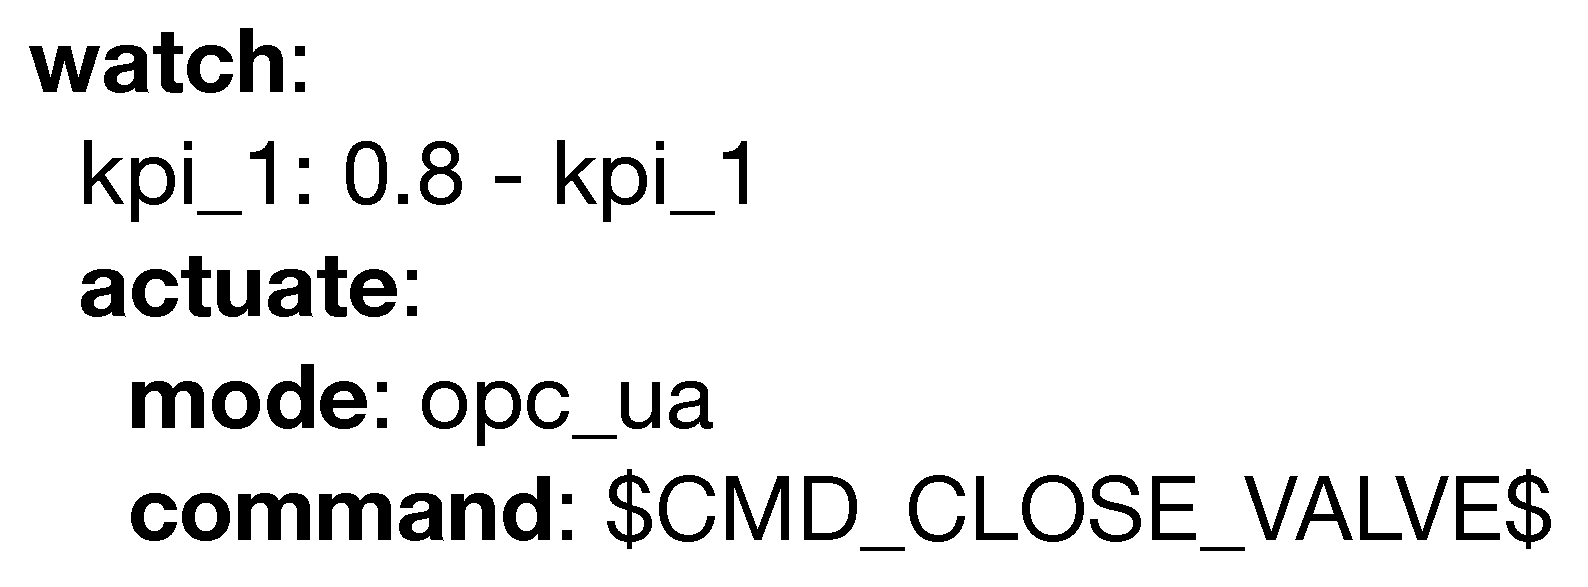
3.3. Language Syntax
4. PADL Implementation
4.1. Tools
4.1.1. PADLib
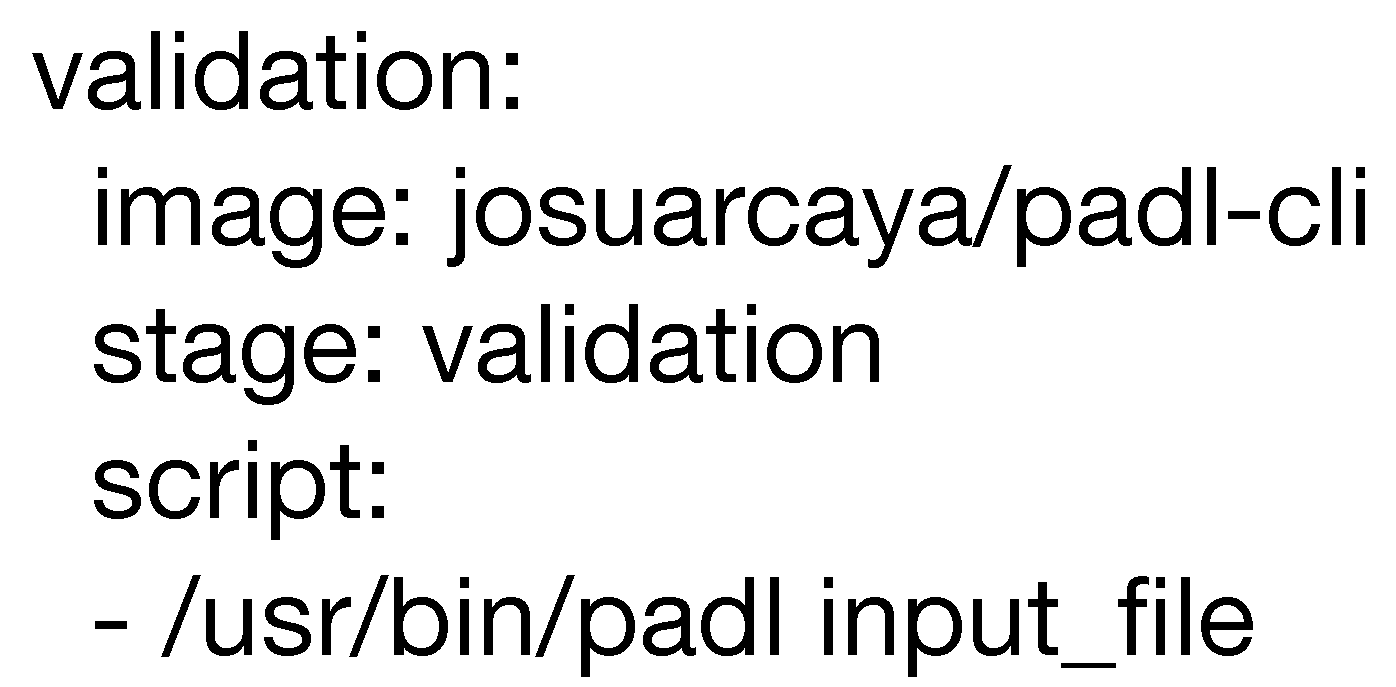
4.1.2. Command Line Utility
4.1.3. Web Lint
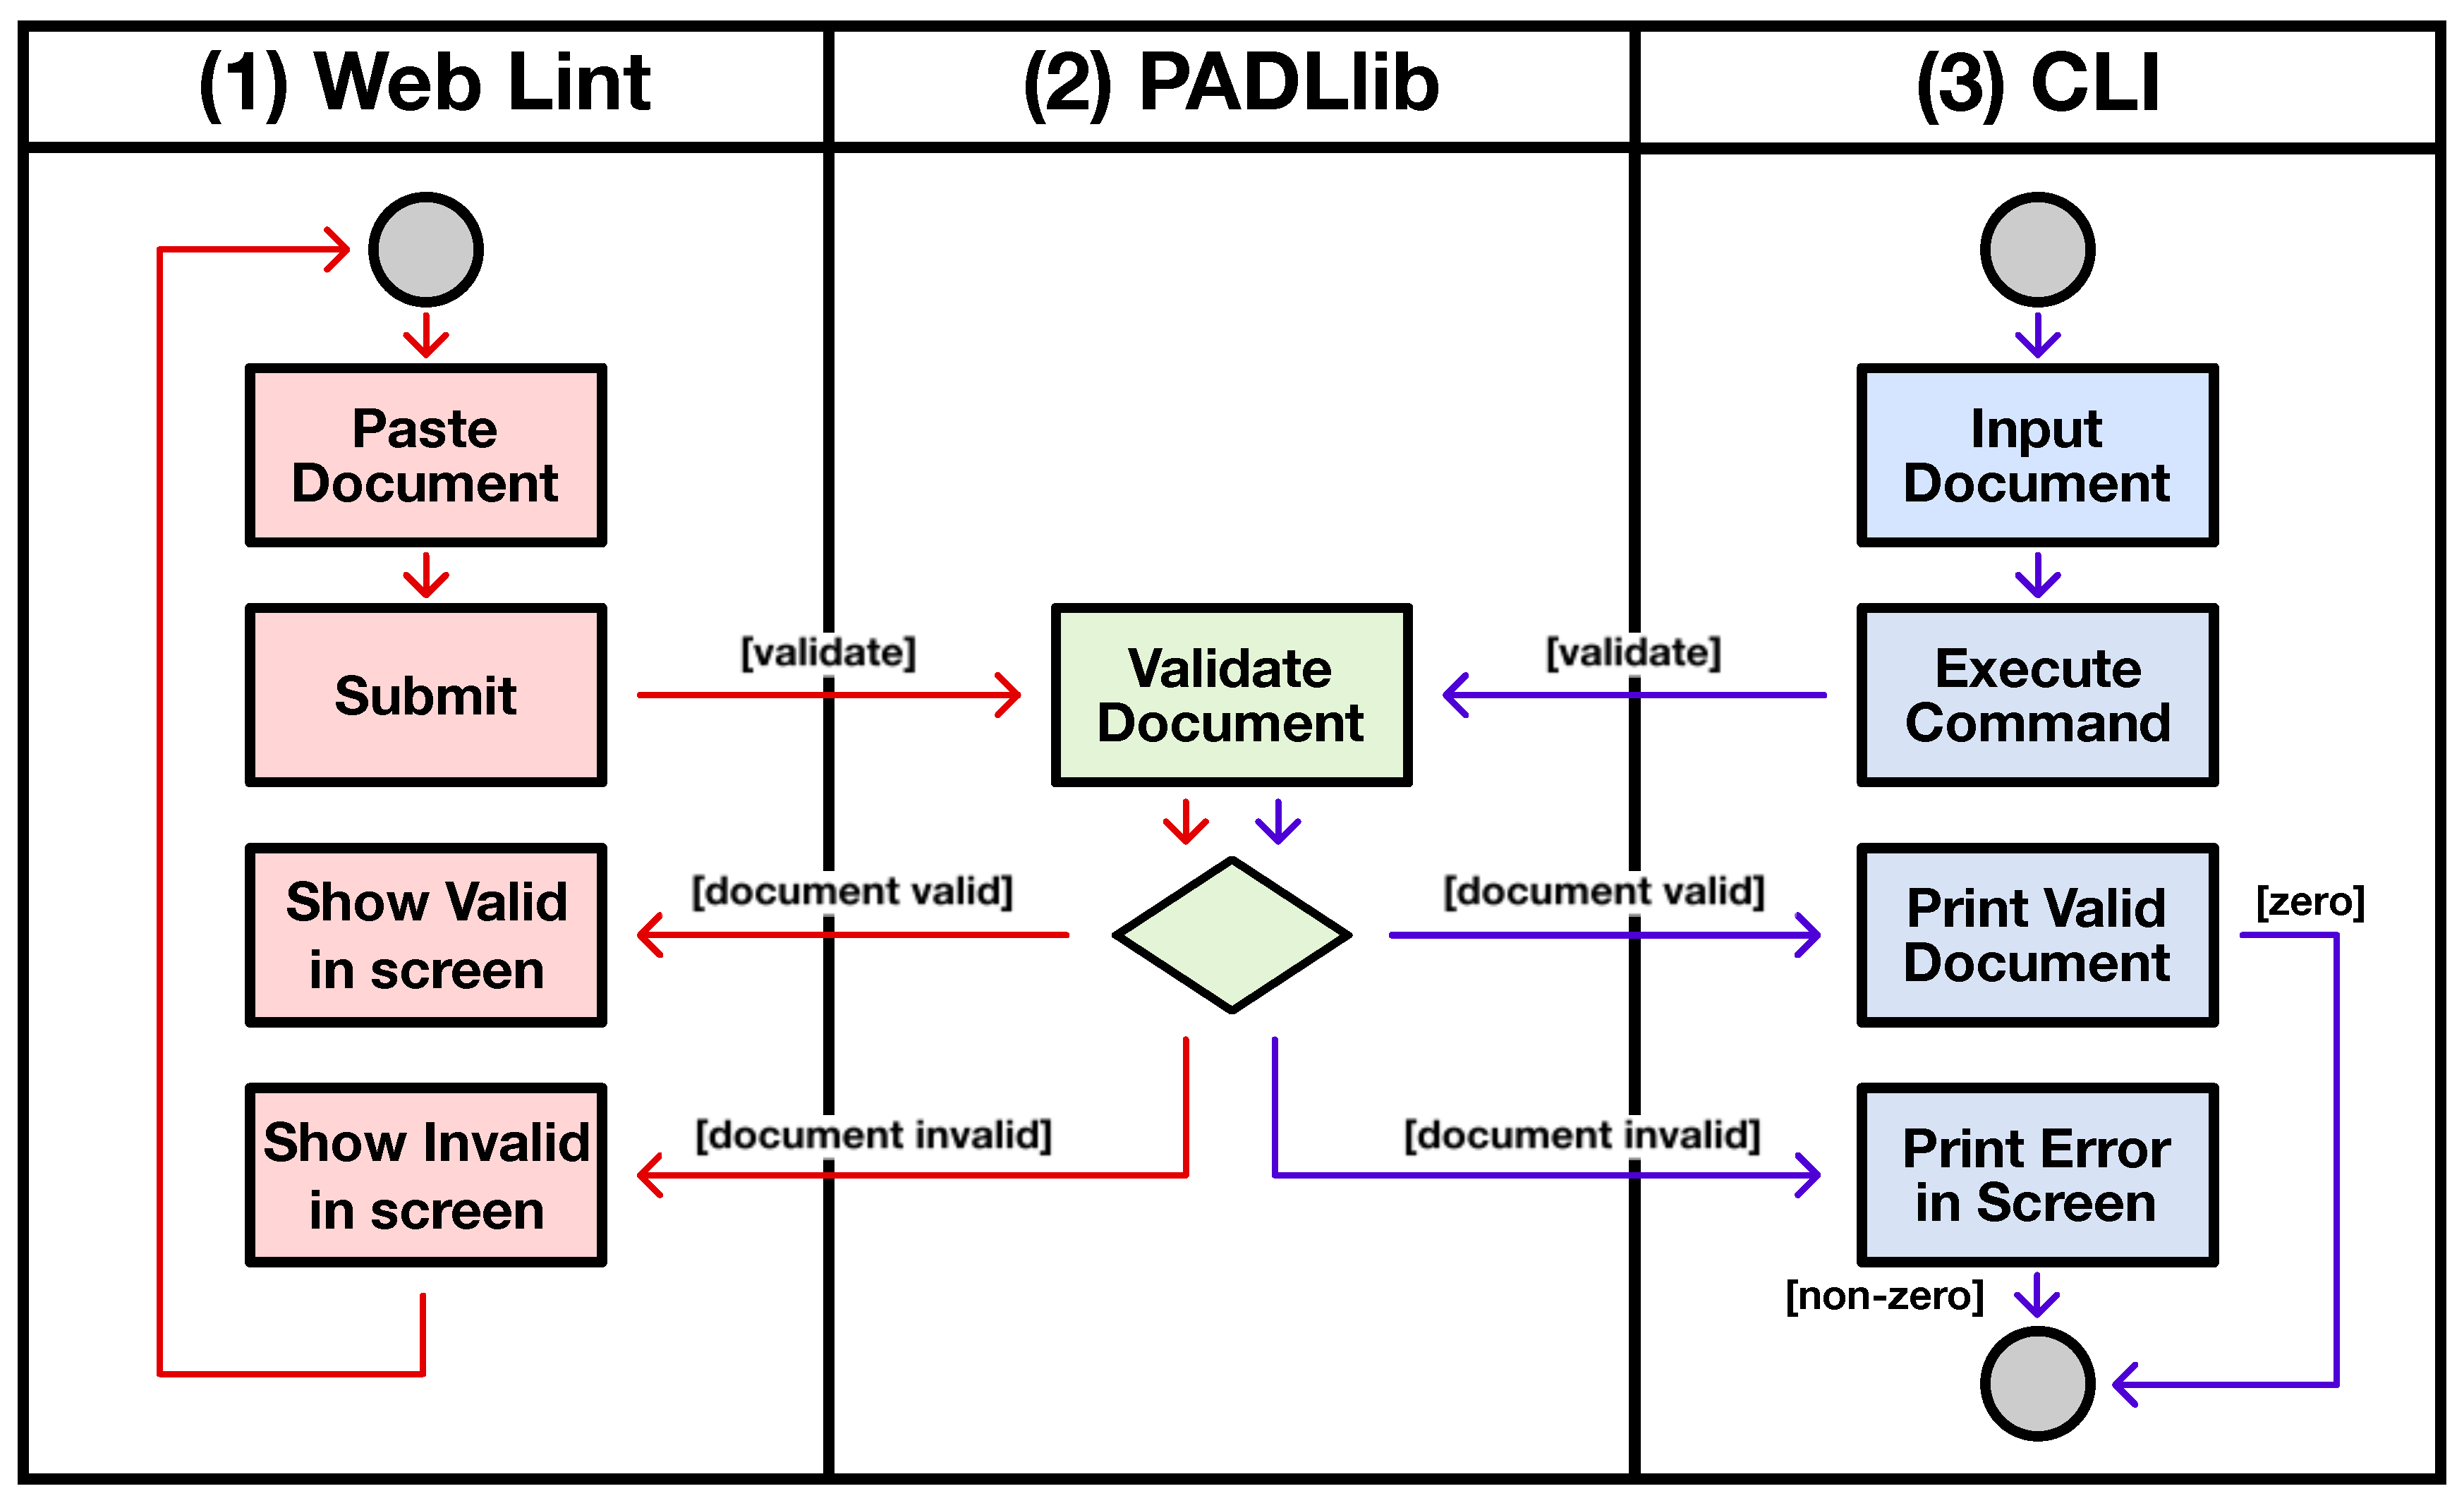
4.2. Delivery Flow
5. PADL in Cities
5.1. Use Case Selection
- Flood control: In this use case, the data are produced by many sensors (high volume) measuring the water level spread across the course of the river, all of them gathering data at very low frequencies (high velocity)
- Waste management: This use case includes multiple and heterogeneous sources of information, so the variety and volume of datasets can be the main problems. Among the types of data to consider, we find: city maps, geo-referenced traffic information, garbage collection points, and other aspects such as the social or consumption information of the inhabitants, which can be used for the processes of information crossing, optimization, or calculations of indicators.
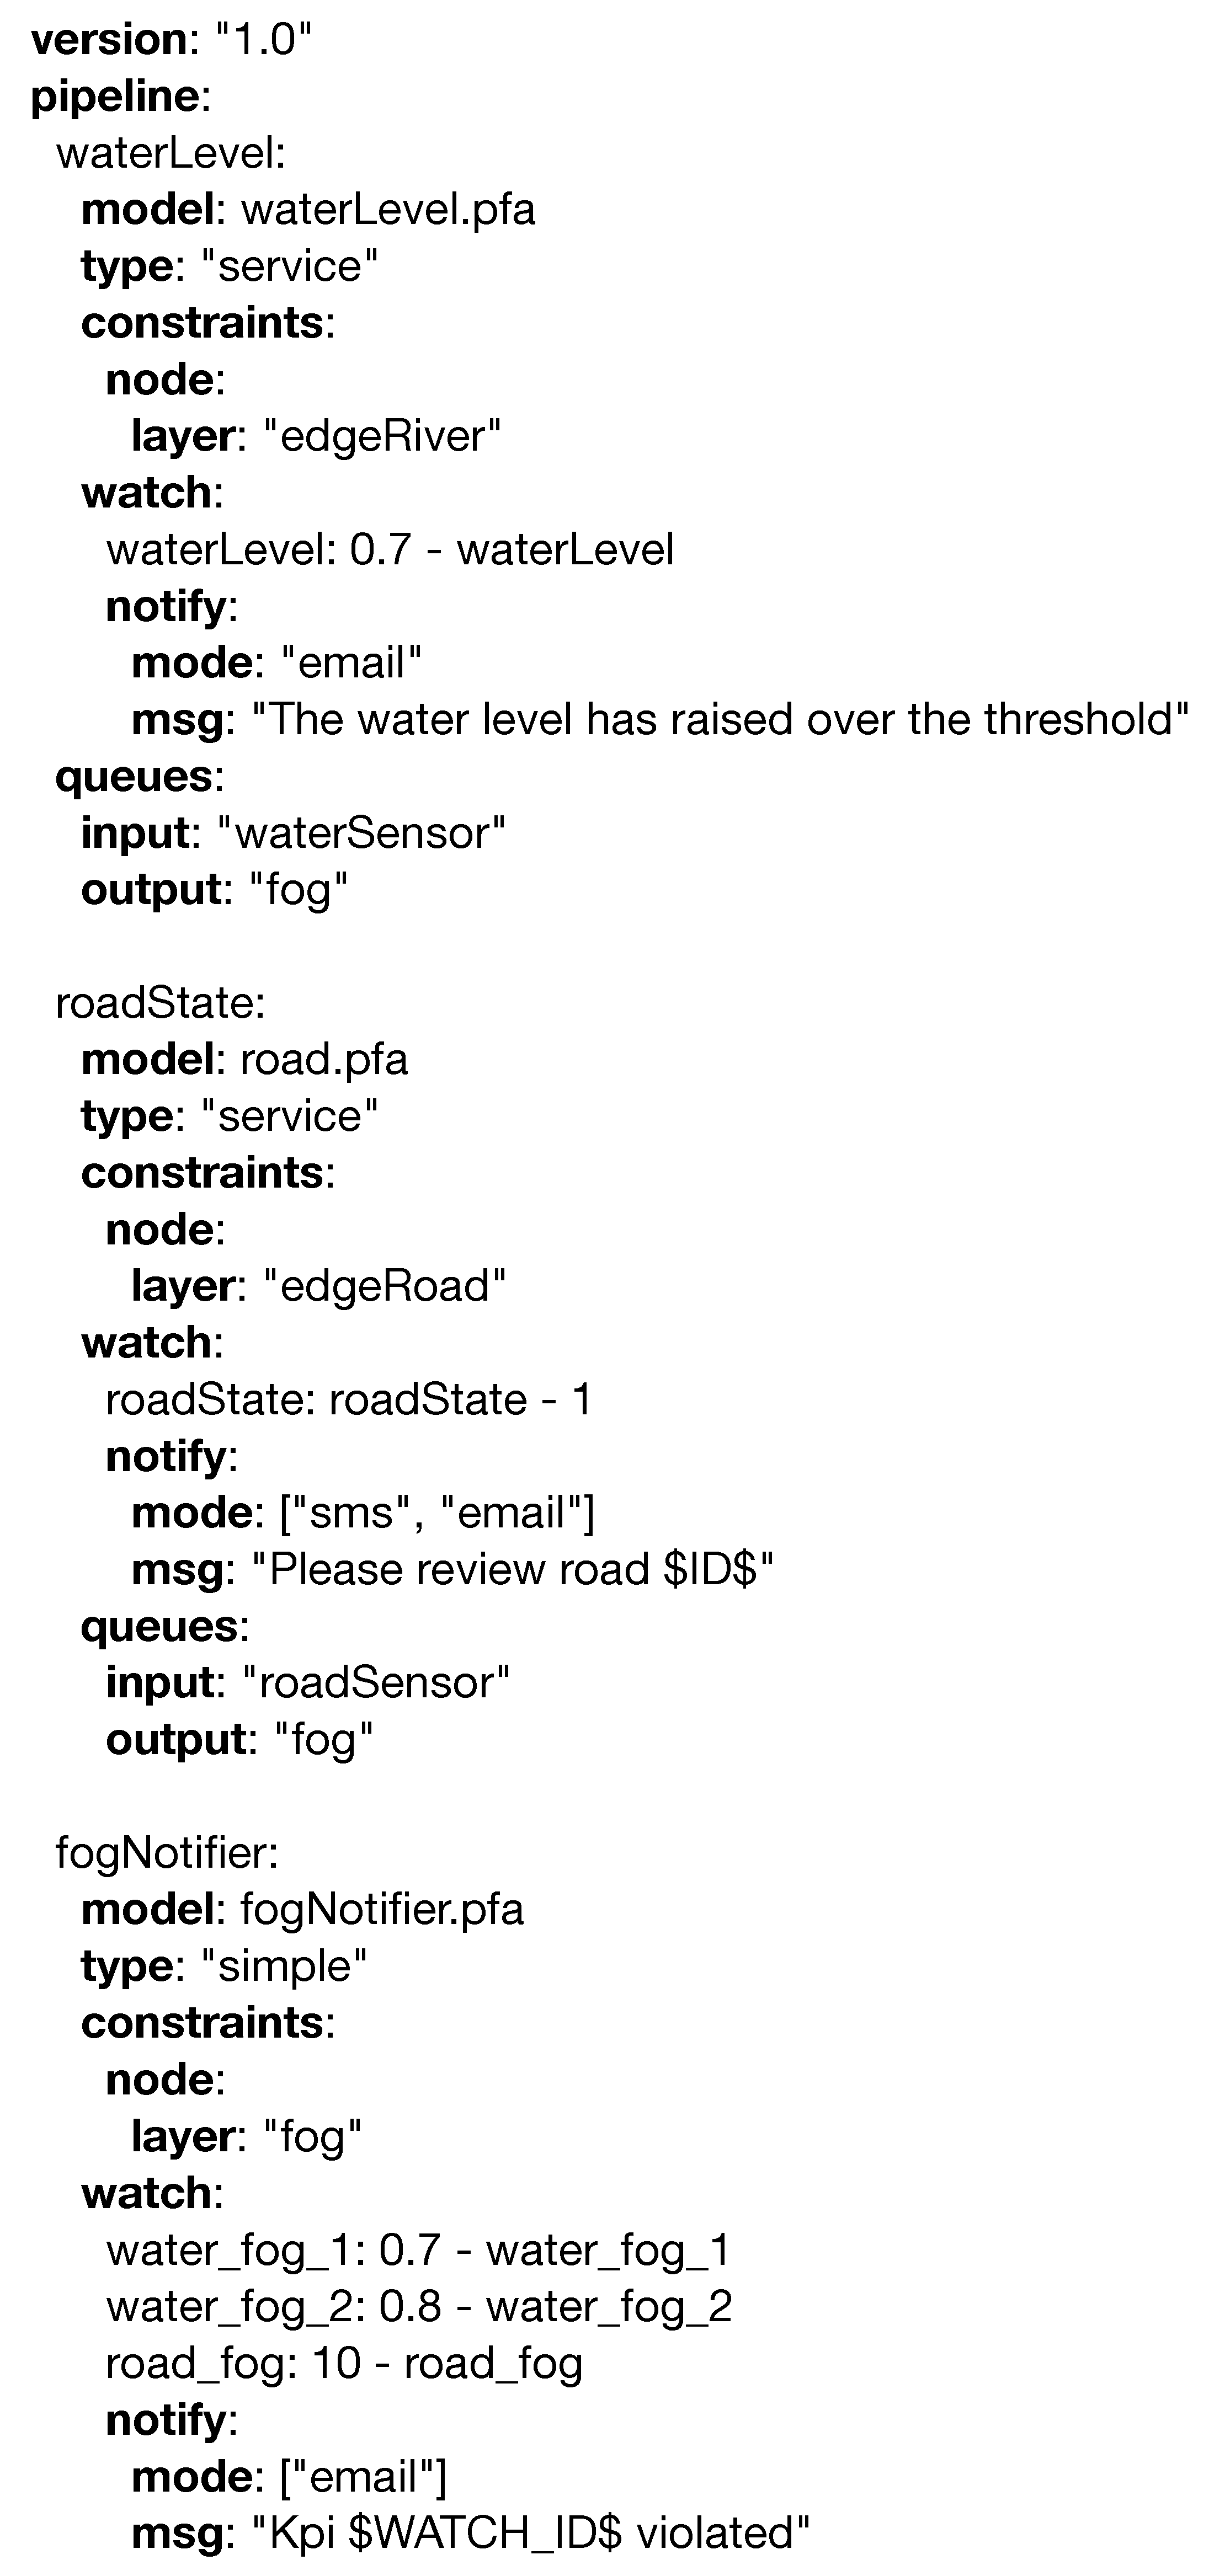
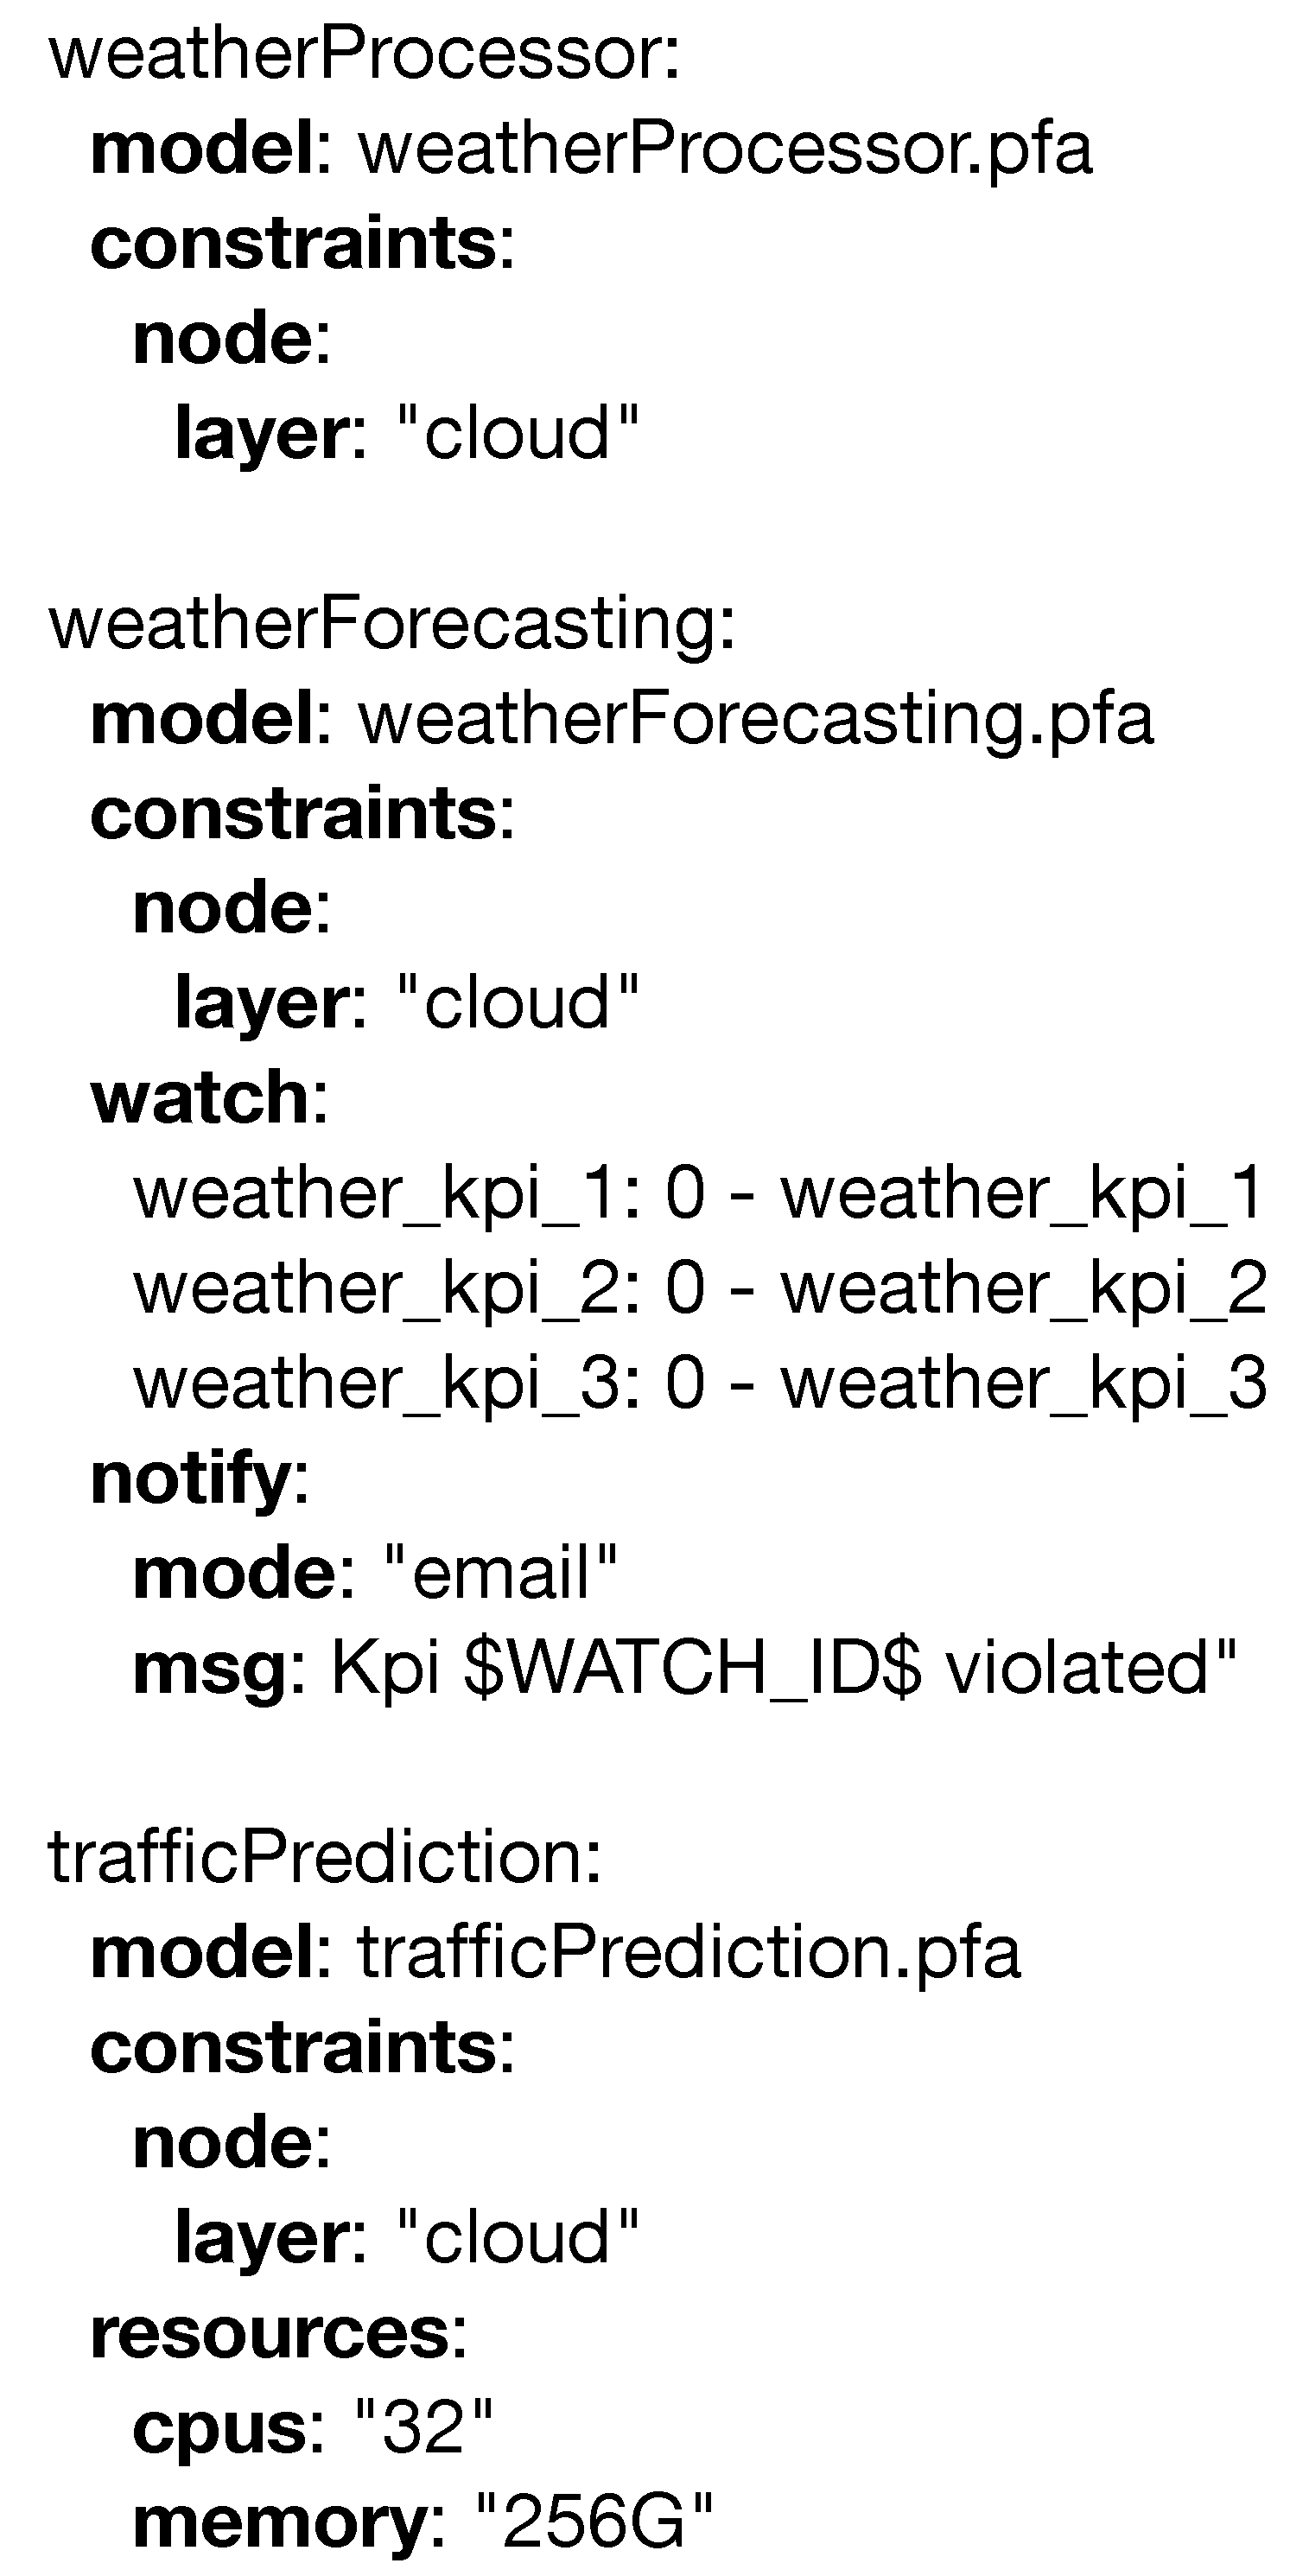
5.2. Flood Control Use Case
5.3. Waste Management Use Case
5.4. Use Case Discussion
- Criterion (1): We provide domain specific annotations for the appropriate deployment of each step in the pipeline, such as the measurement of the water level in the river in the first use case and being able to detect blocked roads with the cameras in the second one.
- Criterion (2): Monitorization, notification, and actuation are handled separately for each model. For example, in the second use case, the language enables the chance of monitoring and reporting a low fuel level for the waste truck.
- Criterion (3): We utilize technologies and smart devices already present in the use cases, like the ones used for reporting the river level in the water flood use case.
- Criterion (4): All the definitions of the use case analytic pipelines are covered in the PADL snippets in Section 5.2 and Section 5.3.
- Criterion (5): We do not require additional technologies other than the ones already in use by the city. For example, in the case of waste management, cameras are the smart devices that are mainly used.
- Criterion (6): The different steps of the pipeline are deployed across the existing infrastructure and can be operationalized independently. For example, in the waste management use case, analytic processing is distributed over the heterogeneous infrastructure: waste trucks, cameras, cloud servers.
- Criterion (7): The main dimensions of Big Data, volume, velocity, and variety, are highly represented in the use case. In the flood control use case, the most stringent restriction is the speed of data collection and analysis for the flooding alerts in real time. In the waste management use case, on the other hand, the volume and heterogeneity of the data sources are the greatest challenges, due to the need to cross-reference information to draw valuable conclusions that help optimize waste management.
6. Conclusions and Future Work
Author Contributions
Funding
Conflicts of Interest
References
- Al Nuaimi, E.; Al Neyadi, H.; Mohamed, N.; Al-Jaroodi, J. Applications of big data to smart cities. J. Internet Serv. Appl. 2015, 6, 25. [Google Scholar] [CrossRef] [Green Version]
- Lim, C.; Kim, K.J.; Maglio, P.P. Smart cities with big data: Reference models, challenges, and considerations. Cities 2018, 82, 86–99. [Google Scholar] [CrossRef]
- Khan, Z.; Anjum, A.; Kiani, S.L. Cloud based big data analytics for smart future cities. In Proceedings of the 2013 IEEE/ACM 6th International Conference on Utility and Cloud Computing, Dresden, Germany, 9–12 December 2013; pp. 381–386. [Google Scholar]
- Patrono, L.; Atzori, L.; Šolić, P.; Mongiello, M.; Almeida, A. Challenges to be addressed to realize Internet of Things solutions for smart environments. Future Gener. Comput. Syst. 2019, 111, 873–878. [Google Scholar] [CrossRef]
- Navidi, A.; Khatami, F.A.S. Energy management and planning in smart cities. CIRED-Open Access Proc. J. 2017, 2017, 2723–2725. [Google Scholar] [CrossRef]
- Sobnath, D.; Rehman, I.U.; Nasralla, M.M. Smart cities to improve mobility and quality of life of the visually impaired. In Technological Trends in Improved Mobility of the Visually Impaired; Springer: Cham, Switzerland, 2020; pp. 3–28. [Google Scholar]
- Tang, B.; Chen, Z.; Hefferman, G.; Pei, S.; Wei, T.; He, H.; Yang, Q. Incorporating intelligence in fog computing for big data analysis in smart cities. IEEE Trans. Ind. Inform. 2017, 13, 2140–2150. [Google Scholar] [CrossRef]
- Díaz-de-Arcaya, J.; Miñón, R.; Torre-Bastida, A.I.; Del Ser, J.; Almeida, A. PADL: A Language for the Operationalization of Distributed Analytical Pipelines over Edge/Fog Computing Environments. In Proceedings of the 5th International Conference on Smart and Sustainable Technologies, Split, Croatia, 23–26 September 2020. [Google Scholar]
- Arasteh, H.; Hosseinnezhad, V.; Loia, V.; Tommasetti, A.; Troisi, O.; Shafie-Khah, M.; Siano, P. Iot-based smart cities: A survey. In Proceedings of the 2016 IEEE 16th International Conference on Environment and Electrical Engineering (EEEIC), Florence, Italy, 7–10 June 2016; pp. 2–7. [Google Scholar] [CrossRef]
- Sánchez-Corcuera, R.; Nuñez-Marcos, A.; Sesma-Solance, J.; Bilbao-Jayo, A.; Mulero, R.; Zulaika, U.; Azkune, G.; Almeida, A. Smart cities survey: Technologies, application domains and challenges for the cities of the future. Int. J. Distrib. Sens. Netw. 2019, 15, 1550147719853984. [Google Scholar] [CrossRef] [Green Version]
- Khan, Z.; Anjum, A.; Soomro, K.; Tahir, M.A. Towards cloud based big data analytics for smart future cities. J. Cloud Comput. 2015, 4. [Google Scholar] [CrossRef] [Green Version]
- Hossain, M.K.; Meng, Q. A fine-scale spatial analytics of the assessment and mapping of buildings and population at different risk levels of urban flood. Land Use Policy 2020, 99, 104829. [Google Scholar] [CrossRef]
- Rathore, M.M.; Ahmad, A.; Paul, A.; Rho, S. Urban planning and building smart cities based on the Internet of Things using Big Data analytics. Comput. Netw. 2016, 101, 63–80. [Google Scholar] [CrossRef]
- Aguilera, U.; Peña, O.; Belmonte, O.; López-de Ipiña, D. Citizen-centric data services for smarter cities. Future Gener. Comput. Syst. 2017, 76, 234–247. [Google Scholar] [CrossRef] [Green Version]
- Lopez-Novoa, U.; Morgan, J.; Jones, K.; Rana, O.; Edwards, T.; Grigoletto, F. Enabling Citizen Science in Rural Environments with IoT and Mobile Technologies. In Proceedings of the IoT ’19, Bilbao, Spain, 22–25 October 2019; pp. 50–56. [Google Scholar]
- Du, J.; Zhu, Q.; Shi, Y.; Wang, Q.; Lin, Y.; Zhao, D. Cognition digital twins for personalized information systems of smart cities: Proof of concept. J. Manag. Eng. 2020, 36, 04019052. [Google Scholar] [CrossRef]
- Cerchecci, M.; Luti, F.; Mecocci, A.; Parrino, S.; Peruzzi, G.; Pozzebon, A. A low power IoT sensor node architecture for waste management within smart cities context. Sensors 2018, 18, 1282. [Google Scholar] [CrossRef] [PubMed] [Green Version]
- Obinikpo, A.A.; Kantarci, B. Big sensed data meets deep learning for smarter health care in smart cities. J. Sens. Actuator Netw. 2017, 6, 26. [Google Scholar] [CrossRef] [Green Version]
- Wang, L.; Sng, D. Deep Learning Algorithms with Applications to Video Analytics for A Smart City: A Survey. arXiv 2015, arXiv:1512.03131. [Google Scholar]
- Saggi, M.K.; Jain, S. A survey towards an integration of big data analytics to big insights for value-creation. Inf. Process. Manag. 2018, 54, 758–790. [Google Scholar] [CrossRef]
- Lavalle, A.; Teruel, M.A.; Maté, A.; Trujillo, J. Improving Sustainability of Smart Cities through Visualization Techniques for Big Data from IoT Devices. Sustainability 2020, 12, 5595. [Google Scholar] [CrossRef]
- Vergis, S.; Komianos, V.; Tsoumanis, G.; Tsipis, A.; Oikonomou, K. A Low-Cost Vehicular Traffic Monitoring System Using Fog Computing. Smart Cities 2020, 3, 8. [Google Scholar] [CrossRef] [Green Version]
- Tekouabou, S.C.K.; Cherif, W.; Silkan, H. Improving parking availability prediction in smart cities with IoT and ensemble-based model. J. King Saud Univ. -Comput. Inf. Sci. 2020. [Google Scholar] [CrossRef]
- Hîrţan, L.A.; Dobre, C.; González-Vélez, H. Blockchain-based reputation for intelligent transportation systems. Sensors 2020, 20, 791. [Google Scholar] [CrossRef] [Green Version]
- Zaharia, M.; Chen, A.; Davidson, A.; Ghodsi, A.; Hong, S.A.; Konwinski, A.; Murching, S.; Nykodym, T.; Ogilvie, P.; Parkhe, M.; et al. Accelerating the Machine Learning Lifecycle with MLflow. IEEE Data Eng. Bull. 2018, 41, 39–45. [Google Scholar]
- Lee, Y.; Scolari, A.; Chun, B.G.; Weimer, M.; Interlandi, M. From the Edge to the Cloud: Model Serving in ML.NET. IEEE Data Eng. Bull. 2018, 41, 46–53. [Google Scholar]
- Verma, A.; Pedrosa, L.; Korupolu, M.; Oppenheimer, D.; Tune, E.; Wilkes, J. Large-scale cluster management at Google with Borg. In Proceedings of the Tenth European Conference on Computer Systems, Bordeaux, France, 21–24 April 2015; pp. 1–17. [Google Scholar]
- Foundation, C.N.C. Official Kubernetes Website. 2020. Available online: https://kubernetes.io (accessed on 20 November 2020).
- Hykes, S. Docker Swarm Engine. Available online: https://docs.docker.com/engine/swarm/ (accessed on 13 September 2020).
- Guazzelli, A.; Zeller, M.; Lin, W.C.; Williams, G. PMML: An open standard for sharing models. R. J. 2009, 1, 60–65. [Google Scholar] [CrossRef] [Green Version]
- Pivarski, J.; Bennett, C.; Grossman, R.L. Deploying analytics with the portable format for analytics (PFA). In Proceedings of the 22nd ACM SIGKDD International Conference on Knowledge Discovery and Data Mining, San Francisco, CA, USA, 13–17 August 2016; pp. 579–588. [Google Scholar]
- Zaharia, M.; Xin, R.S.; Wendell, P.; Das, T.; Armbrust, M.; Dave, A.; Meng, X.; Rosen, J.; Venkataraman, S.; Franklin, M.J.; et al. Apache spark: A unified engine for big data processing. Commun. ACM 2016, 59, 56–65. [Google Scholar] [CrossRef]
- Carbone, P.; Katsifodimos, A.; Ewen, S.; Markl, V.; Haridi, S.; Tzoumas, K. Apache flink: Stream and batch processing in a single engine. Bull. IEEE Comput. Soc. Tech. Comm. Data Eng. 2015, 36. [Google Scholar]
- Bhattacharjee, A.; Barve, Y.; Khare, S.; Bao, S.; Gokhale, A.; Damiano, T. Stratum: A serverless framework for the lifecycle management of machine learning-based data analytics tasks. In Proceedings of the 2019 {USENIX} Conference on Operational Machine Learning (OpML 19), Santa Clara, CA, USA, 20 May 2019; pp. 59–61. [Google Scholar]
- García, Á.L.; De Lucas, J.M.; Antonacci, M.; Zu Castell, W.; David, M.; Hardt, M.; Iglesias, L.L.; Moltó, G.; Plociennik, M.; Tran, V.; et al. A Cloud-Based Framework for Machine Learning Workloads and Applications. IEEE Access 2020, 8, 18681–18692. [Google Scholar] [CrossRef]
- Zeeshan, A.A. Automating Everything as Code. In DevSecOps for. NET Core; Springer: Cham, Switzerland, 2020; pp. 109–162. [Google Scholar]
- YAML. Available online: https://yaml.org/ (accessed on 5 November 2020).
- Diaz-de Arcaya, J.; Miñon, R.; Torre-Bastida, A.I.; Del Ser, J.; Almeida, A. Official PADL Repository. 2020. Available online: https://github.com/josu-arcaya/padl (accessed on 24 November 2020).
- Díaz-de-Arcaya, J.; Miñon, R.; Torre-Bastida, A.I. Towards an architecture for big data analytics leveraging edge/fog paradigms. In Proceedings of the 13th European Conference on Software Architecture-Volume 2, Paris, France, 9–13 September 2019; pp. 173–176. [Google Scholar]
- Bormann, C.; Castellani, A.P.; Shelby, Z. Coap: An application protocol for billions of tiny internet nodes. IEEE Internet Comput. 2012, 16, 62–67. [Google Scholar] [CrossRef]
- Davenport, T.H.; Bean, R. Big Data and AI Executive Survey (2019); Tech. Rep.; NewVantage Partners (NVP): Boston, MA, USA, 2019. [Google Scholar]
- Oliphant, T. NumPy. 2020. Available online: https://numpy.org (accessed on 24 November 2020).
- McKinney, W. Pandas. 2020. Available online: https://pandas.pydata.org (accessed on 24 November 2020).
- Cournapeau, D. SciKit-learn. 2020. Available online: https://scikit-learn.org (accessed on 24 November 2020).
- Pezoa, F.; Reutter, J.L.; Suarez, F.; Ugarte, M.; Vrgoč, D. Foundations of JSON schema. In Proceedings of the 25th International Conference on World Wide Web, Montreal, QC, Canada, 11–15 May 2016; pp. 263–273. [Google Scholar]
- PADL-Cli. 2020. Available online: https://hub.docker.com/repository/docker/josuarcaya/padl-cli (accessed on 23 October 2020).
- Travis-Ci. 2020. Available online: https://travis-ci.org/ (accessed on 12 November 2020).
- JSONLint. 2020. Available online: https://jsonlint.com/ (accessed on 25 September 2020).
- YAMLLint. 2020. Available online: http://www.yamllint.com/ (accessed on 25 September 2020).
- PADL-Web. 2020. Available online: https://hub.docker.com/repository/docker/josuarcaya/padl-web (accessed on 10 August 2020).
- Rothkrantz, L. Flood control of the smart city Prague. In Proceedings of the 2016 Smart Cities Symposium Prague (SCSP), Prague, Czech Republic, 26–27 May 2016; pp. 1–7. [Google Scholar]
- Medvedev, A.; Fedchenkov, P.; Zaslavsky, A.; Anagnostopoulos, T.; Khoruzhnikov, S. Waste management as an IoT-enabled service in smart cities. In Internet of Things, Smart Spaces, and Next Generation Networks and Systems; Springer: Cham, Switzerland, 2015; pp. 104–115. [Google Scholar]


| Deployment Awareness | Analytics Oriented | Technology Agnostic | Text Based | Small Technological Footprint | Multilayer Awareness | |
|---|---|---|---|---|---|---|
| PADL | f | f | f | f | f | f |
| PFA | n | f | n | f | n | n |
| PMML | n | f | n | f | n | n |
| MLflow | s | f | s | n | f | n |
| ML.NET | s | f | n | n | n | n |
| Kubernetes | f | n | n | f | n | n |
| Docker Swarm | f | n | s | f | s | n |
| Stratum | s | f | s | n | s | n |
| DEEP-Hybrid-DataCloud | s | f | s | n | s | n |
| Deployment Awareness | Analytics Oriented | Technology Agnostic | Text Based | Small Technological Footprint | Multilayer Awareness | Big Data Dimensions | |
|---|---|---|---|---|---|---|---|
| Flood control | y | y | y | y | y | y | Volume and Velocity |
| Waste Management | y | y | - | y | y | y | Volume and Variety |
Publisher’s Note: MDPI stays neutral with regard to jurisdictional claims in published maps and institutional affiliations. |
© 2020 by the authors. Licensee MDPI, Basel, Switzerland. This article is an open access article distributed under the terms and conditions of the Creative Commons Attribution (CC BY) license (http://creativecommons.org/licenses/by/4.0/).
Share and Cite
Díaz-de-Arcaya, J.; Miñón, R.; Torre-Bastida, A.I.; Del Ser, J.; Almeida, A. PADL: A Modeling and Deployment Language for Advanced Analytical Services. Sensors 2020, 20, 6712. https://doi.org/10.3390/s20236712
Díaz-de-Arcaya J, Miñón R, Torre-Bastida AI, Del Ser J, Almeida A. PADL: A Modeling and Deployment Language for Advanced Analytical Services. Sensors. 2020; 20(23):6712. https://doi.org/10.3390/s20236712
Chicago/Turabian StyleDíaz-de-Arcaya, Josu, Raúl Miñón, Ana I. Torre-Bastida, Javier Del Ser, and Aitor Almeida. 2020. "PADL: A Modeling and Deployment Language for Advanced Analytical Services" Sensors 20, no. 23: 6712. https://doi.org/10.3390/s20236712
APA StyleDíaz-de-Arcaya, J., Miñón, R., Torre-Bastida, A. I., Del Ser, J., & Almeida, A. (2020). PADL: A Modeling and Deployment Language for Advanced Analytical Services. Sensors, 20(23), 6712. https://doi.org/10.3390/s20236712