An Architectural Multi-Agent System for a Pavement Monitoring System with Pothole Recognition in UAV Images

 ,
,  , ,
, ,  and
and 
Abstract
1. Introduction
2. Background
2.1. Drones
2.2. Pattern Detection in Images
2.3. YOLO
2.4. Multi-Agent
3. Proposed System
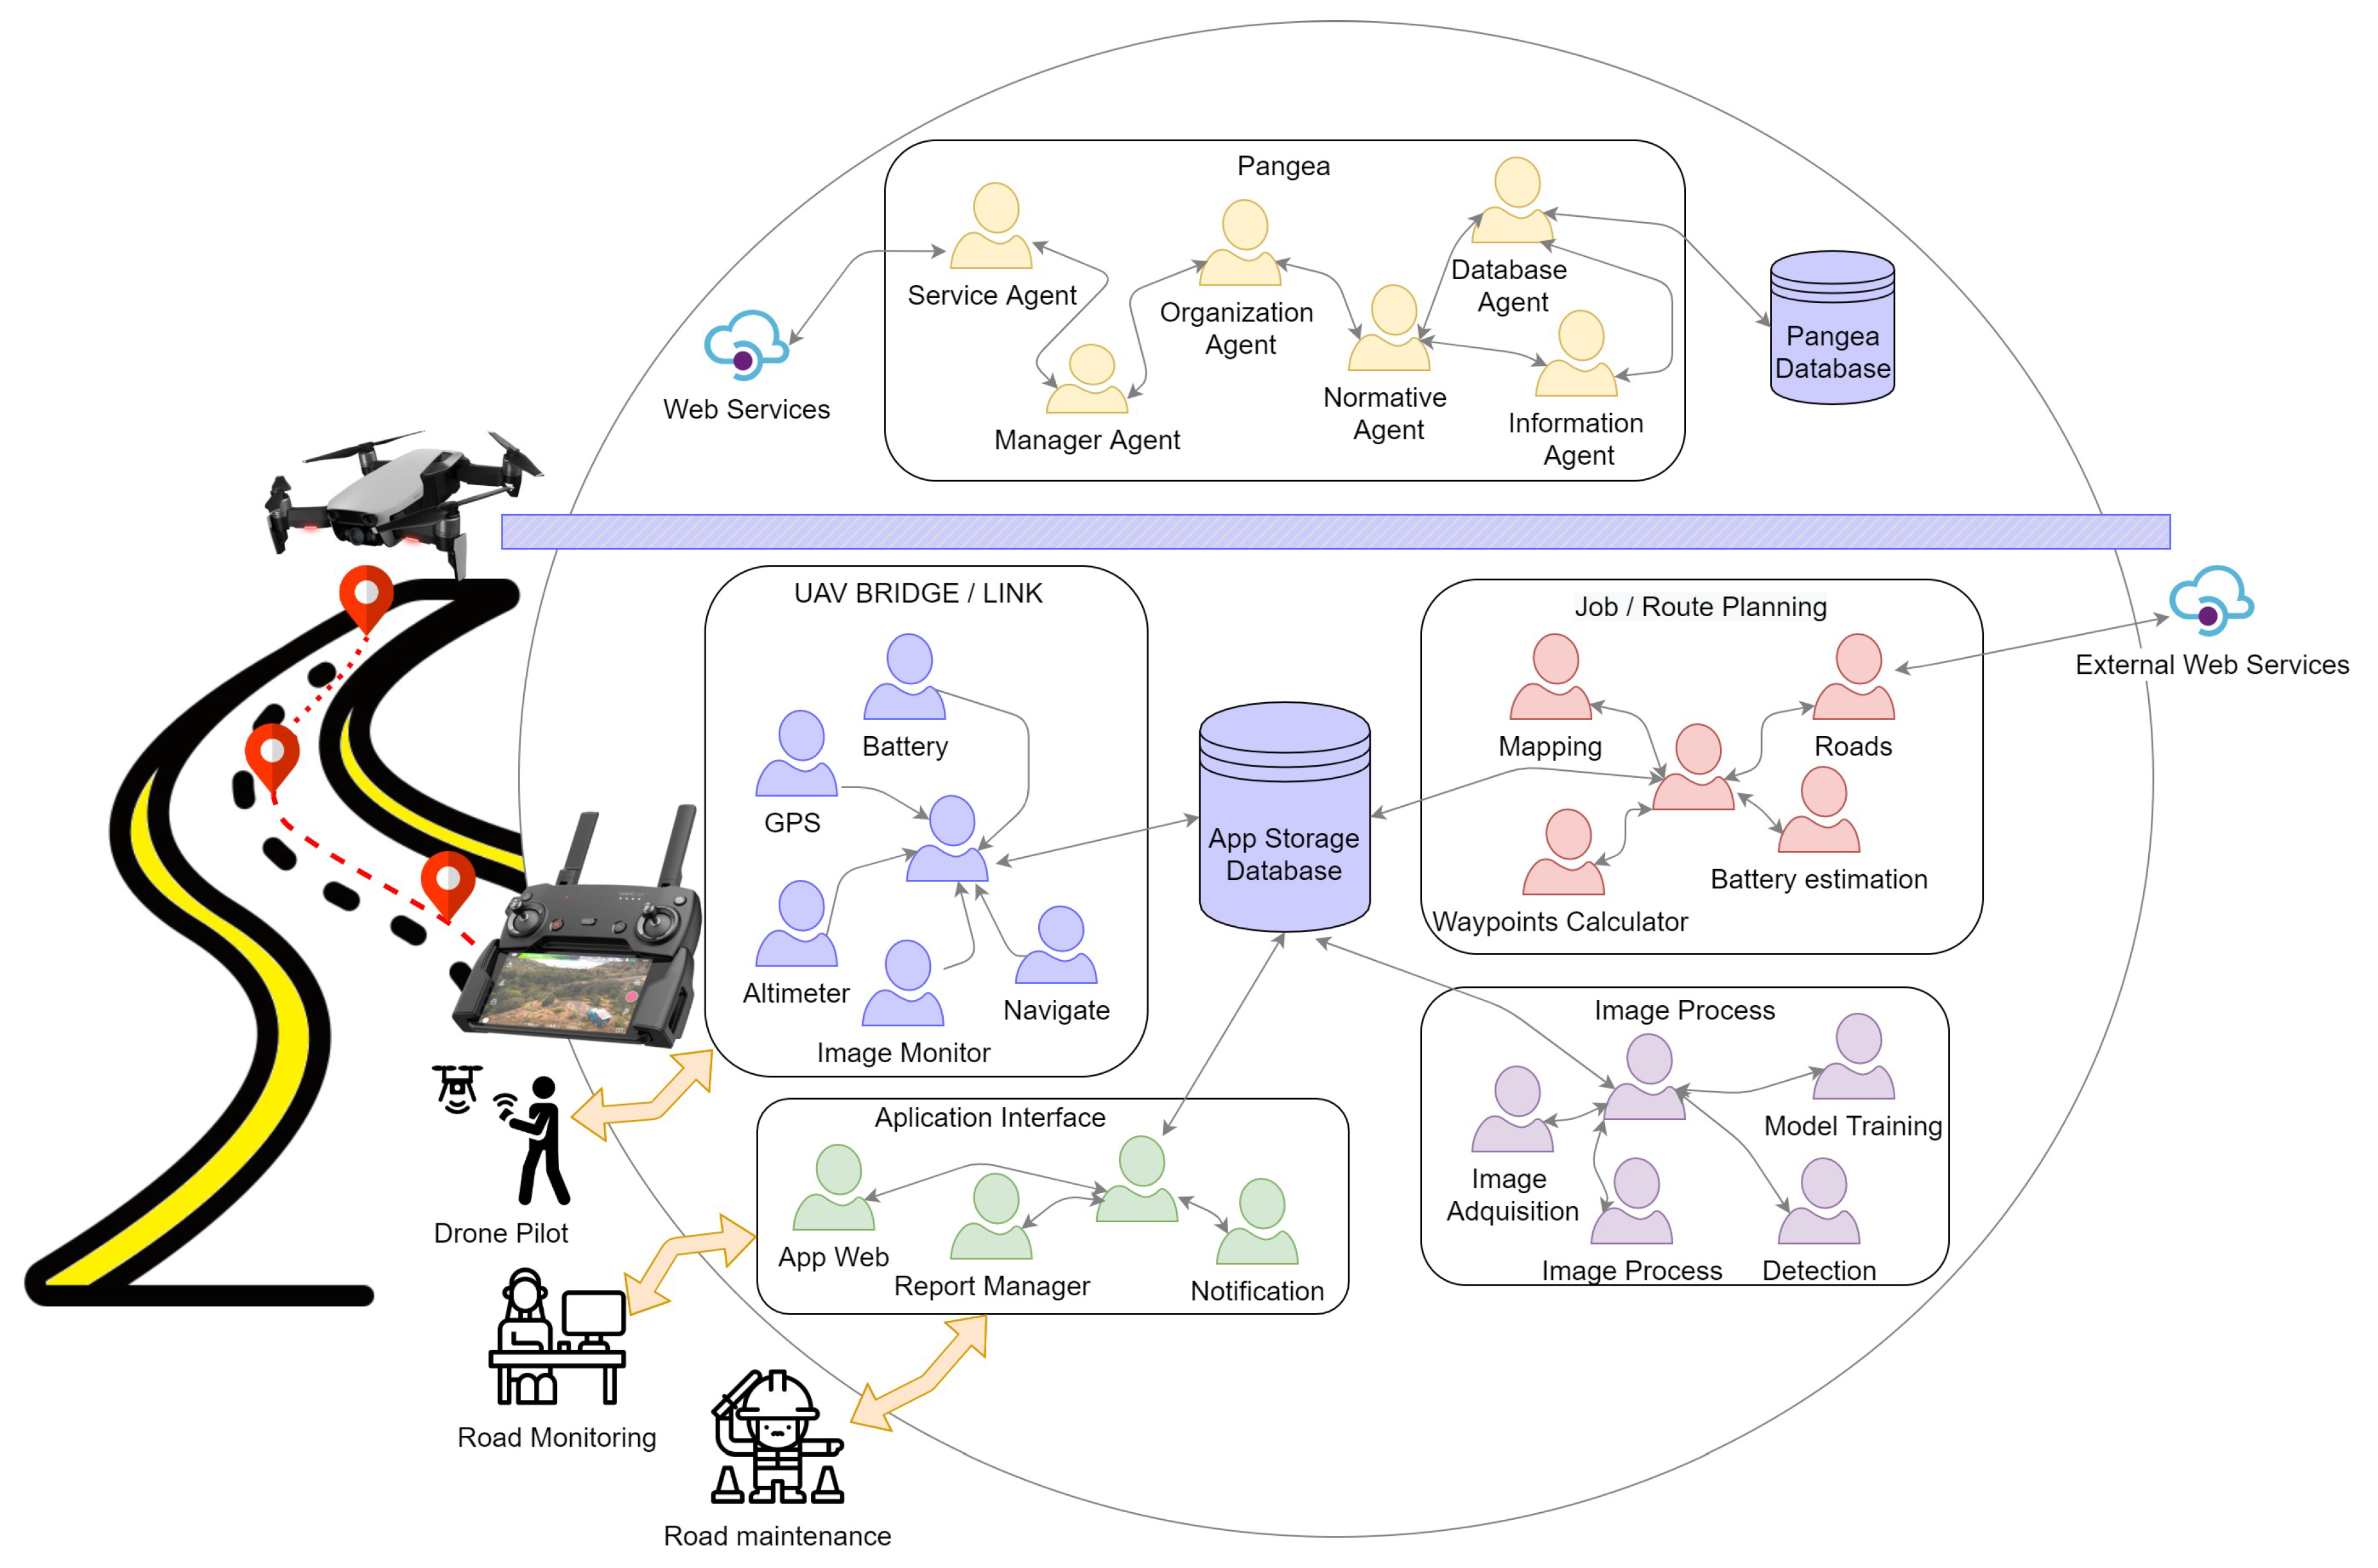
3.1. Proposed Architecture
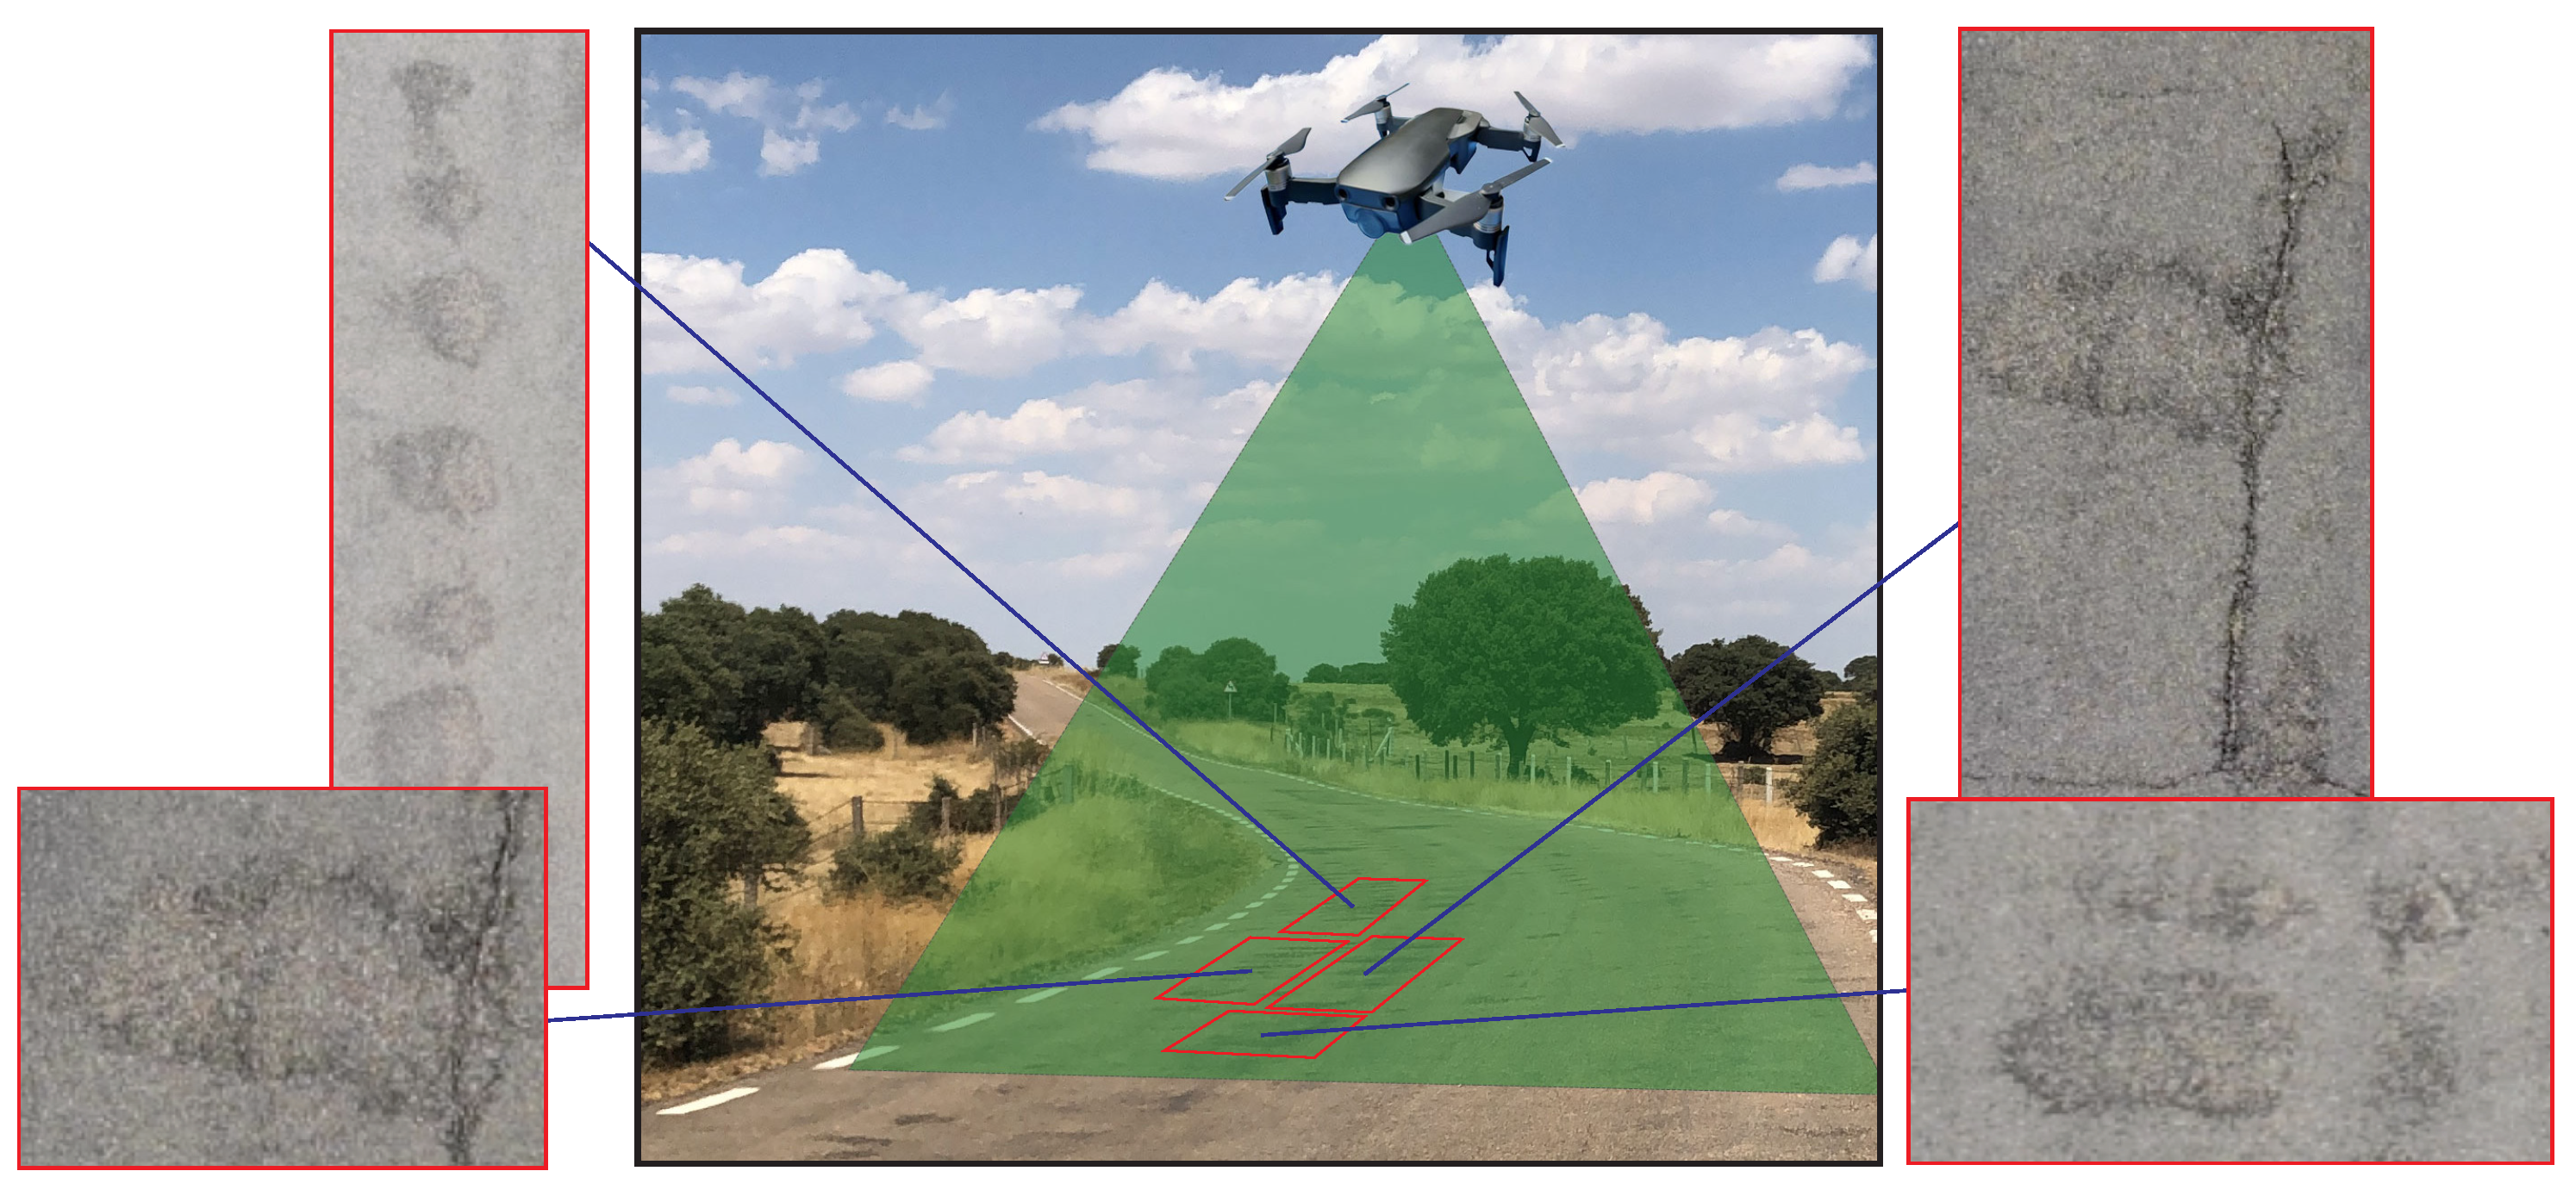
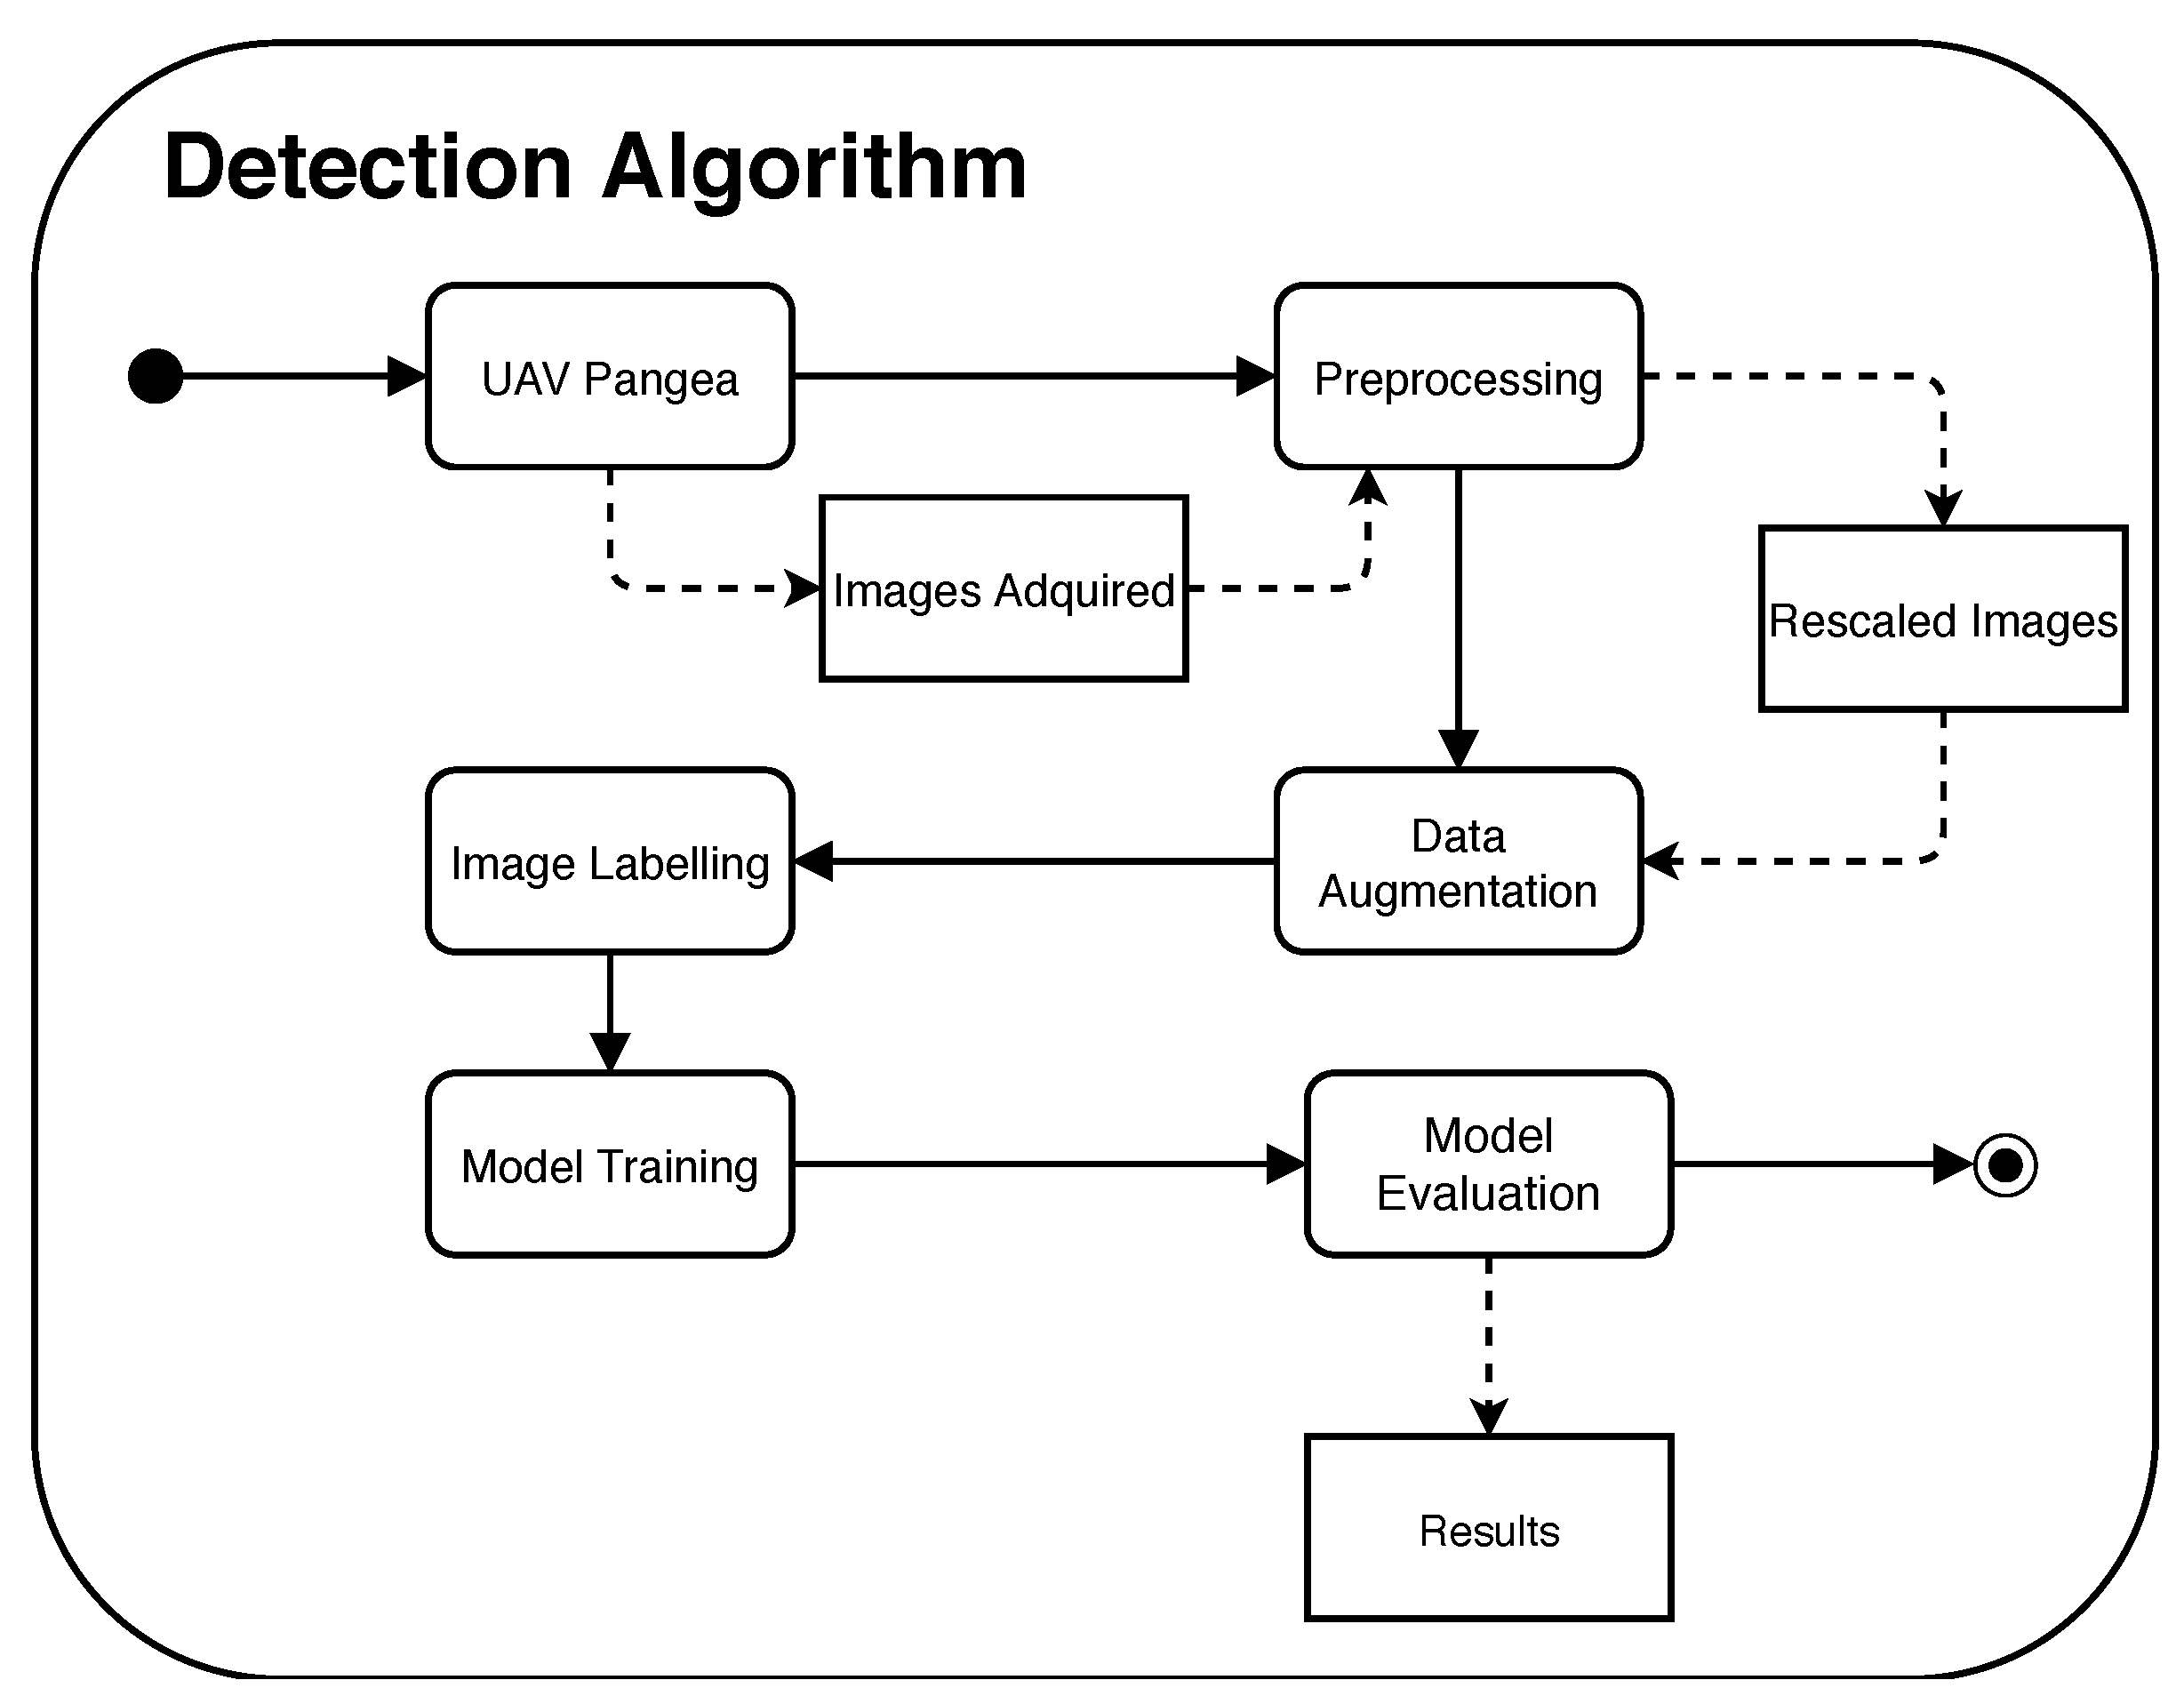
- Image acquisition: Obtains the images from the source to perform pre-processing, training, or detection tasks.
- Image pre-process: Performs pre-processing of the images, such as color adjustment, scaling, and adaptation of each of the images to the inputs of the different models.
- Model training: Takes the tagged images as input and performs training with different deep learning algorithms.
- Detection: Uses the deep learning models trained by the training model agent to detect cracks or anomalies in the new images inserted into the system.
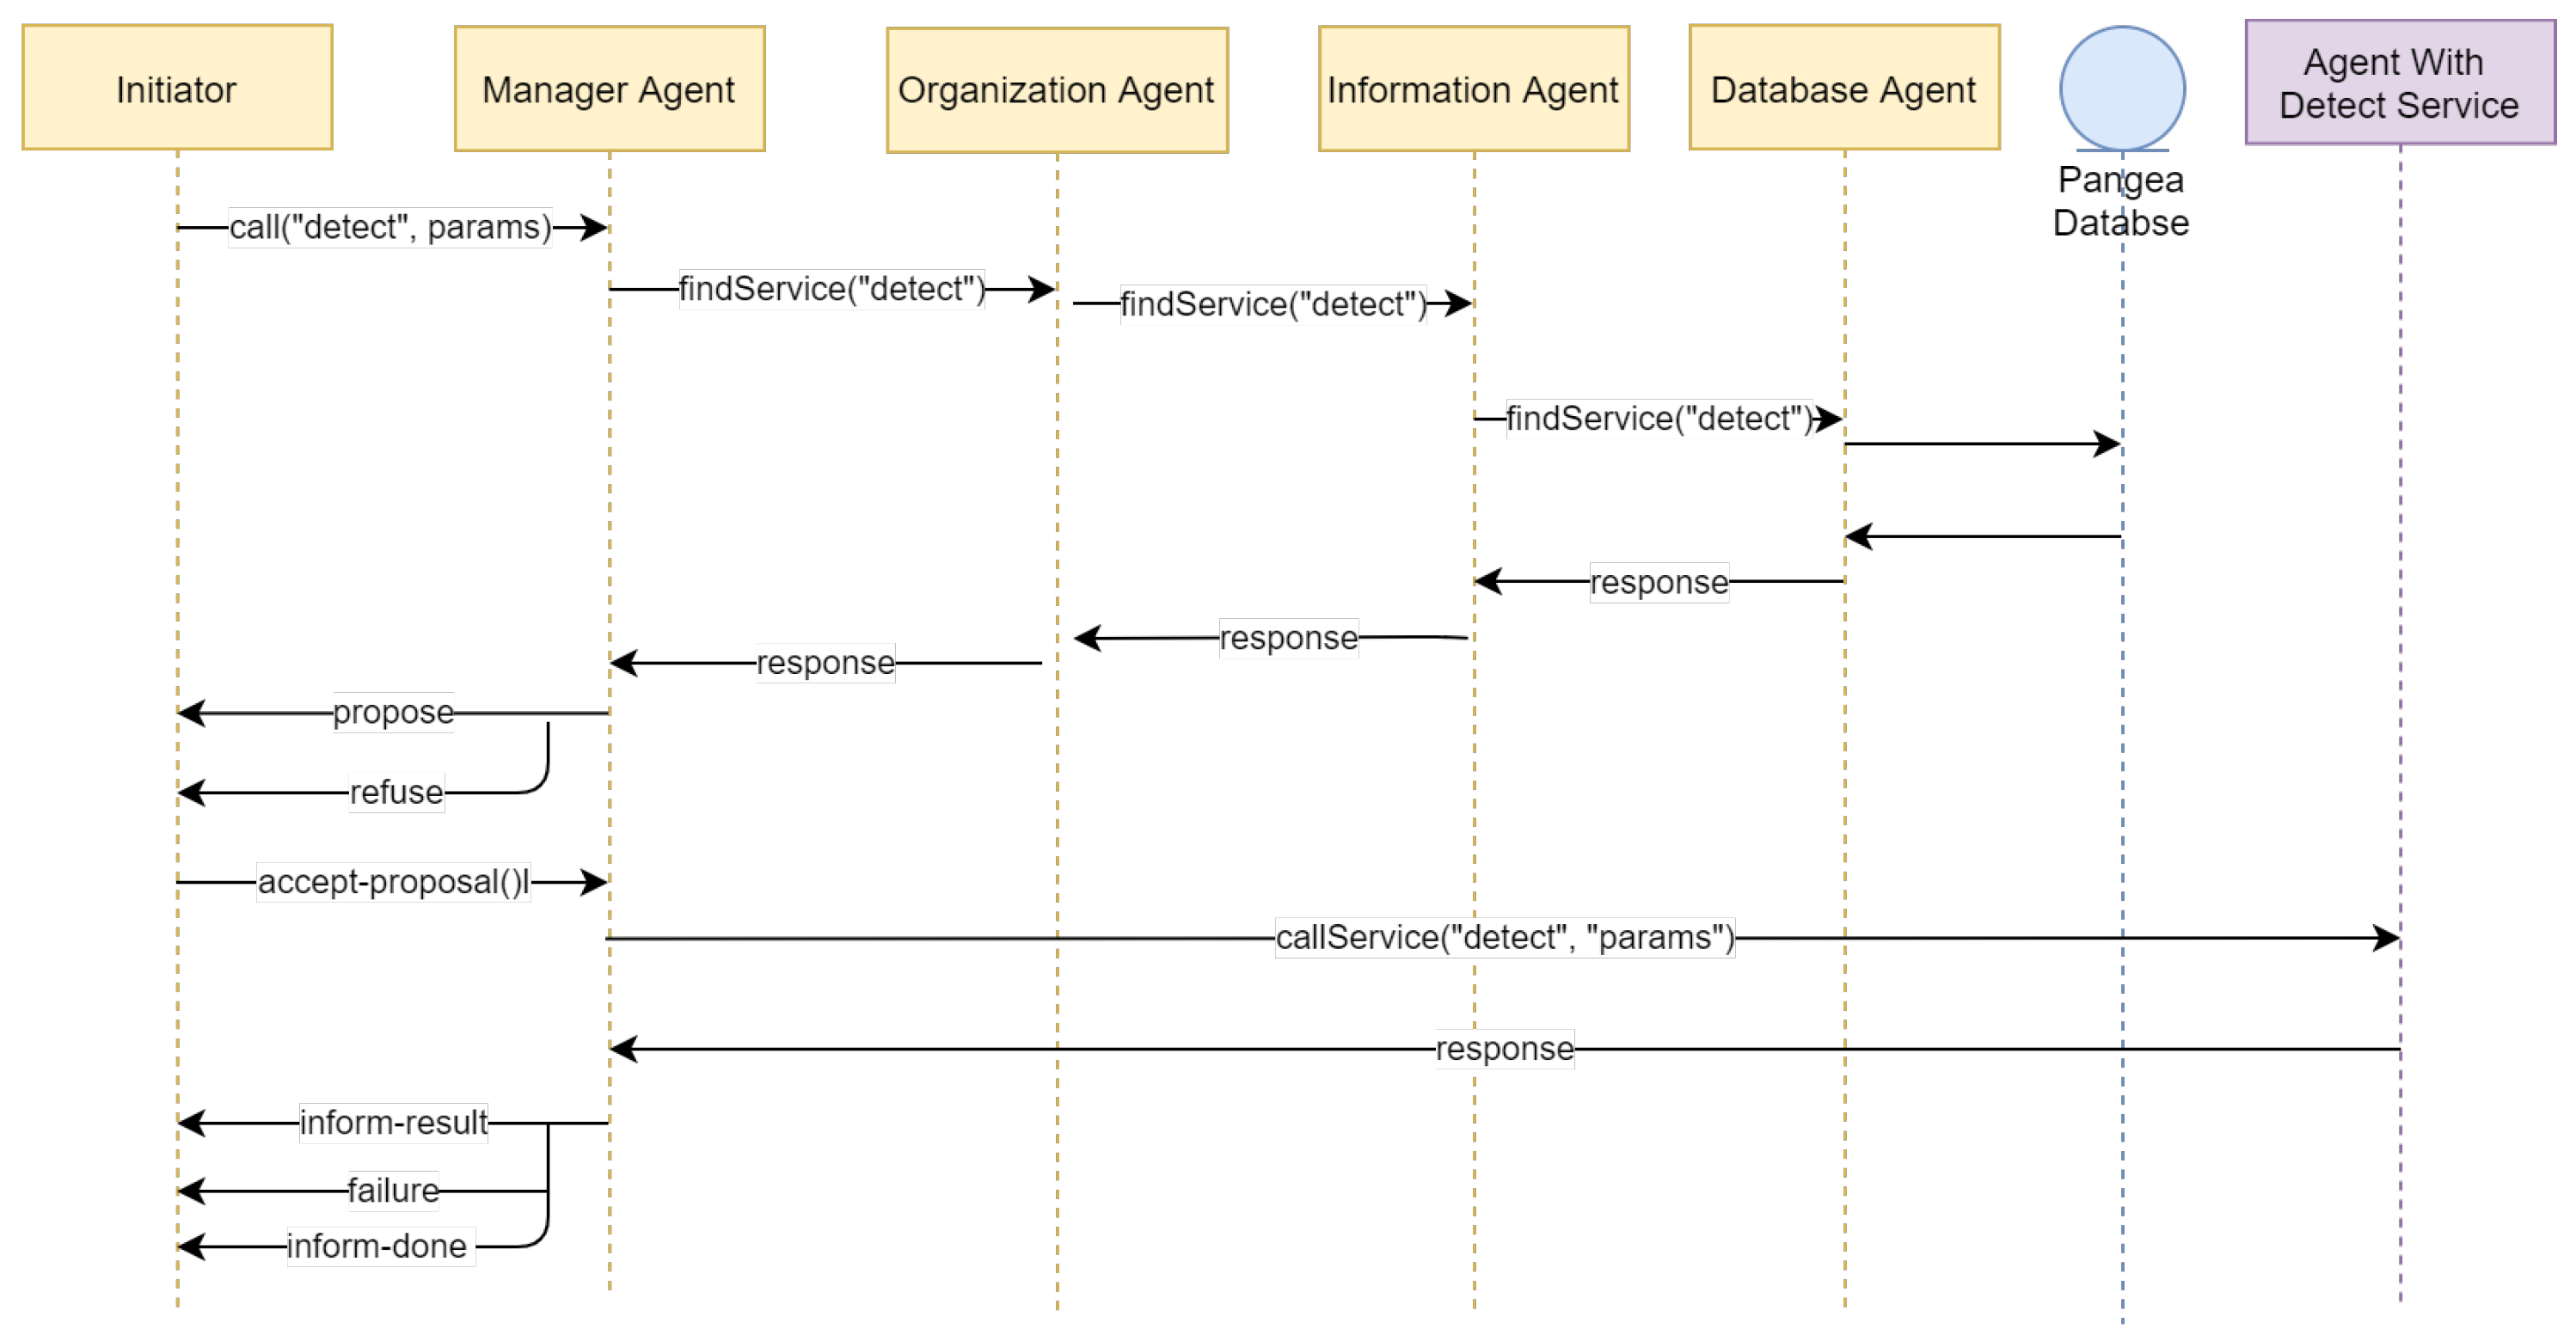
- Database Agent: The only agent with database access privileges, it stores the information present within the organization. This agent is also in charge of performing backups and ensuring consistency of information.
- Information Agent: Manages the services within the virtual organization by making the services of each of the agents available to the other agents. When an agent joins the system, it indicates to this agent the services it provides so that when another agent needs to use that service, it makes a query to this agent.
- Normative Agent: Responsible for imposing and ensuring that the rules comply with the communications they establish between agents.
- Service Agent: Aims to distribute functionality through web services. It is used as a gateway that allows the communication of external services with the organization’s agents. These web services allow the easy construction of external agents in different programming languages.
- Manager Agent: Responsible for checking the status of the system periodically. It is in charge of detecting if there is any overloaded functionality and any possible failures in the agents of the different organizations.
- Organization Agent: Responsible for the verification of all the operations of the virtual organizations, checking the security and the load balancing, and offering encryption of the most important agents.
3.2. Proposed Method
3.2.1. Annotation and Labeling
3.2.2. Model Training
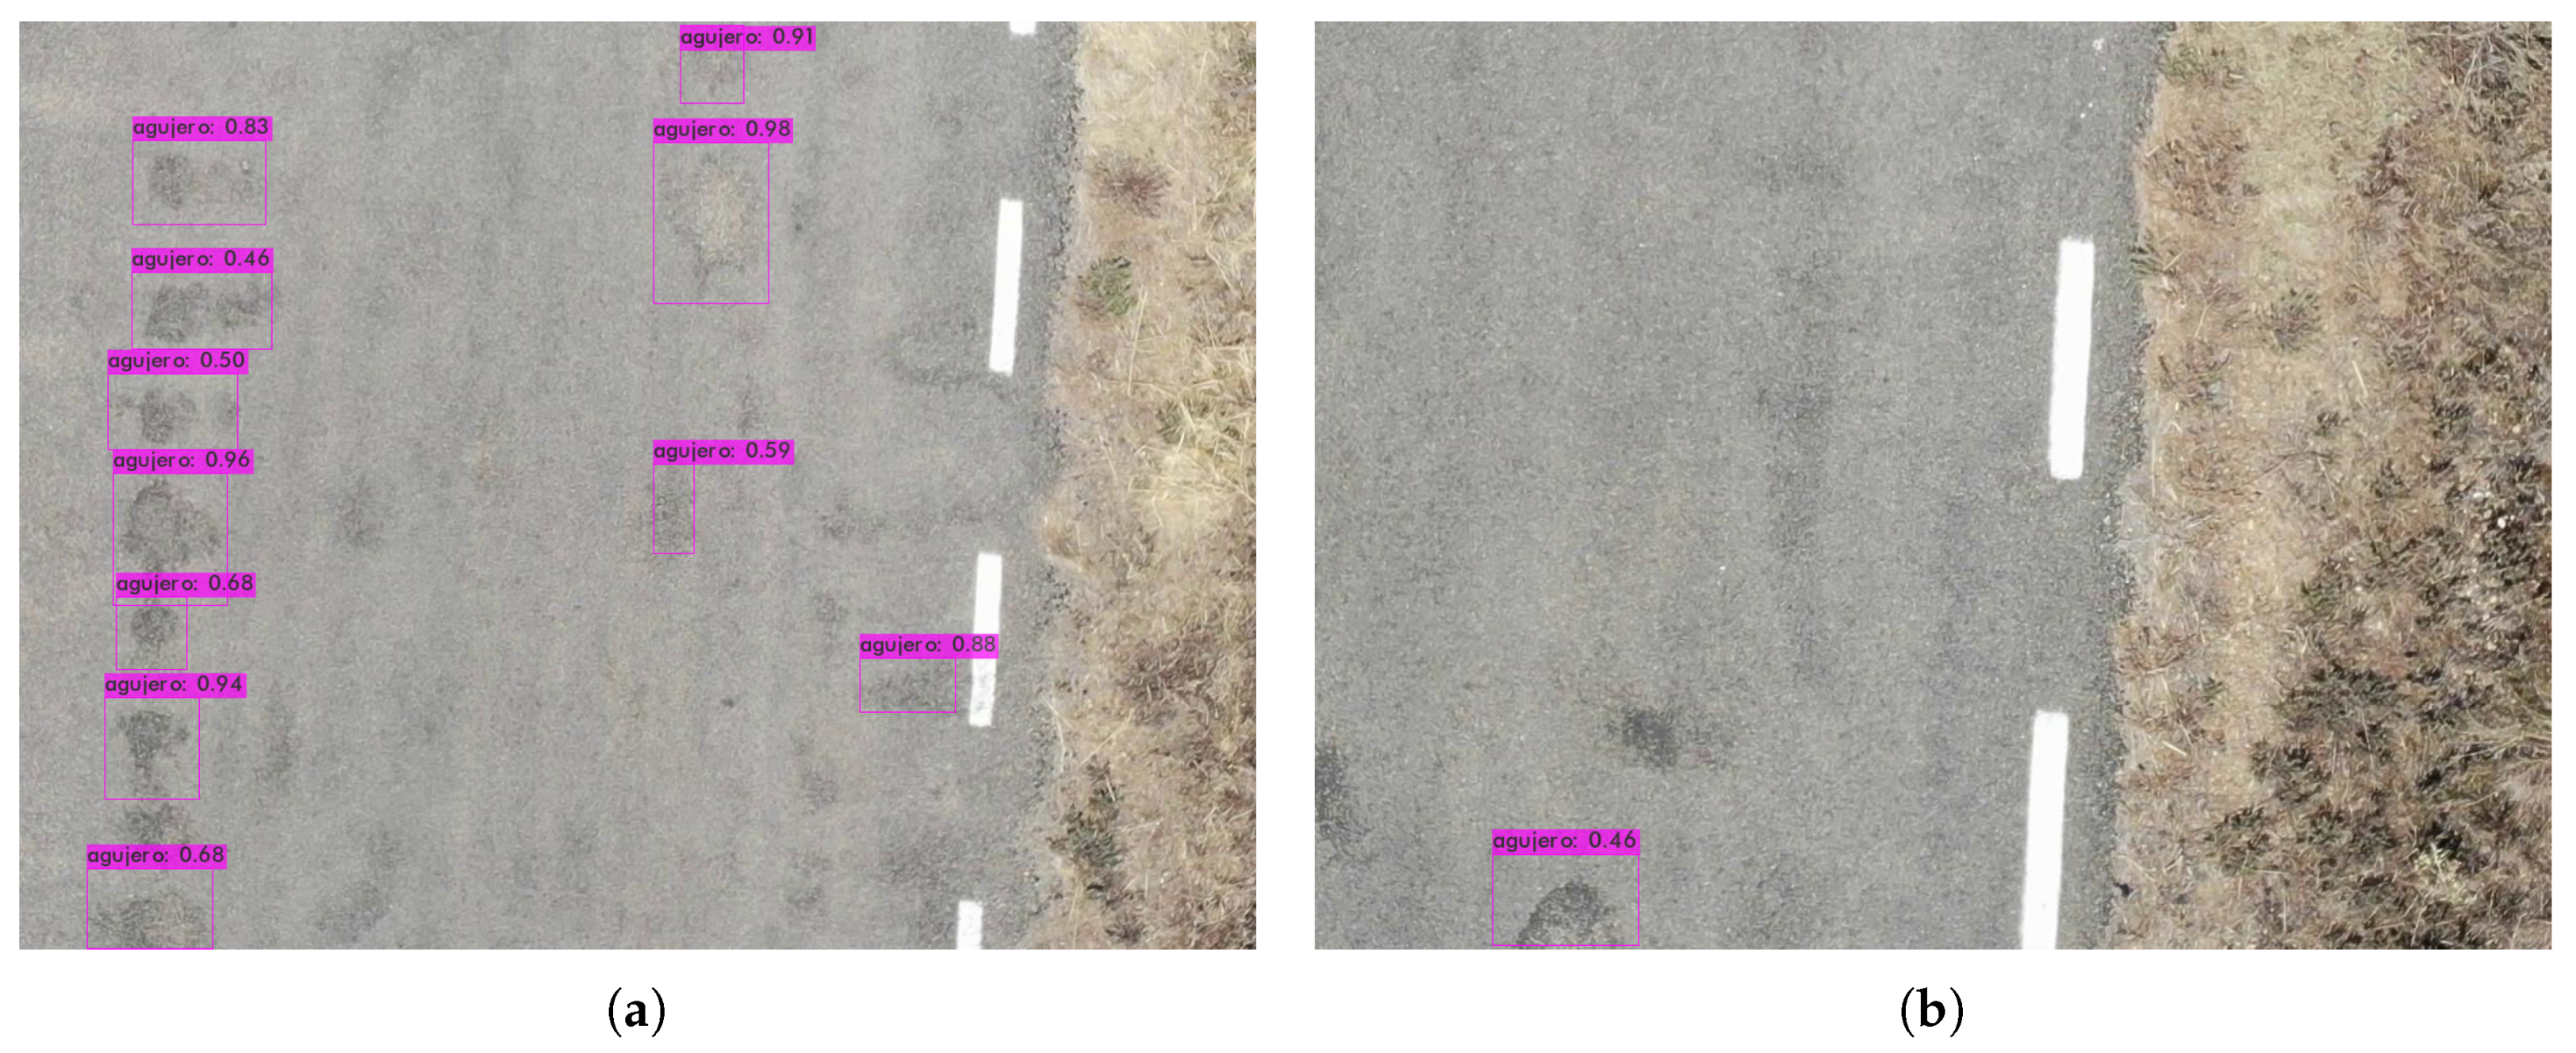
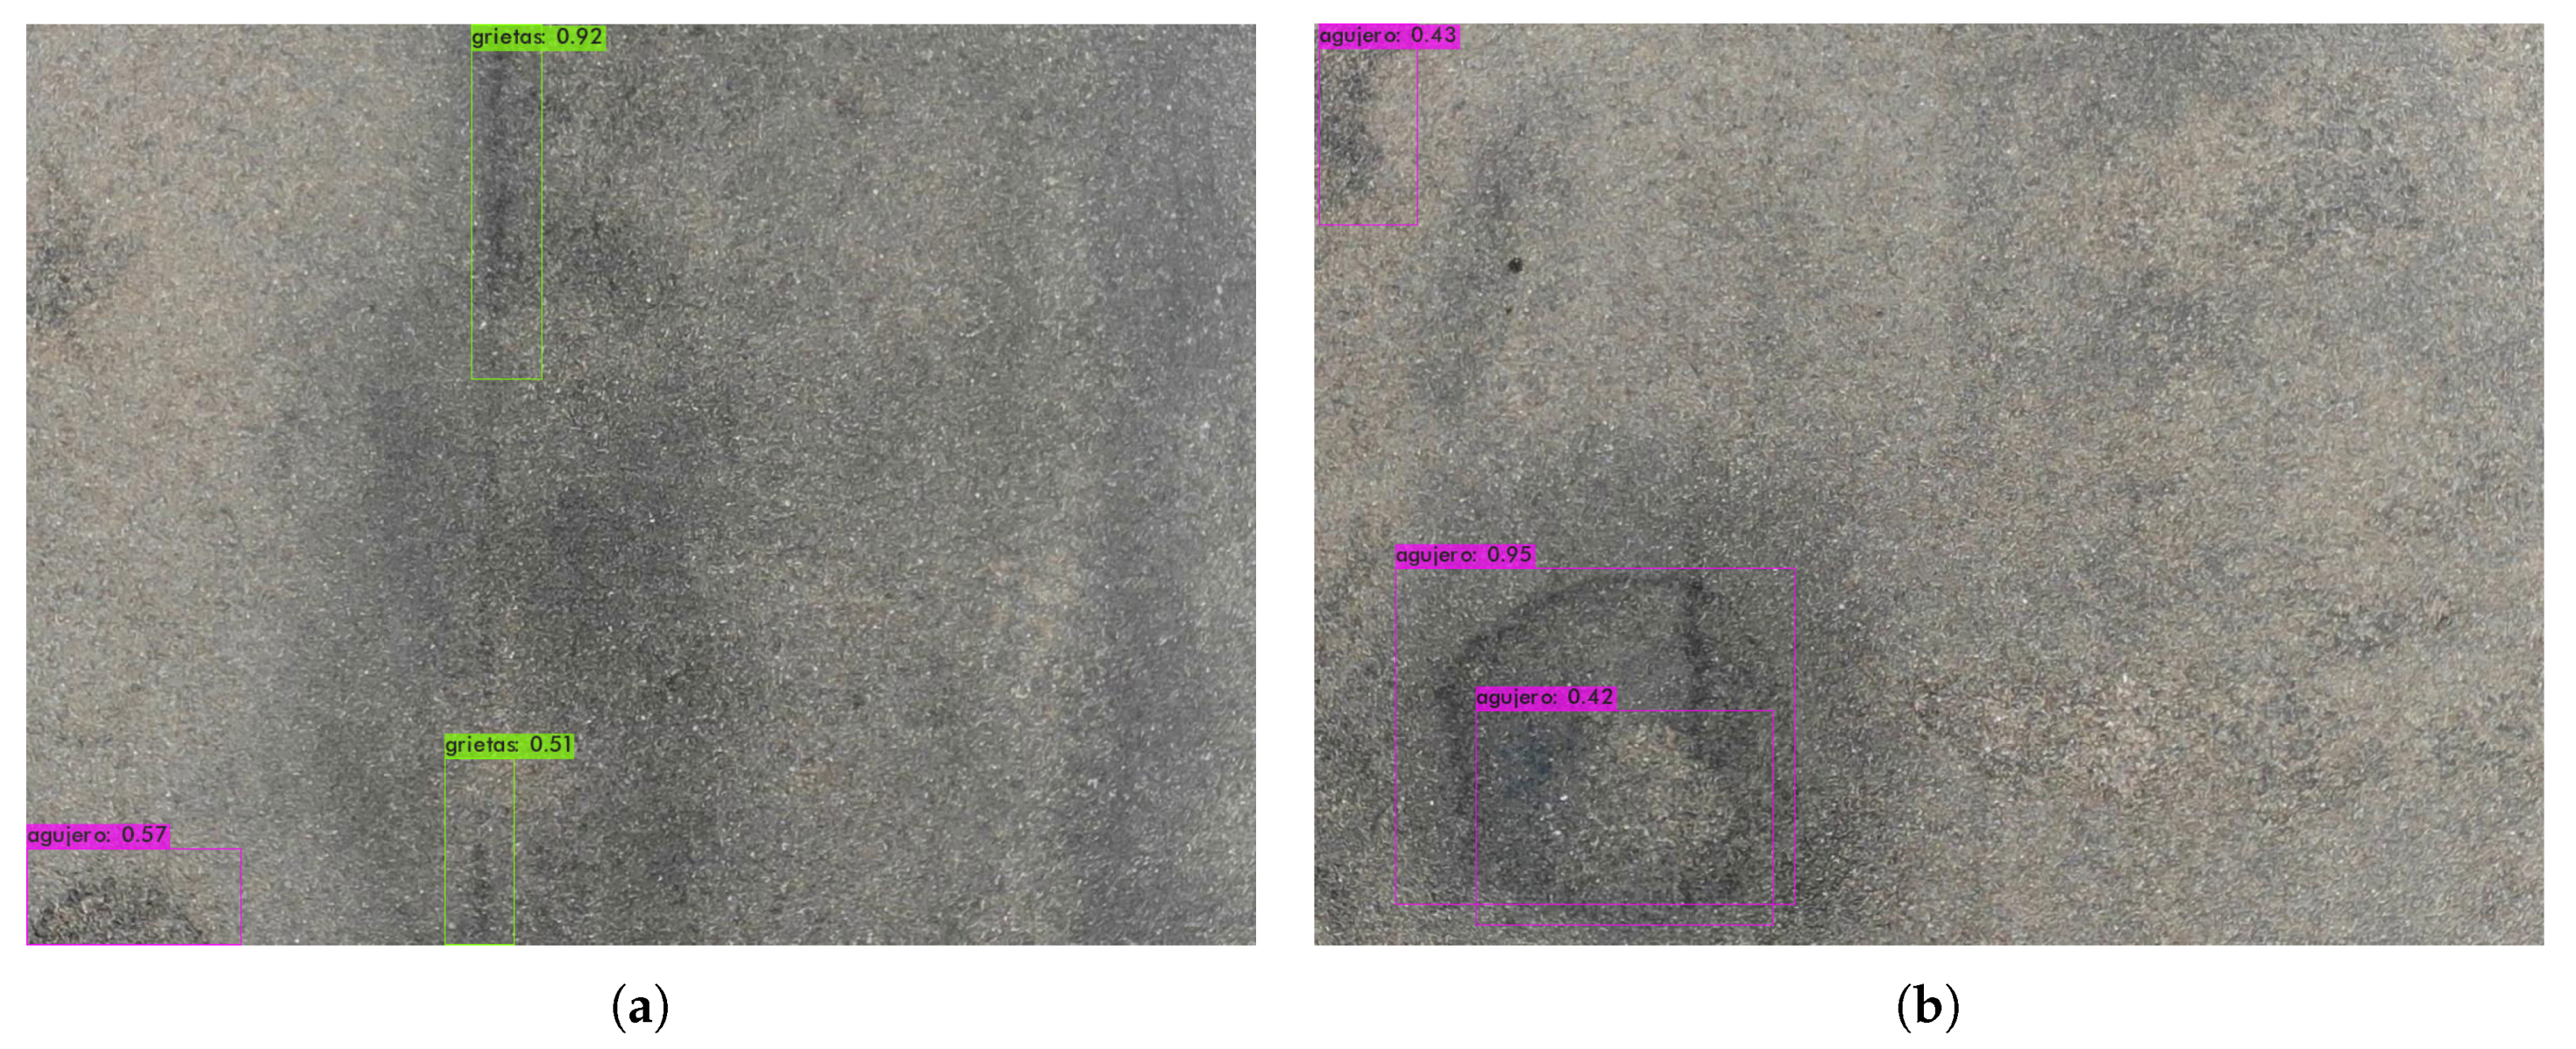
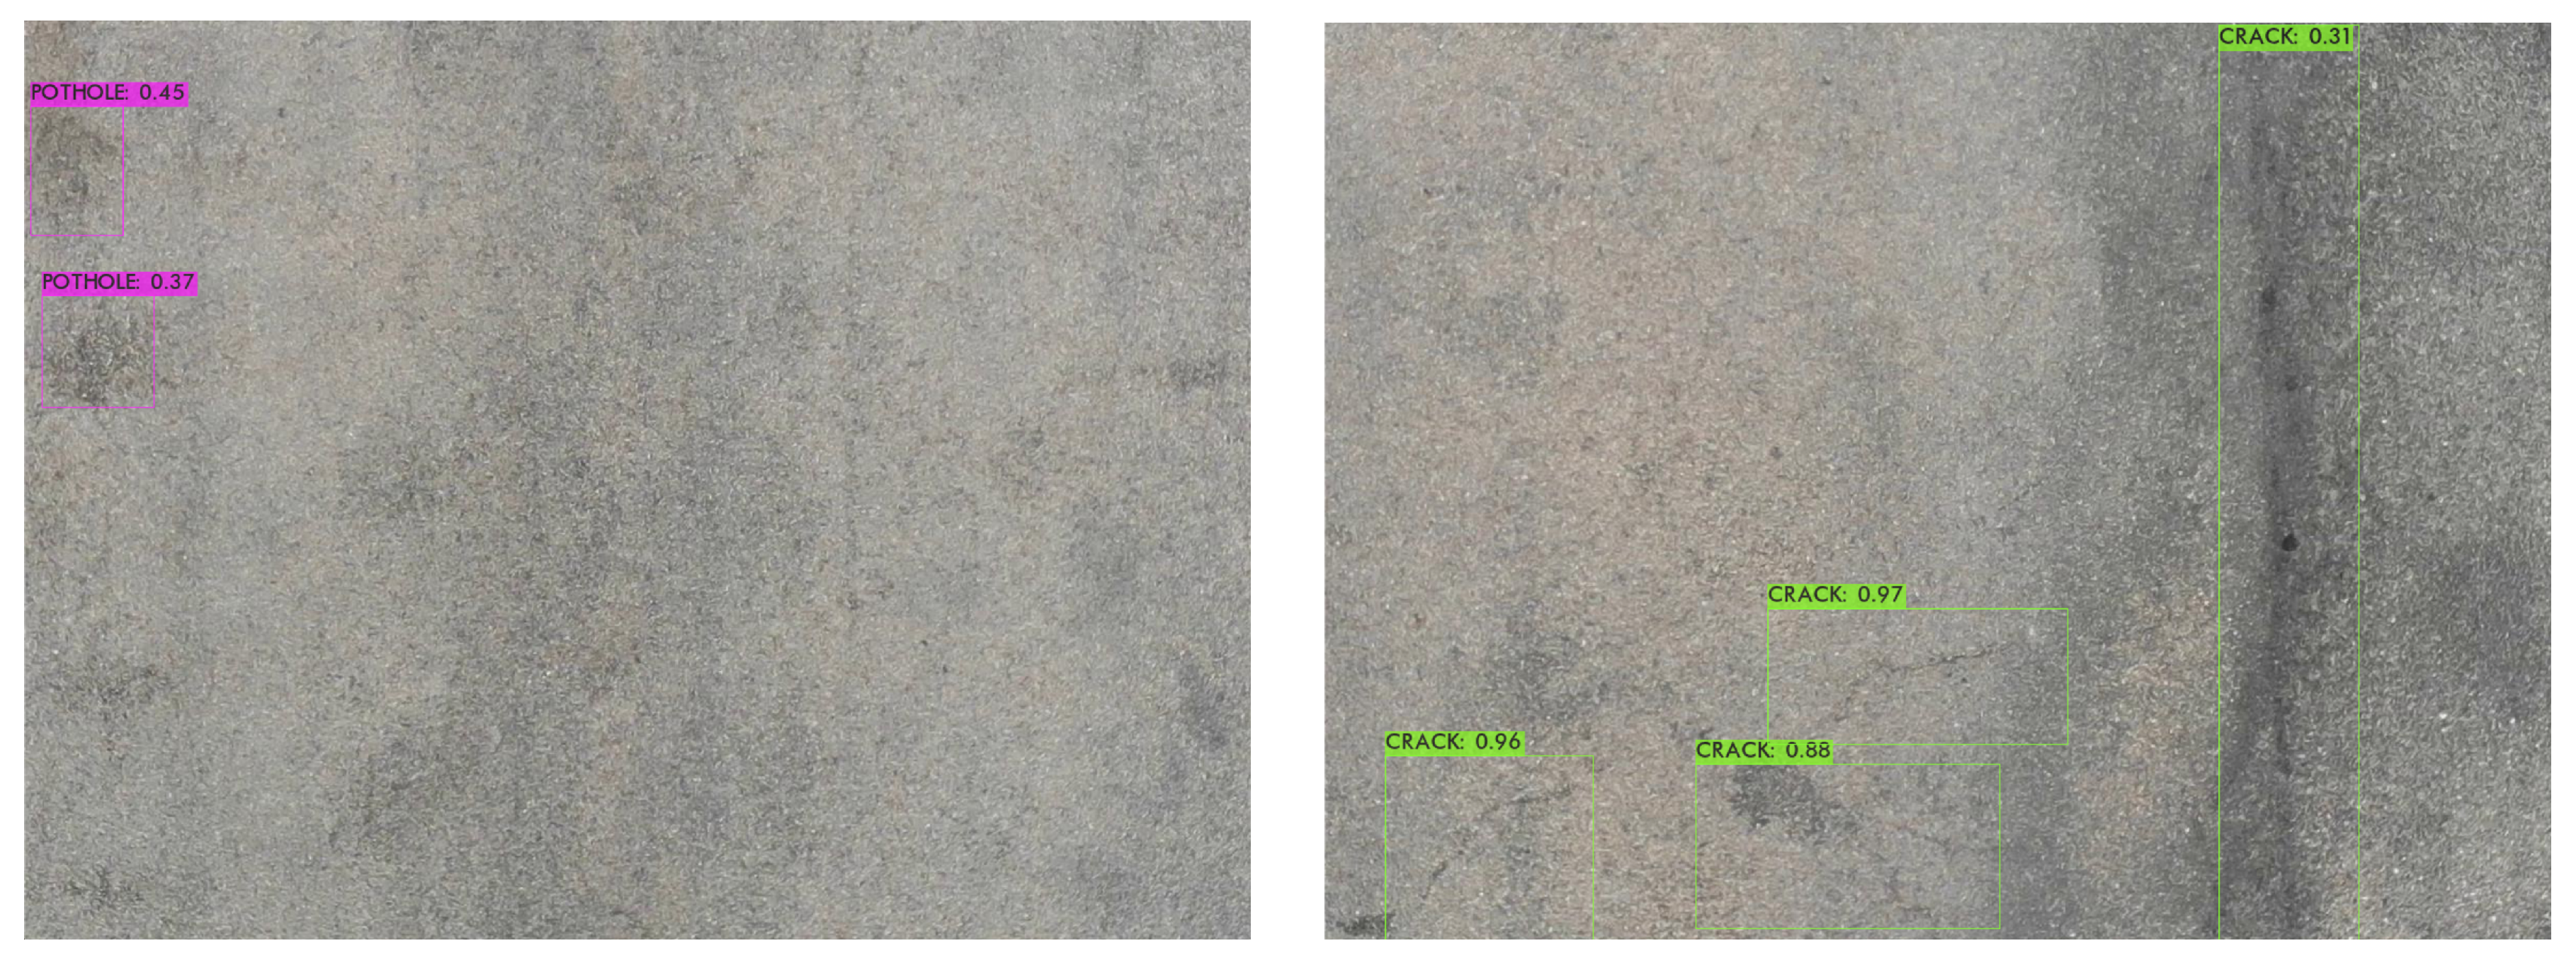
4. Results
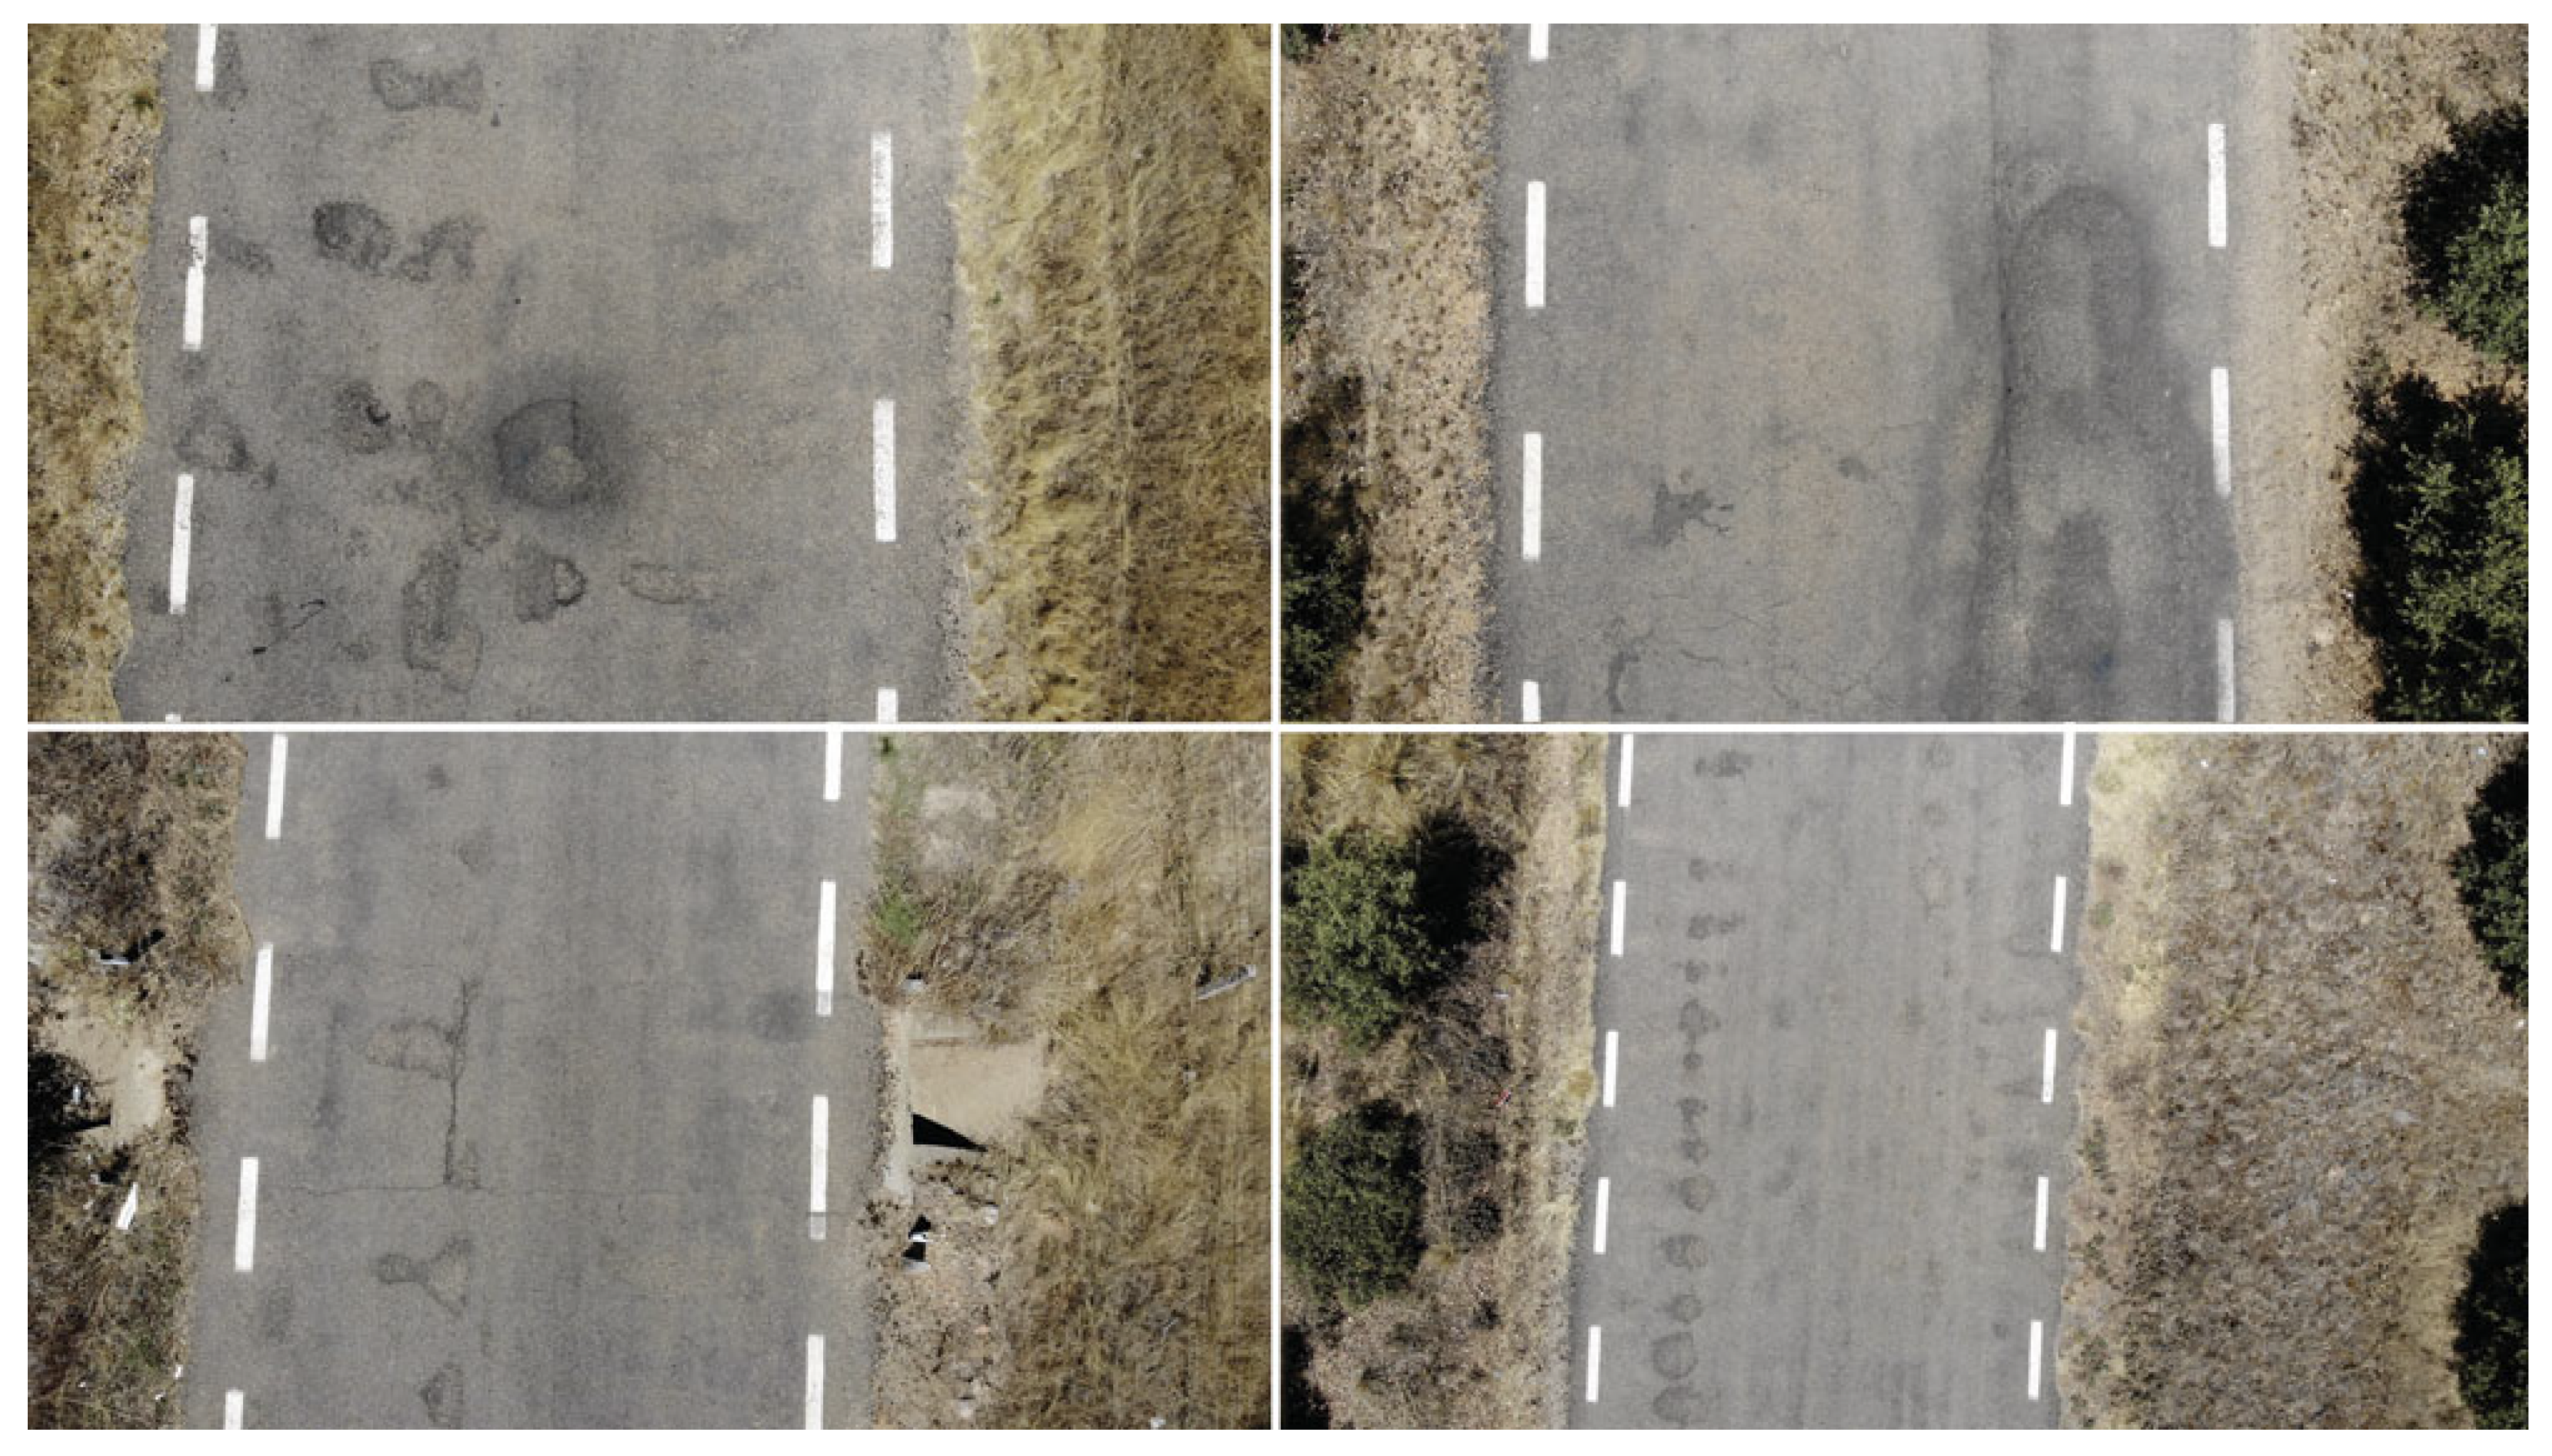
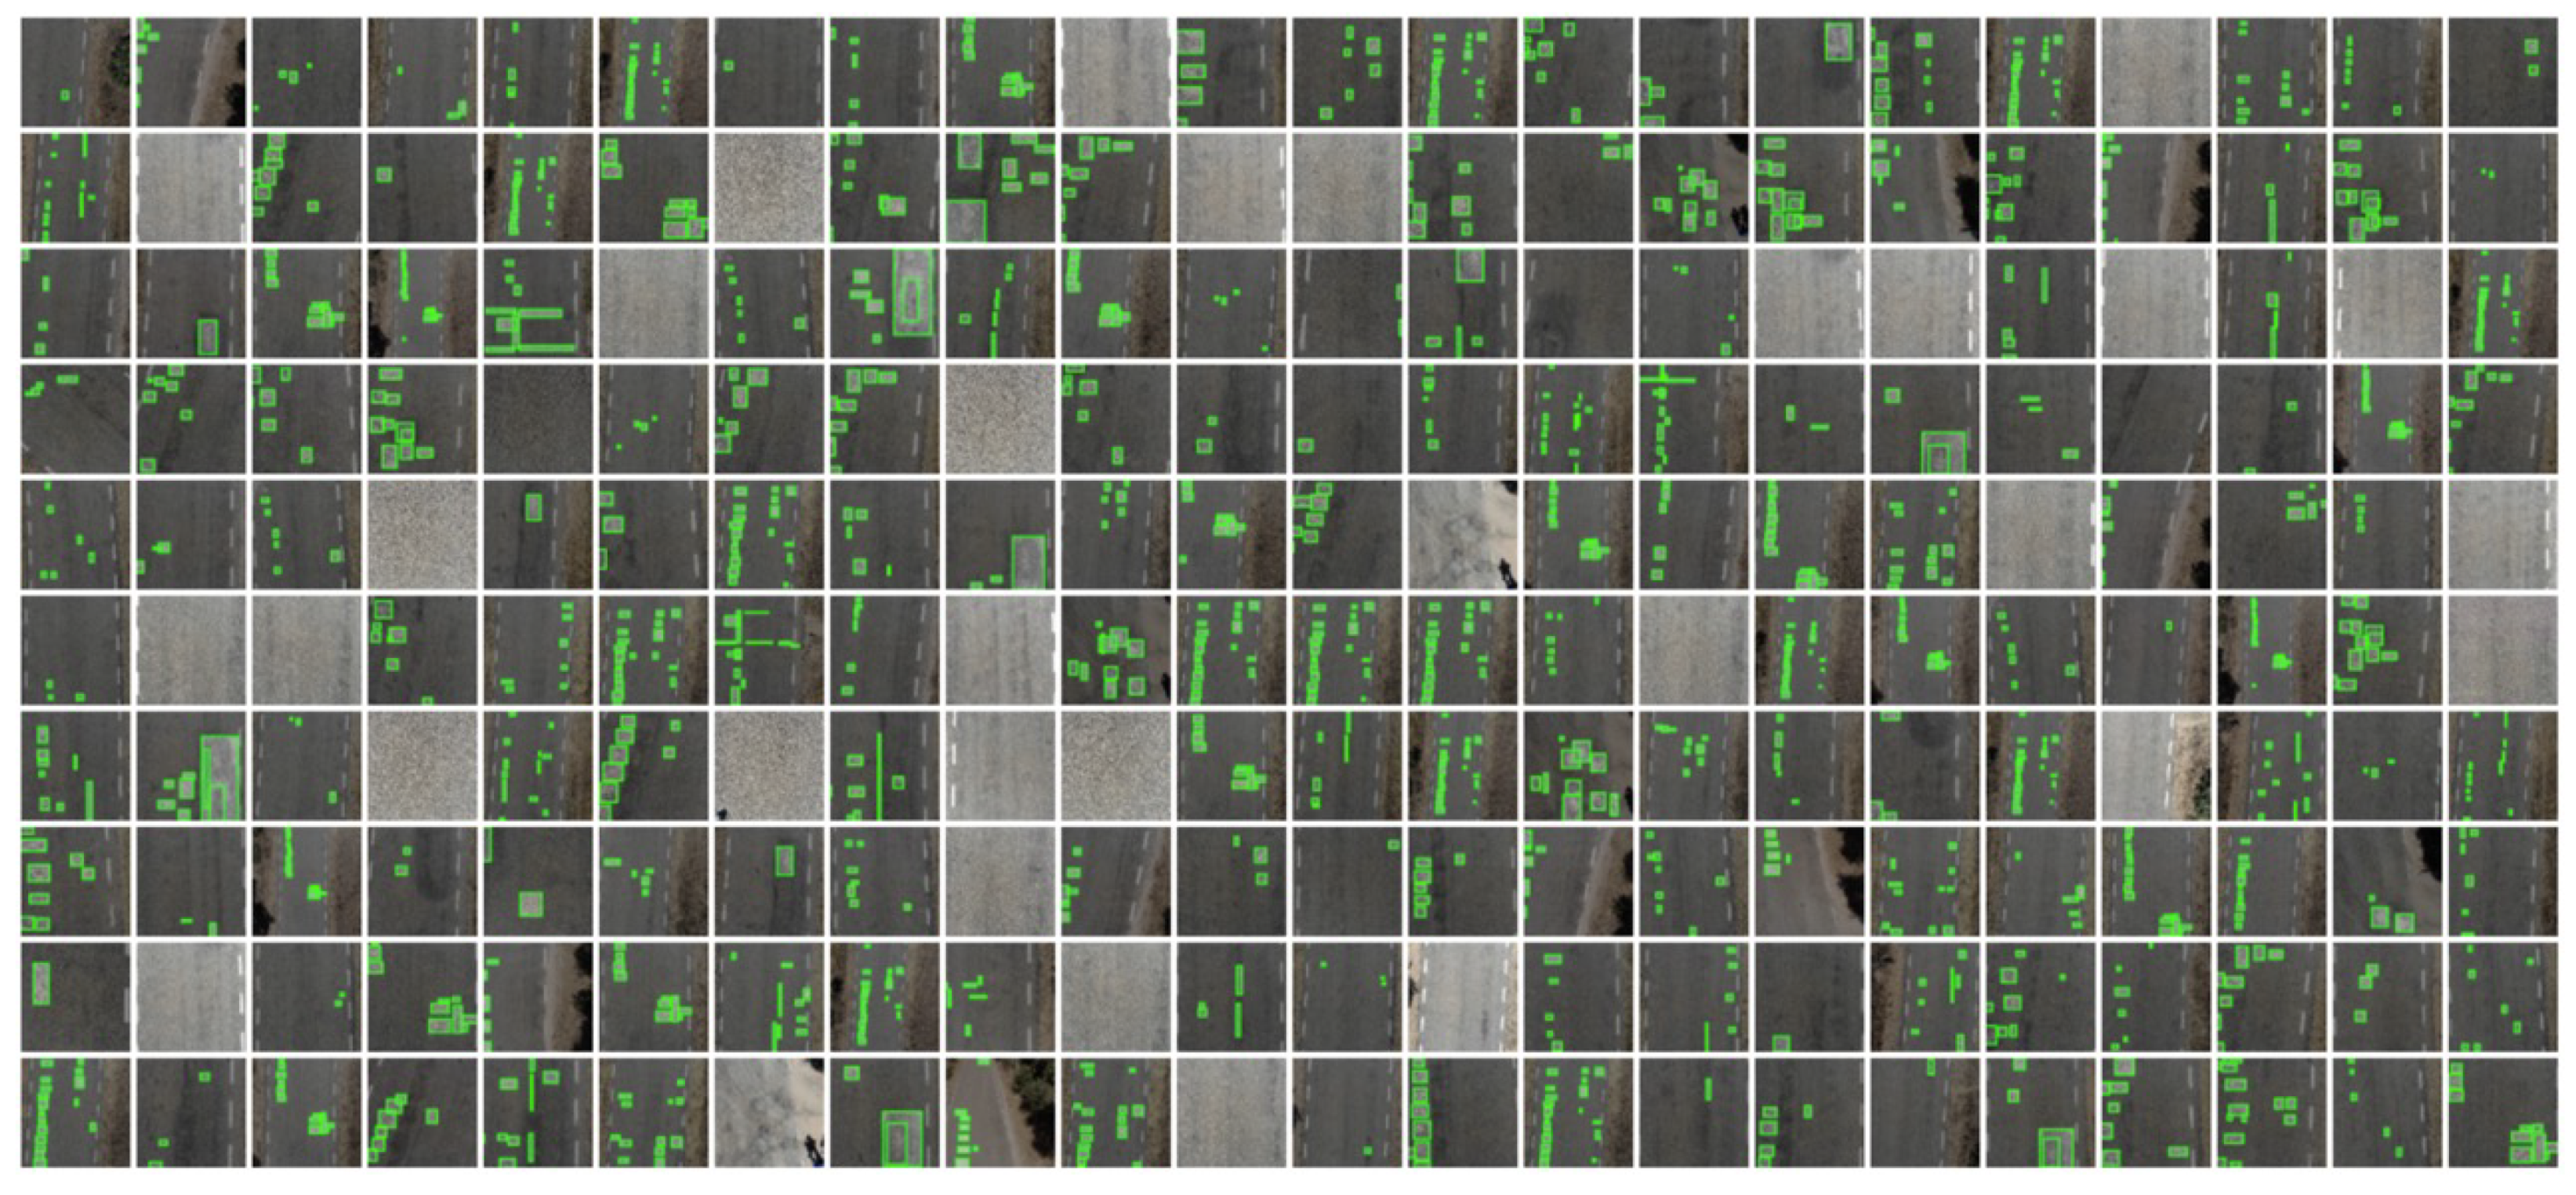
4.1. Dataset
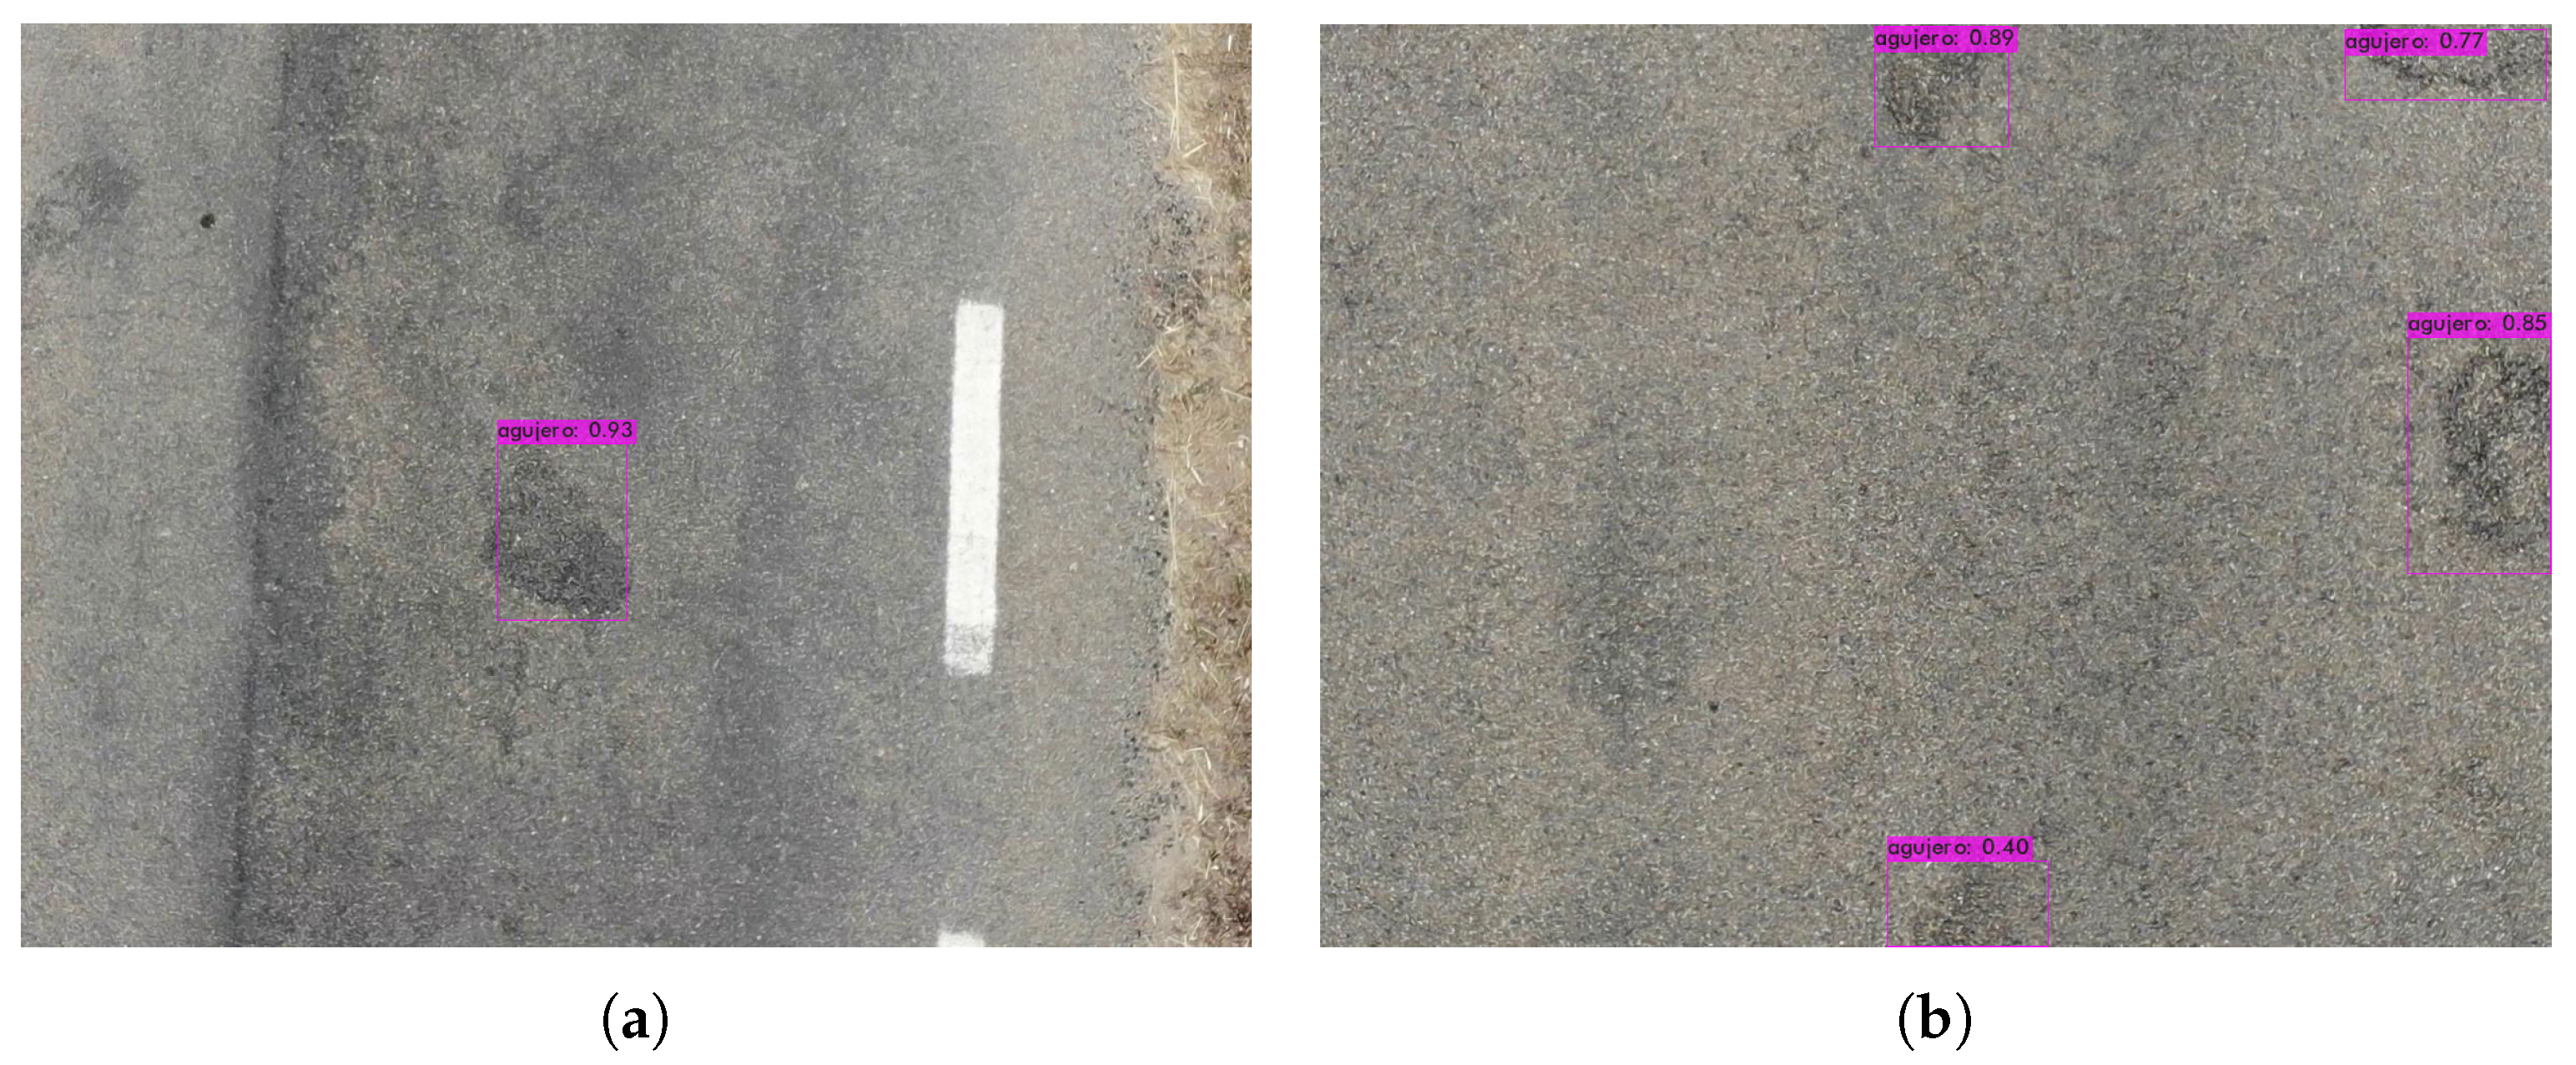
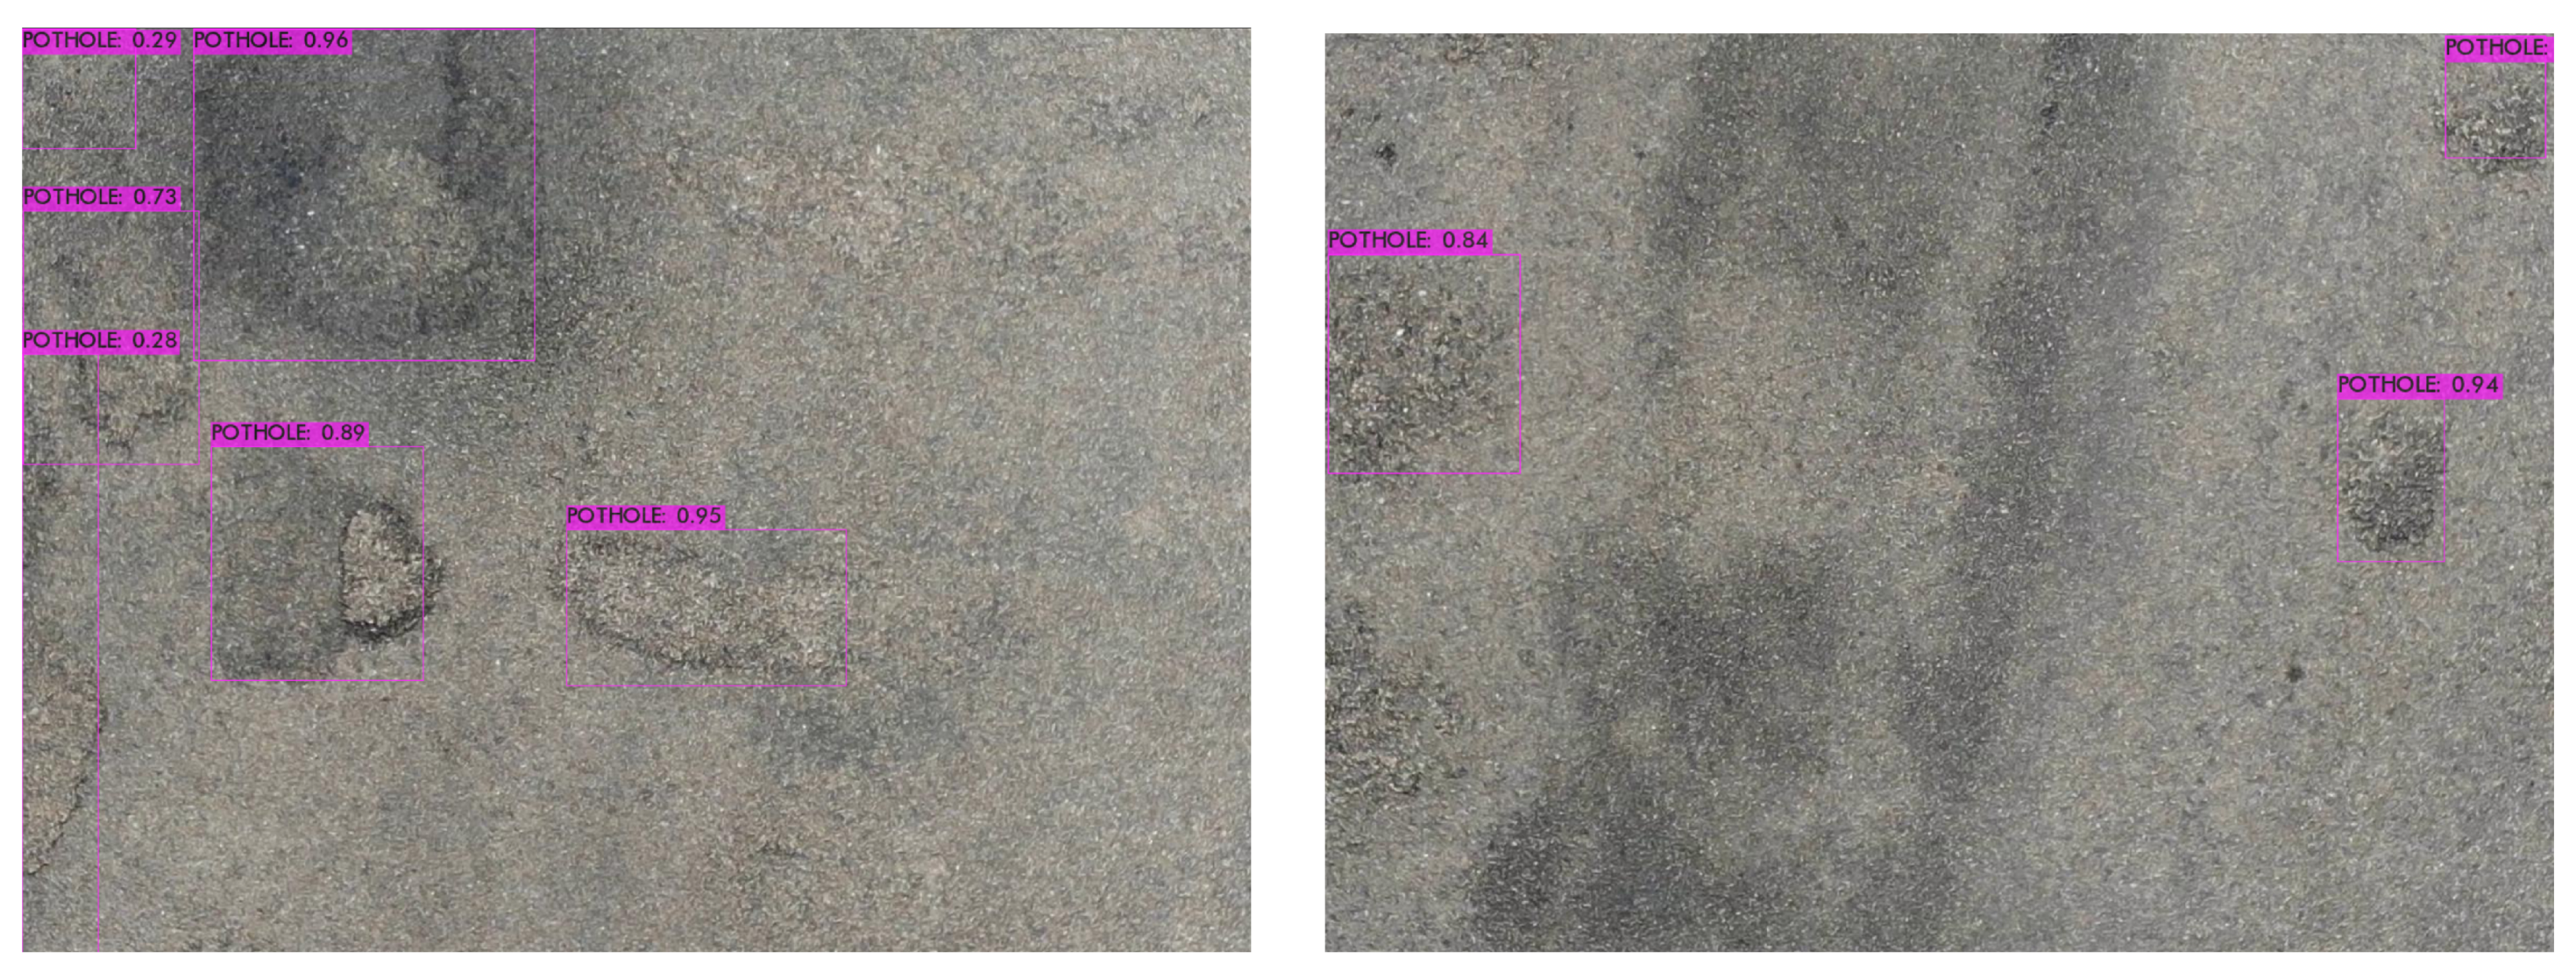
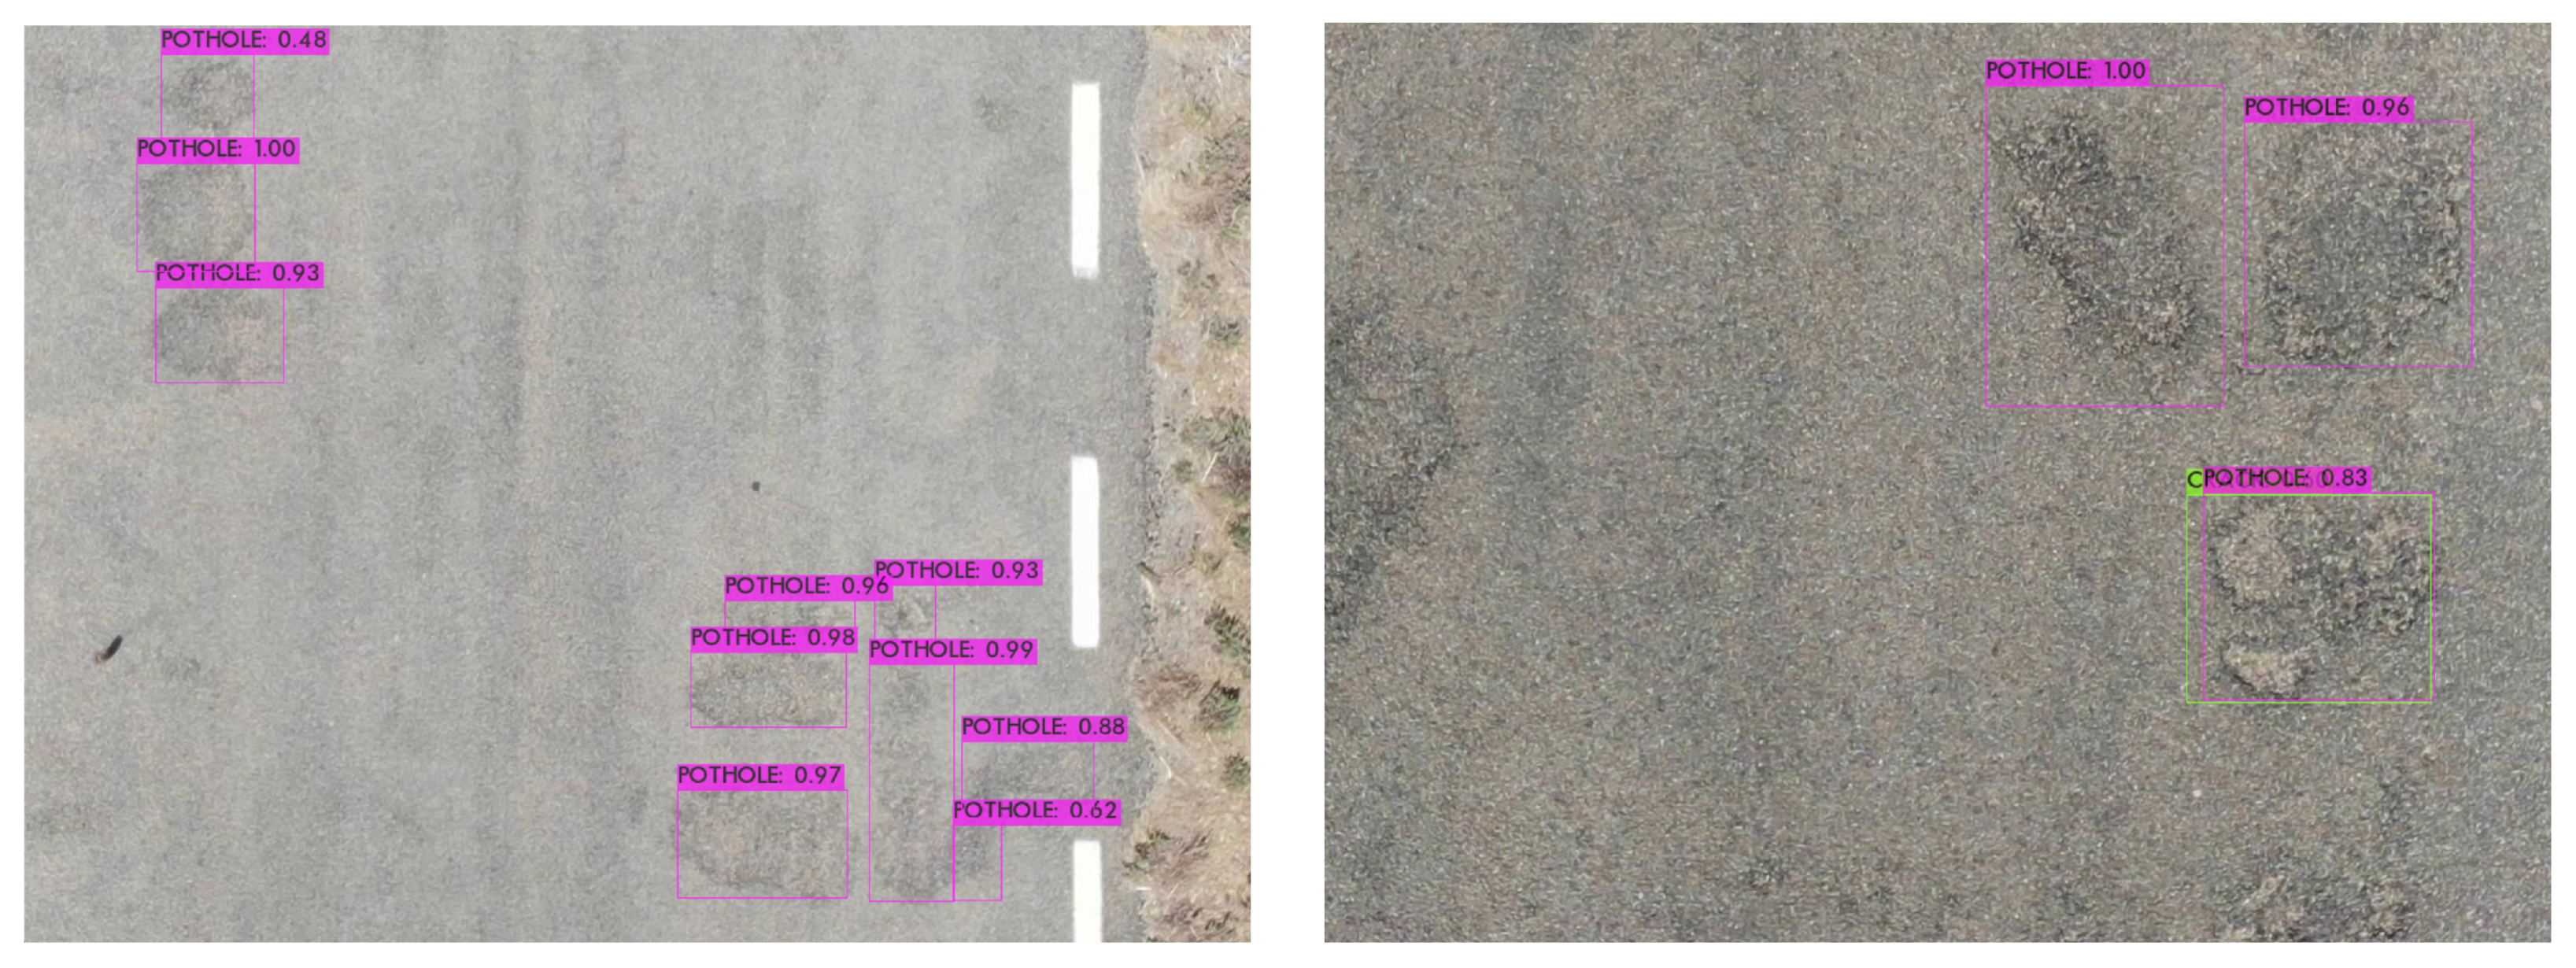
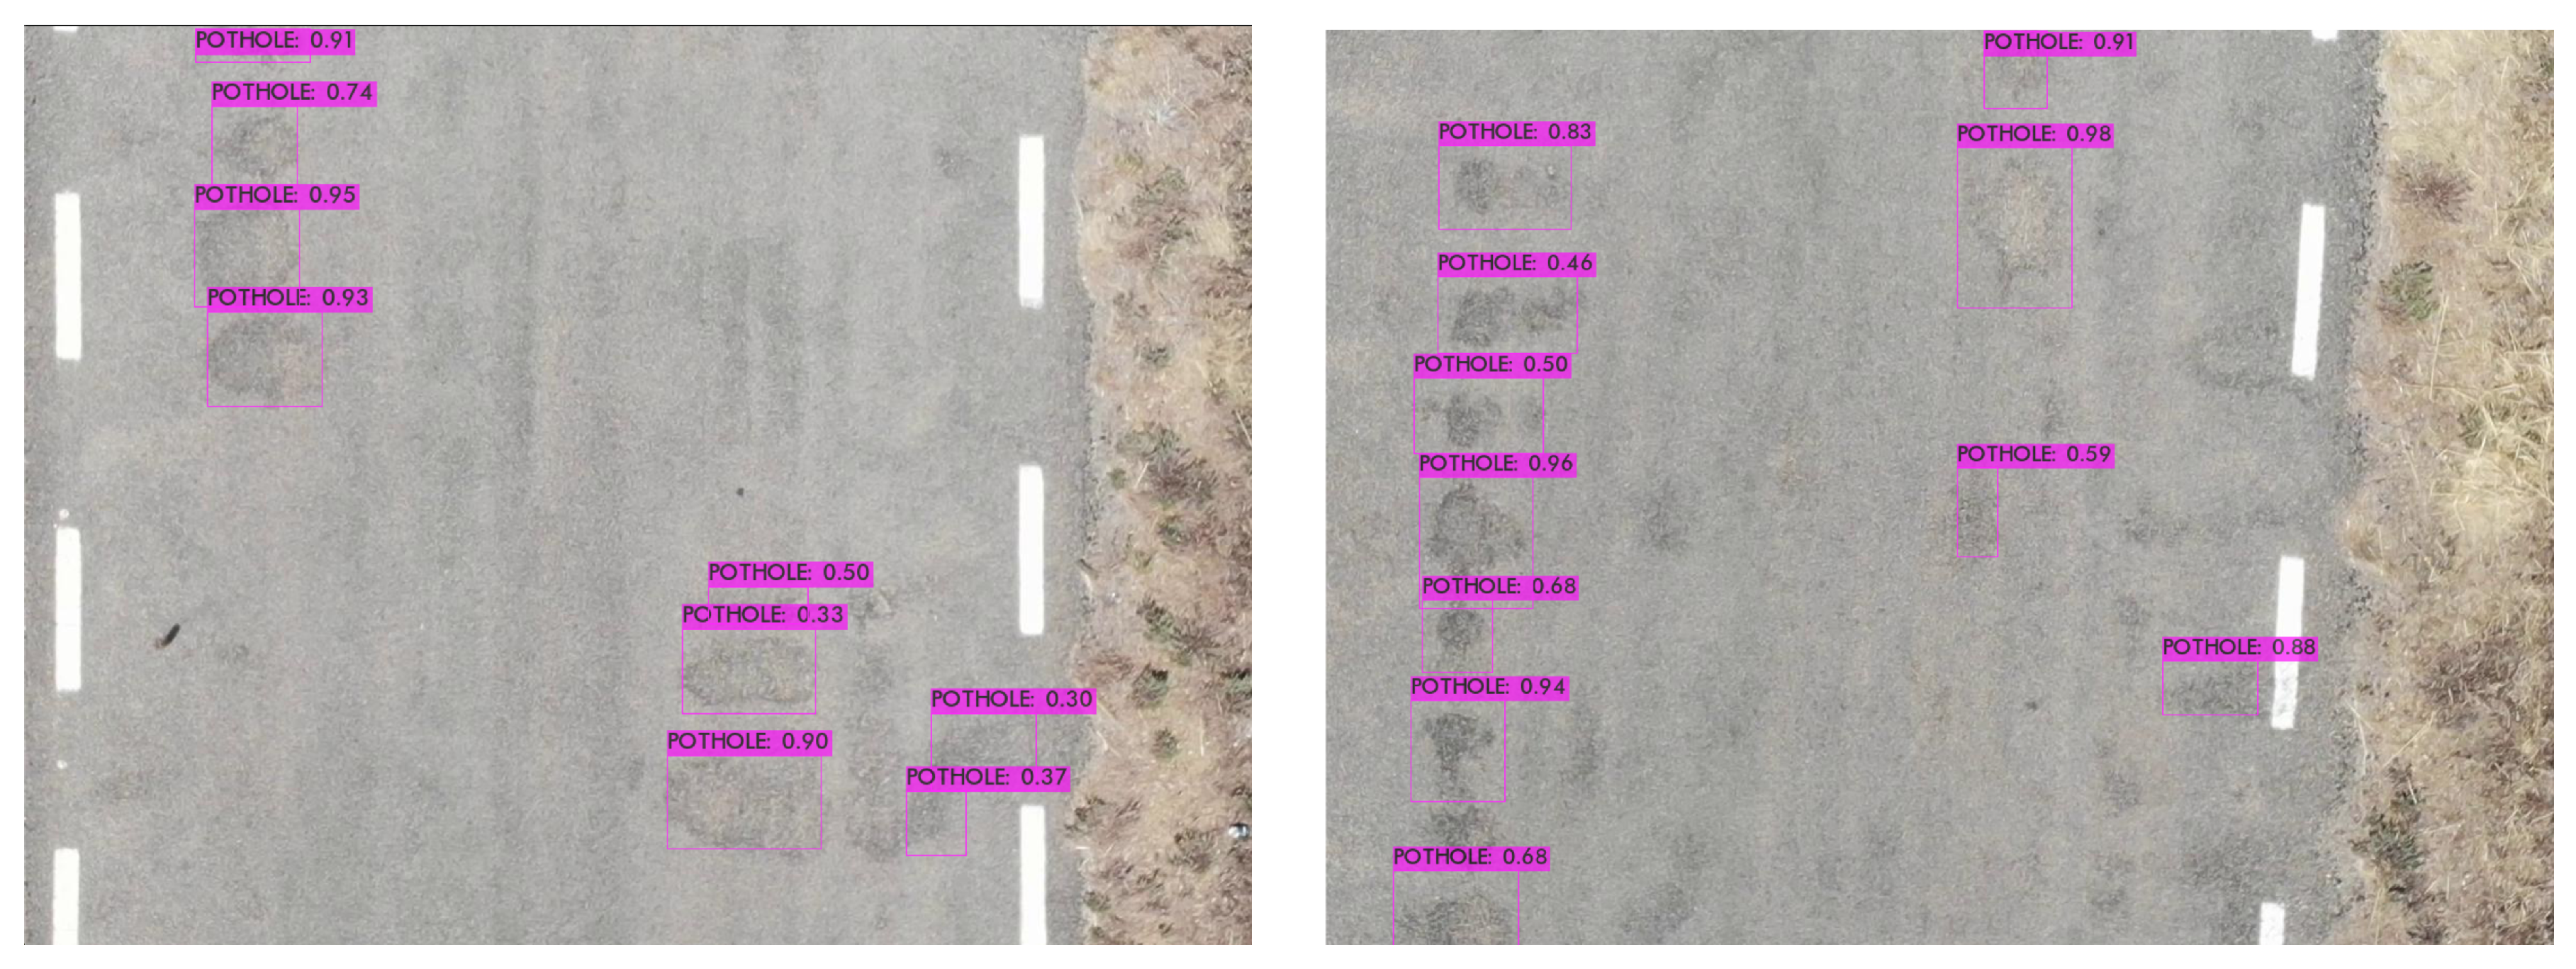
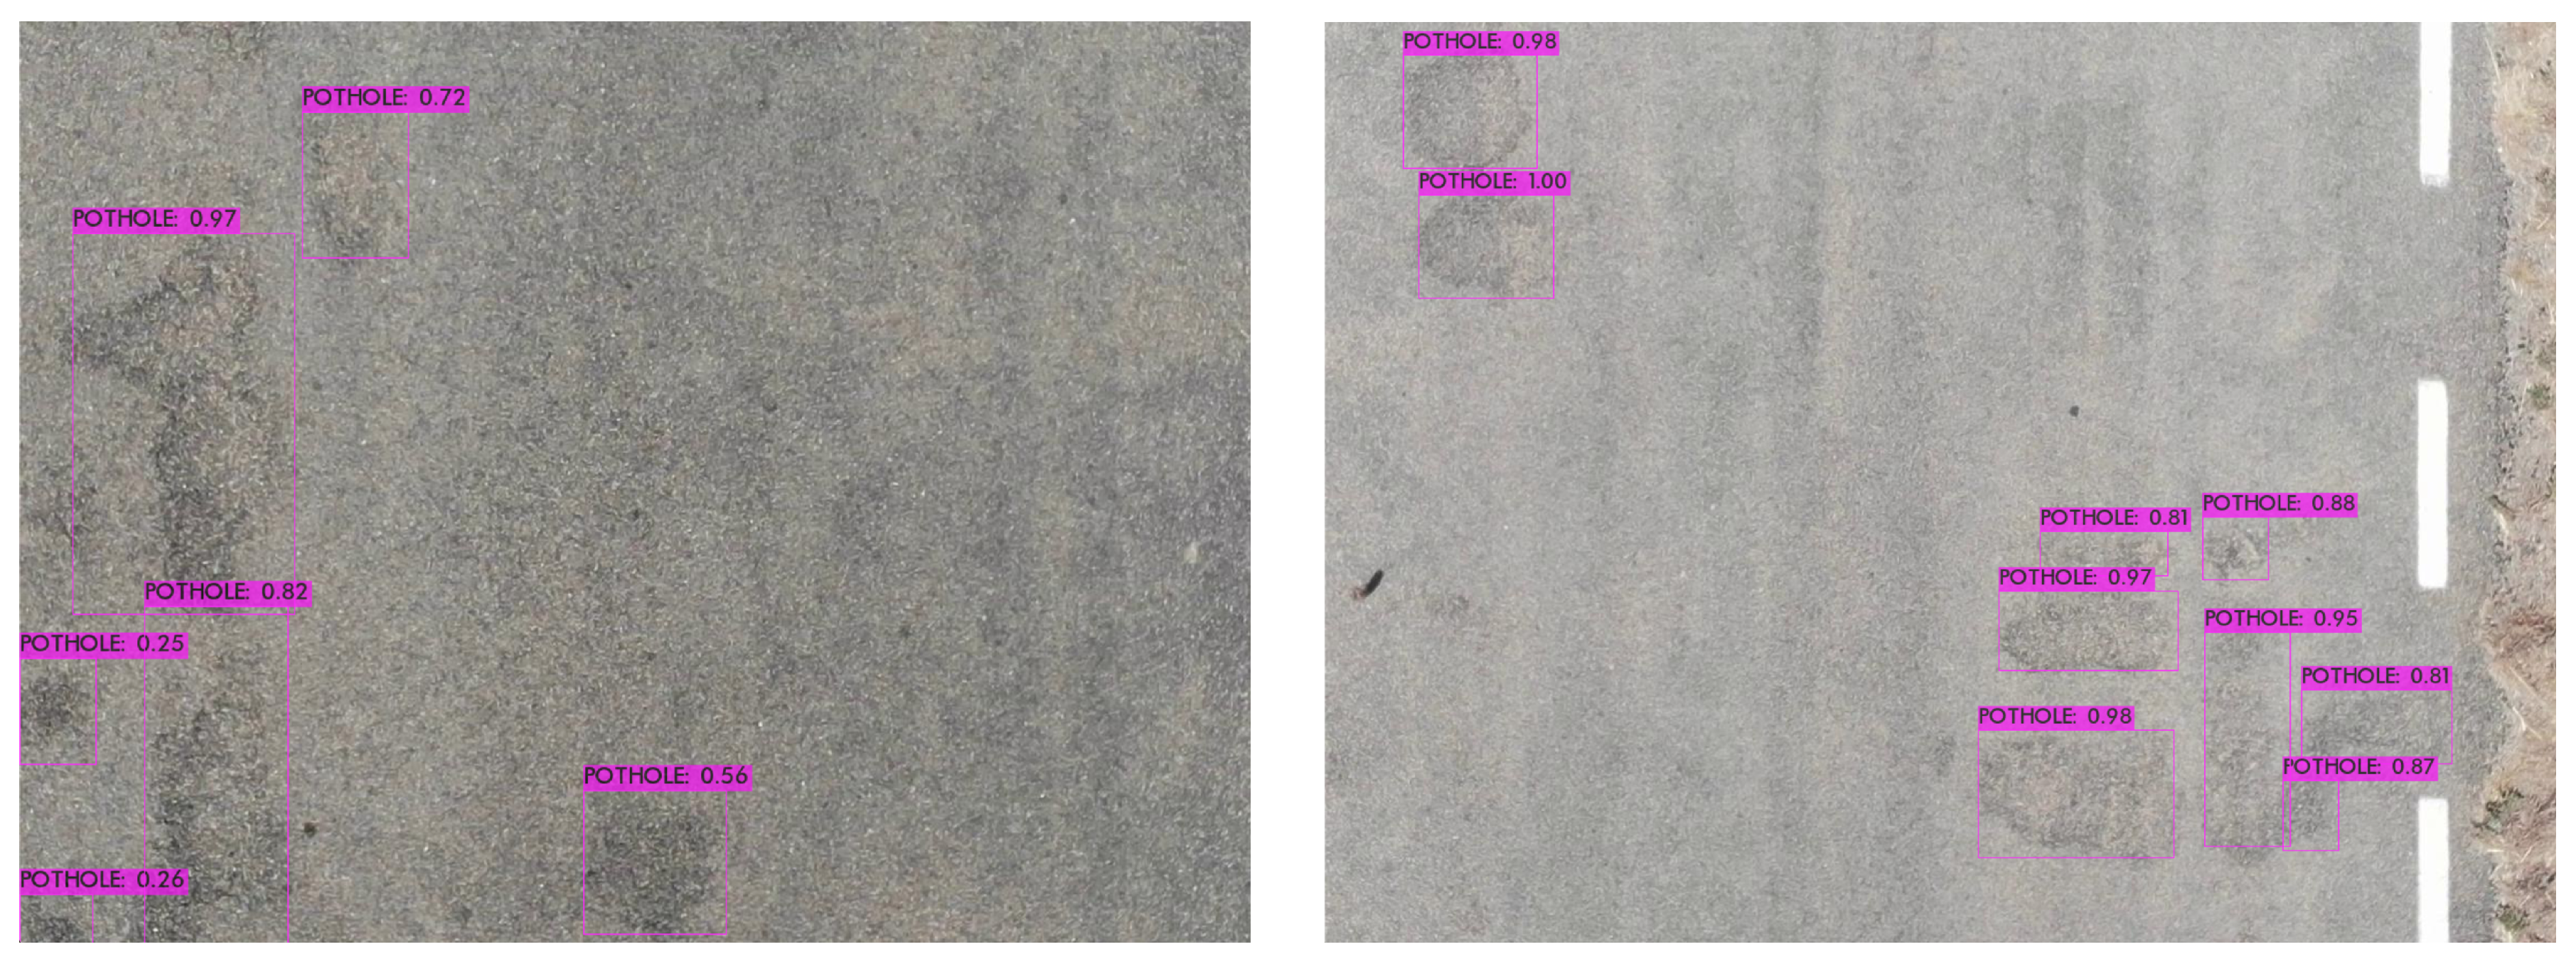
4.2. Detection
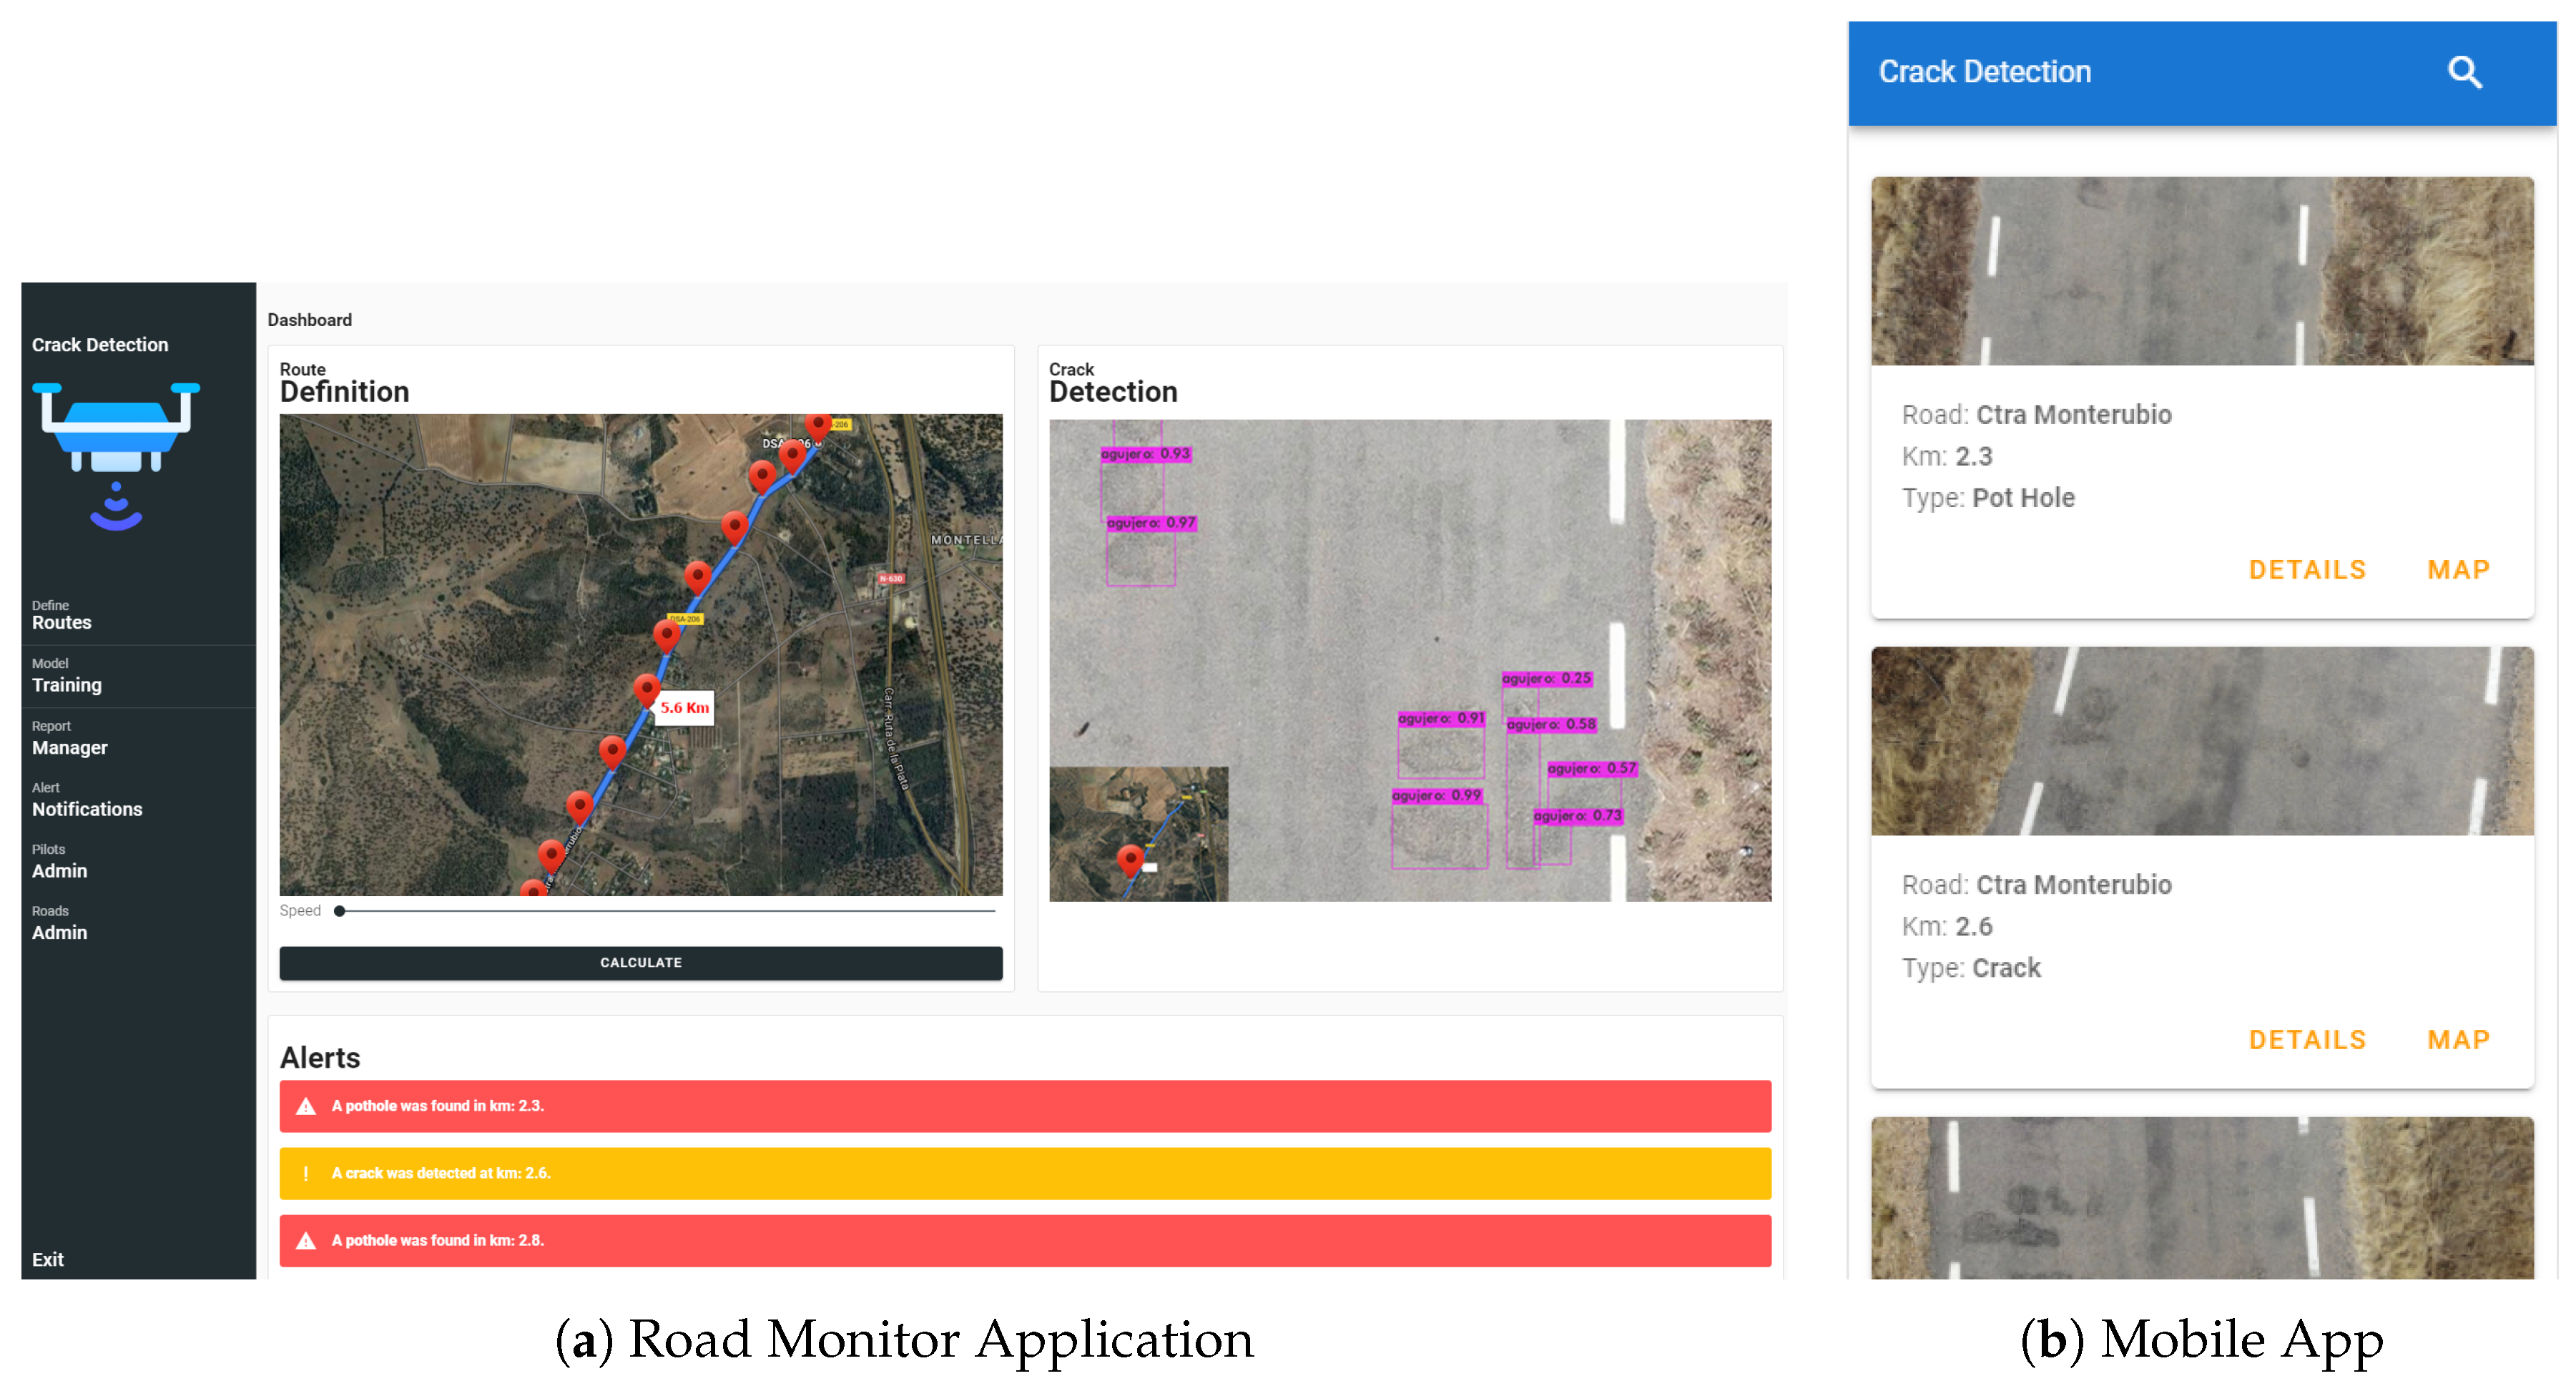
4.3. Application
5. Conclusions
Supplementary Materials
Author Contributions
Funding
Conflicts of Interest
Abbreviations
| AEC | Spanish Road Association |
| AP | Average Precision |
| FPS | Frames Per Second |
| FPN | Feature Pyramid Network |
| GPS | Global Positioning System |
| IoT | Internet of Things |
| JADE | Java Agent Development Framework |
| mAP | Mean Average Precision |
| MAS | Multi-Agent System |
| MARL | Multi-Agent Reinforcement Learning |
| YOLO | You Only Look Once |
| PANGEA | Platform for Automatic coNstruction of orGanizations of intElligent Agents |
| UAV | Unmanned Aerial Vehicle |
| FPN | Feature Pyramid Network |
| SAM | Spatial Attention Module |
| SPP | Spatial Pyramid Pooling |
| RL | Reinforcement Learning |
| PANet | Prototype Alignment Network |
| SPADE | Smart Python Agent Development Environment |
Appendix A


References
- Harvey, J.; Al-Qadi, I.L.; Ozer, H.; Flintsch, G. Pavement, Roadway, and Bridge Life Cycle Assessment 2020: Proceedings of the International Symposium on Pavement. Roadway, and Bridge Life Cycle Assessment 2020 (LCA 2020, Sacramento, CA, 3–6 June 2020); CRC Press: Boca Raton, FL, USA, 2020. [Google Scholar]
- She, X.; Zhang, H.; Wang, Z.; Yan, J. Feasibility study of asphalt pavement pothole properties measurement using 3D line laser technology. Int. J. Transp. Sci. Technol. 2020. [Google Scholar] [CrossRef]
- Wang, H.; Chen, C.H.; Cheng, D.; Lin, C.H.; Lo, C.C. A Real-Time Pothole Detection Approach for Intelligent Transportation System. Math. Probl. Eng. 2015. [Google Scholar] [CrossRef]
- Li, W.; Shen, Z.; Li, P. Crack Detection of Track Plate Based on YOLO. In Proceedings of the 2019 12th International Symposium on Computational Intelligence and Design, ISCID 2019, Hangzhou, China, 14–15 December 2019; pp. 15–18. [Google Scholar] [CrossRef]
- Kim, J.; Kim, S.; Jeong, J.; Kim, H.; Park, J.S.; Kim, T. CBDN: Cloud-Based Drone Navigation for Efficient Battery Charging in Drone Networks. IEEE Trans. Intell. Transp. Syst. 2019, 20, 4174–4191. [Google Scholar] [CrossRef]
- Celtek, S.A.; Durdu, A.; Kurnaz, E. Design and Simulation of the Hierarchical Tree Topology Based Wireless Drone Networks. In Proceedings of the 2018 International Conference on Artificial Intelligence and Data Processing, IDAP 2018, Malatya, Turkey, 28–30 September 2018; Institute of Electrical and Electronics Engineers Inc.: Piscataway, NJ, USA, 2019. [Google Scholar] [CrossRef]
- Wang, D.; Hu, P.; Du, J.; Zhou, P.; Deng, T.; Hu, M. Routing and Scheduling for Hybrid Truck-Drone Collaborative Parcel Delivery With Independent and Truck-Carried Drones. IEEE Internet Things J. 2019, 6, 10483–10495. [Google Scholar] [CrossRef]
- Redmon, J.; Farhadi, A. YOLO9000: Better, Faster, Stronger. In Proceedings of the IEEE Conference on Computer Vision and Pattern Recognition, CVPR 2017, Honolulu, HI, USA, 21–26 July 2017. [Google Scholar] [CrossRef]
- Redmon, J.; Farhadi, A. YOLOv3: An Incremental Improvement. arXiv 2018, arXiv:1804.02767. [Google Scholar]
- Bochkovskiy, A.; Wang, C.Y.; Liao, H.Y.M. YOLOv4: Optimal Speed and Accuracy of Object Detection. arXiv 2020, arXiv:2004.10934. [Google Scholar]
- Kim, N.V.; Mikhailov, N.A.; Mokrova, M.I. Drone Searches in Challenging Conditions. Russ. Eng. Res. 2020, 40, 583–585. [Google Scholar] [CrossRef]
- Hodge, V.J.; Hawkins, R.; Alexander, R. Deep reinforcement learning for drone navigation using sensor data. Neural Comput. Appl. 2020, 1–19. [Google Scholar] [CrossRef]
- Shukla, M.; Chen, Z.; Lu, C.T. DIMPL: A distributed in-memory drone flight path builder system. J. Big Data 2018, 5, 1–29. [Google Scholar] [CrossRef]
- Abou, U.; Belkaid, B. Dynamic Reconfiguration of LPWANs Pervasive System Using Multi-agent Approach. Int. J. Adv. Comput. Sci. Appl. 2018, 9, 300–305. [Google Scholar]
- Sales Mendes, A.; Jiménez-Bravo, D.M.; Navarro-Cáceres, M.; Reis, V.; Leithardt, Q.; Villarrubia González, G. Multi-Agent Approach Using LoRaWAN Devices: An Airport Case Study. Eletronics 2020, 9, 1430. [Google Scholar] [CrossRef]
- Villarrubia, G.; De Paz, J.F.; Bajo, J.; Corchado, J.M. Ambient agents: Embedded agents for remote control and monitoring using the PANGEA platform. Sensors 2014, 14, 13955–13979. [Google Scholar] [CrossRef] [PubMed]
- Das, L.B.; Mohan, V.; George, G. Human Target Search and Detection using Autonomous UAV and Deep learning. In Proceedings of the 2020 IEEE International Conference on Industry 4.0, Artificial Intelligence, and Communications Technology (IAICT), Bali, Indonesia, 7–8 July 2020. [Google Scholar]
- Yang, Q.; Shi, L.; Han, J.; Yu, J.; Huang, K. A near real-time deep learning approach for detecting rice phenology based on UAV images. Agric. For. Meteorol. 2020, 287. [Google Scholar] [CrossRef]
- Chew, R.; Rineer, J.; Beach, R.; O’Neil, M.; Ujeneza, N.; Lapidus, D.; Miano, T.; Hegarty-Craver, M.; Polly, J.; Temple, D.S. Deep Neural Networks and Transfer Learning for Food Crop Identification in UAV Images. Drones 2020, 4, 7. [Google Scholar] [CrossRef]
- Cledat, E.; Jospin, L.V.; Cucci, D.A.; Skaloud, J. Mapping quality prediction for RTK/PPK-equipped micro-drones operating in complex natural environment. ISPRS J. Photogramm. Remote Sens. 2020, 167, 24–38. [Google Scholar] [CrossRef]
- Alwateer, M.; Loke, S.W.; Fernando, N. Enabling Drone Services: Drone Crowdsourcing and Drone Scripting. IEEE Access 2019, 7, 110035–110049. [Google Scholar] [CrossRef]
- Watanabe, K.; Takahashi, M. Head-synced Drone Control for Reducing Virtual Reality Sickness. J. Intell. Robot. Syst. Theory Appl. 2020, 97, 733–744. [Google Scholar] [CrossRef]
- Deng, L.L. Pre-detection Technology of Clothing Image Segmentation Based on GrabCut Algorithm. Wirel. Pers. Commun. 2018, 102, 599–610. [Google Scholar] [CrossRef]
- Miao, Y.; Jeon, J.Y.; Park, G. An image processing-based crack detection technique for pressed panel products. J. Manuf. Syst. 2020, 57, 287–297. [Google Scholar] [CrossRef]
- Ren, Y.; Huang, J.; Hong, Z.; Lu, W.; Yin, J.; Zou, L.; Shen, X. Image-based concrete crack detection in tunnels using deep fully convolutional networks. Constr. Build. Mater. 2020, 234, 117367. [Google Scholar] [CrossRef]
- Wang, Y.; Zhang, J.Y.; Liu, J.X.; Zhang, Y.; Chen, Z.P.; Li, C.G.; He, K.; Yan, R.B. Research on Crack Detection Algorithm of the Concrete Bridge Based on Image Processing. Procedia Comput. Sci. 2018, 154, 610–616. [Google Scholar] [CrossRef]
- Miskdjian, I.; Hajikazemi, M.; Van Paepegem, W. Automatic edge detection of ply cracks in glass fiber composite laminates under quasi-static and fatigue loading using multi-scale Digital Image Correlation. Compos. Sci. Technol. 2020, 200, 108401. [Google Scholar] [CrossRef]
- Dhimish, M.; Holmes, V. Solar cells micro crack detection technique using state-of-the-art electroluminescence imaging. J. Sci. Adv. Mater. Devices 2019, 4, 499–508. [Google Scholar] [CrossRef]
- Gehri, N.; Mata-Falcón, J.; Kaufmann, W. Automated crack detection and measurement based on digital image correlation. Constr. Build. Mater. 2020, 256, 119383. [Google Scholar] [CrossRef]
- Qiu, Z.; Wang, S.; Zeng, Z.; Yu, D. Automatic visual defects inspection of wind turbine blades via YOLO-based small object detection approach. J. Electron. Imaging 2019, 28, 1. [Google Scholar] [CrossRef]
- Park, S.E.; Eem, S.H.; Jeon, H. Concrete crack detection and quantification using deep learning and structured light. Constr. Build. Mater. 2020, 252, 119096. [Google Scholar] [CrossRef]
- Fang, F.; Li, L.; Gu, Y.; Zhu, H.; Lim, J.H. A novel hybrid approach for crack detection. Pattern Recognit. 2020, 107, 107474. [Google Scholar] [CrossRef]
- Hwang, H.; Oh, J.; Lee, K.H.; Cha, J.H.; Choi, E.; Yoon, Y.; Hwang, J.H. Synergistic approach to quantifying information on a crack-based network in loess/water material composites using deep learning and network science. Comput. Mater. Sci. 2019, 166, 240–250. [Google Scholar] [CrossRef]
- Du, Y.; Pan, N.; Xu, Z.; Deng, F.; Shen, Y.; Kang, H. Pavement distress detection and classification based on YOLO network. Int. J. Pavement Eng. 2020. [Google Scholar] [CrossRef]
- Majidifard, H.; Adu-Gyamfi, Y.; Buttlar, W.G. Deep machine learning approach to develop a new asphalt pavement condition index. Constr. Build. Mater. 2020, 247, 118513. [Google Scholar] [CrossRef]
- Xia, B.; Cao, J.; Zhang, X.; Peng, Y. Automatic concrete sleeper crack detection using a one-stage detector. Int. J. Intell. Robot. Appl. 2020, 4, 319–327. [Google Scholar] [CrossRef]
- Nie, M.; Wang, C. Pavement Crack Detection based on yolo v3. In Proceedings of the 2019 2nd International Conference on Safety Produce Informatization (IICSPI 2019), Chongqing, China, 28–30 November 2019; pp. 327–330. [CrossRef]
- Peng, C.; Yang, M.; Zheng, Q.; Zhang, J.; Wang, D.; Yan, R.; Wang, J.; Li, B. A triple-thresholds pavement crack detection method leveraging random structured forest. Constr. Build. Mater. 2020, 263, 120080. [Google Scholar] [CrossRef]
- Zhuang, Y.; Ke, R.; Wang, Y. Edge-Based Traffic Flow Data Collection Method Using Onboard Monocular Camera. J. Transp. Eng. Part A Syst. 2020, 146, 04020096. [Google Scholar] [CrossRef]
- Banerjee, S.; Singh, S.K.; Chakraborty, A.; Das, A.; Bag, R. Melanoma Diagnosis Using Deep Learning and Fuzzy Logic. Diagnostics 2020, 10, 577. [Google Scholar] [CrossRef] [PubMed]
- Mandal, V.; Uong, L.; Adu-Gyamfi, Y. Automated Road Crack Detection Using Deep Convolutional Neural Networks. In Proceedings of the 2018 IEEE International Conference on Big Data, Big Data 2018, Seattle, WA, USA, 10–13 December 2018; Institute of Electrical and Electronics Engineers Inc.: Piscataway, NJ, USA, 2019; pp. 5212–5215. [Google Scholar] [CrossRef]
- Zhang, J.; Yang, X.; Li, W.; Zhang, S.; Jia, Y. Automatic detection of moisture damages in asphalt pavements from GPR data with deep CNN and IRS method. Autom. Constr. 2020, 113, 103119. [Google Scholar] [CrossRef]
- Luo, Z.; Yu, H.; Zhang, Y. Pine cone detection using boundary equilibrium generative adversarial networks and improved YOLOv3 model. Sensors 2020, 20, 4430. [Google Scholar] [CrossRef]
- Morera, Á.; Sánchez, Á.; Moreno, A.B.; Sappa, Á.D.; Vélez, J.F. Ssd vs. Yolo for detection of outdoor urban advertising panels under multiple variabilities. Sensors 2020, 20, 4587. [Google Scholar] [CrossRef]
- Cao, C.; Wu, J.; Zeng, X.; Feng, Z.; Wang, T.; Yan, X.; Wu, Z.; Wu, Q.; Huang, Z. Research on airplane and ship detection of aerial remote sensing images based on convolutional neural network. Sensors 2020, 20, 4696. [Google Scholar] [CrossRef]
- Huang, Z.; Wang, J.; Fu, X.; Yu, T.; Guo, Y.; Wang, R. DC-SPP-YOLO: Dense connection and spatial pyramid pooling based YOLO for object detection. Inf. Sci. 2020, 522, 241–258. [Google Scholar] [CrossRef]
- Wu, G.; Gao, X.; Wan, K. Mobility control of unmanned aerial vehicle as communication relay to optimize ground-to-air uplinks. Sensors 2020, 20, 2322. [Google Scholar] [CrossRef]
- Walker, O.; Vanegas, F.; Gonzalez, F. A framework for multi-agent UAV exploration and target-finding in GPS-denied and partially observable environments. Sensors 2020, 20, 4739. [Google Scholar] [CrossRef] [PubMed]
- Welcome to SPADE’s Documentation!—SPADE 3.1.4 Documentation. Available online: https://spade-mas.readthedocs.io/en/latest/index.html (accessed on 8 September 2020).
- Anandan, R. Machine Condition Monitoring Software Agent Using JADE and Data Mining. J. Inst. Eng. Ser. B 2015, 96, 61–67. [Google Scholar] [CrossRef]
- Zato, C.; Villarrubia, G.; Sanchez, A.; Barri, I.; Rubión, E.; Fernández, A.; Sánchez, C.; Cabo, J.; Álamos, T.; Sanz, J.; et al. PANGEA -Platform for Automatic coNstruction of orGanizations of intElligent Agents. In Advances in Intelligent and Soft Computing; Springer: Berlin/Heidelberg, Germany, 2012; Volume 151. [Google Scholar] [CrossRef]
- osBrain—0.6.5—osBrain 0.6.5 Documentation. Available online: https://osbrain.readthedocs.io/en/stable/index.html (accessed on 8 September 2020).
- Dhiman, A.; Klette, R. Pothole Detection Using Computer Vision and Learning. IEEE Trans. Intell. Transp. Syst. 2019, 21, 3536–3550. [Google Scholar] [CrossRef]
- Tzutalin/LabelImg. Free Software: MIT License. Available online: https://github.com/tzutalin/labelImg (accessed on 20 August 2020).
- Fang, W.; Wang, L.; Ren, P. Tinier-YOLO: A Real-Time Object Detection Method for Constrained Environments. IEEE Access 2020, 8, 1935–1944. [Google Scholar] [CrossRef]


| Version | Article | Features |
|---|---|---|
| YOLOv1 | [4,30,31,34,35,39,40] | 26 layers, SoftMax activation function, sum-squared risk calculation function, may not detect objects too close together, non-maximal suppression to eliminate duplicates. |
| YOLOv2 | [35,41]. | 30 layers, function of calculation of the risk of mean square error, requires fewer training times, batch normalization in the layers (an increase in the mean average precision (mAP)). |
| YOLOv3 | [37,42,43,44,45]. | 106 layers, multi-label sorting, SoftMax activation function with independent logistic sorters, binary cross-entropy loss calculation function for each label, small object enhancement. |
| YOLOv4 | [10]. | 53 layers, FPN for greater accuracy, SAM allows focus on a specific part of the image, SPP detects object deformations. |
| Method | mAP (%) | Speed (fps) |
|---|---|---|
| Faster RCNN | 76.4 | 5.0 |
| SSD | 74.3 | 46.0 |
| DSSD 321 | 78.6 | 9.5 |
| STDN | 78.1 | 40.3 |
| YOLO | 63.4 | 45.0 |
| YOLOv2 | 76.8 | 67.0 |
| YOLOv3 | 79.3 | 37.9 |
| DC-SPP-YOLO | 78.4 | 55.7 |
| YOLOv3(DC)+SPP | 79.7 | 37.0 |
| Agent | Description |
|---|---|
| Mapping | Allows iteration with maps to identify the existence of high-voltage cables in the flying area, distances to airports, etc. |
| Waypoint Calculator | Calculates optimal waypoints from route data. |
| Roads | Obtains a route from a road indicating two coordinates. This agent connects to external service APIs. One can use the services of Google or Open-Street Maps to obtain this information. |
| Battery Estimation | Estimates the battery life for the realization of a route. |
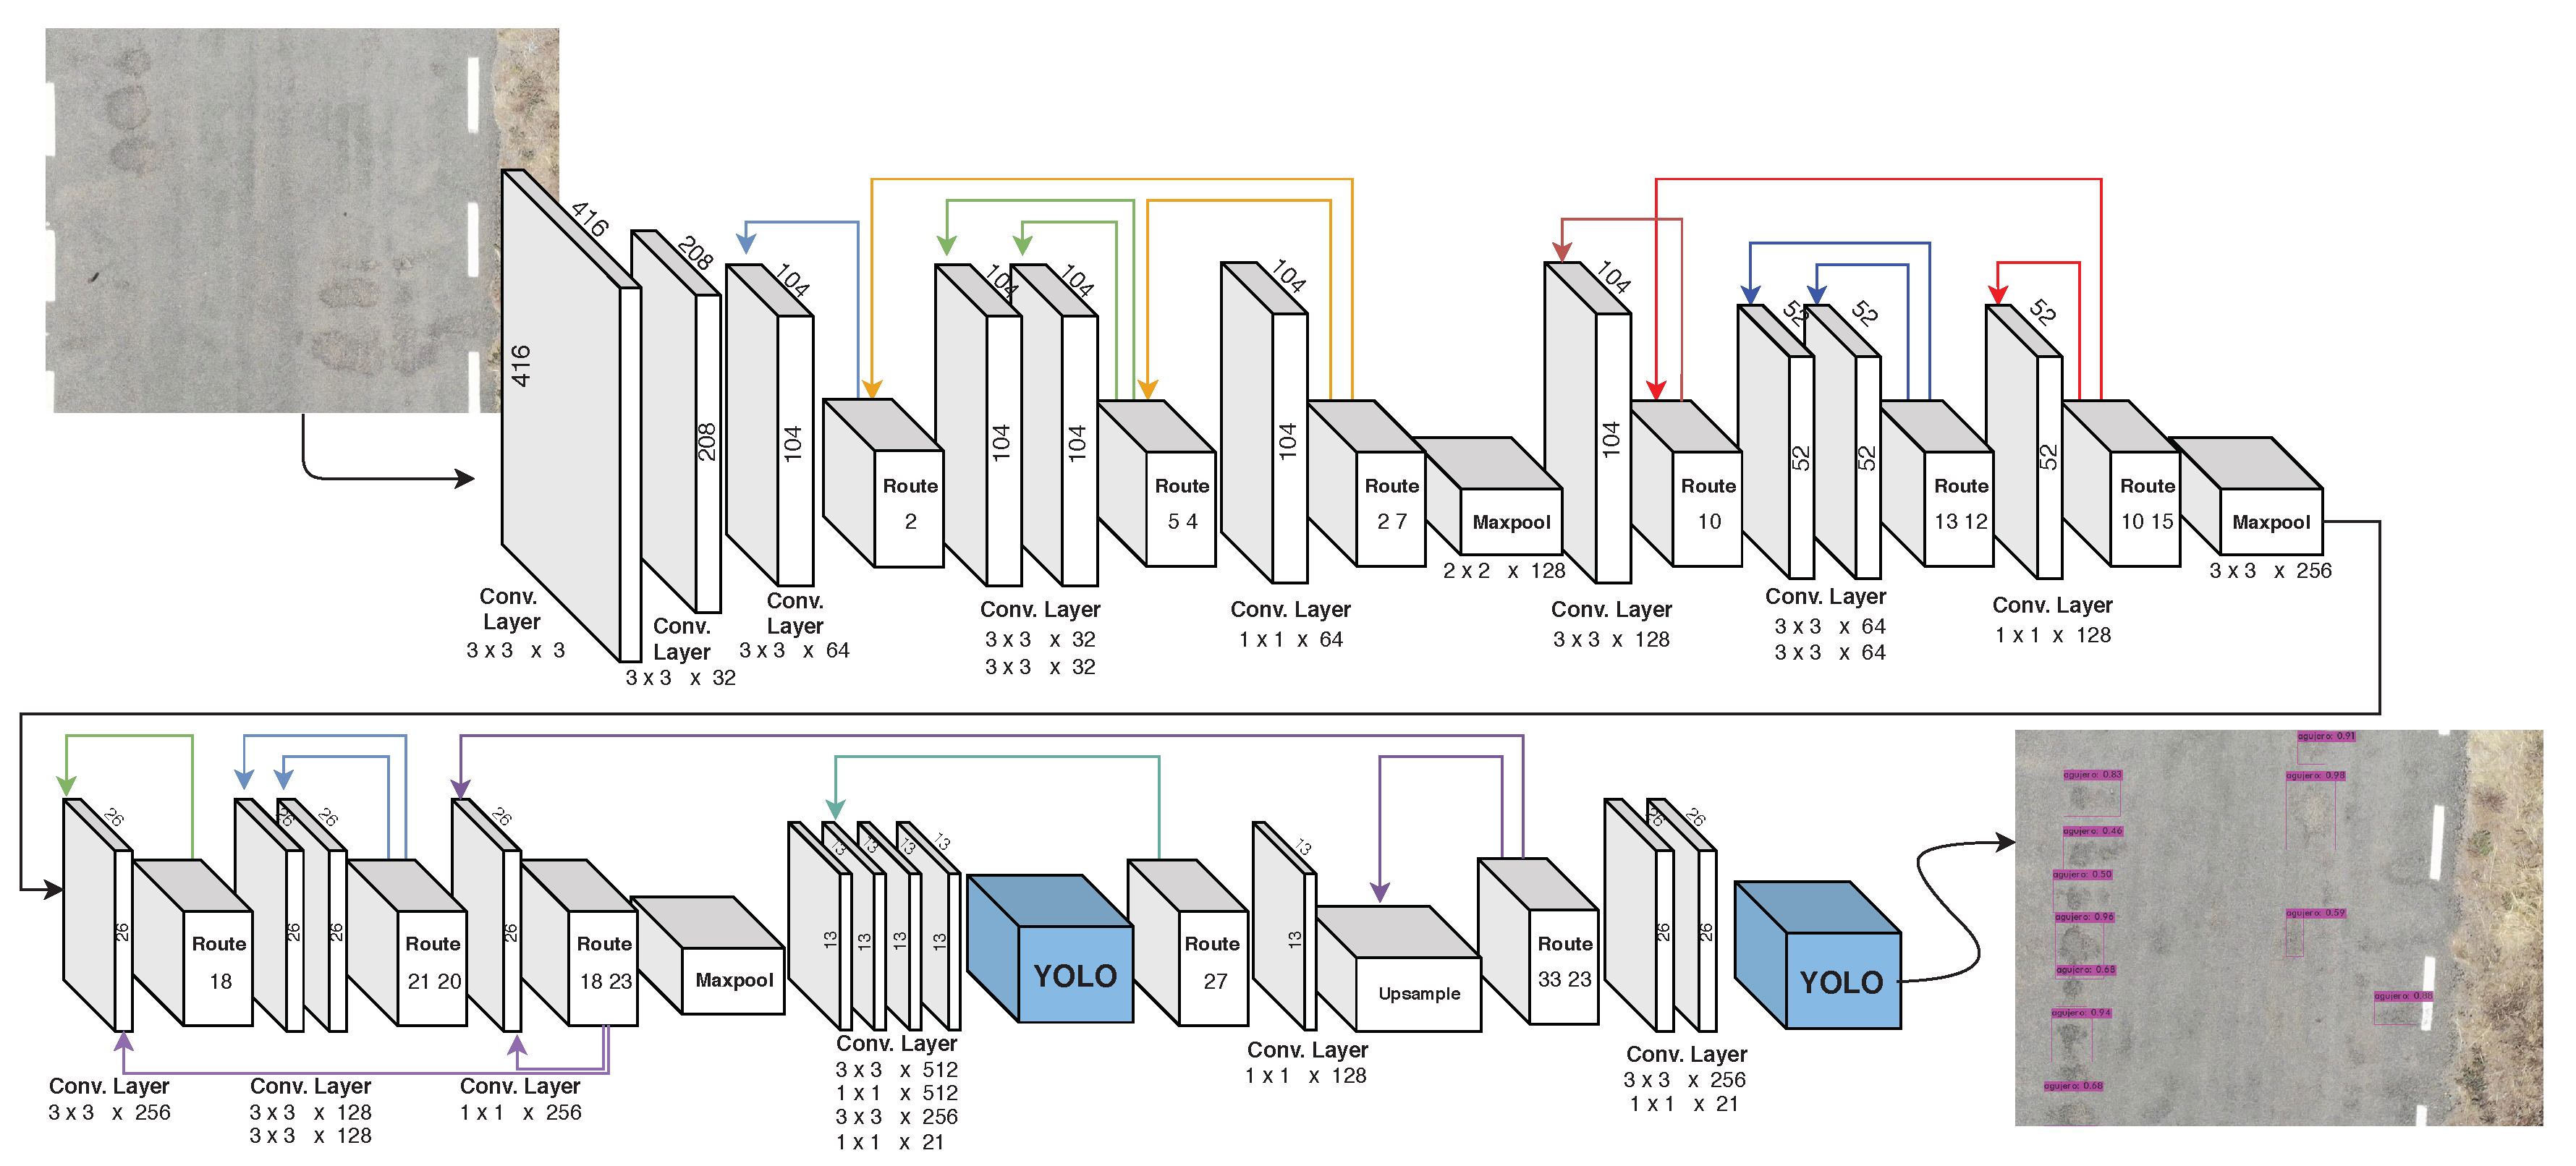
| Layer | Type | Filters | Size/Stride | Input | Output |
|---|---|---|---|---|---|
| 0 | Convolutional | 32 | 3 × 3/2 | 416 × 416 × 3 | 208 × 208 × 32 |
| 1 | Convolutional | 64 | 3 × 3/2 | 208 × 208 × 32 | 104 × 104 × 64 |
| 2 | Convolutional | 64 | 3 × 3/1 | 104 × 104 × 64 | 104 × 104 × 64 |
| 3 | Route 2 | ||||
| 4 | Convolutional | 32 | 3 × 3/1 | 104 × 104 × 32 | 104 × 104 × 32 |
| 5 | Convolutional | 32 | 3 × 3/1 | 104 × 104 × 32 | 104 × 104 × 32 |
| 6 | Route 5 4 | ||||
| 7 | Convolutional | 64 | 1 × 1/1 | 104 × 104 × 64 | 104 × 104 × 64 |
| 8 | Route 2 7 | ||||
| 9 | Maxpool | 2 × 2/ 2 | 104 ×104 × 128 | 52 × 52 × 128 | |
| 10 | Convolutional | 128 | 3 × 3/1 | 52 × 52 × 128 | 52 × 52 × 128 |
| 11 | Route 10 | ||||
| 12 | Convolutional | 64 | 3 × 3/1 | 52 × 52 × 64 | 52 × 52 × 64 |
| 13 | Convolutional | 64 | 3 × 3/1 | 52 × 52 × 64 | 52 × 52 × 64 |
| 14 | Route 13 12 | ||||
| 15 | Convolutional | 128 | 1 × 1/1 | 52 × 52 × 128 | 52 × 52 × 128 |
| 16 | Route 10 15 | ||||
| 17 | Maxpool | 2 × 2/ 2 | 52 × 52×256 | 26 × 26 × 256 | |
| 18 | Convolutional | 256 | 3 × 3/1 | 26 × 26 × 256 | 26 × 26 × 256 |
| 19 | Route 18 | ||||
| 20 | Convolutional | 128 | 3 × 3/1 | 26 × 26 × 128 | 26 × 26 × 128 |
| 21 | Convolutional | 128 | 3 × 3/1 | 26 × 26 × 128 | 26 × 26 × 128 |
| 22 | Route 21 20 | ||||
| 23 | Convolutional | 256 | 1 ×1/1 | 26 × 26 × 256 | 26 × 26 ×256 |
| 24 | Route 18 23 | ||||
| 25 | Maxpool | 2 × 2/2 | 26 × 26 ×512 | 13 × 13 × 512 | |
| 26 | Convolutional | 512 | 3 × 3/1 | 13 × 13 × 512 | 13 × 13 × 512 |
| 27 | Convolutional | 256 | 1 × 1/1 | 13 × 13 × 512 | 13 × 13 × 256 |
| 28 | Convolutional | 512 | 3 × 3/1 | 13 × 13 × 256 | 13 × 13 × 512 |
| 29 | Convolutional | 21 | 1 ×1/1 | 13 × 13 × 512 | 13 × 13 × 21 |
| 30 | YOLO | ||||
| 31 | Route 27 | ||||
| 32 | Convolutional | 128 | 1 × 1/1 | 13 × 13 × 256 | 13 × 13 × 128 |
| 33 | Upsample | 2x | 13 × 13 × 128 | 26 × 26 × 128 | |
| 34 | Route 33 23 | ||||
| 35 | Convolutional | 256 | 3 × 3/1 | 26 × 26 × 384 | 26 × 26 × 256 |
| 36 | Convolutional | 21 | 1 × 1/1 | 26 × 26 × 256 | 26 × 26 × 21 |
| 37 | YOLO |
| Label | TP | FP | FN | Precision (%) | AP (%) | Kappa | Prediction Time (ms) |
|---|---|---|---|---|---|---|---|
| Pothole | 977 | 38 | - | 96.25 | 98.46 | - | - |
| Crack | 94 | 10 | - | 90.38 | 90.89 | - | - |
| Total | 1070 | 48 | 62 | 95.70 | 94.67 | 0.73 | 5.53 |
| Label | TP | FP | FN | Precision (%) | AP (%) | Kappa | Prediction Time (ms) |
|---|---|---|---|---|---|---|---|
| Pothole | 977 | 35 | - | 96.54 | 98.45 | - | - |
| Crack | 92 | 8 | - | 92.00 | 90.68 | - | - |
| Total | 1069 | 43 | 64 | 96.13 | 94.56 | 0.72 | 5.52 |
Publisher’s Note: MDPI stays neutral with regard to jurisdictional claims in published maps and institutional affiliations. |
© 2020 by the authors. Licensee MDPI, Basel, Switzerland. This article is an open access article distributed under the terms and conditions of the Creative Commons Attribution (CC BY) license (http://creativecommons.org/licenses/by/4.0/).
Share and Cite
Silva, L.A.; Sanchez San Blas, H.; Peral García, D.; Sales Mendes, A.; Villarubia González, G. An Architectural Multi-Agent System for a Pavement Monitoring System with Pothole Recognition in UAV Images. Sensors 2020, 20, 6205. https://doi.org/10.3390/s20216205
Silva LA, Sanchez San Blas H, Peral García D, Sales Mendes A, Villarubia González G. An Architectural Multi-Agent System for a Pavement Monitoring System with Pothole Recognition in UAV Images. Sensors. 2020; 20(21):6205. https://doi.org/10.3390/s20216205
Chicago/Turabian StyleSilva, Luís Augusto, Héctor Sanchez San Blas, David Peral García, André Sales Mendes, and Gabriel Villarubia González. 2020. "An Architectural Multi-Agent System for a Pavement Monitoring System with Pothole Recognition in UAV Images" Sensors 20, no. 21: 6205. https://doi.org/10.3390/s20216205
APA StyleSilva, L. A., Sanchez San Blas, H., Peral García, D., Sales Mendes, A., & Villarubia González, G. (2020). An Architectural Multi-Agent System for a Pavement Monitoring System with Pothole Recognition in UAV Images. Sensors, 20(21), 6205. https://doi.org/10.3390/s20216205