Label-Free Optical Resonator-Based Biosensors


Abstract
:1. Introduction
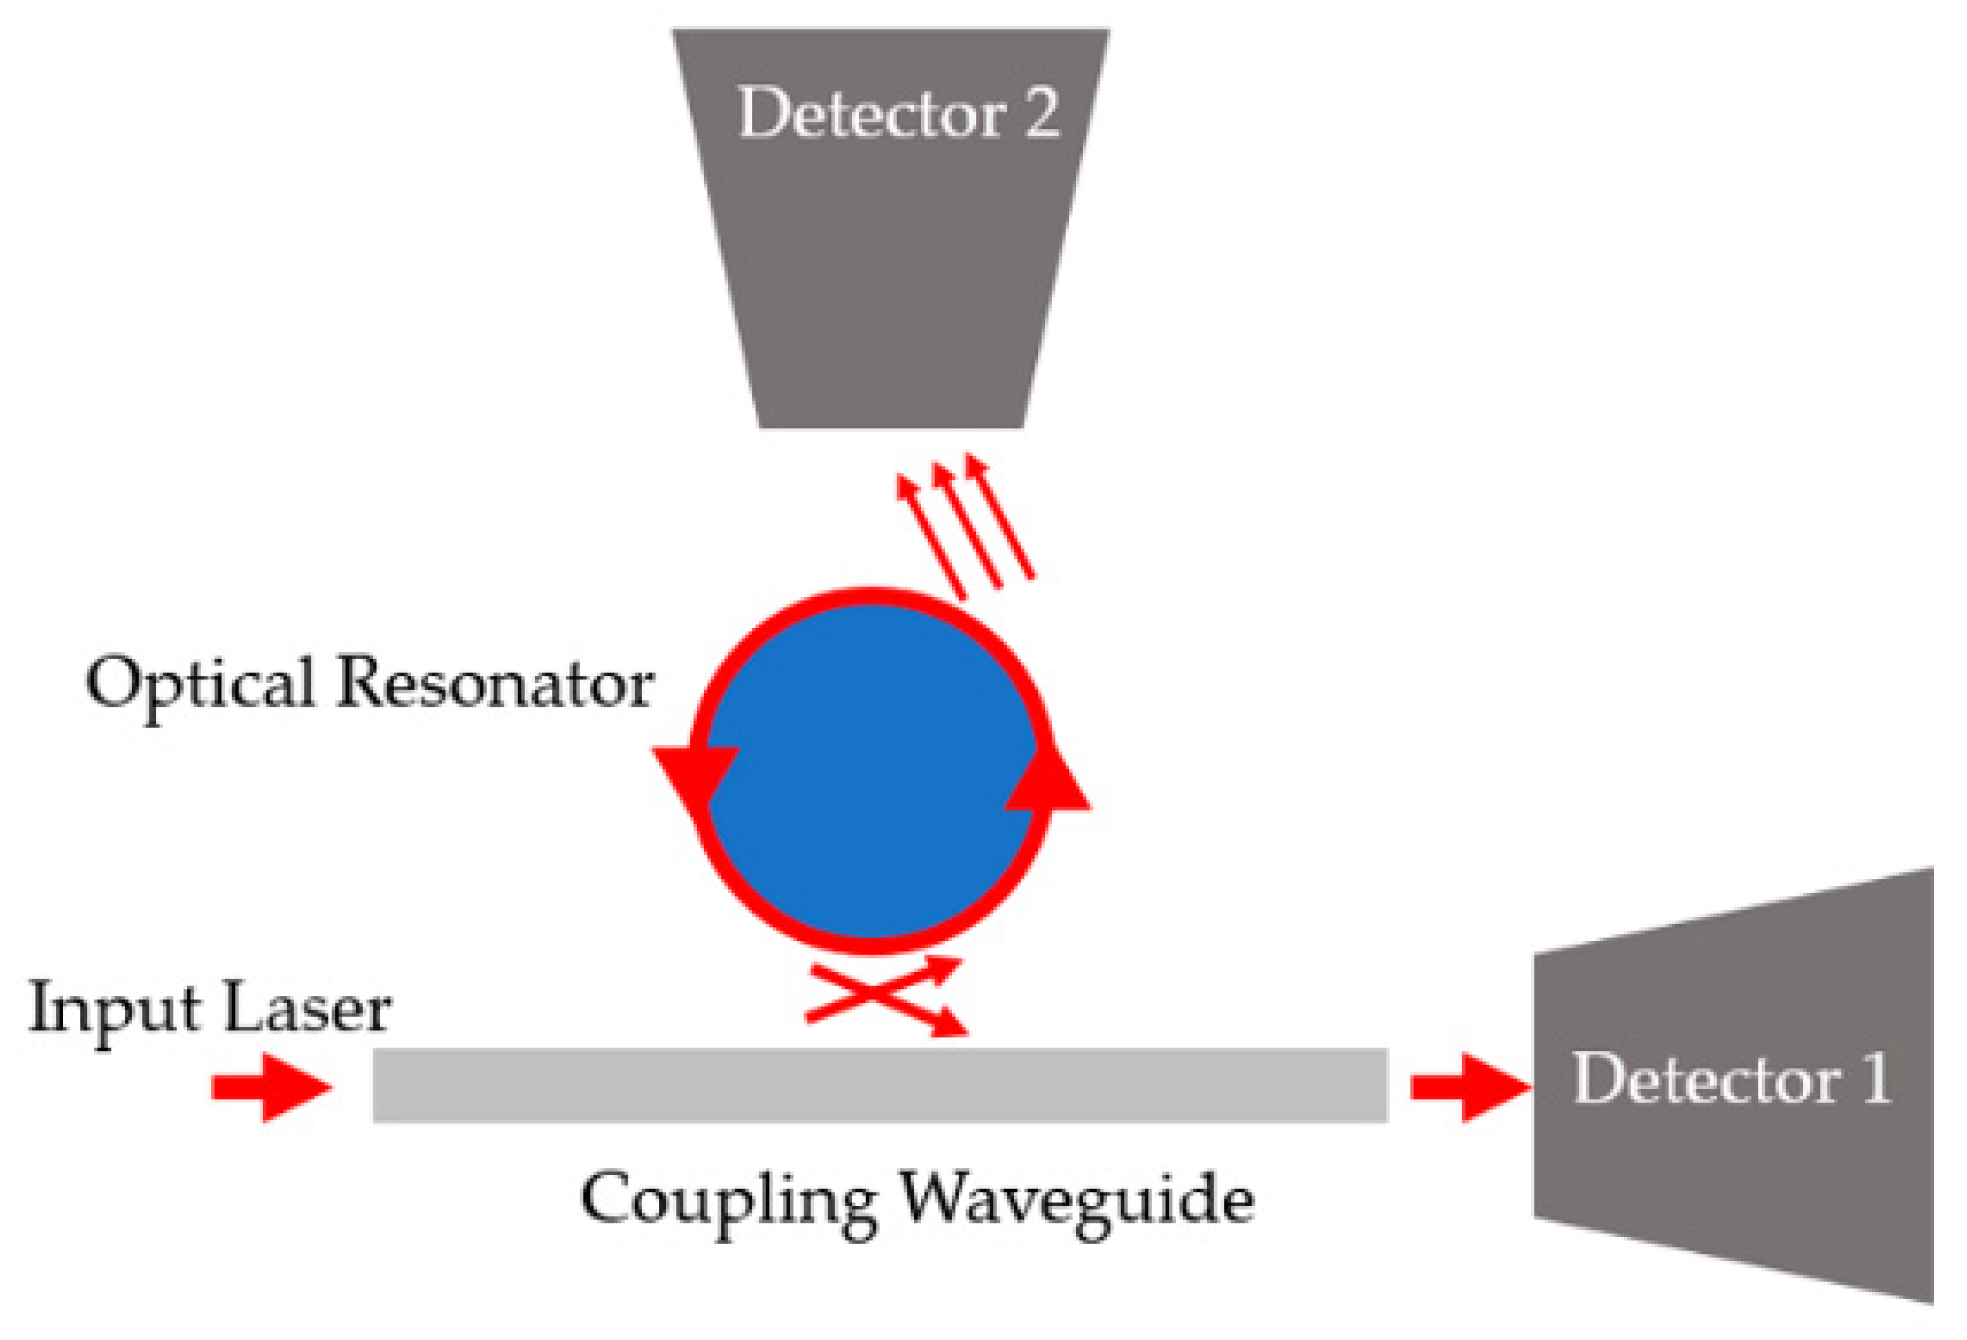
2. Optical Resonator-Based Biosensors
3. Fabry-Perot Interferometer (FPI)-Based Biosensors
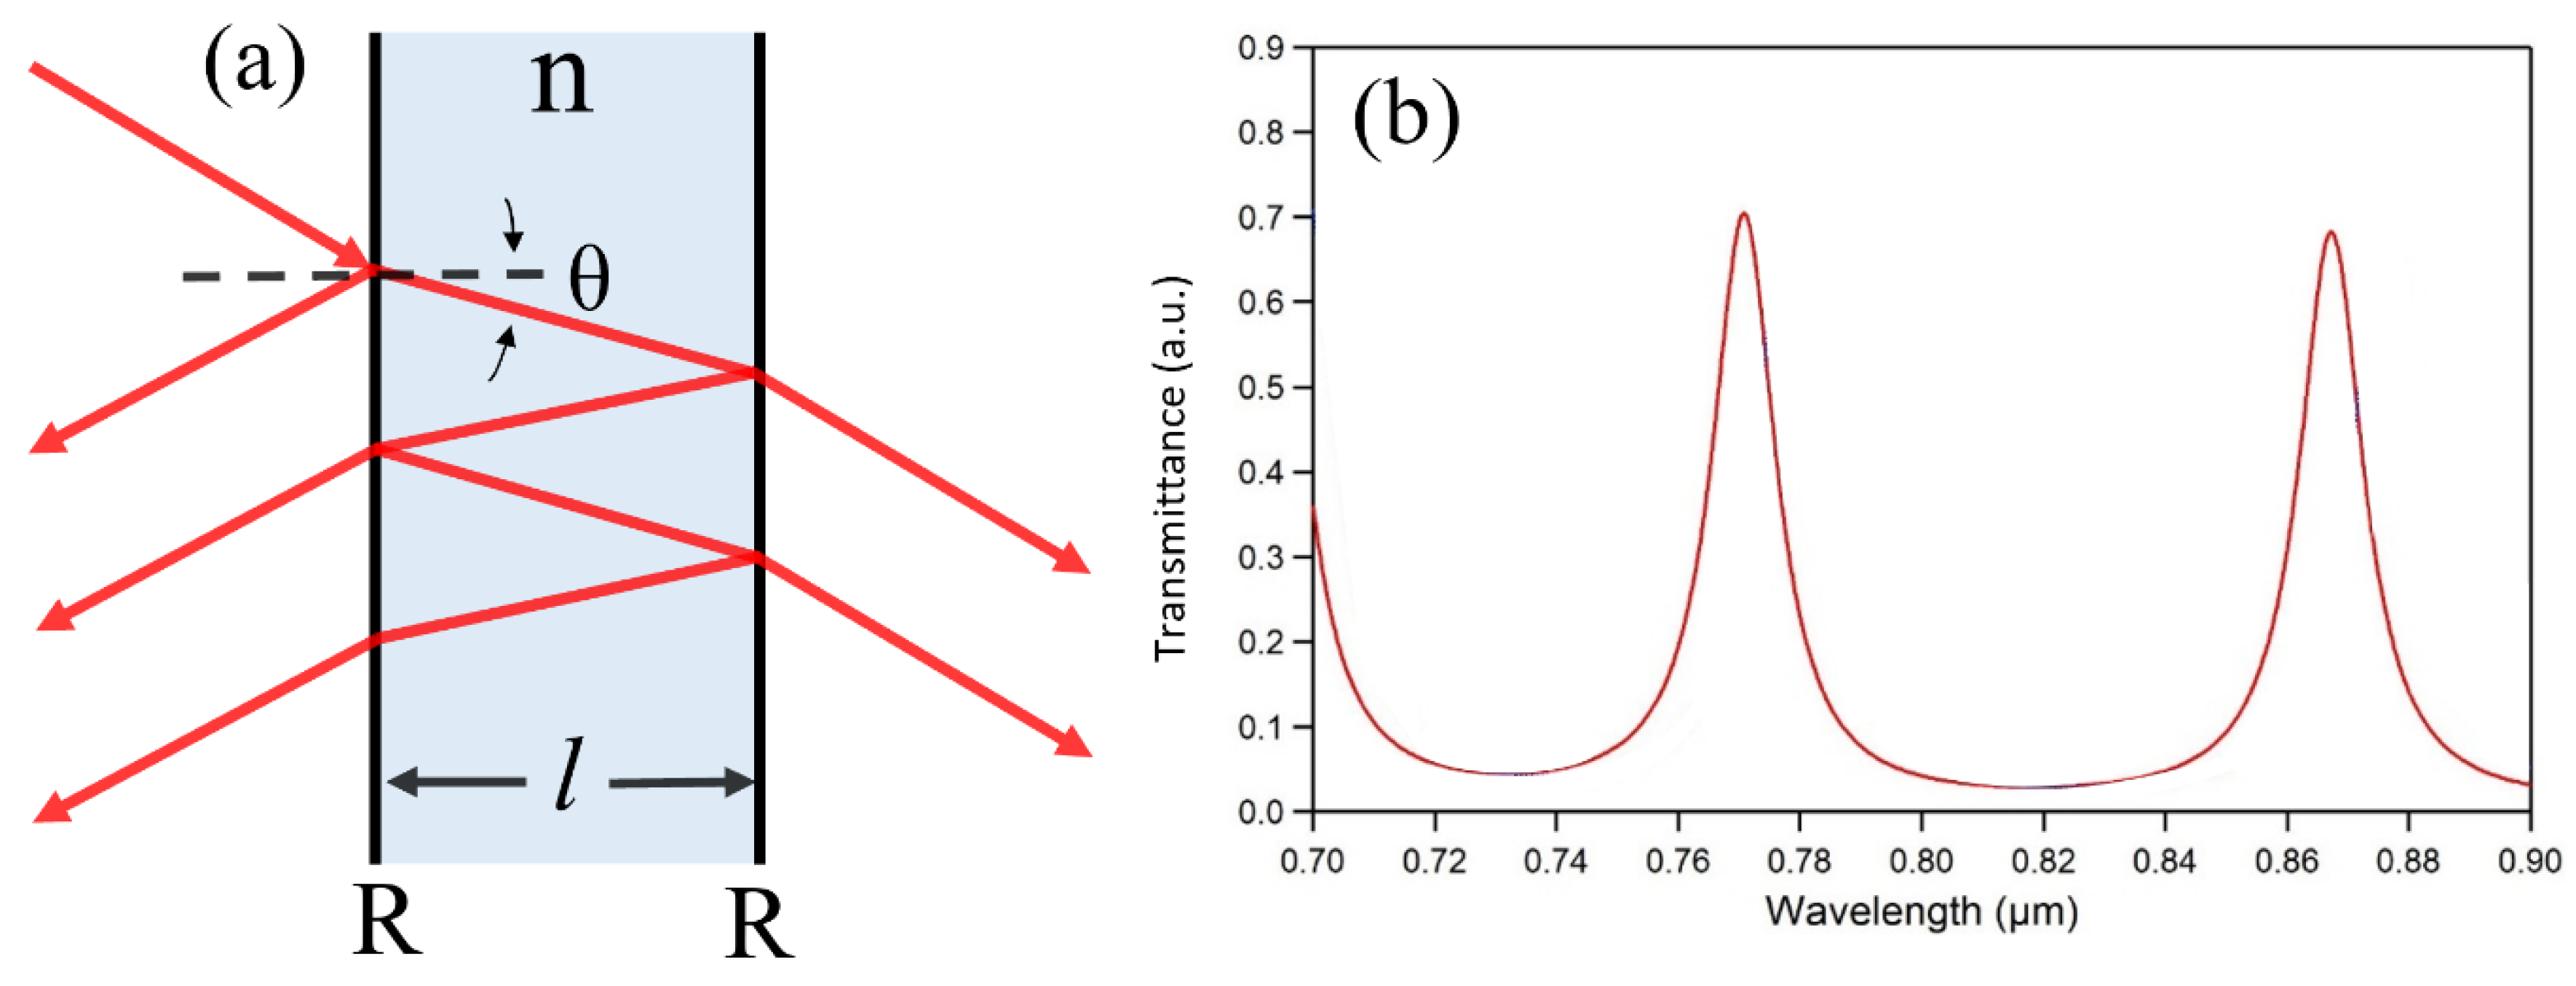
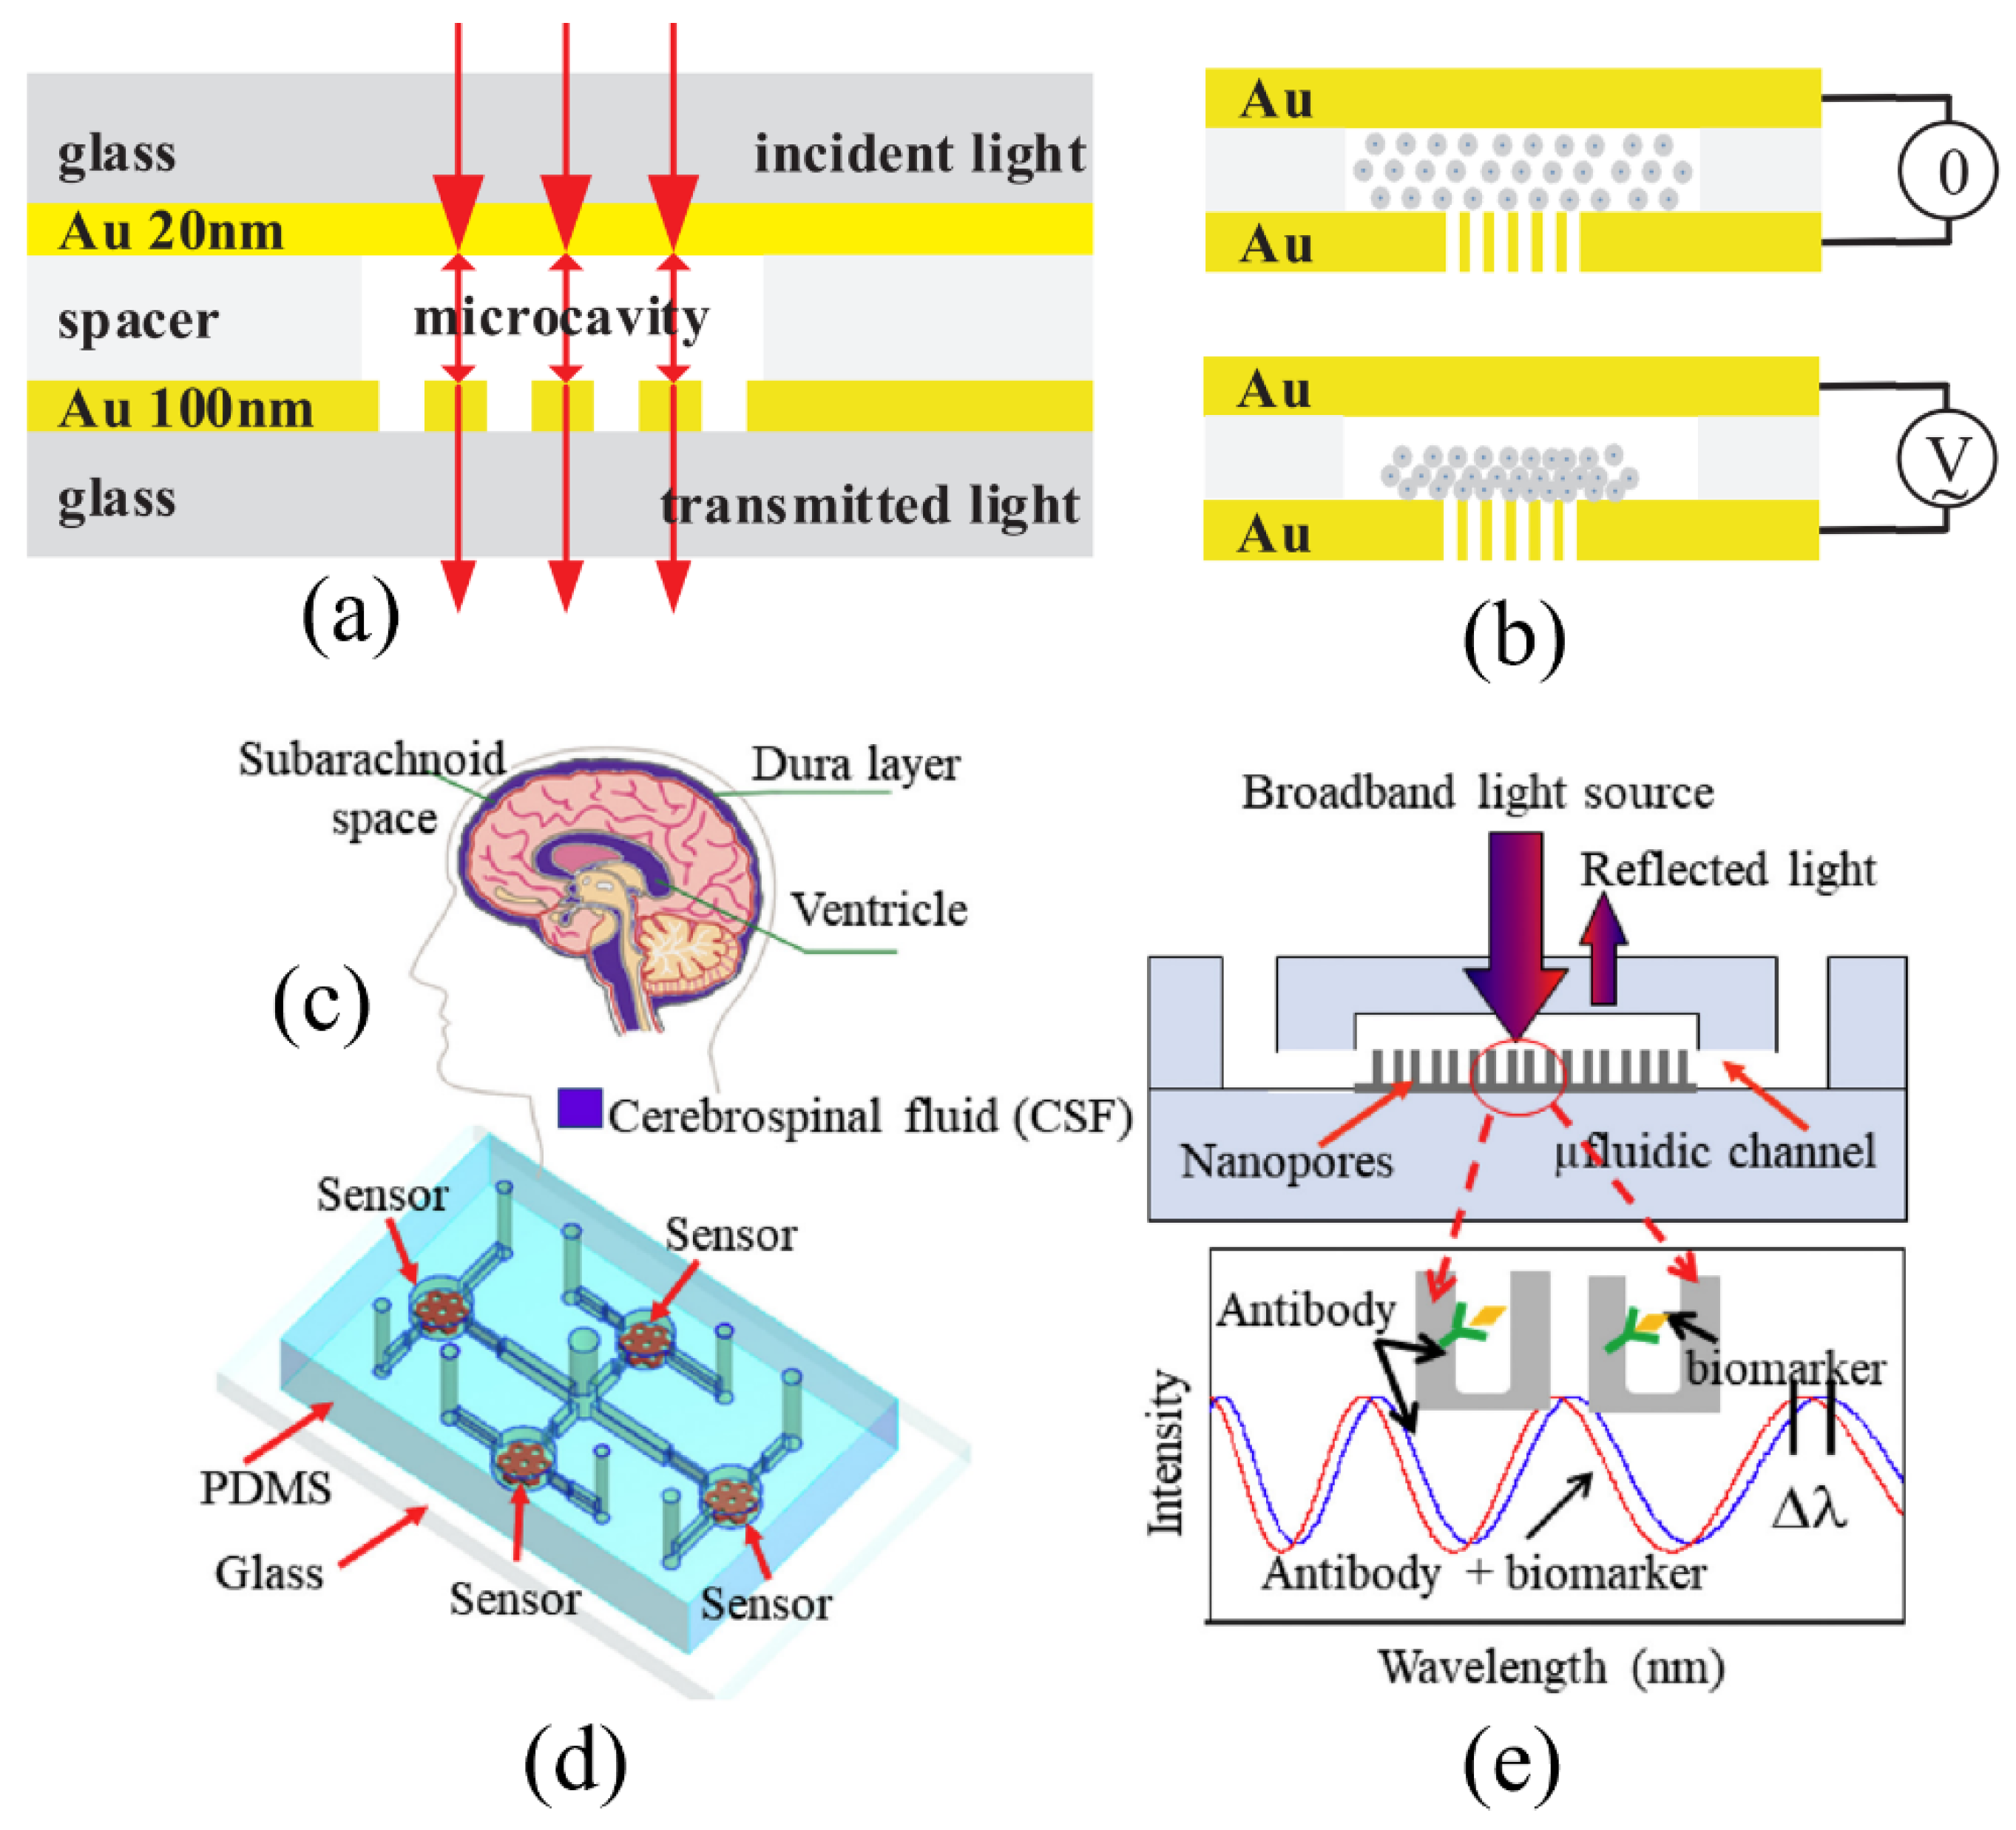
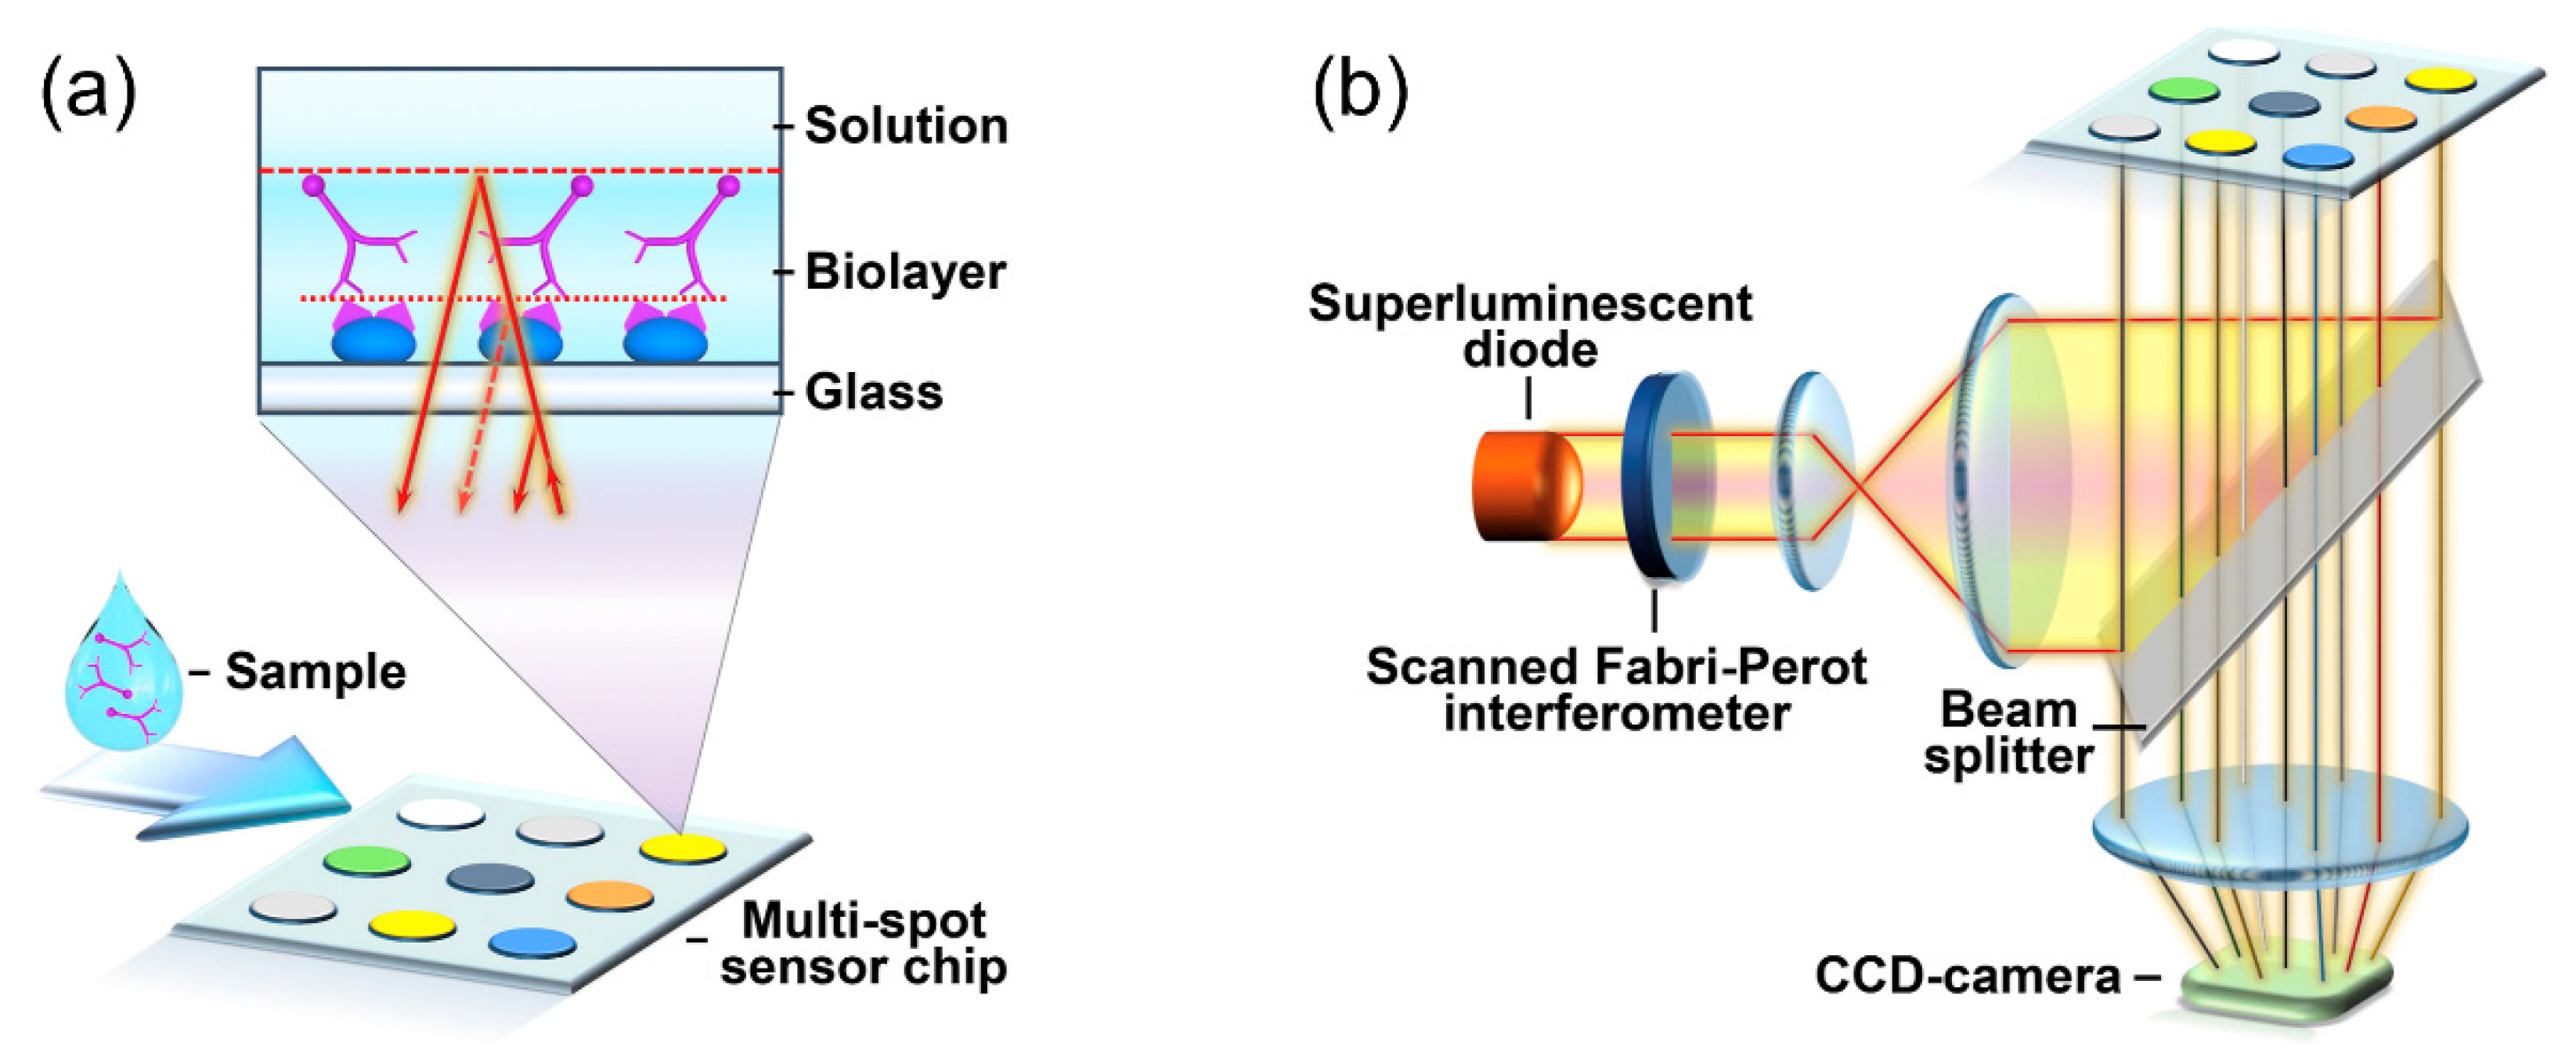
3.1. FPI-Based Biosensors with Two Reflecting Surfaces
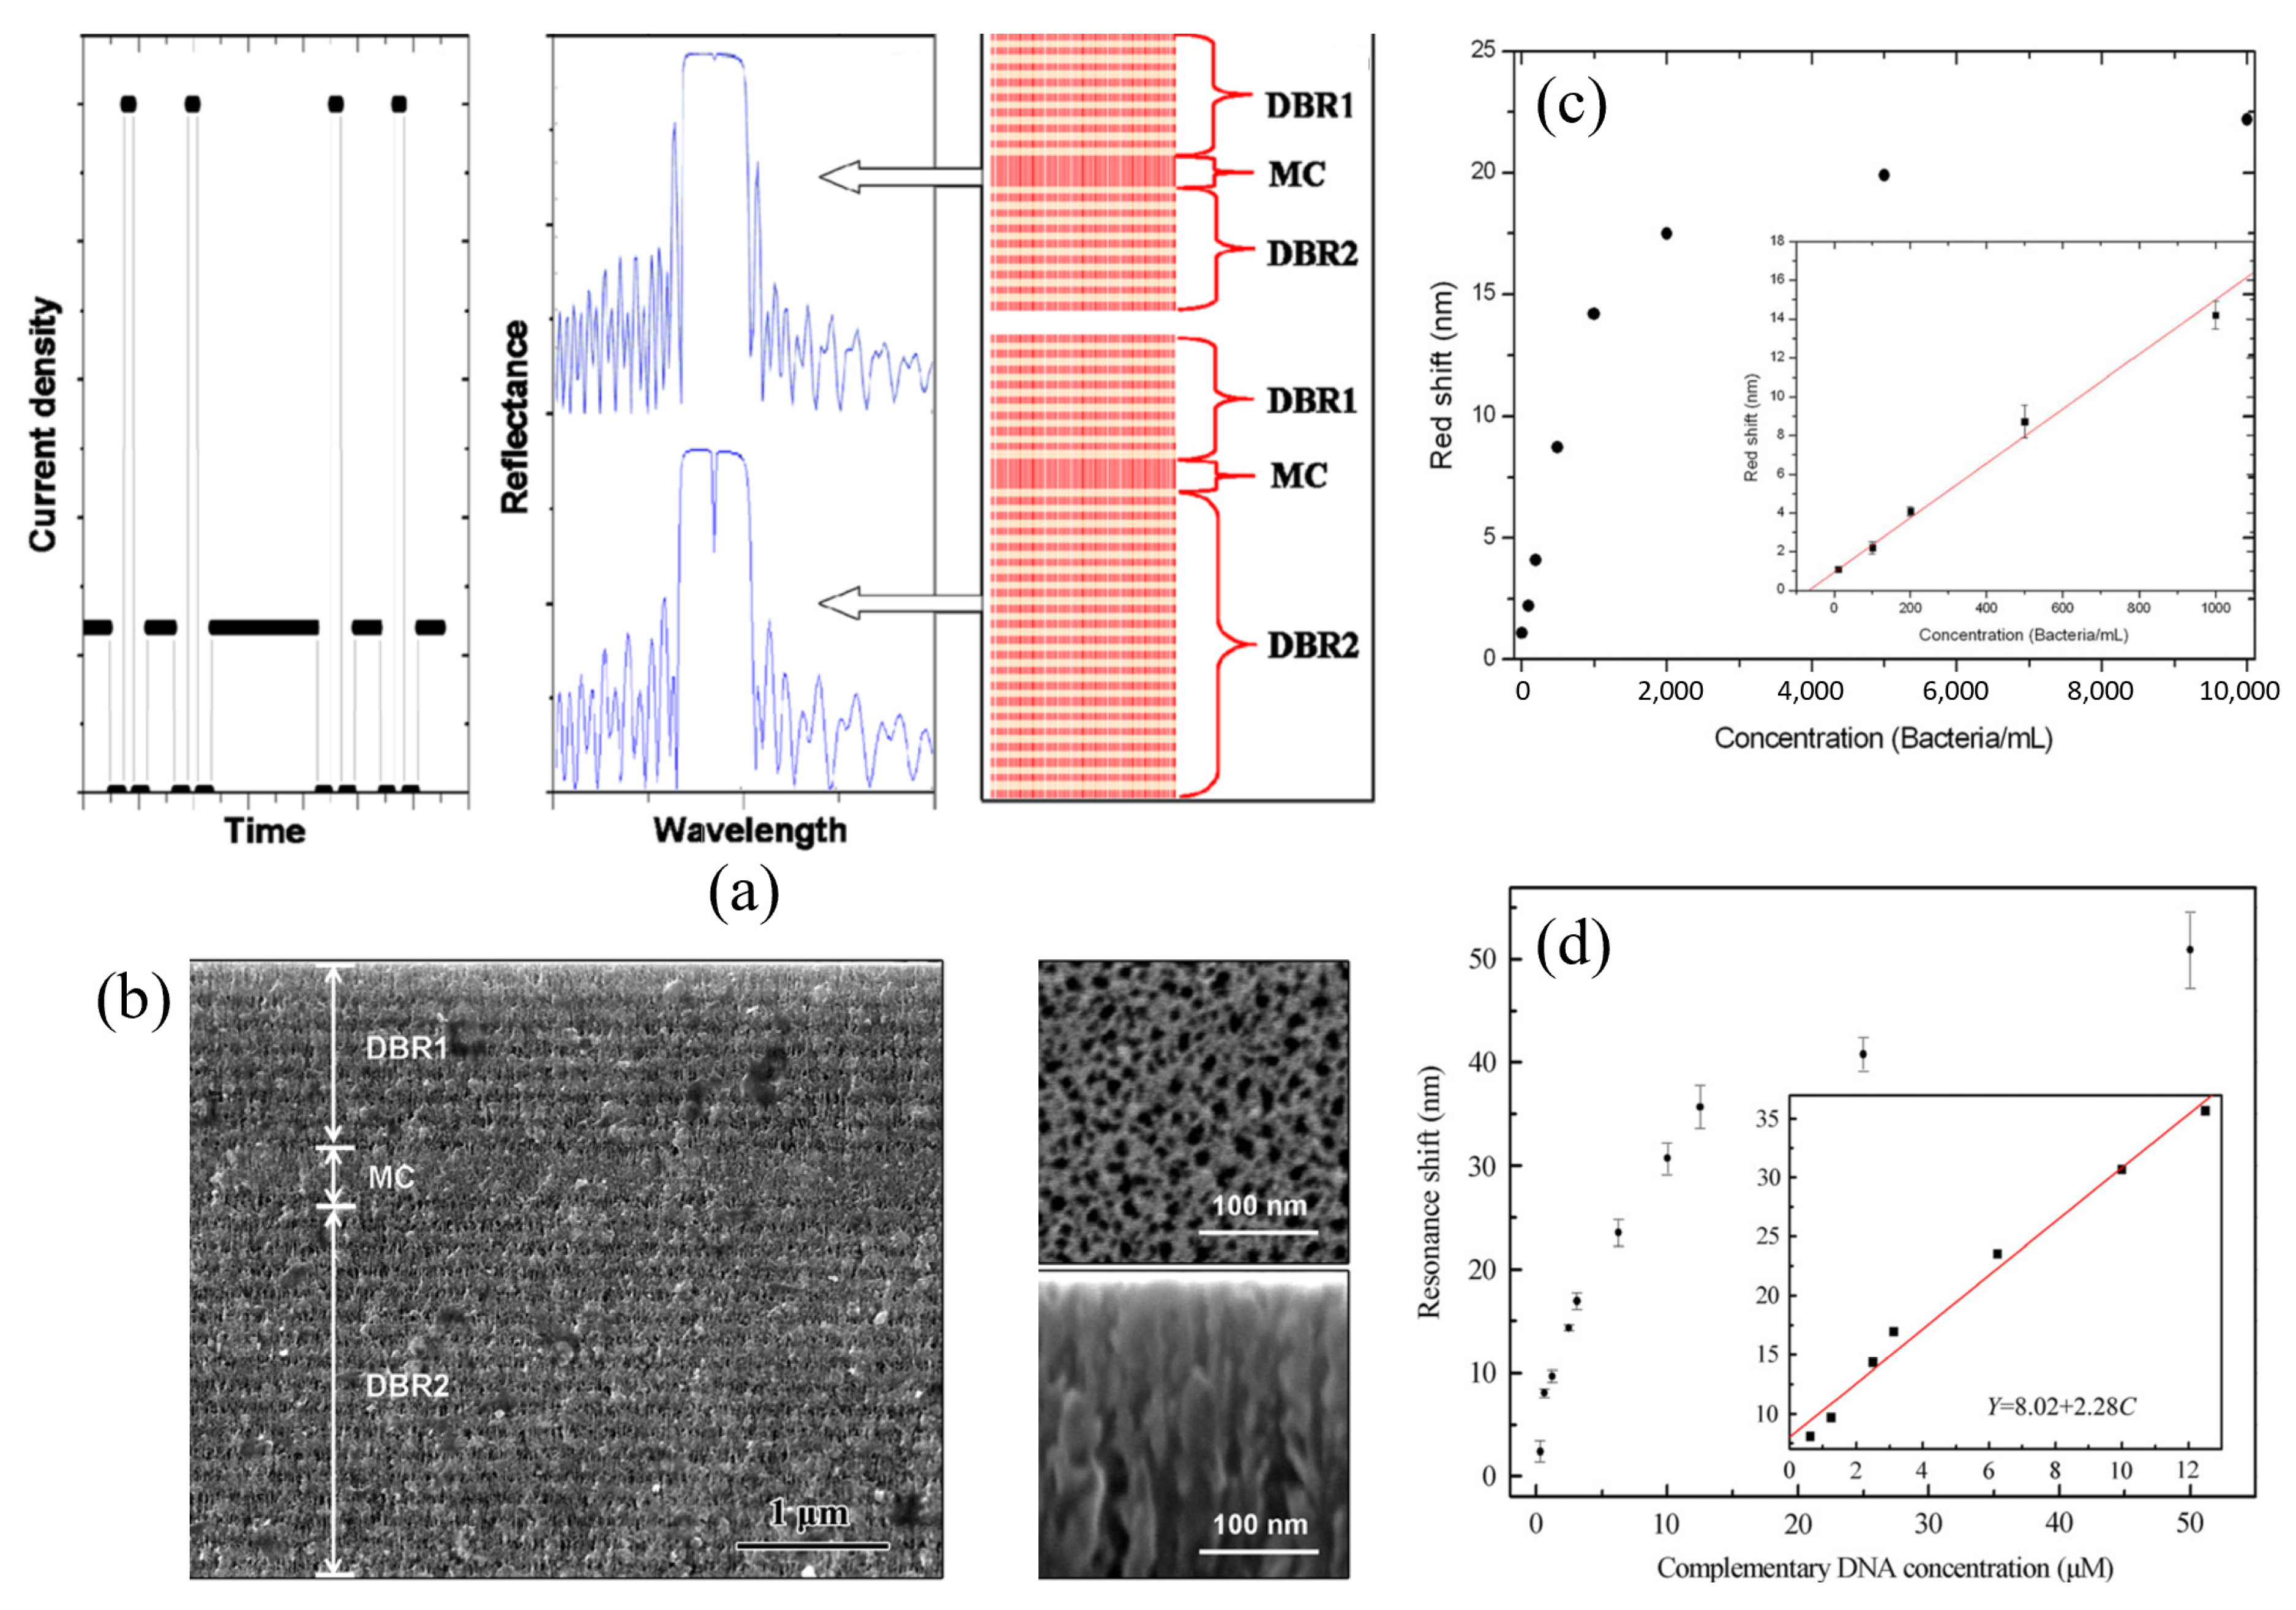
3.2. Porous Silicon Microcavity (PSM)-Based Biosensors
3.3. Optical Fiber FPI-Based Biosensors
3.4. Tabulated Summary of FPI Sensors
4. Whispering Gallery Mode (WGM)-Based Biosensors
4.1. Ring- and Disk-Based WGM Biosensors
4.2. Spherical WGM-Based Biosensors
4.2.1. Solid Microbubble and Microsphere WGM-Based Biosensors
4.2.2. Liquid Crystal Microdroplet WGM-Based Biosensors
4.3. Toroid WGM-Based Biosensors
4.4. Capillary-Based WGM Biosensors

| Geometry | Material | Q | DL of RI | Analyte | Type of Sample | LOD | Ref. |
|---|---|---|---|---|---|---|---|
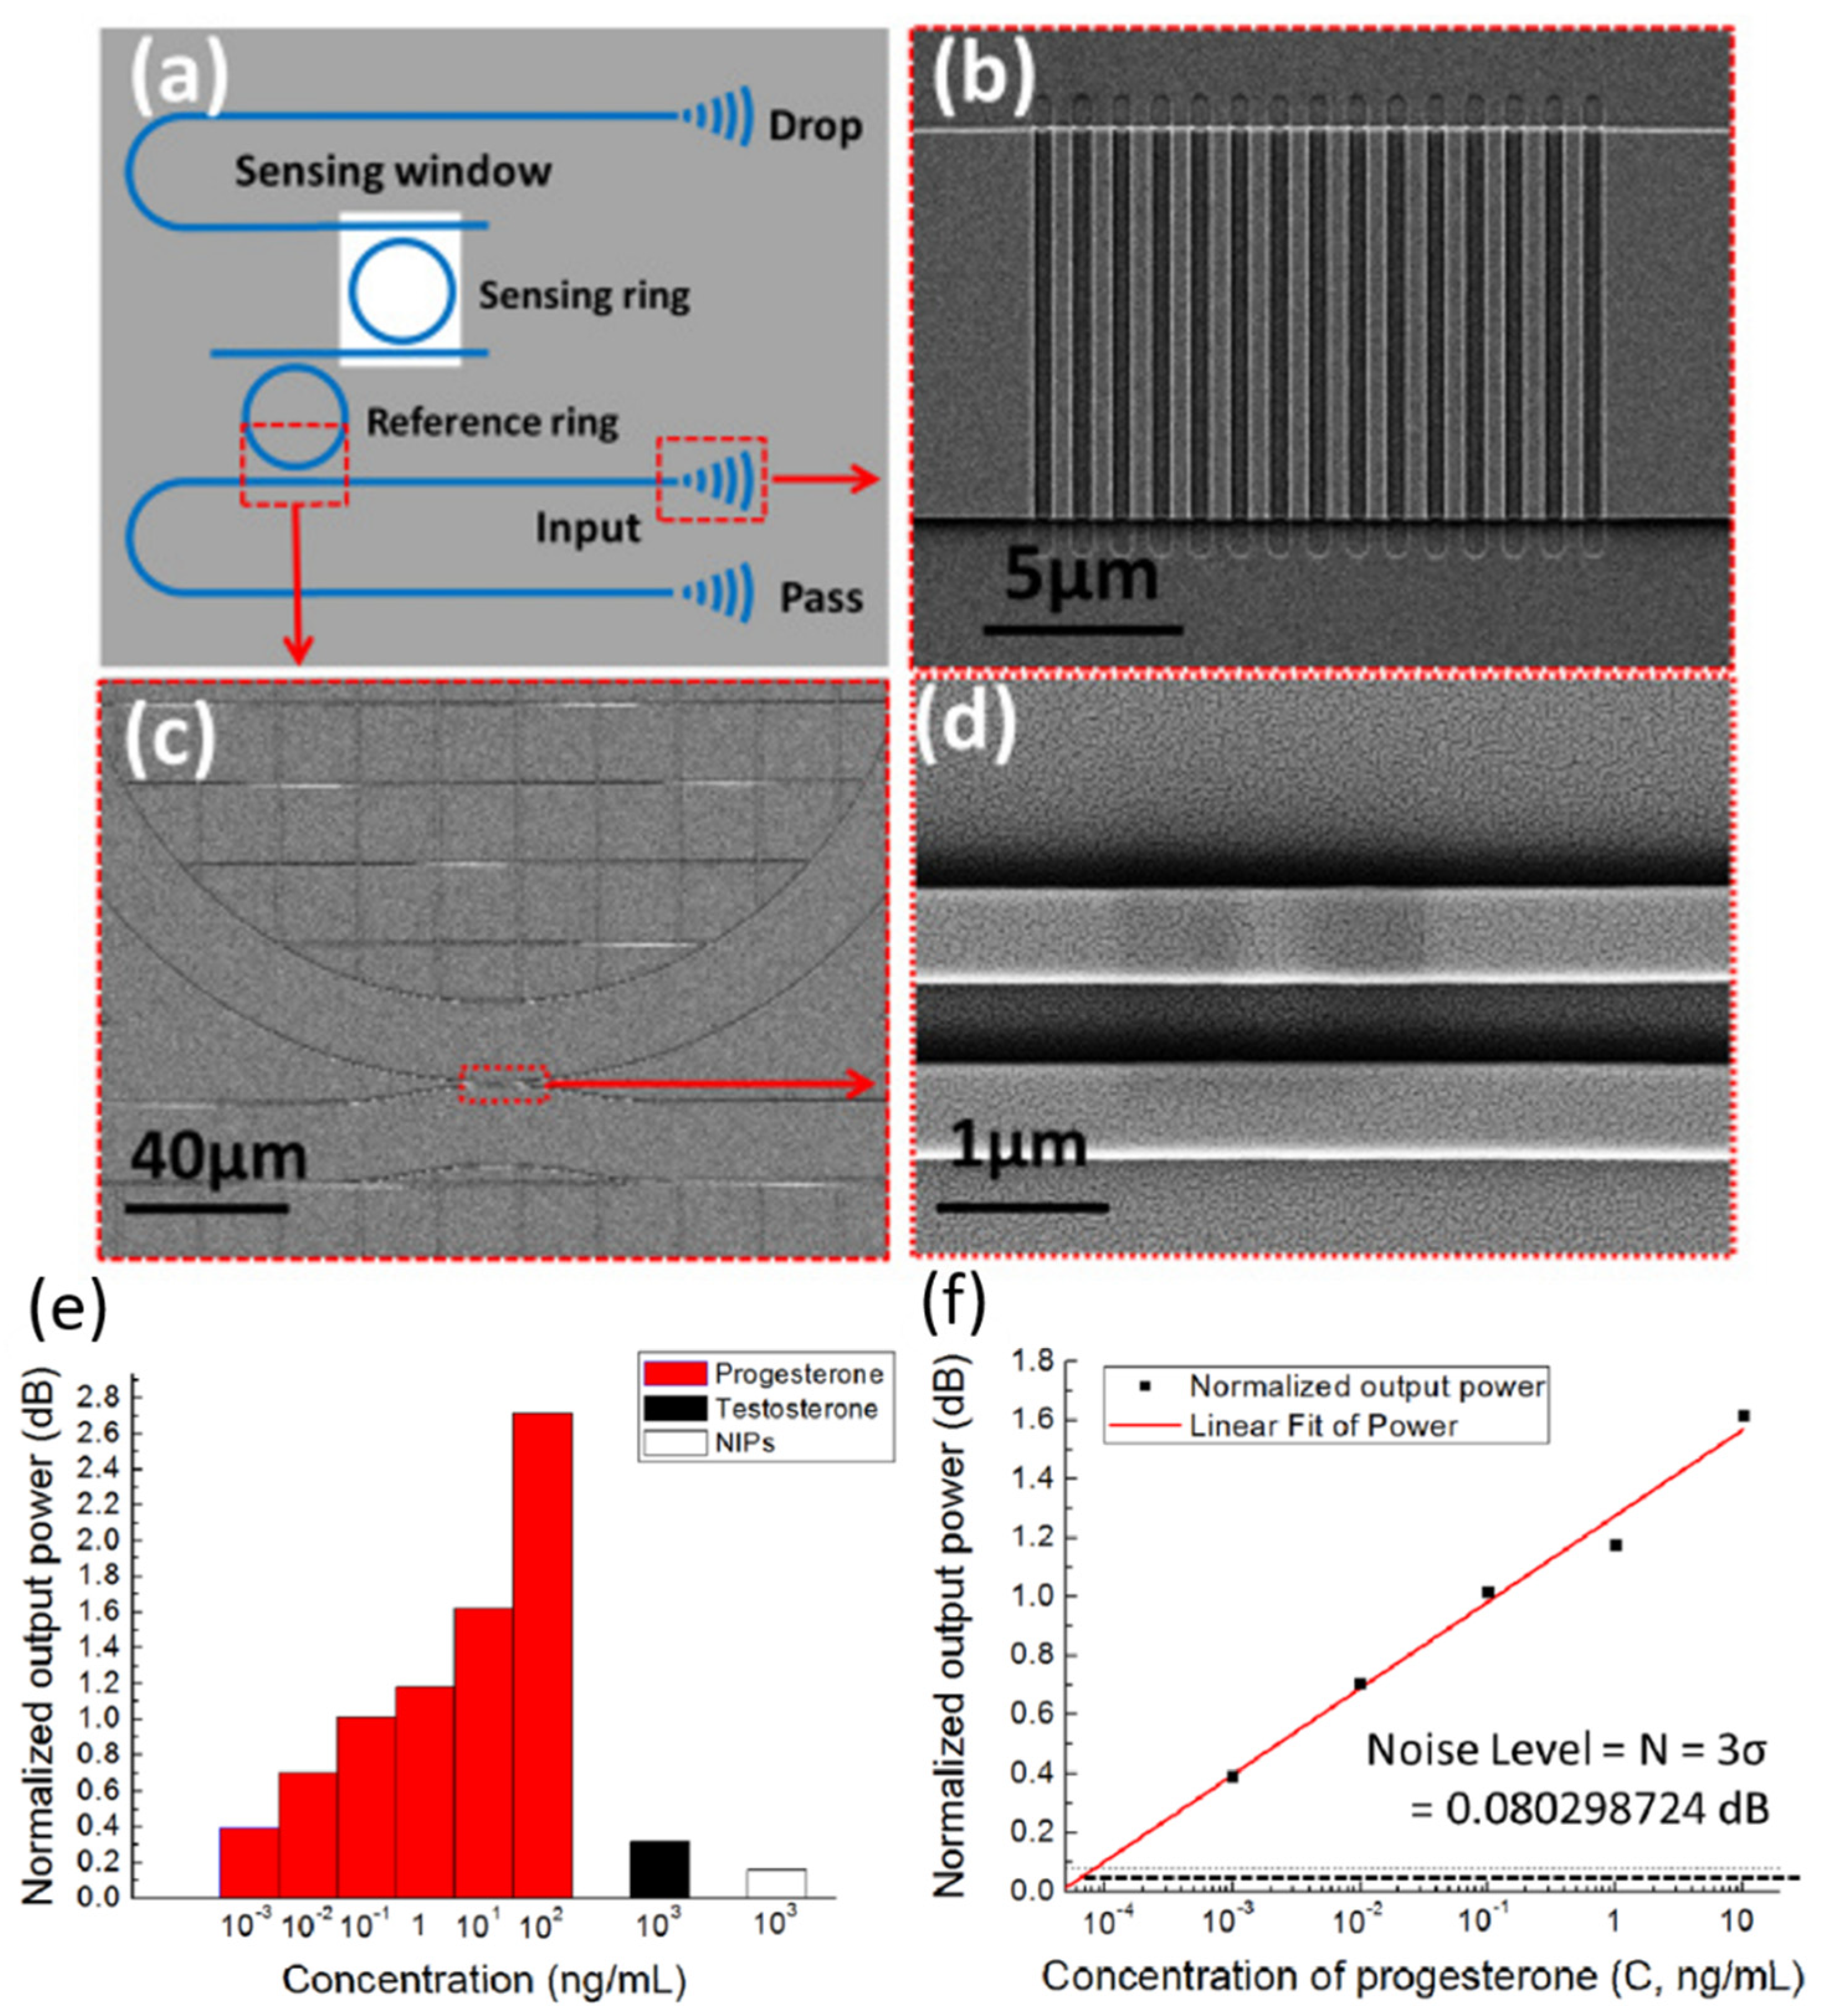
| Ring | Si | 1.0 × 10³ | 9.7 × 10⁻⁶ RIU | Progesterone | DI water | 83.5 fg/mL | [112] |
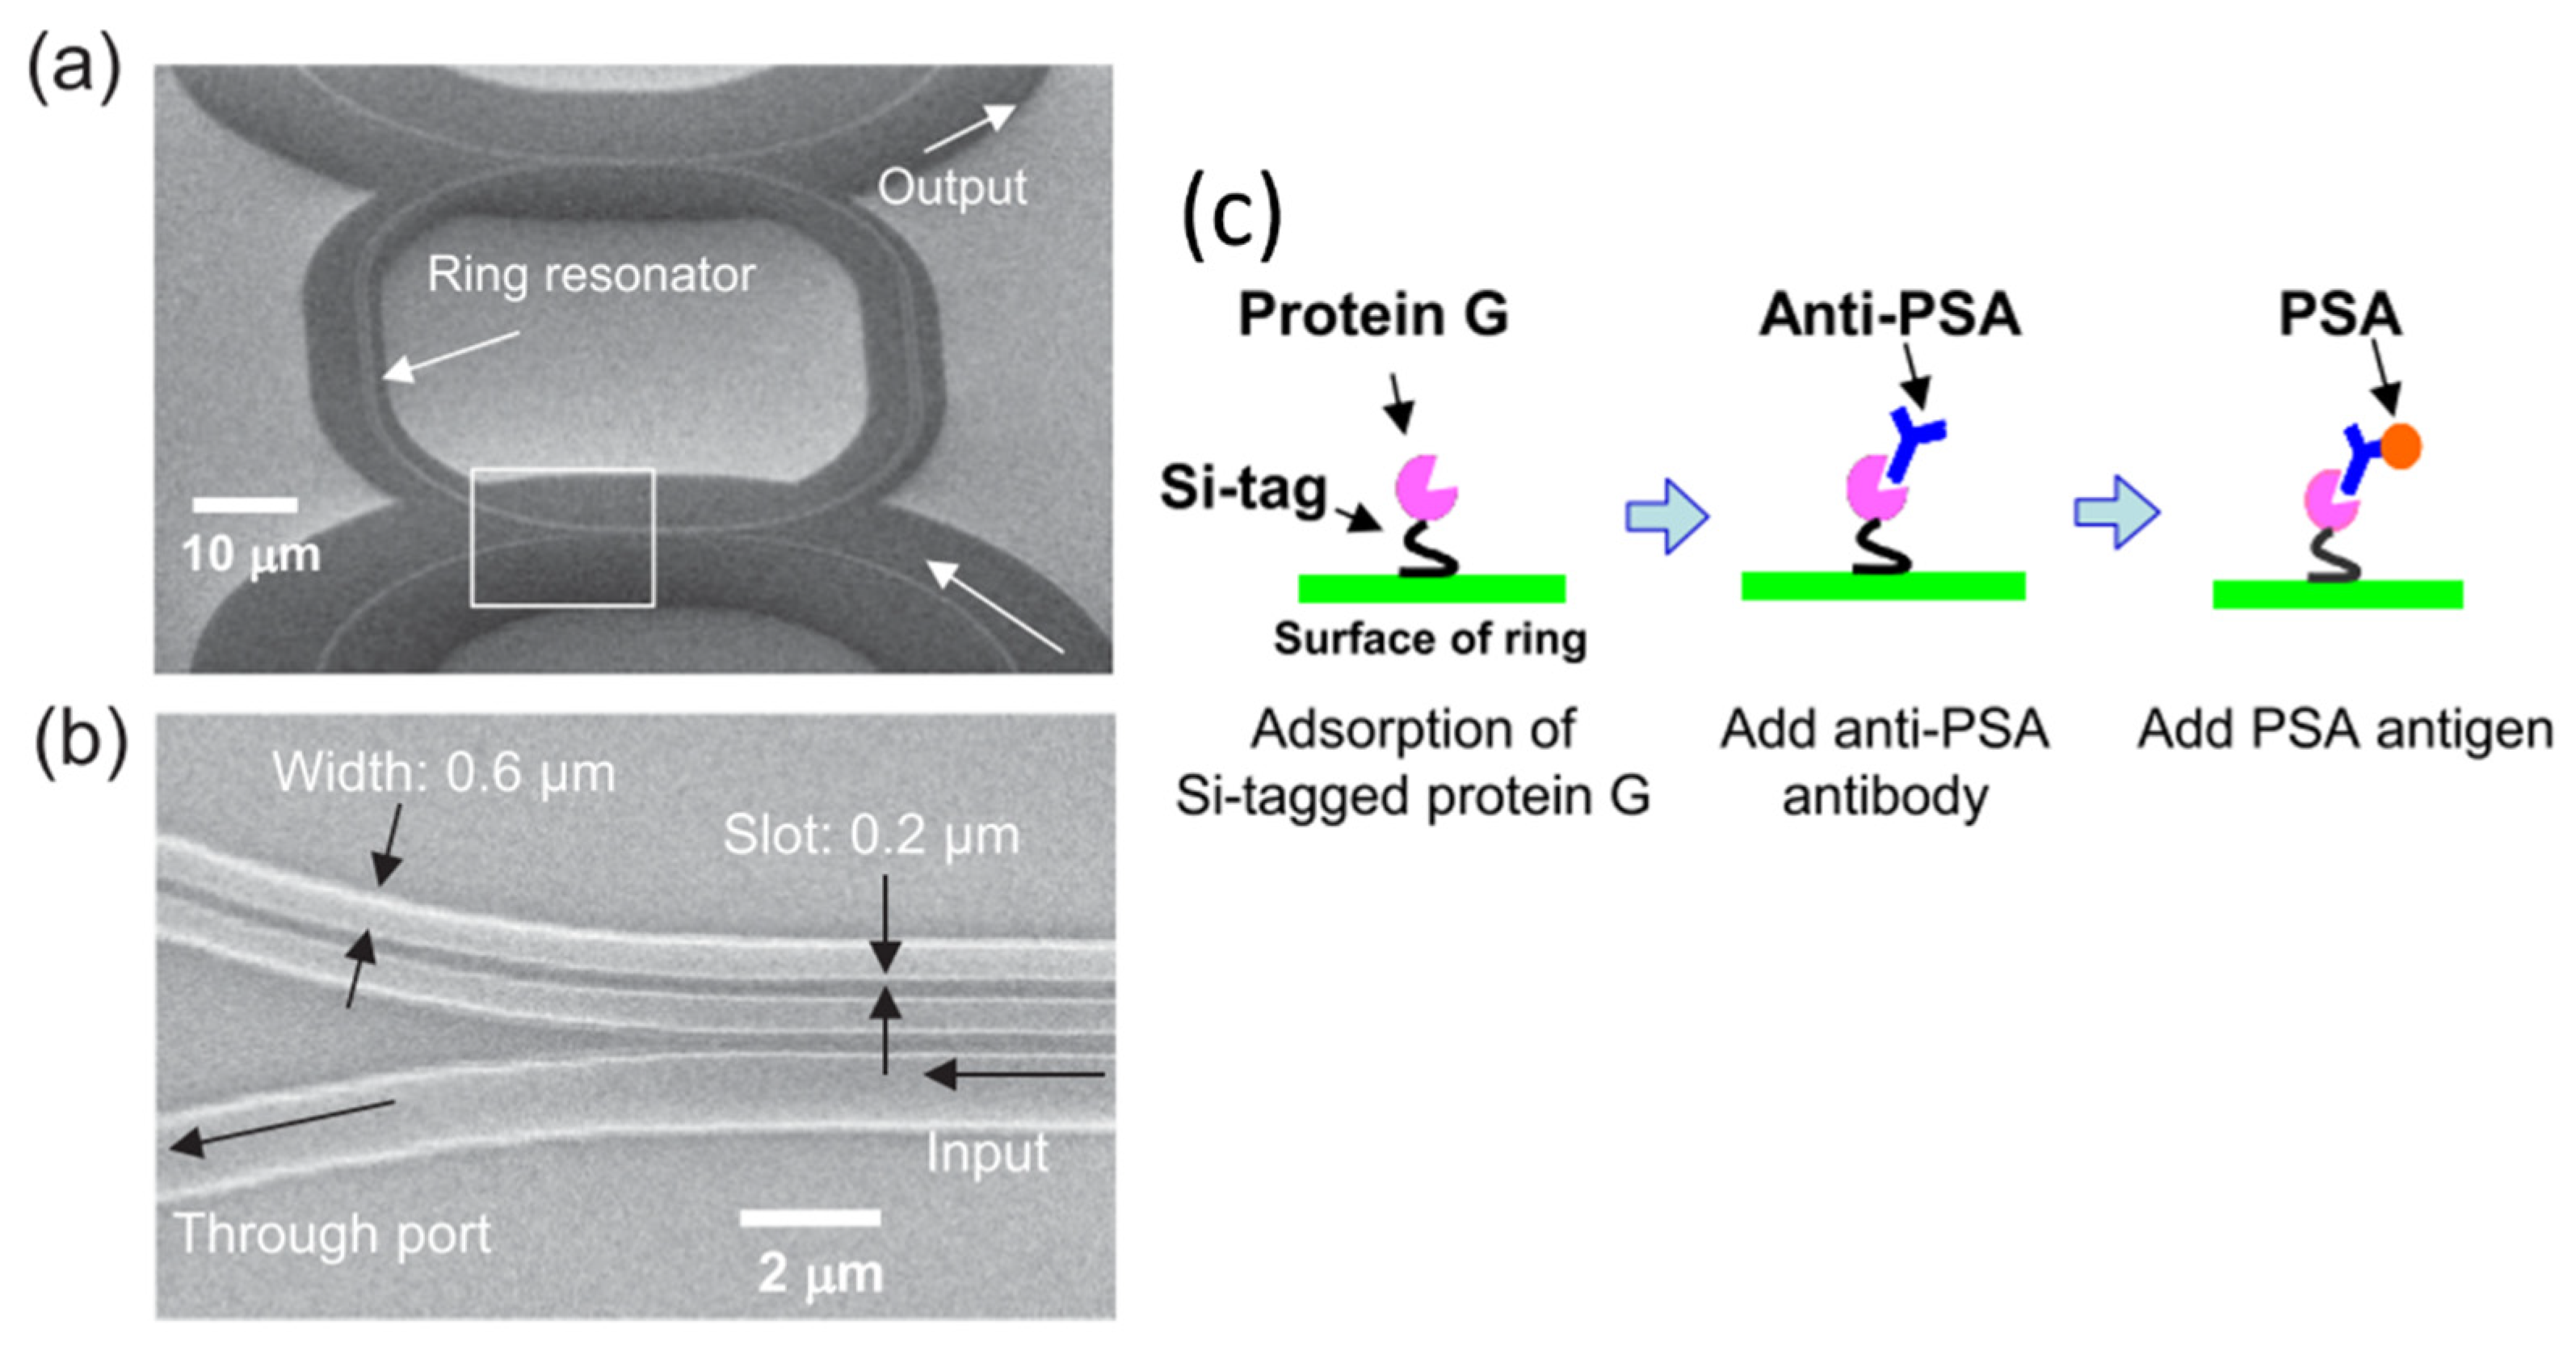
| Ring | SiN on SiO2 | 1.3 × 10³ | 141 nm/RIU | PSA | Tris-HCl | 10 ng/mL | [114] |
| Ring | Si on SiO2 | 7.0 × 10³ | 2.47 × 10⁻⁴ RIU | Biotin-BSA | PBS | 2.47 × 10⁶ RIU | [129] |
| Microdisk | SiN | 1.5 × 10⁴ | 226.67 nm/RIU | Streptavidin | PBS | 6.7 nM | [130] |
| Microdisk | Si | 104 | - | S. aureus | TBS | 5 pg/mL | [113] |
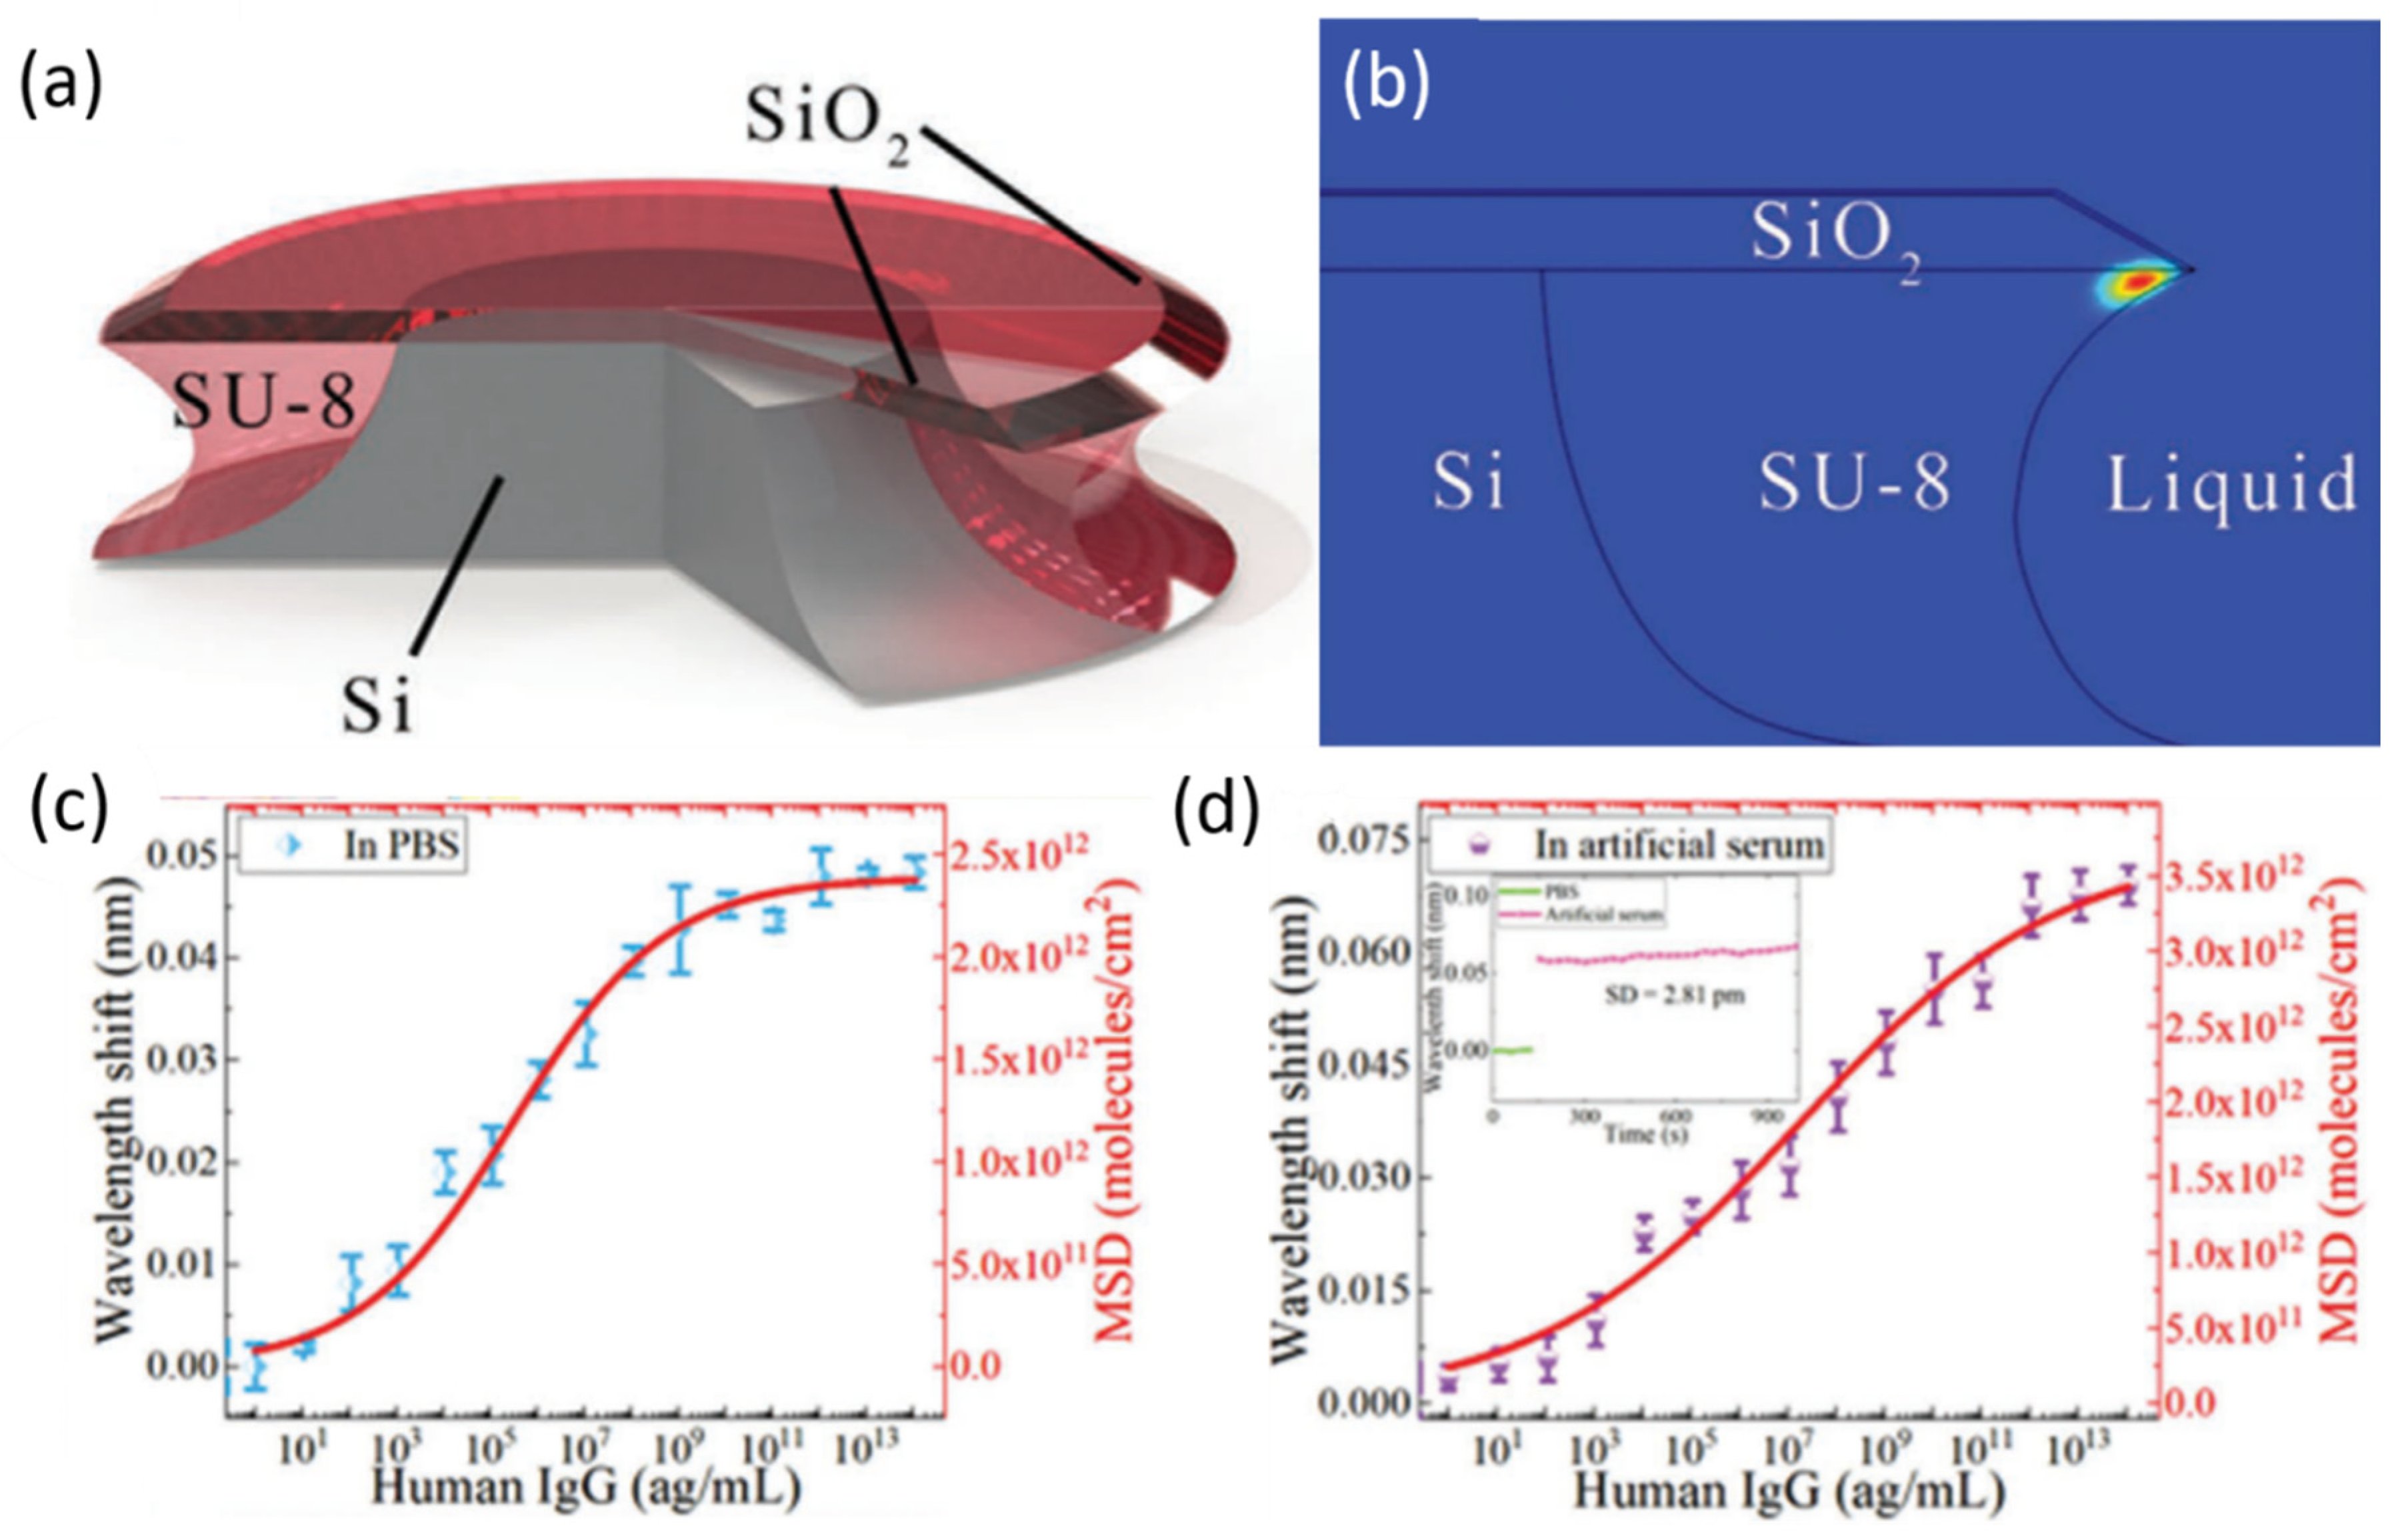
| Microdisk | SiO2 | 105 | 18.2 nm/RIU | Human IgG | PBS/artificial serum | 9 ag/mL | [116] |
| Microdisk | Al2O3:Yb3+ | 1.2 × 10⁵ | 20.1 nm/RIU | rhS100A4 | DI water | 300 pM | [117] |
| Microbubble | - | 4.67 × 10⁴ | 265.2 nm/RIU | Pb2+ | PBS | 15 fm | [120] |
| Microbubble | - | - | 1.216 nm/RIU | ssDNA | PBS | 1 nM | [137] |
| Microbead | - | - | - | Cyt-C | PBS | 6.82 nM | [123] |
| Microdroplet | Stearic acid-doped 5CB | 103–2.2 × 10³ | - | Cu(II) | DI water | 40 pM | [119] |
| Microdroplet | Stearic acid-doped 5CB | - | - | Urea | DI water | 0.1 mM | [138] |
| Microdroplet | CBA | 3000 | - | Urease | DI water | 0.5 µg/mL | [128] |
| Microdroplet | Dye-doped 5CB | 3500 | - | Fenubocarb, Dimethoate, AChE | PBS | 0.1 pg/mL, 1 pg/mL, 0.0066 U/mL | [118] |
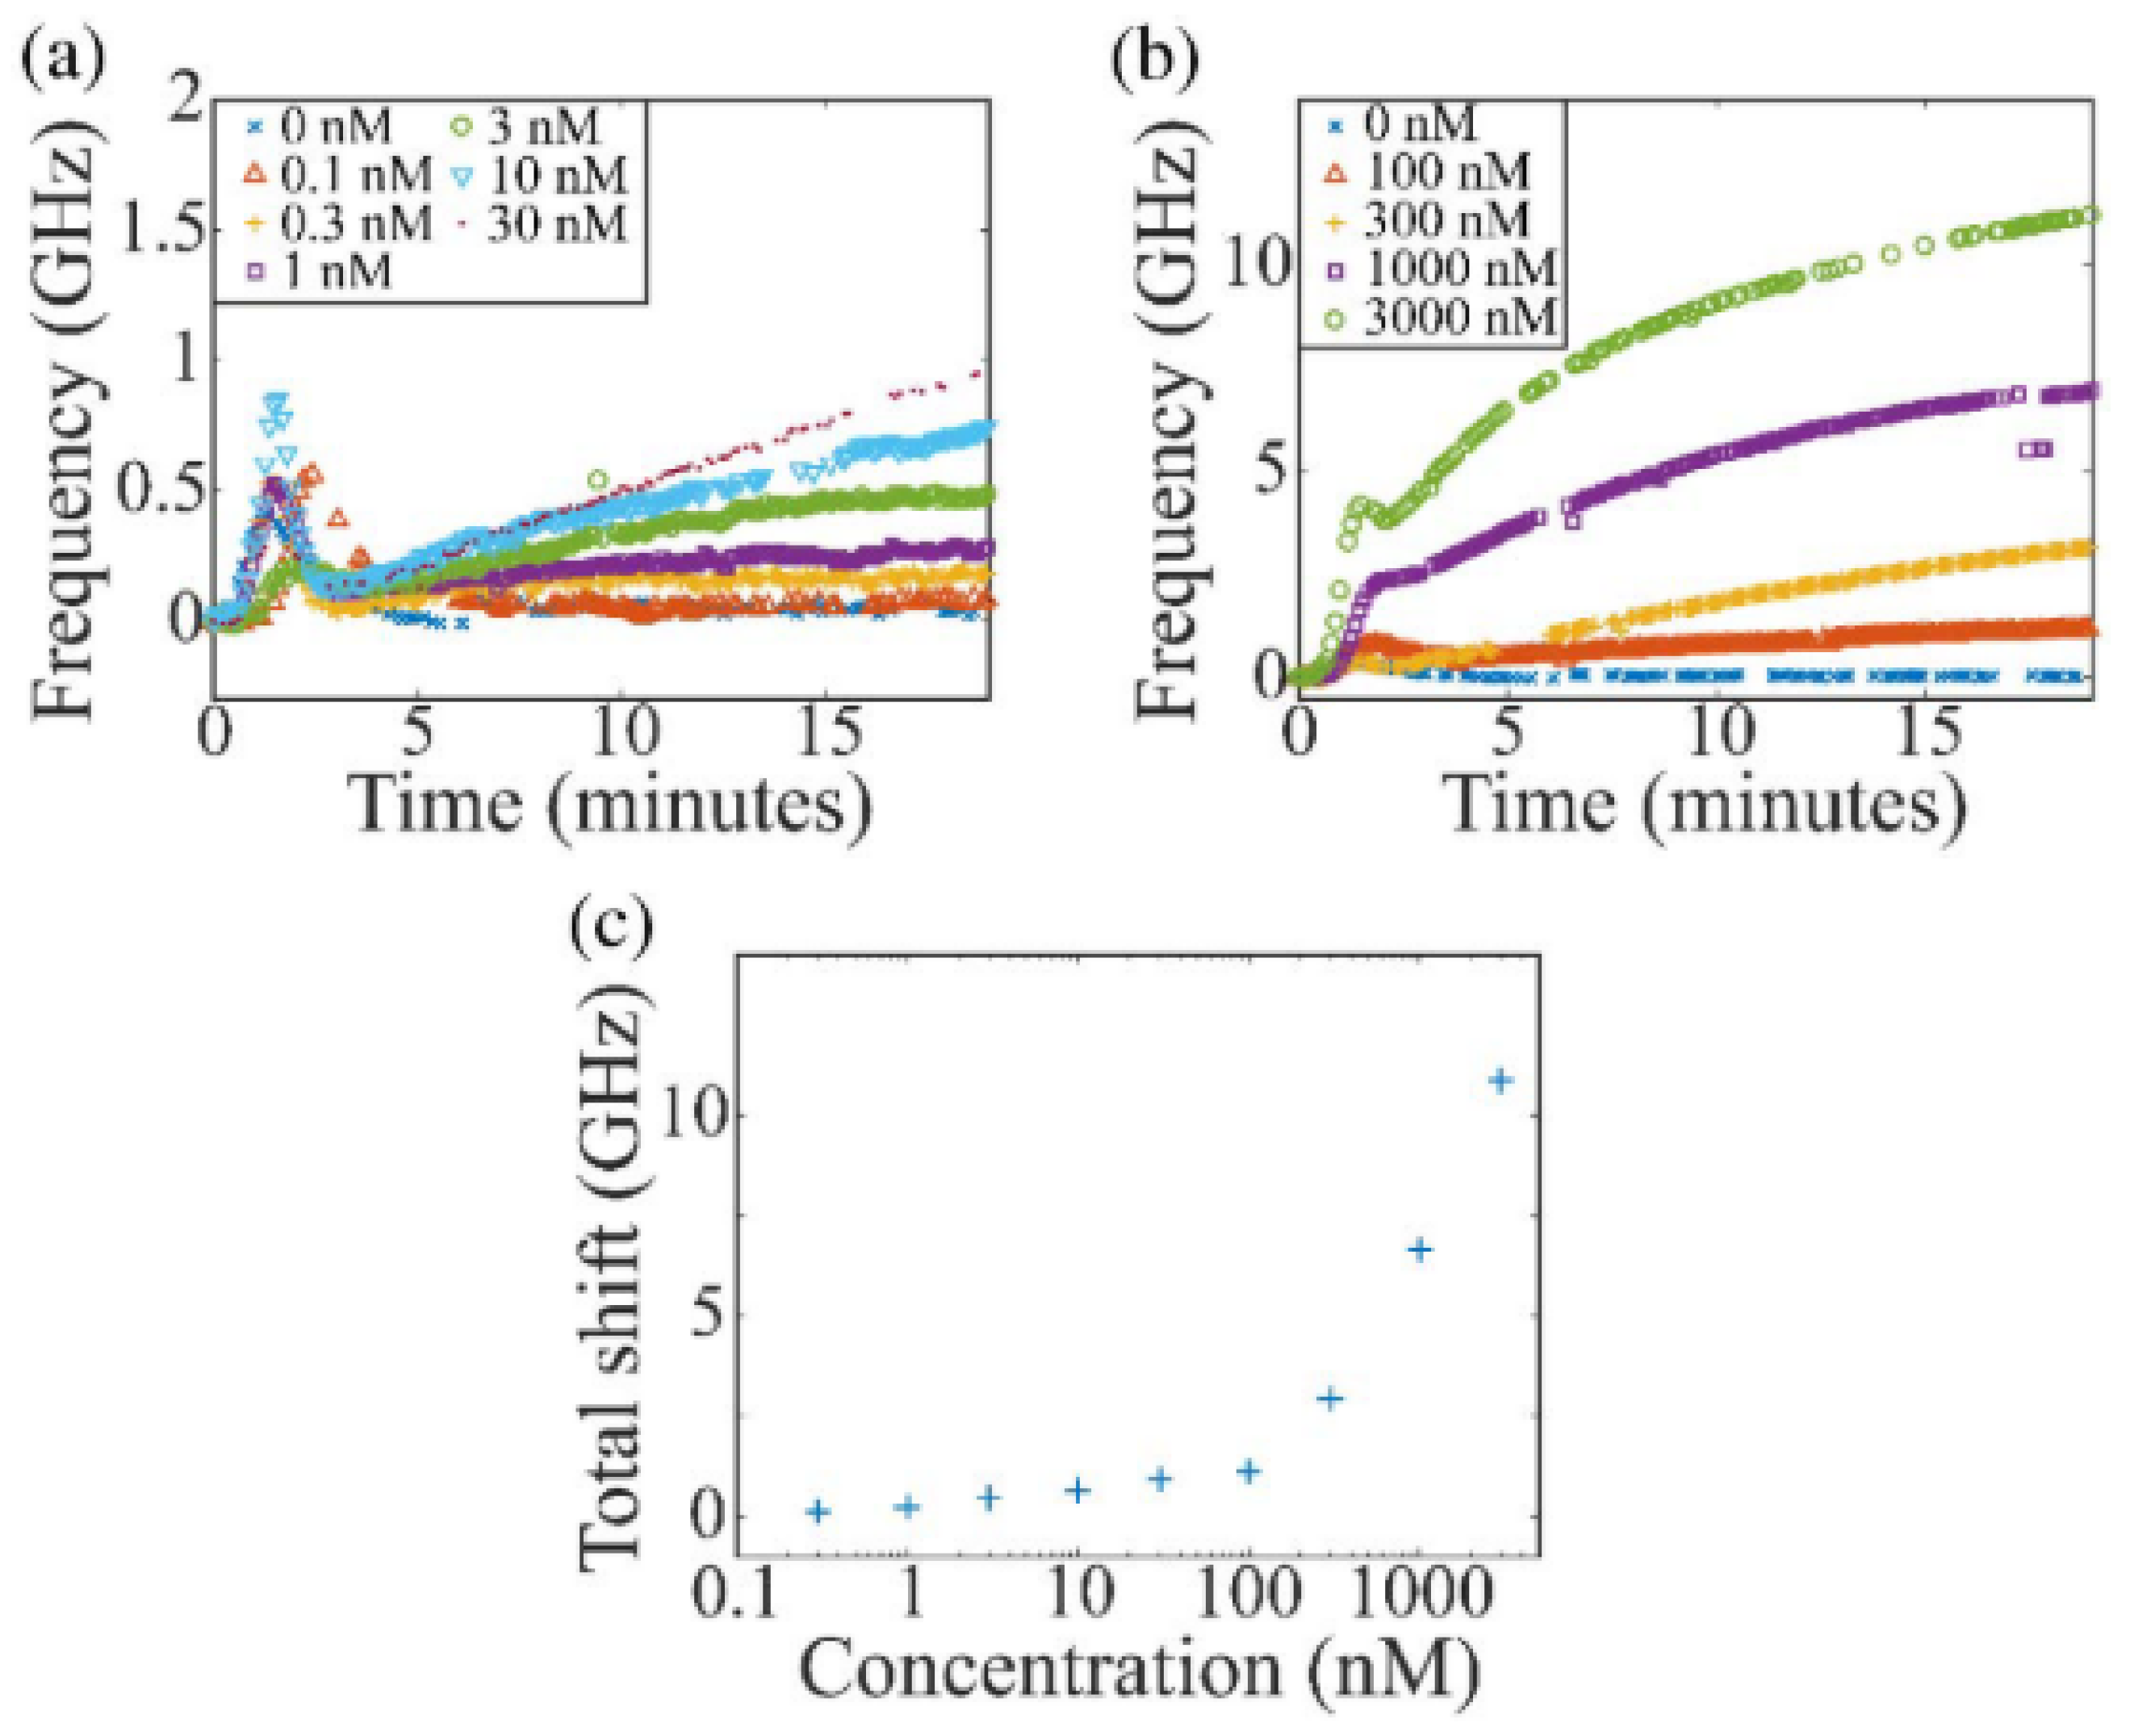
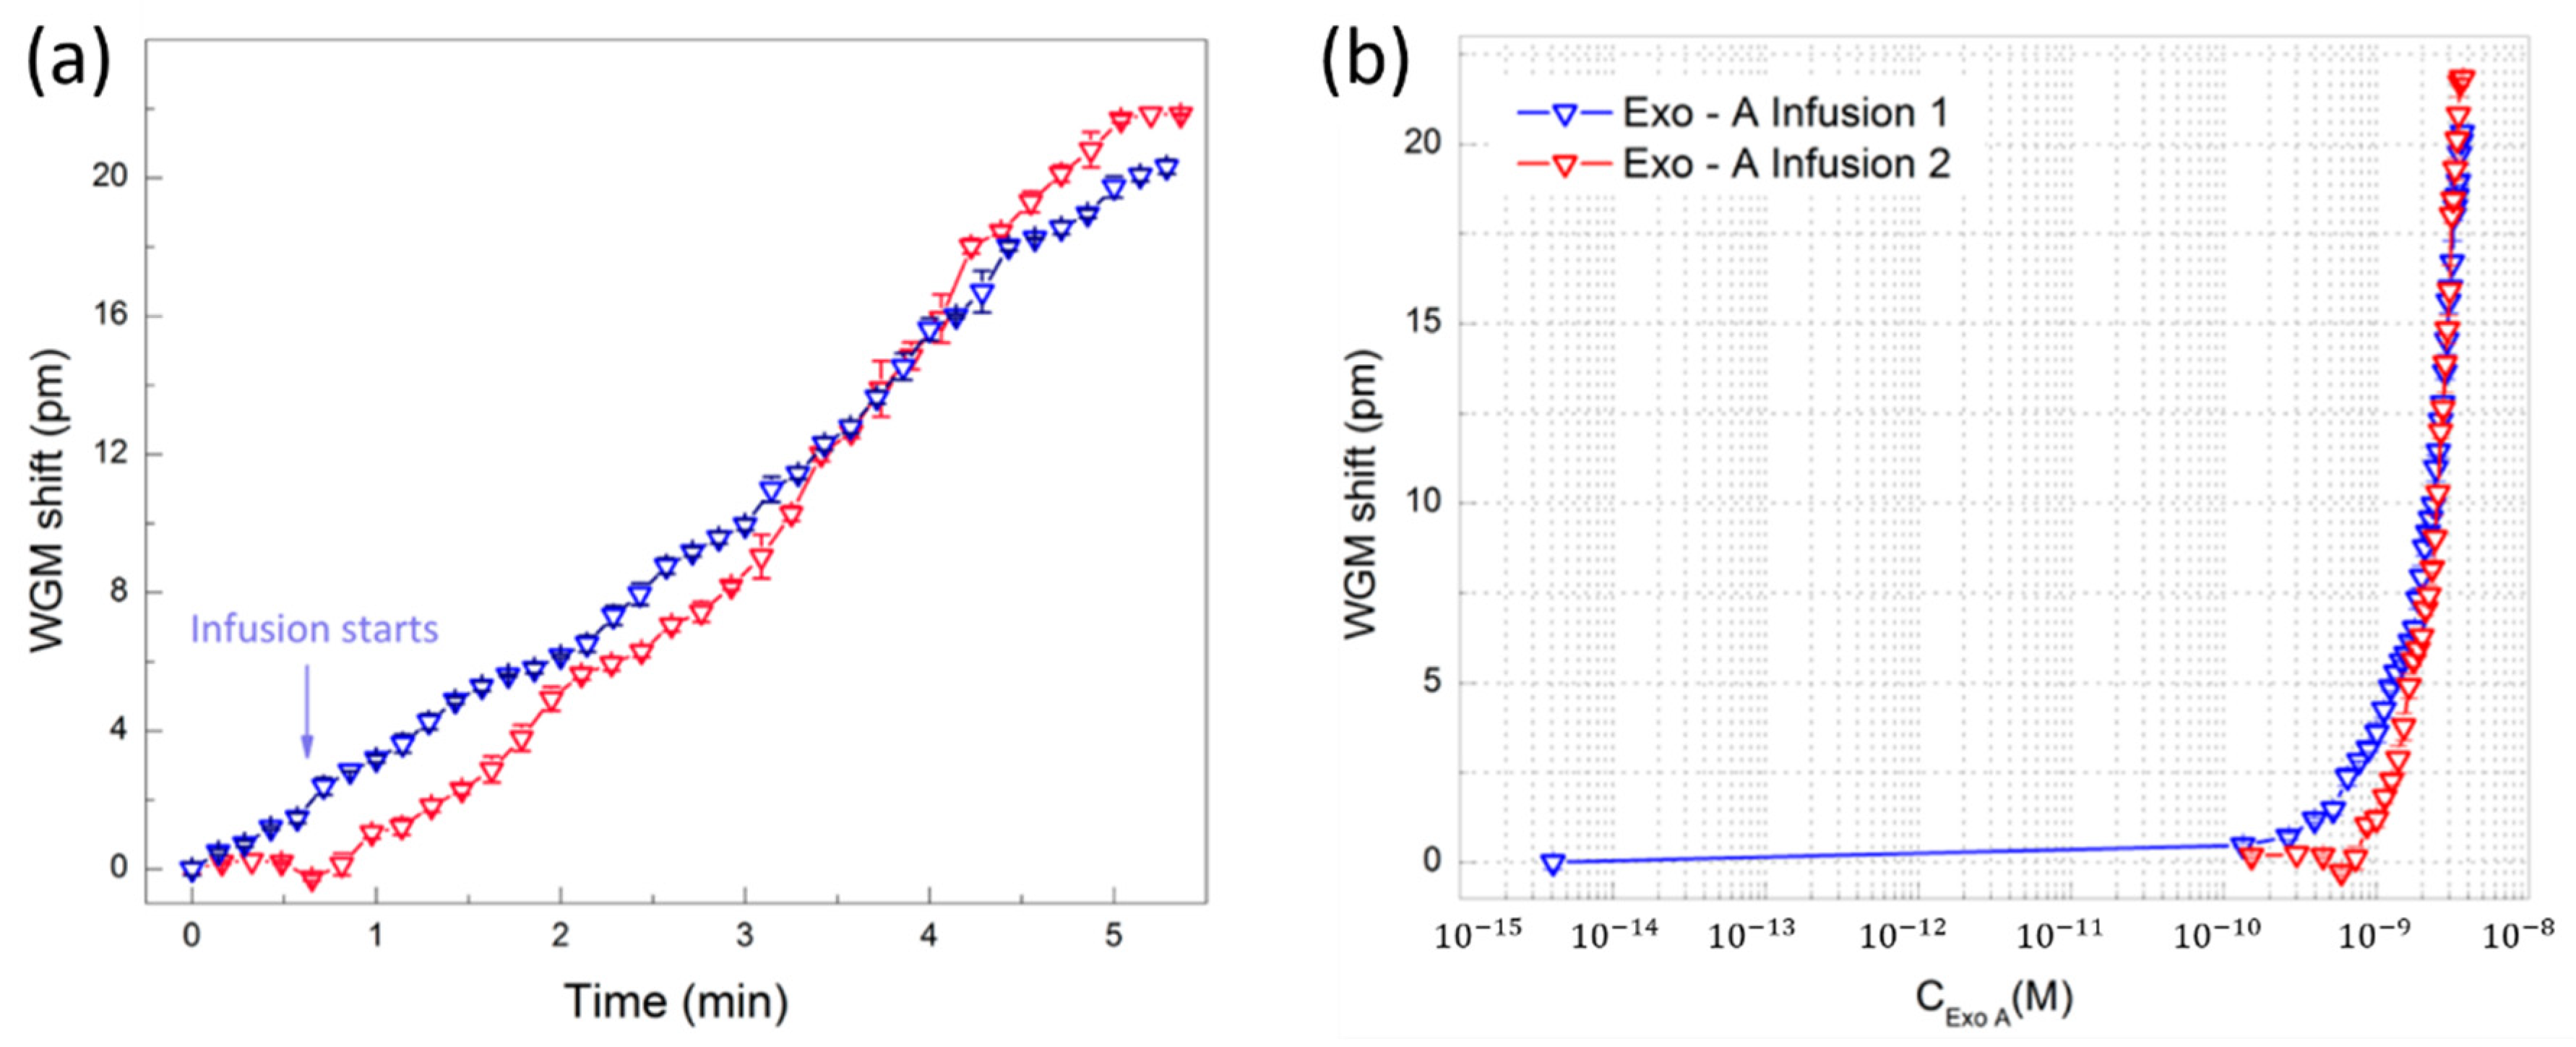
| Microtoroid | Si/SiO2 | 105 | - | Exotoxin A | Artificial sputum | 2.45 nM | [140] |
| Microtoroid | - | 105–5 × 10⁶ | - | SilicaNanoparticles | Water | 0.2 pM | [21] |
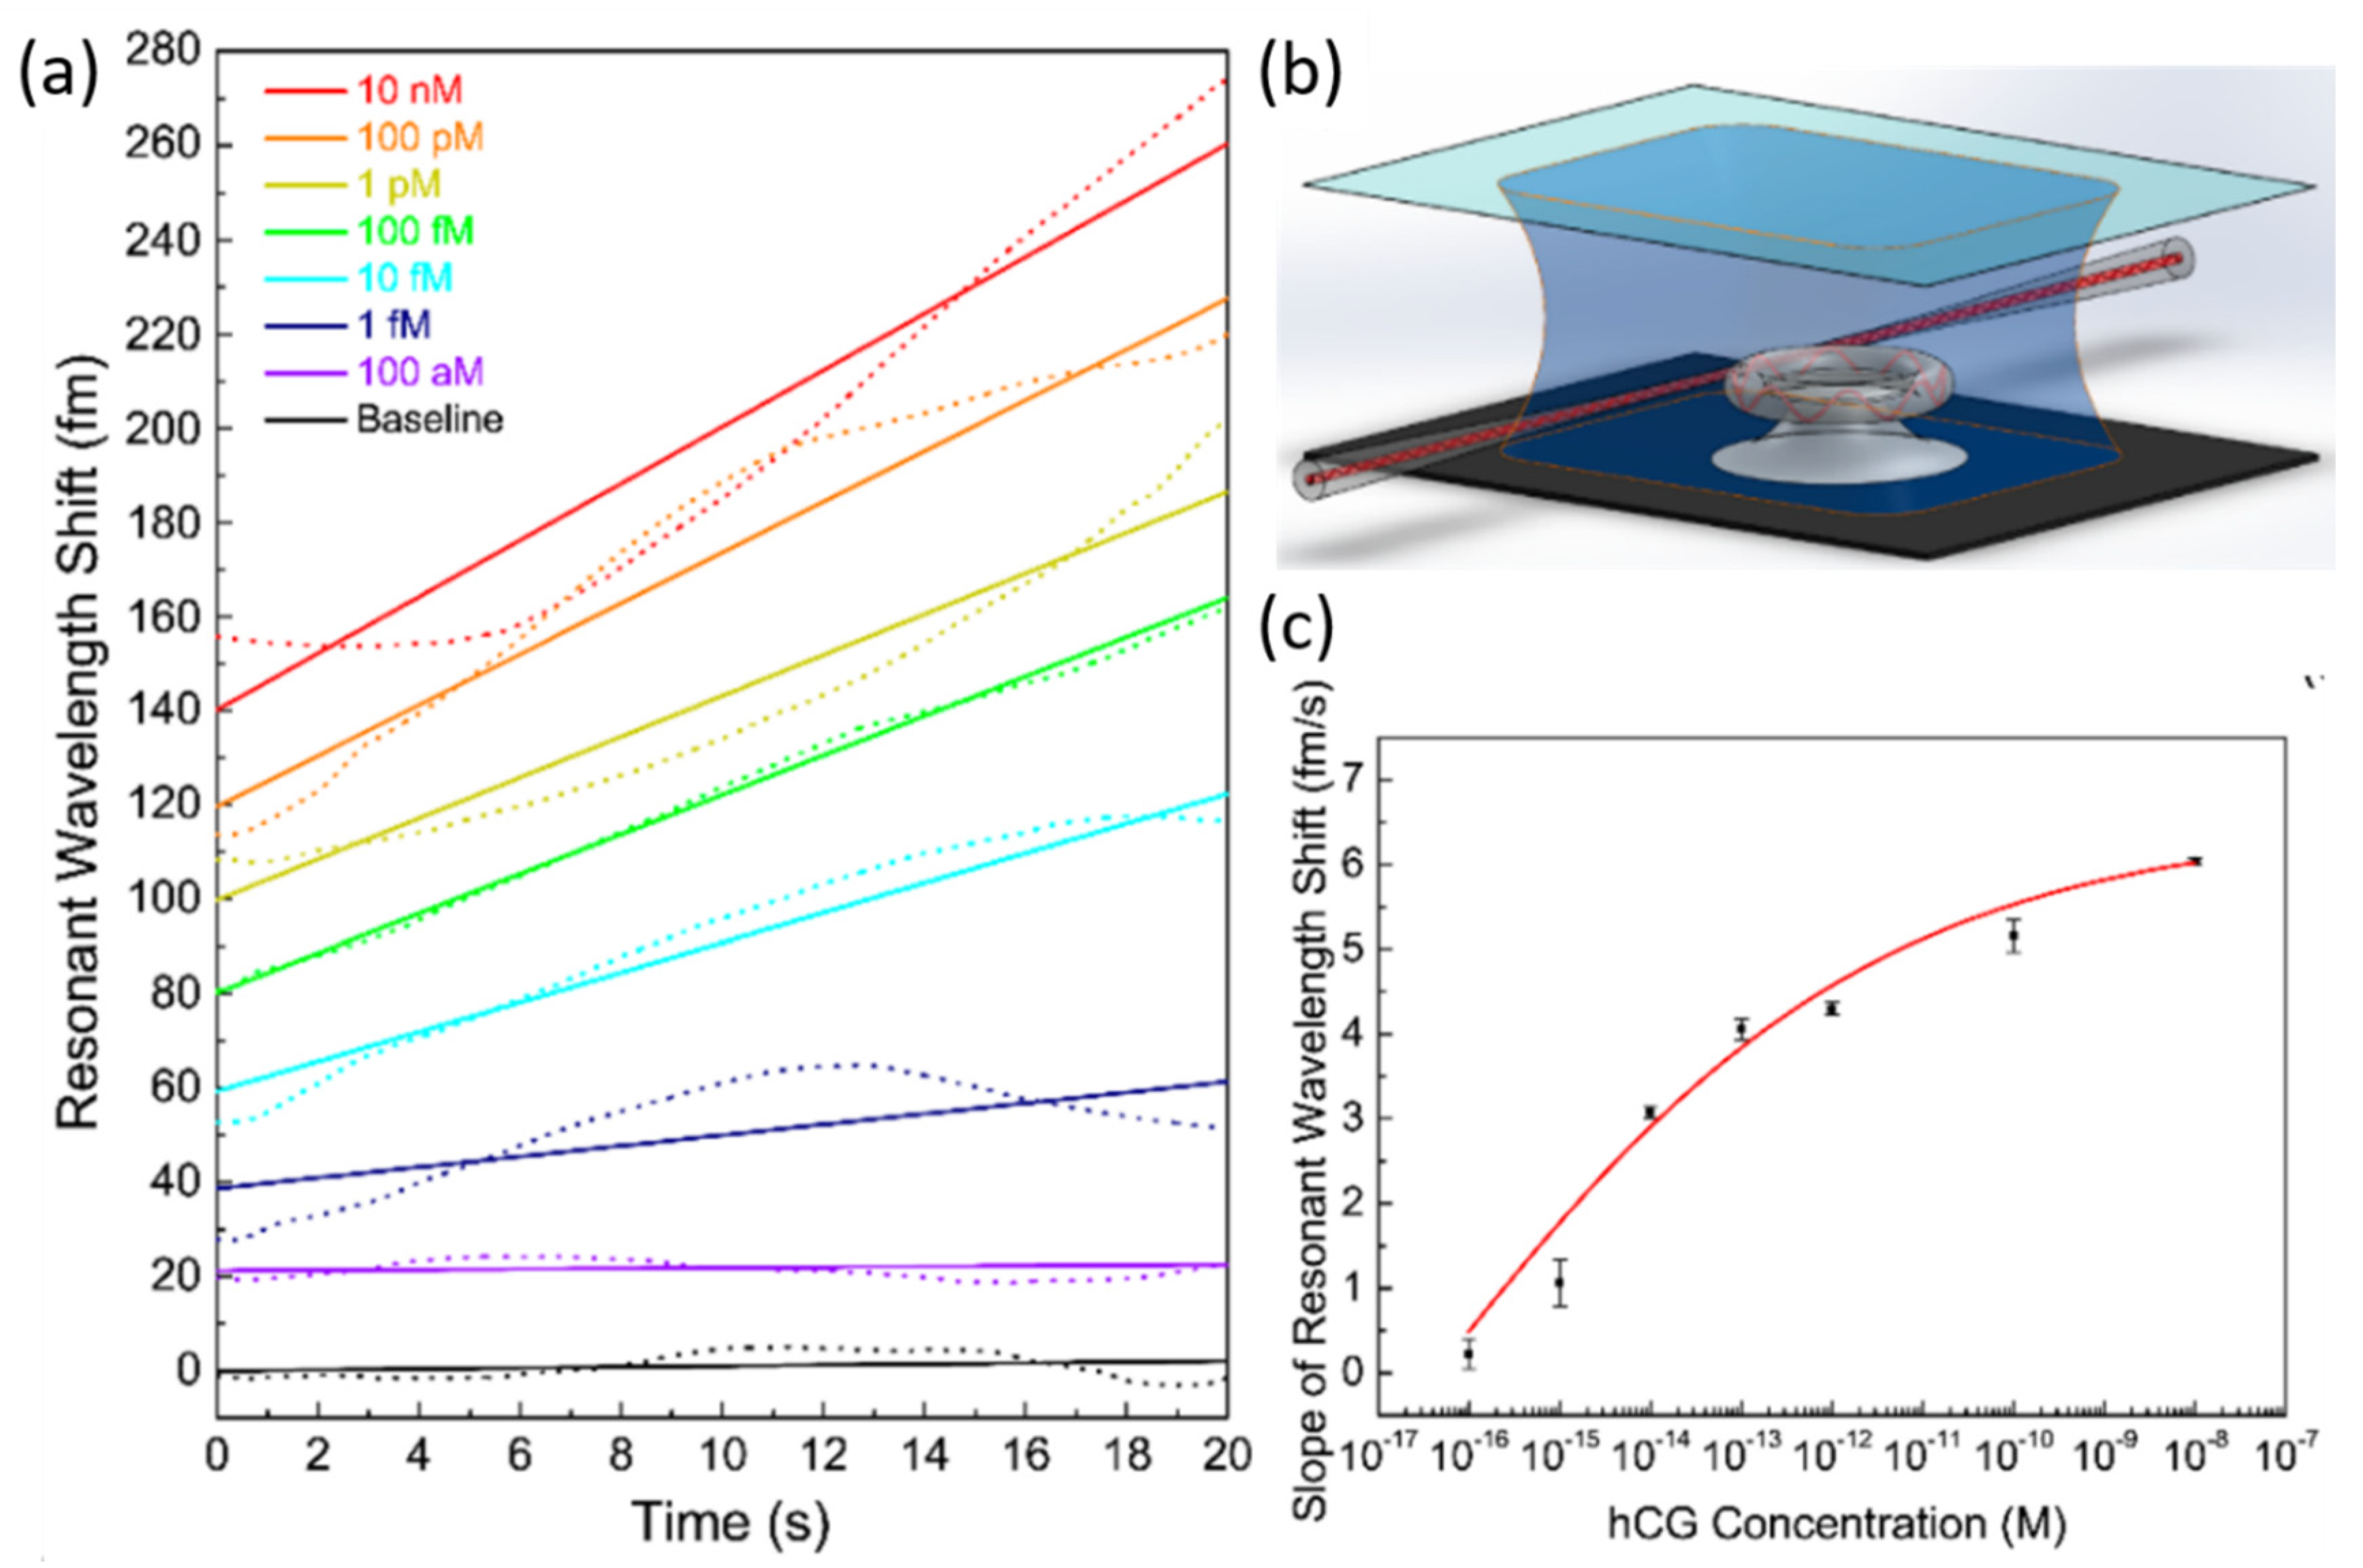
| Microtoroid | SiO2 | 107 | - | hCG | PBS | 120 aM | [121] |
| Capillary | - | 1.3 × 10⁶ | 23.36 nm/RIU | Glucose | Sodium acetate | 2.78 mM | [141] |
| Capillary | - | - | 995.63 nm/RIU | G-Quadruplex conformation | PBS | - | [122] |
4.5. Tabulated Summary of WGM-Based Biosensors
5. Conclusions and Outlook
Funding
Conflicts of Interest
Abbreviations
| AChE | Acetylcholinesterase |
| APTES | (3-Aminopropyl)triethoxysilane |
| APTMS | (3-Aminopropyl)trimethoxysilane |
| BLI | Biolayer Interferometry |
| BPF | Band-Pass Filter |
| BSA | Bovine Serum Albumin |
| Con A | Concanavalin A |
| CMRR | Cascaded-Micro Ring Resonator |
| CSF | Cerebrospinal Fluid |
| Cyt-C | Cytochrome C |
| DBR | Distributed Bragg Reflector |
| DEP | Dielectrophoresis |
| DI | Deionized |
| DTT | Dithiothreitol |
| ELISA | Enzyme-Linked Immunosorbent Assays |
| FBS | Fetal Bovine Serum |
| FPI | Fabry-Perot Interferometer |
| FSR | Free Spectral Range |
| FWHM | Full Width at Half Maximum |
| GOPTS | (3-glycidoxypropyl)trimethoxysilan |
| GTX1/4 | Gonyautoxin 1/4 |
| hCG | human Chorionic Gonadotropin |
| HCPCF | Hollow-Core Photonic Crystal Fiber |
| HD | Hyperboloid Drum |
| HM | Heavy Metal |
| HS | Hyper-immune Serum |
| IgG | Immunoglobulin G |
| LC | Liquid Crystal |
| LOD | Limit-Of-Detection |
| MC | Microcapillary |
| MIP | Molecularly Imprinted Polymer |
| Myr | Myristoylcholine |
| PBS | Phosphate Buffer Saline |
| PDMS | Polydimethylsiloxane |
| PLL | poly-L-lysine |
| POC | Point-Of-Care |
| PS | Pre-immune Serum |
| PSA | Prostate-Specific Antigen |
| PSM | Porous Silicon Microcavity |
| Q-factor | Quality-factor |
| RIU | Refractive Index Unit |
| SEM | Scanning Electron Microscope |
| SPR | Surface Plasmon Resonance |
| SMF | Single Mode Fiber |
| STX | Saxitoxin |
| SWG | Subwavelength Grating |
| TBS | Tris-Buffered Saline |
| TE | Transverse Electric |
| THPMP | (3-trihydroxysilylpropyl)methylphosphonate |
| WGM | Whispering Gallery Mode |
References
- Quesada-González, D.; Merkoçi, A. Nanomaterial-based devices for point-of-care diagnostic applications. Chem. Soc. Rev. 2018, 47, 4697–4709. [Google Scholar] [CrossRef] [PubMed]
- Cheng, N.; Du, D.; Wang, X.; Liu, D.; Xu, W.; Luo, Y.; Lin, Y. Recent advances in biosensors for detecting cancer-derived exosomes. Trends Biotechnol. 2019, 37, 1236–1254. [Google Scholar] [CrossRef] [PubMed]
- Shandilya, R.; Bhargava, A.; Bunkar, N.; Tiwari, R.; Goryacheva, I.Y.; Mishra, P.K. Nanobiosensors: Point-of-care approaches for cancer diagnostics. Biosens. Bioelectron. 2019, 130, 147–165. [Google Scholar] [CrossRef] [PubMed]
- Kirsch, J.; Siltanen, C.; Zhou, Q.; Revzin, A.; Simonian, A. Biosensor technology: Recent advances in threat agent detection and medicine. Chem. Soc. Rev. 2013, 42, 8733–8768. [Google Scholar] [CrossRef]
- Kozma, P.; Kehl, F.; Ehrentreich-Forster, E.; Stamm, C.; Bier, F.F. Integrated planar optical waveguide interferometer biosensors: A comparative review. Biosens. Bioelectron. 2014, 58, 287–307. [Google Scholar] [CrossRef]
- Gauglitz, G. Critical assessment of relevant methods in the field of biosensors with direct optical detection based on fibers and waveguides using plasmonic, resonance, and interference effects. Anal. Bioanal. Chem. 2020, 412, 3317–3349. [Google Scholar] [CrossRef] [Green Version]
- Inan, H.; Poyraz, M.; Inci, F.; Lifson, M.A.; Baday, M.; Cunningham, B.T.; Demirci, U. Photonic crystals: Emerging biosensors and their promise for point-of-care applications. Chem. Soc. Rev. 2017, 46, 366–388. [Google Scholar] [CrossRef]
- Dutta, G.; Lillehoj, P.B. Wash-free, label-free immunoassay for rapid electrochemical detection of PfHRP2 in whole blood samples. Sci. Rep. 2018, 8, 17129. [Google Scholar] [CrossRef]
- Zarei, M. Advances in point-of-care technologies for molecular diagnostics. Biosens. Bioelectron. 2017, 98, 494–506. [Google Scholar] [CrossRef]
- Mariani, S.; Minunni, M. Surface plasmon resonance applications in clinical analysis. Anal. Bioanal. Chem. 2014, 406, 2303–2323. [Google Scholar] [CrossRef]
- Masson, J.F. Surface Plasmon Resonance Clinical Biosensors for Medical Diagnostics. ACS Sens. 2017, 2, 16–30. [Google Scholar] [CrossRef]
- Omar, N.A.S.; Fen, Y.W.; Abdullah, J.; Sadrolhosseini, A.R.; Mustapha Kamil, Y.; Fauzi, N.M.; Hashim, H.S.; Mahdi, M.A. Quantitative and Selective Surface Plasmon Resonance Response Based on a Reduced Graphene Oxide-Polyamidoamine Nanocomposite for Detection of Dengue Virus E-Proteins. Nanomaterials 2020, 10, 569. [Google Scholar] [CrossRef] [Green Version]
- Singh, P. SPR Biosensors: Historical Perspectives and Current Challenges. Sens. Actuators B Chem. 2016, 229, 110–130. [Google Scholar] [CrossRef]
- Wang, W.; Mai, Z.; Chen, Y.; Wang, J.; Li, L.; Su, Q.; Li, X.; Hong, X. A label-free fiber optic SPR biosensor for specific detection of C-reactive protein. Sci. Rep. 2017, 7, 16904. [Google Scholar] [CrossRef] [PubMed]
- Homola, J.; Piliarik, M. Surface plasmon resonance (SPR) sensors. In Surface Plasmon Resonance Based Sensors; Springer: Berlin/Heidelberg, Germany, 2006; pp. 45–67. [Google Scholar]
- Liu, Q.; Liu, Y.; Chen, S.; Wang, F.; Peng, W. A low-cost and portable dual-channel fiber optic surface plasmon resonance system. Sensors 2017, 17, 2797. [Google Scholar] [CrossRef] [Green Version]
- Chen, C.; Wang, J. Optical biosensors: An exhaustive and comprehensive review. Analyst 2020, 145, 1605–1628. [Google Scholar] [CrossRef]
- Bonyár, A. Label-Free Nucleic Acid Biosensing Using Nanomaterial-Based Localized Surface Plasmon Resonance Imaging: A Review. ACS Appl. Nano Mater. 2020, 3, 8506–8521. [Google Scholar] [CrossRef]
- Baaske, M.D.; Foreman, M.R.; Vollmer, F. Single-molecule nucleic acid interactions monitored on a label-free microcavity biosensor platform. Nat. Nanotechnol. 2014, 9, 933–939. [Google Scholar] [CrossRef] [PubMed]
- Shen, B.Q.; Yu, X.C.; Zhi, Y.; Wang, L.; Kim, D.; Gong, Q.; Xiao, Y.F. Detection of Single Nanoparticles Using the Dissipative Interaction in a High-Q Microcavity. Phys. Rev. Appl. 2016, 5, 024011. [Google Scholar] [CrossRef] [Green Version]
- Su, J.; Goldberg, A.F.; Stoltz, B.M. Label-free detection of single nanoparticles and biological molecules using microtoroid optical resonators. Light Sci. Appl. 2016, 5, e16001. [Google Scholar] [CrossRef] [Green Version]
- Estevez, M.C.; Alvarez, M.; Lechuga, L.M. Integrated optical devices for lab-on-a-chip biosensing applications. Laser Photonics Rev. 2012, 6, 463–487. [Google Scholar] [CrossRef] [Green Version]
- Su, J. Label-Free Biological and Chemical Sensing Using Whispering Gallery Mode Optical Resonators: Past, Present, and Future. Sensors 2017, 17, 540. [Google Scholar] [CrossRef] [Green Version]
- Foreman, M.R.; Swaim, J.D.; Vollmer, F. Whispering gallery mode sensors. Adv. Opt. Photonics 2015, 7, 168–240. [Google Scholar] [CrossRef]
- Primiceri, E.; Chiriacò, M.S.; Notarangelo, F.M.; Crocamo, A.; Ardissino, D.; Cereda, M.; Bramanti, A.P.; Bianchessi, M.A.; Giannelli, G.; Maruccio, G. Key enabling technologies for point-of-care diagnostics. Sensors 2018, 18, 3607. [Google Scholar] [CrossRef] [Green Version]
- Feng, Z.; Bai, L. Advances of Optofluidic Microcavities for Microlasers and Biosensors. Micromachines 2018, 9, 122. [Google Scholar] [CrossRef] [PubMed] [Green Version]
- Baaske, M.; Vollmer, F. Optical resonator biosensors: Molecular diagnostic and nanoparticle detection on an integrated platform. ChemPhysChem 2012, 13, 427–436. [Google Scholar] [CrossRef] [PubMed]
- Nordin, A.N. Optical-resonator-based biosensing systems: Current status and future prospects. Nanobiosens. Dis. Diagn. 2016, 5, 41. [Google Scholar] [CrossRef] [Green Version]
- Righini, G.C.; Soria, S. Biosensing by WGM microspherical resonators. Sensors 2016, 16, 905. [Google Scholar] [CrossRef] [PubMed] [Green Version]
- White, I.M.; Fan, X. On the performance quantification of resonant refractive index sensors. Opt. Express 2008, 16, 1020–1028. [Google Scholar] [CrossRef] [Green Version]
- Justino, C.I.; Rocha-Santos, T.A.; Duarte, A.C. Review of analytical figures of merit of sensors and biosensors in clinical applications. Trac Trends Anal. Chem. 2010, 29, 1172–1183. [Google Scholar] [CrossRef]
- Taleuzzaman, M. Limit of Blank (LOB), Limit of Detection (LOD), and Limit of Quantification (LOQ). Org. Med. Chem. Int. J. 2018, 7, 5. [Google Scholar] [CrossRef]
- Ricard Boqué, Y.V.H. The Limit of Detection. Available online: https://www.chromatographyonline.com/view/limit-detection (accessed on 30 August 2020).
- Shrivastava, A.; Gupta, V.B. Methods for the determination of limit of detection and limit of quantitation of the analytical methods. Chron. Young Sci. 2011, 2, 21. [Google Scholar] [CrossRef]
- Liu, P.; Huang, H.; Cao, T.; Tang, Z.; Liu, X.; Qi, Z.; Ren, M.; Wu, H. An optofluidics biosensor consisted of high-finesse Fabry-Pérot resonator and micro-fluidic channel. Appl. Phys. Lett. 2012, 100, 233705. [Google Scholar] [CrossRef]
- Wu, H.; Huang, H.; Bai, M.; Liu, P.; Chao, M.; Hu, J.; Hao, J.; Cao, T. An ultra-low detection-limit optofluidic biosensor based on all glass Fabry-Perot cavity. Opt. Express 2014, 22, 31977–31983. [Google Scholar] [CrossRef]
- You, K.E.; Uddin, N.; Kim, T.H.; Fan, Q.H.; Yoon, H.J. Highly sensitive detection of biological substances using microfluidic enhanced Fabry-Perot etalon-based optical biosensors. Sens. Actuators B Chem. 2018, 277, 62–68. [Google Scholar] [CrossRef]
- Rho, D.; Breaux, C.; Kim, S. Demonstration of a Low-Cost and Portable Optical Cavity-Based Sensor through Refractive Index Measurements. Sensors 2019, 19, 2193. [Google Scholar] [CrossRef] [PubMed] [Green Version]
- Chen, L.H.; Chan, C.C.; Menon, R.; Balamurali, P.; Wong, W.C.; Ang, X.M.; Hu, P.B.; Shaillender, M.; Neu, B.; Zu, P.; et al. Fabry–Perot fiber-optic immunosensor based on suspended layer-by-layer (chitosan/polystyrene sulfonate) membrane. Sens. Actuators B Chem. 2013, 188, 185–192. [Google Scholar] [CrossRef]
- Takahashi, T.; Hizawa, T.; Misawa, N.; Taki, M.; Sawada, K.; Takahashi, K. Surface stress sensor based on MEMS Fabry–Perot interferometer with high wavelength selectivity for label-free biosensing. J. Micromech. Microeng. 2018, 28, 054002. [Google Scholar] [CrossRef]
- Rho, D.; Kim, S. Label-free real-time detection of biotinylated bovine serum albumin using a low-cost optical cavity-based biosensor. Opt. Express 2018, 26, 18982–18989. [Google Scholar] [CrossRef] [PubMed]
- Rho, D.; Kim, S. Large dynamic range optical cavity based sensor using a low cost three-laser system. In Proceedings of the 2017 39th Annual International Conference of the IEEE Engineering in Medicine and Biology Society (EMBC), Seogwipo, Korea, 11–15 July 2017; pp. 1393–1396. [Google Scholar] [CrossRef]
- Tu, L.; Huang, L.; Wang, W. A novel micromachined Fabry-Perot interferometer integrating nano-holes and dielectrophoresis for enhanced biochemical sensing. Biosens. Bioelectron. 2019, 127, 19–24. [Google Scholar] [CrossRef]
- Zhang, T.; Gong, Z.; Giorno, R.; Que, L. A nanostructured Fabry-Perot interferometer. Opt. Express 2010, 18, 20282–20288. [Google Scholar] [CrossRef] [PubMed]
- Song, C.; Deng, P.; Que, L. Rapid multiplexed detection of beta-amyloid and total-tau as biomarkers for Alzheimer’s disease in cerebrospinal fluid. Nanomedicine 2018, 14, 1845–1852. [Google Scholar] [CrossRef] [PubMed]
- Gaber, N.; Sabry, Y.M.; Erfan, M.; Marty, F.; Bourouina, T. High-Q Fabry(-)Perot Micro-Cavities for High-Sensitivity Volume Refractometry. Micromachines 2018, 9, 54. [Google Scholar] [CrossRef] [PubMed] [Green Version]
- Zhang, T.; He, Y.; Wei, J.; Que, L. Nanostructured optical microchips for cancer biomarker detection. Biosens. Bioelectron. 2012, 38, 382–388. [Google Scholar] [CrossRef]
- Casquel, R.; Holgado, M.; Laguna, M.F.; Hernández, A.L.; Santamaría, B.; Lavín, Á.; Tramarin, L.; Herreros, P. Engineering vertically interrogated interferometric sensors for optical label-free biosensing. Anal. Bioanal. Chem. 2020, 412, 3285–3297. [Google Scholar] [CrossRef] [Green Version]
- Guo, Y.; Li, H.; Reddy, K.; Shelar, H.S.; Nittoor, V.R.; Fan, X. Optofluidic Fabry–Pérot cavity biosensor with integrated flow-through micro-/nanochannels. Appl. Phys. Lett. 2011, 98, 041107. [Google Scholar] [CrossRef] [Green Version]
- Ivanova, E.P.; Truong, V.K.; Gervinskas, G.; Mitik-Dineva, N.; Day, D.; Jones, R.T.; Crawford, R.J.; Juodkazis, S. Highly selective trapping of enteropathogenic E. coli on Fabry–Pérot sensor mirrors. Biosens. Bioelectron. 2012, 35, 369–375. [Google Scholar] [CrossRef]
- Rho, D.; Kim, S. Low-cost optical cavity based sensor with a large dynamic range. Opt. Express 2017, 25, 11244–11253. [Google Scholar] [CrossRef]
- Zhu, H.; He, J.-J.; Shao, L.; Li, M. Ultra-high sensitivity optical sensors based on cascaded two Fabry-Perot interferometers. Sens. Actuators B Chem. 2018, 277, 152–156. [Google Scholar] [CrossRef]
- Orlov, A.V.; Pushkarev, A.V.; Znoyko, S.L.; Novichikhin, D.O.; Bragina, V.A.; Gorshkov, B.G.; Nikitin, P.I. Multiplex label-free biosensor for detection of autoantibodies in human serum: Tool for new kinetics-based diagnostics of autoimmune diseases. Biosens. Bioelectron. 2020, 159, 112187. [Google Scholar] [CrossRef]
- Nikitin, M.; Orlov, A.; Znoyko, S.; Bragina, V.; Gorshkov, B.; Ksenevich, T.; Cherkasov, V.; Nikitin, P. Multiplex biosensing with highly sensitive magnetic nanoparticle quantification method. J. Magn. Magn. Mater. 2018, 459, 260–264. [Google Scholar] [CrossRef]
- Zhang, H.; Jia, Z.; Lv, X.; Zhou, J.; Chen, L.; Liu, R.; Ma, J. Porous silicon optical microcavity biosensor on silicon-on-insulator wafer for sensitive DNA detection. Biosens. Bioelectron. 2013, 44, 89–94. [Google Scholar] [CrossRef] [PubMed]
- Caroselli, R.; Martin Sanchez, D.; Ponce Alcantara, S.; Prats Quilez, F.; Torrijos Moran, L.; Garcia-Ruperez, J. Real-Time and In-Flow Sensing Using a High Sensitivity Porous Silicon Microcavity-Based Sensor. Sensors 2017, 17, 2813. [Google Scholar] [CrossRef] [PubMed] [Green Version]
- Li, P.; Jia, Z.; Lu, X.; Liu, Y.; Ning, X.; Mo, J.; Wang, J. Spectrometer-free biological detection method using porous silicon microcavity devices. Opt Express 2015, 23, 24626–24633. [Google Scholar] [CrossRef]
- Li, S.; Huang, J.; Cai, L. A porous silicon optical microcavity for sensitive bacteria detection. Nanotechnology 2011, 22, 425502. [Google Scholar] [CrossRef] [PubMed]
- Van Nguyen, T.; Bui, H. Nano porous silicon microcavity sensor for determination organic solvents and pesticide in water. Adv. Nat. Sci. Nanosci. Nanotechnol. 2014, 5, 045003. [Google Scholar]
- Cao, T.; Zhao, Y.; Nattoo, C.A.; Layouni, R.; Weiss, S.M. A smartphone biosensor based on analysing structural colour of porous silicon. Analyst 2019, 144, 3942–3948. [Google Scholar] [CrossRef] [PubMed]
- Li, P.; Jia, Z.; Lü, G. Hydatid detection using the near-infrared transmission angular spectra of porous silicon microcavity biosensors. Sci. Rep. 2017, 7, 1–8. [Google Scholar] [CrossRef]
- Krismastuti, F.S.; Cavallaro, A.; Prieto-Simon, B.; Voelcker, N.H. Toward Multiplexing Detection of Wound Healing Biomarkers on Porous Silicon Resonant Microcavities. Adv. Sci. (Weinh) 2016, 3, 1500383. [Google Scholar] [CrossRef] [Green Version]
- Zhang, M.; Jia, Z.; Lv, X.; Huang, X. Biological detection based on the transmitted light image from a porous silicon microcavity. IEEE Sens. J. 2020, 20, 12184–12189. [Google Scholar] [CrossRef]
- Ramakrishan, S.K.; Martin Fernandez, M.; Cloitre, T.; Agarwal, V.; Cuisinier, F.J.G.; Gergely, C. Porous silicon microcavities redefine colorimetric ELISA sensitivity for ultrasensitive detection of autoimmune antibodies. Sens. Actuators B Chem. 2018, 272, 211–218. [Google Scholar] [CrossRef]
- Zhao, Y.; Gaur, G.; Retterer, S.T.; Laibinis, P.E.; Weiss, S.M. Flow-Through Porous Silicon Membranes for Real-Time Label-Free Biosensing. Anal. Chem. 2016, 88, 10940–10948. [Google Scholar] [CrossRef] [PubMed] [Green Version]
- Yin, M.-J.; Gu, B.; An, Q.-F.; Yang, C.; Guan, Y.L.; Yong, K.-T. Recent development of fiber-optic chemical sensors and biosensors: Mechanisms, materials, micro/nano-fabrications and applications. Coord. Chem. Rev. 2018, 376, 348–392. [Google Scholar] [CrossRef]
- Socorro-Leránoz, A.B.; Santano, D.; Del Villar, I.; Matias, I.R. Trends in the design of wavelength-based optical fibre biosensors (2008–2018). Biosens. Bioelectron. X 2019, 1, 100015. [Google Scholar] [CrossRef]
- Huang, Y.W.; Tao, J.; Huang, X.G. Research Progress on F-P Interference-Based Fiber-Optic Sensors. Sensors 2016, 16, 1424. [Google Scholar] [CrossRef] [Green Version]
- Liu, X.; Jiang, M.; Dong, T.; Sui, Q.; Geng, X. Label-Free Immunosensor Based on Optical Fiber Fabry–Perot Interferometer. IEEE Sens. J. 2016, 16, 7515–7520. [Google Scholar] [CrossRef]
- Liu, X.; Jiang, M.; Sui, Q.; Luo, S.; Geng, X. Optical fiber Fabry–Perot interferometer for microorganism growth detection. Opt. Fiber Technol. 2016, 30, 32–37. [Google Scholar] [CrossRef]
- Wu, X.; Liu, H.; Wang, X.; Jiang, H. Fiber-Optic Biological/Chemical Sensing System Based on Degradable Hydrogel. IEEE Sens. J. 2018, 18, 45–52. [Google Scholar] [CrossRef]
- Cano-Velazquez, M.S.; Lopez-Marin, L.M.; Hernandez-Cordero, J. Fiber optic interferometric immunosensor based on polydimethilsiloxane (PDMS) and bioactive lipids. Biomed. Opt. Express 2020, 11, 1316–1326. [Google Scholar] [CrossRef]
- Elosua, C.; Arregui, F.J.; Villar, I.D.; Ruiz-Zamarreno, C.; Corres, J.M.; Bariain, C.; Goicoechea, J.; Hernaez, M.; Rivero, P.J.; Socorro, A.B.; et al. Micro and Nanostructured Materials for the Development of Optical Fibre Sensors. Sensors 2017, 17, 2312. [Google Scholar] [CrossRef] [Green Version]
- Flores, R.; Janeiro, R.; Viegas, J. Optical fibre Fabry-Pérot interferometer based on inline microcavities for salinity and temperature sensing. Sci. Rep. 2019, 9, 1–9. [Google Scholar] [CrossRef] [PubMed]
- Chen, S.; Liu, Y.; Liu, Q.; Peng, W. Temperature-Compensating Fiber-Optic Surface Plasmon Resonance Biosensor. IEEE Photonics Technol. Lett. 2016, 28, 213–216. [Google Scholar] [CrossRef]
- Yu, C.-B.; Wu, Y.; Li, C.; Wu, F.; Zhou, J.-H.; Gong, Y.; Rao, Y.-J.; Chen, Y.-F. Highly sensitive and selective fiber-optic Fabry-Perot volatile organic compounds sensor based on a PMMA film. Opt. Mater. Express 2017, 7, 2111–2116. [Google Scholar] [CrossRef]
- Kanawade, R.; Kumar, A.; Pawar, D.; Late, D.; Mondal, S.; Sinha, R.K. Fiber optic Fabry–Perot interferometer sensor: An efficient and fast approach for ammonia gas sensing. JOSA B 2019, 36, 684–689. [Google Scholar] [CrossRef]
- Oliveira, R.; Bilro, L.; Nogueira, R. Fabry-Pérot cavities based on photopolymerizable resins for sensing applications. Opt. Mater. Express 2018, 8, 2208–2221. [Google Scholar] [CrossRef]
- Kumaraswamy, S.; Tobias, R. Label-free kinetic analysis of an antibody–antigen interaction using biolayer interferometry. In Protein-Protein Interactions; Springer: Berlin/Heidelberg, Germany, 2015; pp. 165–182. [Google Scholar]
- Ziu, I.; Laryea, E.T.; Alashkar, F.; Wu, C.G.; Martic, S. A dip-and-read optical aptasensor for detection of tau protein. Anal. Bioanal. Chem. 2020, 412, 1193–1201. [Google Scholar] [CrossRef]
- Petersen, R.L. Strategies Using Bio-Layer Interferometry Biosensor Technology for Vaccine Research and Development. Biosensors 2017, 7, 49. [Google Scholar] [CrossRef] [Green Version]
- Wallner, J.; Lhota, G.; Jeschek, D.; Mader, A.; Vorauer-Uhl, K. Application of Bio-Layer Interferometry for the analysis of protein/liposome interactions. J. Pharm. Biomed. Anal. 2013, 72, 150–154. [Google Scholar] [CrossRef]
- Verzijl, D.; Riedl, T.; Parren, P.; Gerritsen, A.F. A novel label-free cell-based assay technology using biolayer interferometry. Biosens. Bioelectron. 2017, 87, 388–395. [Google Scholar] [CrossRef] [Green Version]
- Ciesielski, G.L.; Hytonen, V.P.; Kaguni, L.S. Biolayer Interferometry: A Novel Method to Elucidate Protein-Protein and Protein-DNA Interactions in the Mitochondrial DNA Replisome. Methods Mol. Biol. 2016, 1351, 223–231. [Google Scholar] [CrossRef] [Green Version]
- Auer, S.; Koho, T.; Uusi-Kerttula, H.; Vesikari, T.; Blazevic, V.; Hytönen, V.P. Rapid and sensitive detection of norovirus antibodies in human serum with a biolayer interferometry biosensor. Sens. Actuators B Chem. 2015, 221, 507–514. [Google Scholar] [CrossRef] [Green Version]
- Rath, C.; Burger, J.; Norval, L.; Kraemer, S.D.; Gensch, N.; van der Kooi, A.; Reinemann, C.; O’Sullivan, C.; Svobodova, M.; Roth, G. Comparison of different label-free imaging high-throughput biosensing systems for aptamer binding measurements using thrombin aptamers. Anal. Biochem. 2019, 583, 113323. [Google Scholar] [CrossRef] [PubMed]
- Mechaly, A.; Cohen, H.; Cohen, O.; Mazor, O. A biolayer interferometry-based assay for rapid and highly sensitive detection of biowarfare agents. Anal. Biochem. 2016, 506, 22–27. [Google Scholar] [CrossRef]
- Kamat, V.; Rafique, A. Designing binding kinetic assay on the bio-layer interferometry (BLI) biosensor to characterize antibody-antigen interactions. Anal. Biochem. 2017, 536, 16–31. [Google Scholar] [CrossRef]
- Muller-Esparza, H.; Osorio-Valeriano, M.; Steube, N.; Thanbichler, M.; Randau, L. Bio-Layer Interferometry Analysis of the Target Binding Activity of CRISPR-Cas Effector Complexes. Front. Mol. Biosci. 2020, 7, 98. [Google Scholar] [CrossRef]
- Gao, S.; Zheng, X.; Hu, B.; Sun, M.; Wu, J.; Jiao, B.; Wang, L. Enzyme-linked, aptamer-based, competitive biolayer interferometry biosensor for palytoxin. Biosens. Bioelectron. 2017, 89, 952–958. [Google Scholar] [CrossRef]
- Gao, S.; Zheng, X.; Wu, J. A biolayer interferometry-based competitive biosensor for rapid and sensitive detection of saxitoxin. Sens. Actuators B Chem. 2017, 246, 169–174. [Google Scholar] [CrossRef]
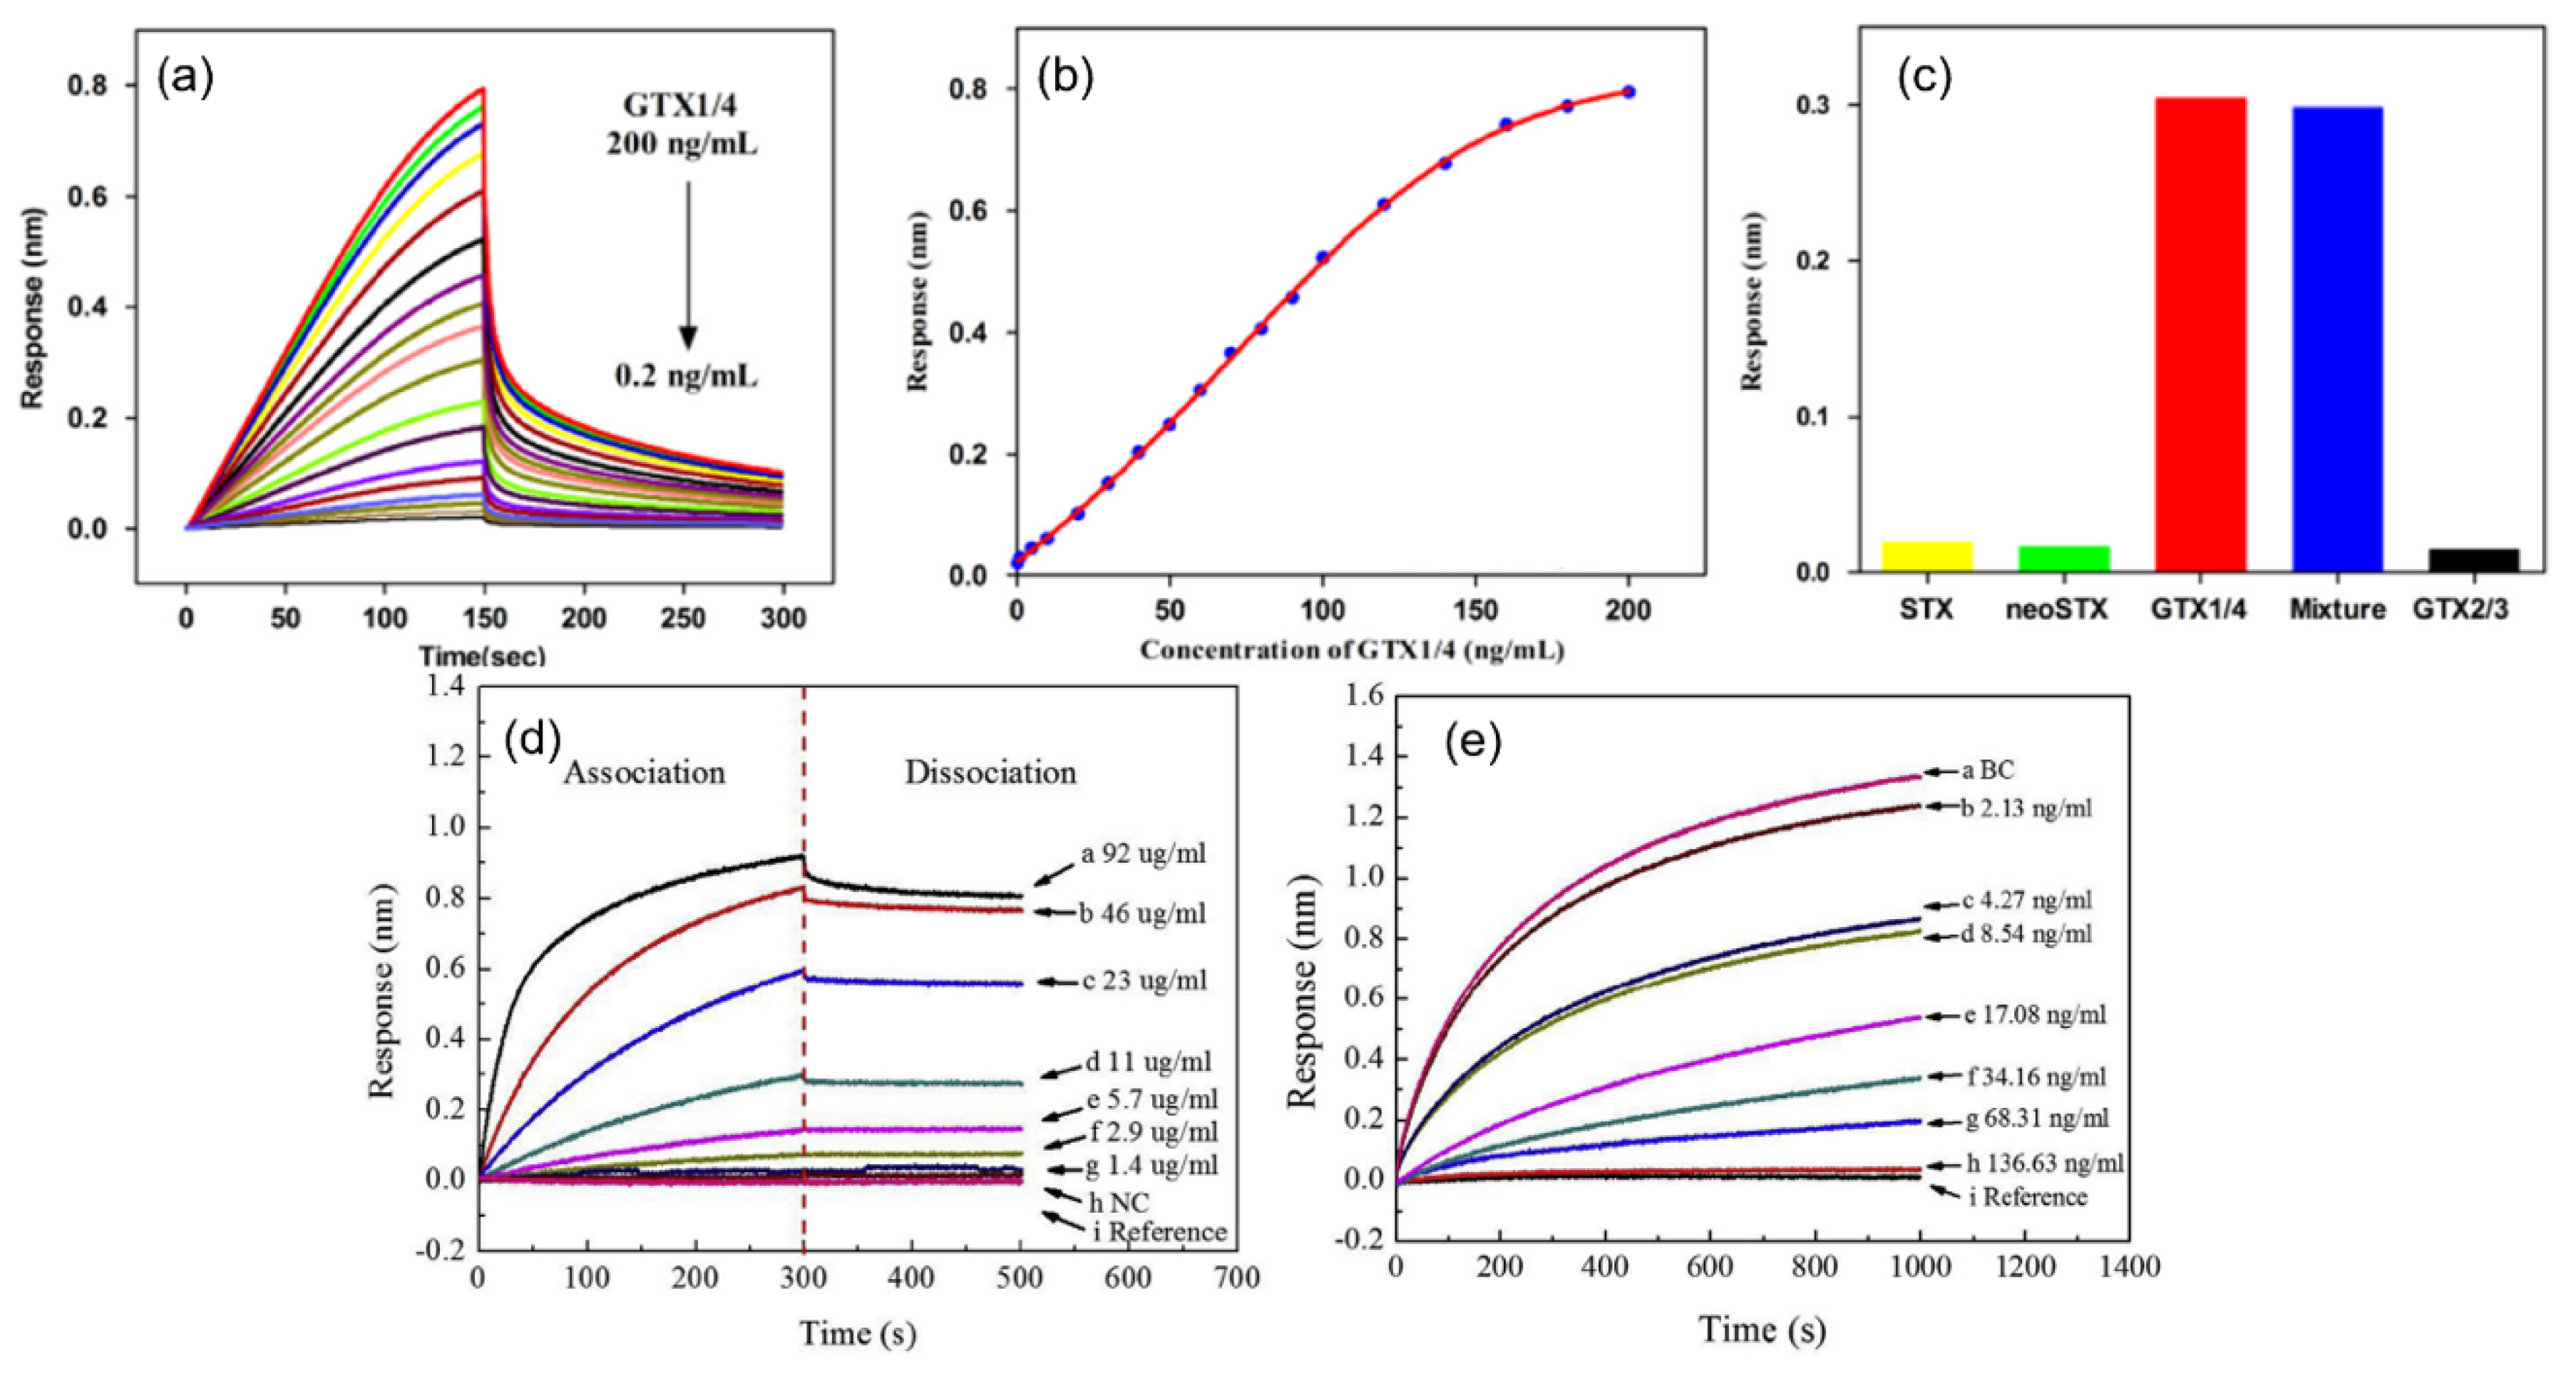
- Gao, S.; Hu, B.; Zheng, X.; Cao, Y.; Liu, D.; Sun, M.; Jiao, B.; Wang, L. Gonyautoxin 1/4 aptamers with high-affinity and high-specificity: From efficient selection to aptasensor application. Biosens. Bioelectron. 2016, 79, 938–944. [Google Scholar] [CrossRef]
- Zhang, H.; Li, W.; Luo, H.; Xiong, G.; Yu, Y. Quantitative determination of testosterone levels with biolayer interferometry. Chem. Biol. Interact. 2017, 276, 141–148. [Google Scholar] [CrossRef]
- Markwalter, C.F.; Jang, I.K.; Burton, R.A.; Domingo, G.J.; Wright, D.W. Biolayer interferometry predicts ELISA performance of monoclonal antibody pairs for Plasmodium falciparum histidine-rich protein 2. Anal. Biochem. 2017, 534, 10–13. [Google Scholar] [CrossRef] [PubMed]
- Sultana, A.; Lee, J.E. Measuring protein-protein and protein-nucleic Acid interactions by biolayer interferometry. Curr. Protoc. Protein. Sci. 2015, 79, 19.25.1–19.25.6. [Google Scholar] [CrossRef] [PubMed]
- Seo, D.; Paek, S.H.; Oh, S.; Seo, S.; Paek, S.H. A Human Serum-Based Enzyme-Free Continuous Glucose Monitoring Technique Using a Needle-Type Bio-Layer Interference Sensor. Sensors 2016, 16, 1581. [Google Scholar] [CrossRef] [PubMed] [Green Version]
- Song, L.; Lachno, D.R.; Hanlon, D.; Shepro, A.; Jeromin, A.; Gemani, D.; Talbot, J.A.; Racke, M.M.; Dage, J.L.; Dean, R.A. A digital enzyme-linked immunosorbent assay for ultrasensitive measurement of amyloid-β 1–42 peptide in human plasma with utility for studies of Alzheimer’s disease therapeutics. Alzheimer’s Res. Ther. 2016, 8, 58. [Google Scholar] [CrossRef] [Green Version]
- Kang, J.-H.; Vanderstichele, H.; Trojanowski, J.Q.; Shaw, L.M. Simultaneous analysis of cerebrospinal fluid biomarkers using microsphere-based xMAP multiplex technology for early detection of Alzheimer’s disease. Methods 2012, 56, 484–493. [Google Scholar] [CrossRef]
- Wu, J.-X.; Zhang, S.-E.; Zhou, X.-P. Monoclonal antibody-based ELISA and colloidal gold-based immunochromatographic assay for streptomycin residue detection in milk and swine urine. J. Zhejiang Univ. Sci. B 2010, 11, 52–60. [Google Scholar] [CrossRef] [Green Version]
- Zhang, K.; Song, C.; Li, Q.; Li, Y.; Yang, K.; Jin, B. The establishment of a highly sensitive ELISA for detecting bovine serum albumin (BSA) based on a specific pair of monoclonal antibodies (mAb) and its application in vaccine quality control. Hum. Vaccines 2010, 6, 652–658. [Google Scholar] [CrossRef] [PubMed]
- Farré, M.; Martínez, E.; Ramón, J.; Navarro, A.; Radjenovic, J.; Mauriz, E.; Lechuga, L.; Marco, M.P.; Barceló, D. Part per trillion determination of atrazine in natural water samples by a surface plasmon resonance immunosensor. Anal. Bioanal. Chem. 2007, 388, 207–214. [Google Scholar] [CrossRef]
- Tsai, H.; Lu, Y.-H.; Liao, H.-X.; Wu, S.-W.; Yu, F.-Y.; Fuh, C.B. Detection of rabbit IgG by using functional magnetic particles and an enzyme-conjugated antibody with a homemade magnetic microplate. Chem. Cent. J. 2015, 9, 8. [Google Scholar] [CrossRef] [Green Version]
- Lin, G.; Chembo, Y.K. Monolithic total internal reflection resonators for applications in photonics. Opt. Mater. X 2019, 2, 100017. [Google Scholar] [CrossRef]
- Matsko, A.B.; Ilchenko, V.S. Optical resonators with whispering-gallery modes-part I: Basics. IEEE J. Sel. Top. Quantum Electron. 2006, 12, 3–14. [Google Scholar] [CrossRef]
- Vollmer, F.; Arnold, S. Whispering-gallery-mode biosensing: Label-free detection down to single molecules. Nat. Methods 2008, 5, 591. [Google Scholar] [CrossRef] [PubMed]
- Righini, G.C.; Dumeige, Y.; Féron, P.; Ferrari, M.; Nunzi Conti, G.; Ristic, D.; Soria, S. Whispering gallery mode microresonators: Fundamentals and applications. La Riv. Del Nuovo Cim. 2011, 34, 24. [Google Scholar] [CrossRef]
- Pongruengkiat, W.; Pechprasarn, S. Whispering-Gallery Mode Resonators for Detecting Cancer. Sensors 2017, 17, 2095. [Google Scholar] [CrossRef] [PubMed] [Green Version]
- Cai, L.; Pan, J.; Hu, S. Overview of the coupling methods used in whispering gallery mode resonator systems for sensing. Opt. Lasers Eng. 2020, 127, 105968. [Google Scholar] [CrossRef]
- Jiang, X.; Qavi, A.J.; Huang, S.H.; Yang, L. Whipsering-Gallery Sensors. Matter 2020, 3, 371–392. [Google Scholar] [CrossRef] [PubMed]
- Iwao Teraoka, S.A. Theory of resonance shifts in TE and TM whispering gallery modes by nonradial perturbations for sensing applications. J. Opt. Soc. Am. B 2006, 23, 1381–1389. [Google Scholar] [CrossRef] [Green Version]
- Reynolds, T.; Francois, A.; Riesen, N.; Turvey, M.E.; Nicholls, S.J.; Hoffmann, P.; Monro, T.M. Dynamic Self-Referencing Approach to Whispering Gallery Mode Biosensing and Its Application to Measurement within Undiluted Serum. Anal. Chem. 2016, 88, 4036–4040. [Google Scholar] [CrossRef] [Green Version]
- Xie, Z.; Cao, Z.; Liu, Y.; Zhang, Q.; Zou, J.; Shao, L.; Wang, Y.; He, J.; Li, M. Highly-sensitive optical biosensor based on equal FSR cascaded microring resonator with intensity interrogation for detection of progesterone molecules. Opt. Express 2017, 25, 33193–33201. [Google Scholar] [CrossRef]
- Ghali, H.; Chibli, H.; Nadeau, J.L.; Bianucci, P.; Peter, Y.A. Real-Time Detection of Staphylococcus Aureus Using Whispering Gallery Mode Optical Microdisks. Biosensors 2016, 6, 20. [Google Scholar] [CrossRef] [Green Version]
- Taniguchi, T.; Hirowatari, A.; Ikeda, T.; Fukuyama, M.; Amemiya, Y.; Kuroda, A.; Yokoyama, S. Detection of antibody-antigen reaction by silicon nitride slot-ring biosensors using protein G. Opt. Commun. 2016, 365, 16–23. [Google Scholar] [CrossRef]
- Li, H.; Guo, Y.; Sun, Y.; Reddy, K.; Fan, X. Analysis of single nanoparticle detection by using 3-dimensionally confined optofluidic ring resonators. Opt. Express 2010, 18, 25081–25088. [Google Scholar] [CrossRef] [PubMed]
- Guo, Z.; Qin, Y.; Chen, P.; Hu, J.; Zhou, Y.; Zhao, X.; Liu, Z.; Fei, Y.; Jiang, X.; Wu, X. Hyperboloid-Drum Microdisk Laser Biosensors for Ultrasensitive Detection of Human IgG. Small 2020, 16, 2000239. [Google Scholar] [CrossRef] [PubMed]
- de Goede, M.; Chang, L.; Mu, J.; Dijkstra, M.; Obregon, R.; Martinez, E.; Padilla, L.; Mitjans, F.; Garcia-Blanco, S.M. Al2O3:Yb(3+) integrated microdisk laser label-free biosensor. Opt. Lett. 2019, 44, 5937–5940. [Google Scholar] [CrossRef] [PubMed]
- Duan, R.; Hao, X.; Li, Y.; Li, H. Detection of acetylcholinesterase and its inhibitors by liquid crystal biosensor based on whispering gallery mode. Sens. Actuators B Chem. 2020, 308, 127672. [Google Scholar] [CrossRef]
- Duan, R.; Li, Y.; Li, H.; Yang, J. Detection of heavy metal ions using whispering gallery mode lasing in functionalized liquid crystal microdroplets. Biomed. Opt. Express 2019, 10, 6073–6083. [Google Scholar] [CrossRef]
- Fu, L.; Lu, Q.; Liu, X.; Chen, X.; Wu, X.; Xie, S. Combining whispering gallery mode optofluidic microbubble resonator sensor with GR-5 DNAzyme for ultra-sensitive lead ion detection. Talanta 2020, 213, 120815. [Google Scholar] [CrossRef]
- Ozgur, E.; Roberts, K.E.; Ozgur, E.O.; Gin, A.N.; Bankhead, J.R.; Wang, Z.; Su, J. Ultrasensitive Detection of Human Chorionic Gonadotropin Using Frequency Locked Microtoroid Optical Resonators. Anal. Chem. 2019, 91, 11872–11878. [Google Scholar] [CrossRef]
- Wang, Y.; Zhang, H.; Cui, Y.; Lin, W.; Liu, B.; Xiang, D. Real-time conformational change monitoring of G-quadruplex using capillary-based biocompatible whispering gallery mode microresonator. IEEE Sens. J. 2020, 20, 12558–12564. [Google Scholar] [CrossRef]
- Chen, Y.J.; Schoeler, U.; Huang, C.H.; Vollmer, F. Combining Whispering-Gallery Mode Optical Biosensors with Microfluidics for Real-Time Detection of Protein Secretion from Living Cells in Complex Media. Small J. 2018, 14, 1703705. [Google Scholar] [CrossRef]
- Kim, E.; Baaske, M.D.; Schuldes, I.; Wilsch, P.S.; Vollmer, F. Label-free optical detection of single enzyme-reactant reactions and associated conformational changes. Sci. Adv. 2017, 3, e1603044. [Google Scholar] [CrossRef] [Green Version]
- Narang, R.; Mohammadi, S.; Ashani, M.M.; Sadabadi, H.; Hejazi, H.; Zarifi, M.H.; Sanati-Nezhad, A. Sensitive, Real-time and Non-Intrusive Detection of Concentration and Growth of Pathogenic Bacteria using Microfluidic-Microwave Ring Resonator Biosensor. Sci. Rep. 2018, 8, 15807. [Google Scholar] [CrossRef] [PubMed]
- Frustaci, S.; Vollmer, F. Whispering-gallery mode (WGM) sensors: Review of established and WGM-based techniques to study protein conformational dynamics. Curr. Opin. Chem. Biol. 2019, 51, 66–73. [Google Scholar] [CrossRef]
- Brice, I.; Grundsteins, K.; Atvars, A.; Alnis, J.; Viter, R.; Ramanavicius, A. Whispering gallery mode resonator and glucose oxidase based glucose biosensor. Sens. Actuators B Chem. 2020, 318, 128004. [Google Scholar] [CrossRef]
- Duan, R.; Li, Y.; Li, H.; Yang, J. Real-time monitoring of the enzymatic reaction of urease by using whispering gallery mode lasing. Opt. Express 2019, 27, 35427–35436. [Google Scholar] [CrossRef] [PubMed]
- Flueckiger, J.; Schmidt, S.; Donzella, V.; Sherwali, A.; Ratner, D.M.; Chrostowski, L.; Cheung, K.C. Sub-wavelength grating for enhanced ring resonator biosensor. Opt. Express 2016, 24, 14. [Google Scholar] [CrossRef]
- Kim, Y.; Lee, H. On-chip label-free biosensing based on active whispering gallery mode resonators pumped by a light-emitting diode. Opt. Express 2019, 27, 34405–34415. [Google Scholar] [CrossRef] [Green Version]
- Khanum, R.; Moirangthem, R.S.; Das, N.M. Observation of defect-assisted enhanced visible whispering gallery modes in ytterbium-doped ZnO microsphere. J. Appl. Phys. 2017, 121, 213101. [Google Scholar] [CrossRef]
- Wang, Y.; Ta, V.D.; Leck, K.S.; Tan, B.H.I.; Wang, Z.; He, T.; Ohl, C.D.; Demir, H.V.; Sun, H. Robust Whispering-Gallery-Mode Microbubble Lasers from Colloidal Quantum Dots. Nano Lett. 2017, 17, 6. [Google Scholar] [CrossRef]
- Labrador-Páez, L.; Soler-Carracedo, K.; Hernández-Rodríguez, M.; Martín, I.R.; Carmon, T.; Martin, L.L. Liquid whispering-gallery-mode resonator as a humidity sensor. Opt. Express 2017, 25, 1165–1172. [Google Scholar] [CrossRef]
- Anand, V.R.; Mathew, S.; Samuel, B.; Radhakrishnan, P.; Kailasnath, M. Thermo-optic tuning of whispering gallery mode lasing from a dye-doped hollow polymer optical fiber. Opt. Lett. 2017, 42, 4. [Google Scholar] [CrossRef]
- Ahmed, A.; Rushworth, J.V.; Hirst, N.A.; Millner, P.A. Biosensors for whole-cell bacterial detection. Clin. Microbiol. Rev. 2014, 27, 631–646. [Google Scholar] [CrossRef] [PubMed] [Green Version]
- Berneschi, S.; Bettazzi, F.; Giannetti, A.; Baldini, F.; Nunzi Conti, G.; Pelli, S.; Palchetti, I. Optical whispering gallery mode resonators for label-free detection of water contaminants. Trac. Trends Anal. Chem. 2020, 126, 115856. [Google Scholar] [CrossRef]
- Fu, L.; Chen, X.; Lu, Q.; Xie, S. Label-free DNA detection based on whispering gallery mode optofluidic microcavity biosensor. In Proceedings of the Nanophotonics and Micro/Nano Optics IV, Beijing, China, 11–13 October 2018; p. 108231E. [Google Scholar] [CrossRef]
- Duan, R.; Li, Y.; Shi, B.; Li, H.; Yang, J. Real-time, quantitative and sensitive detection of urea by whispering gallery mode lasing in liquid crystal microdroplet. Talanta 2020, 209, 120513. [Google Scholar] [CrossRef] [PubMed]
- Zhang, X.; Liu, L.; Xu, L. Ultralow sensing limit in optofluidic micro-bottle resonator biosensor by self-referenced differential-mode detection scheme. Appl. Phys. Lett. 2014, 104, 033703. [Google Scholar] [CrossRef]
- Toren, P.; Ozgur, E.; Bayindir, M. Label-Free Optical Biodetection of Pathogen Virulence Factors in Complex Media Using Microtoroids with Multifunctional Surface Functionality. ACS Sens. 2018, 3, 352–359. [Google Scholar] [CrossRef] [Green Version]
- Wan, H.; Chen, J.; Wan, C.; Zhou, Q.; Wang, J.; Zhang, Z. Optofluidic microcapillary biosensor for label-free, low glucose concentration detection. Biomed. Opt. Express 2019, 10, 3929. [Google Scholar] [CrossRef]
- Brooks, T.A.; Hurley, L.H. The role of supercoiling in transcriptional control of MYC and its importance in molecular therapeutics. Nat. Rev. Cancer 2009, 9, 849–861. [Google Scholar] [CrossRef]
- Mitchell, J.; Wu, Y.; Cook, C.; Main, L. Protein conjugate-based immunoassay of whole milk progesterone. J. Dairy Sci. 2004, 87, 2864–2867. [Google Scholar] [CrossRef]
- Łupicka-Słowik, A.; Grzywa, R.; Leporowska, E.; Procyk, D.; Oleksyszyn, J.; Sieńczyk, M. Development and evaluation of an immunoglobulin Y-based ELISA for measuring prostate specific antigen in human serum. Ann. Lab. Med. 2019, 39, 373–380. [Google Scholar] [CrossRef] [Green Version]
- Huang, L.; Reekmans, G.; Saerens, D.; Friedt, J.-M.; Frederix, F.; Francis, L.; Muyldermans, S.; Campitelli, A.; Van Hoof, C. Prostate-specific antigen immunosensing based on mixed self-assembled monolayers, camel antibodies and colloidal gold enhanced sandwich assays. Biosens. Bioelectron. 2005, 21, 483–490. [Google Scholar] [CrossRef]
- Zhang, S.; Garcia-D’Angeli, A.; Brennan, J.P.; Huo, Q. Predicting detection limits of enzyme-linked immunosorbent assay (ELISA) and bioanalytical techniques in general. Analyst 2014, 139, 439–445. [Google Scholar] [CrossRef] [PubMed]
- Langs-Barlow, A.; Selvaraj, S.; Ogbuagu, O.; Shabanova, V.; Shapiro, E.D.; Paintsil, E. Association of circulating cytochrome c with clinical manifestations of antiretroviral-induced toxicity. Mitochondrion 2015, 20, 71–74. [Google Scholar] [CrossRef] [PubMed] [Green Version]


| FPI Type | Q | DL of RI | Target Analyte | Type of Sample | LOD | Ref. |
|---|---|---|---|---|---|---|
| FPI | - | 10−5 RIU | - | KCl/NaCl solution | - | [37] |
| FPI | - | - | Biotin-BSA | DI water | 2.82 pM | [41] |
| μFPI | 128.4 | 593 nm/RIU | BSA | DI water | 1 pM | [43] |
| Nanopore FPI | - | - | Aβ42, T-tau | Diluent/CSF | 7.8 pg/mL, 15.6 pg/mL | [45] |
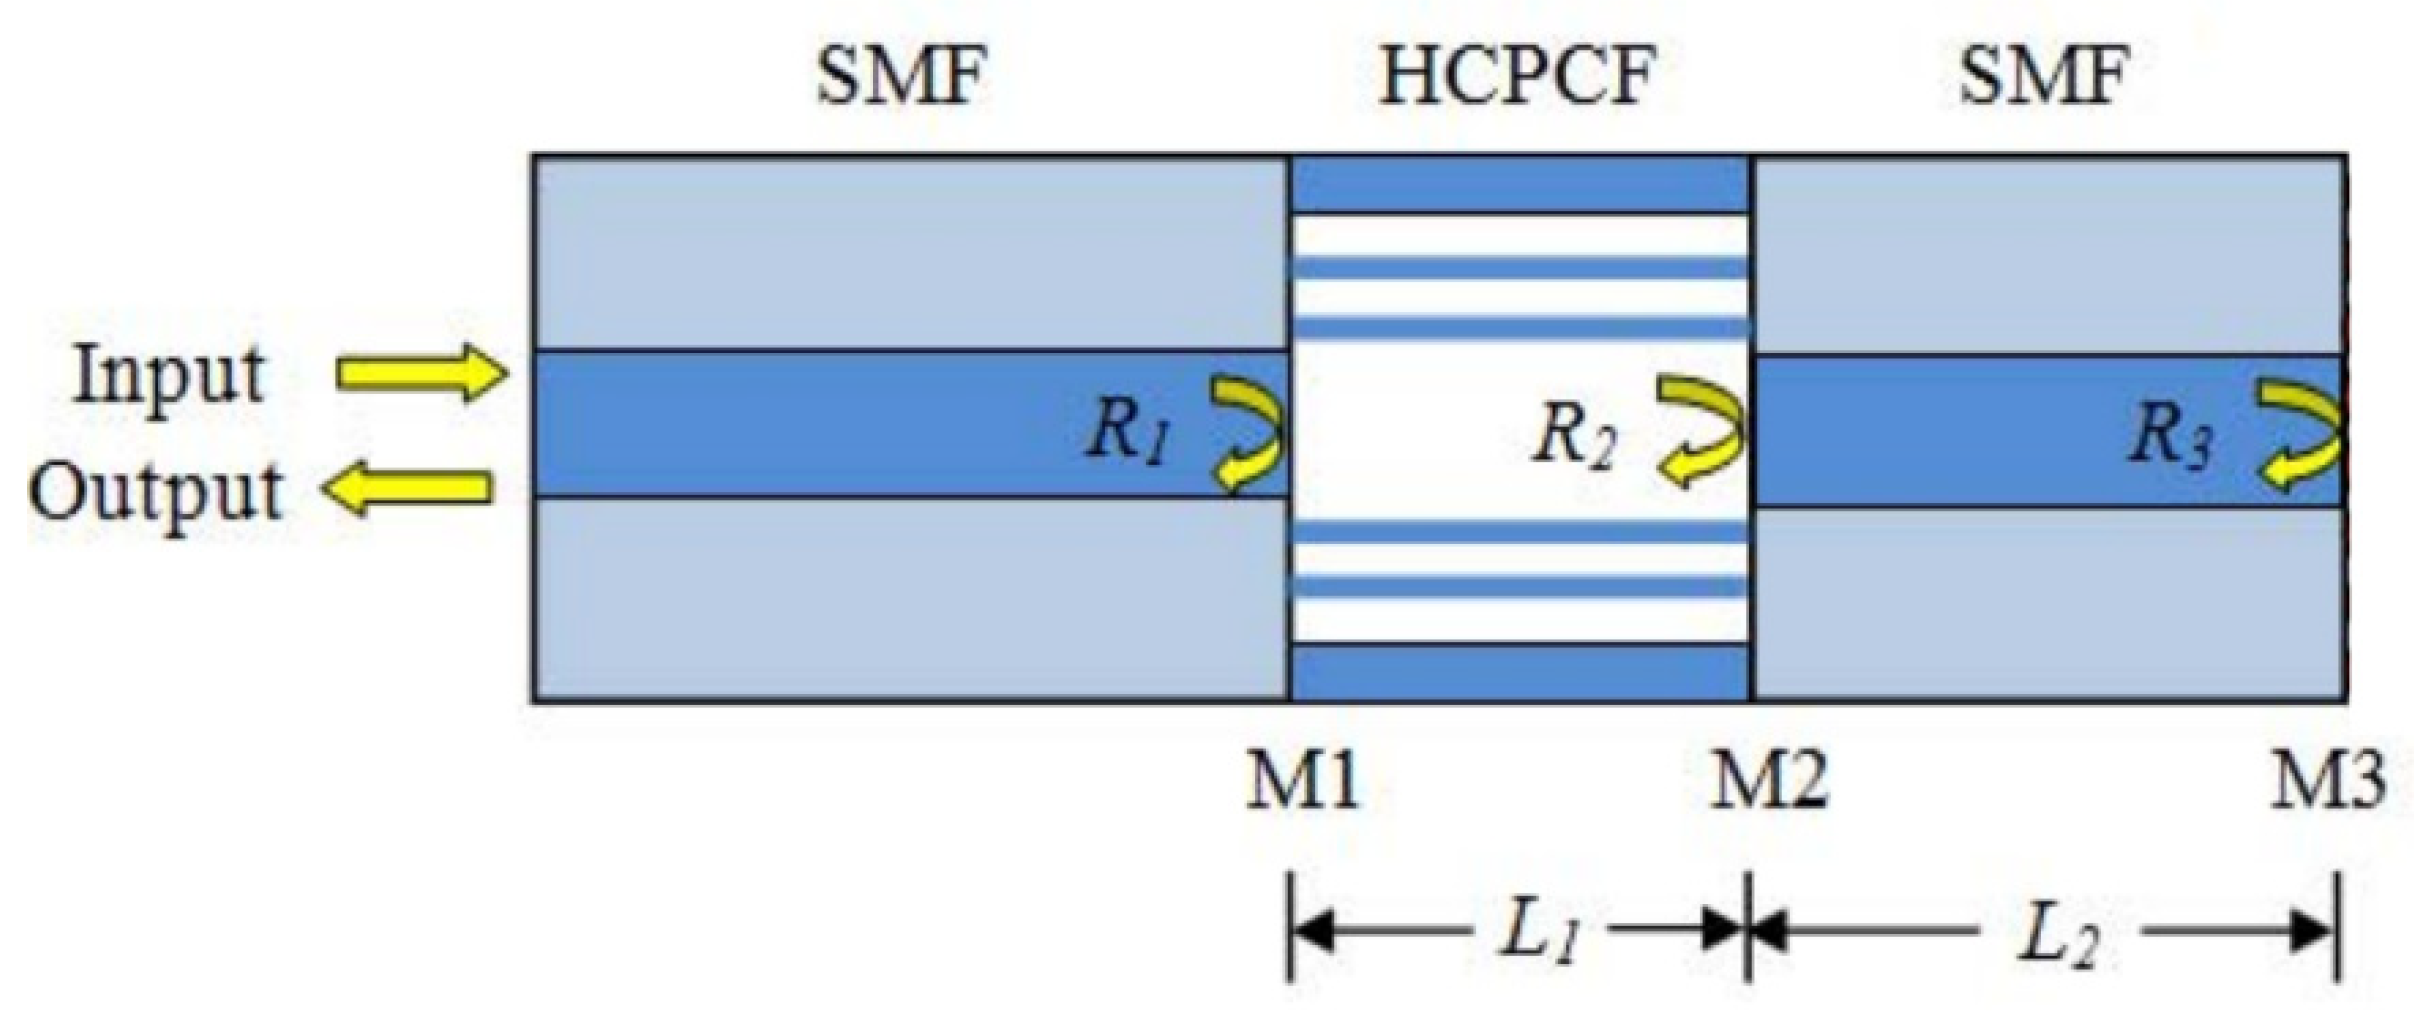
| Cascaded FPI | - | 8.4 × 10⁻⁷ RIU (23,794.6 nm/RIU) | Streptomycin-BSA | PBS | 1 ng/mL | [52] |
| FPI-DBR (SiO2/Ta2O5) | 875 | 2 × 10⁻⁹ RIU | - | DI water | - | [36] |
| FPI-Surface Stress sensor | - | - | BSA | PBS | 10 ng/mL | [40] |
| FPI with SCI | - | - | Anti-TG, Anti-TPO | Blood serum | 1.7 IU/mL, 6 IU/mL | [53] |
| PSM | 75 | - | Bacteria | Double distilled water | 20 bacteria/mL | [58] |
| PSM | 59.8 | - | 19-base DNA | PBS | 43.9 nM | [55] |
| PSM | - | 5 × 10⁻⁴ RIU | 8-base DNA | PBS | 87 nM | [57] |
| PSM | - | - | Hydatid antigen | PBS | 0.16 ng/mL | [61] |
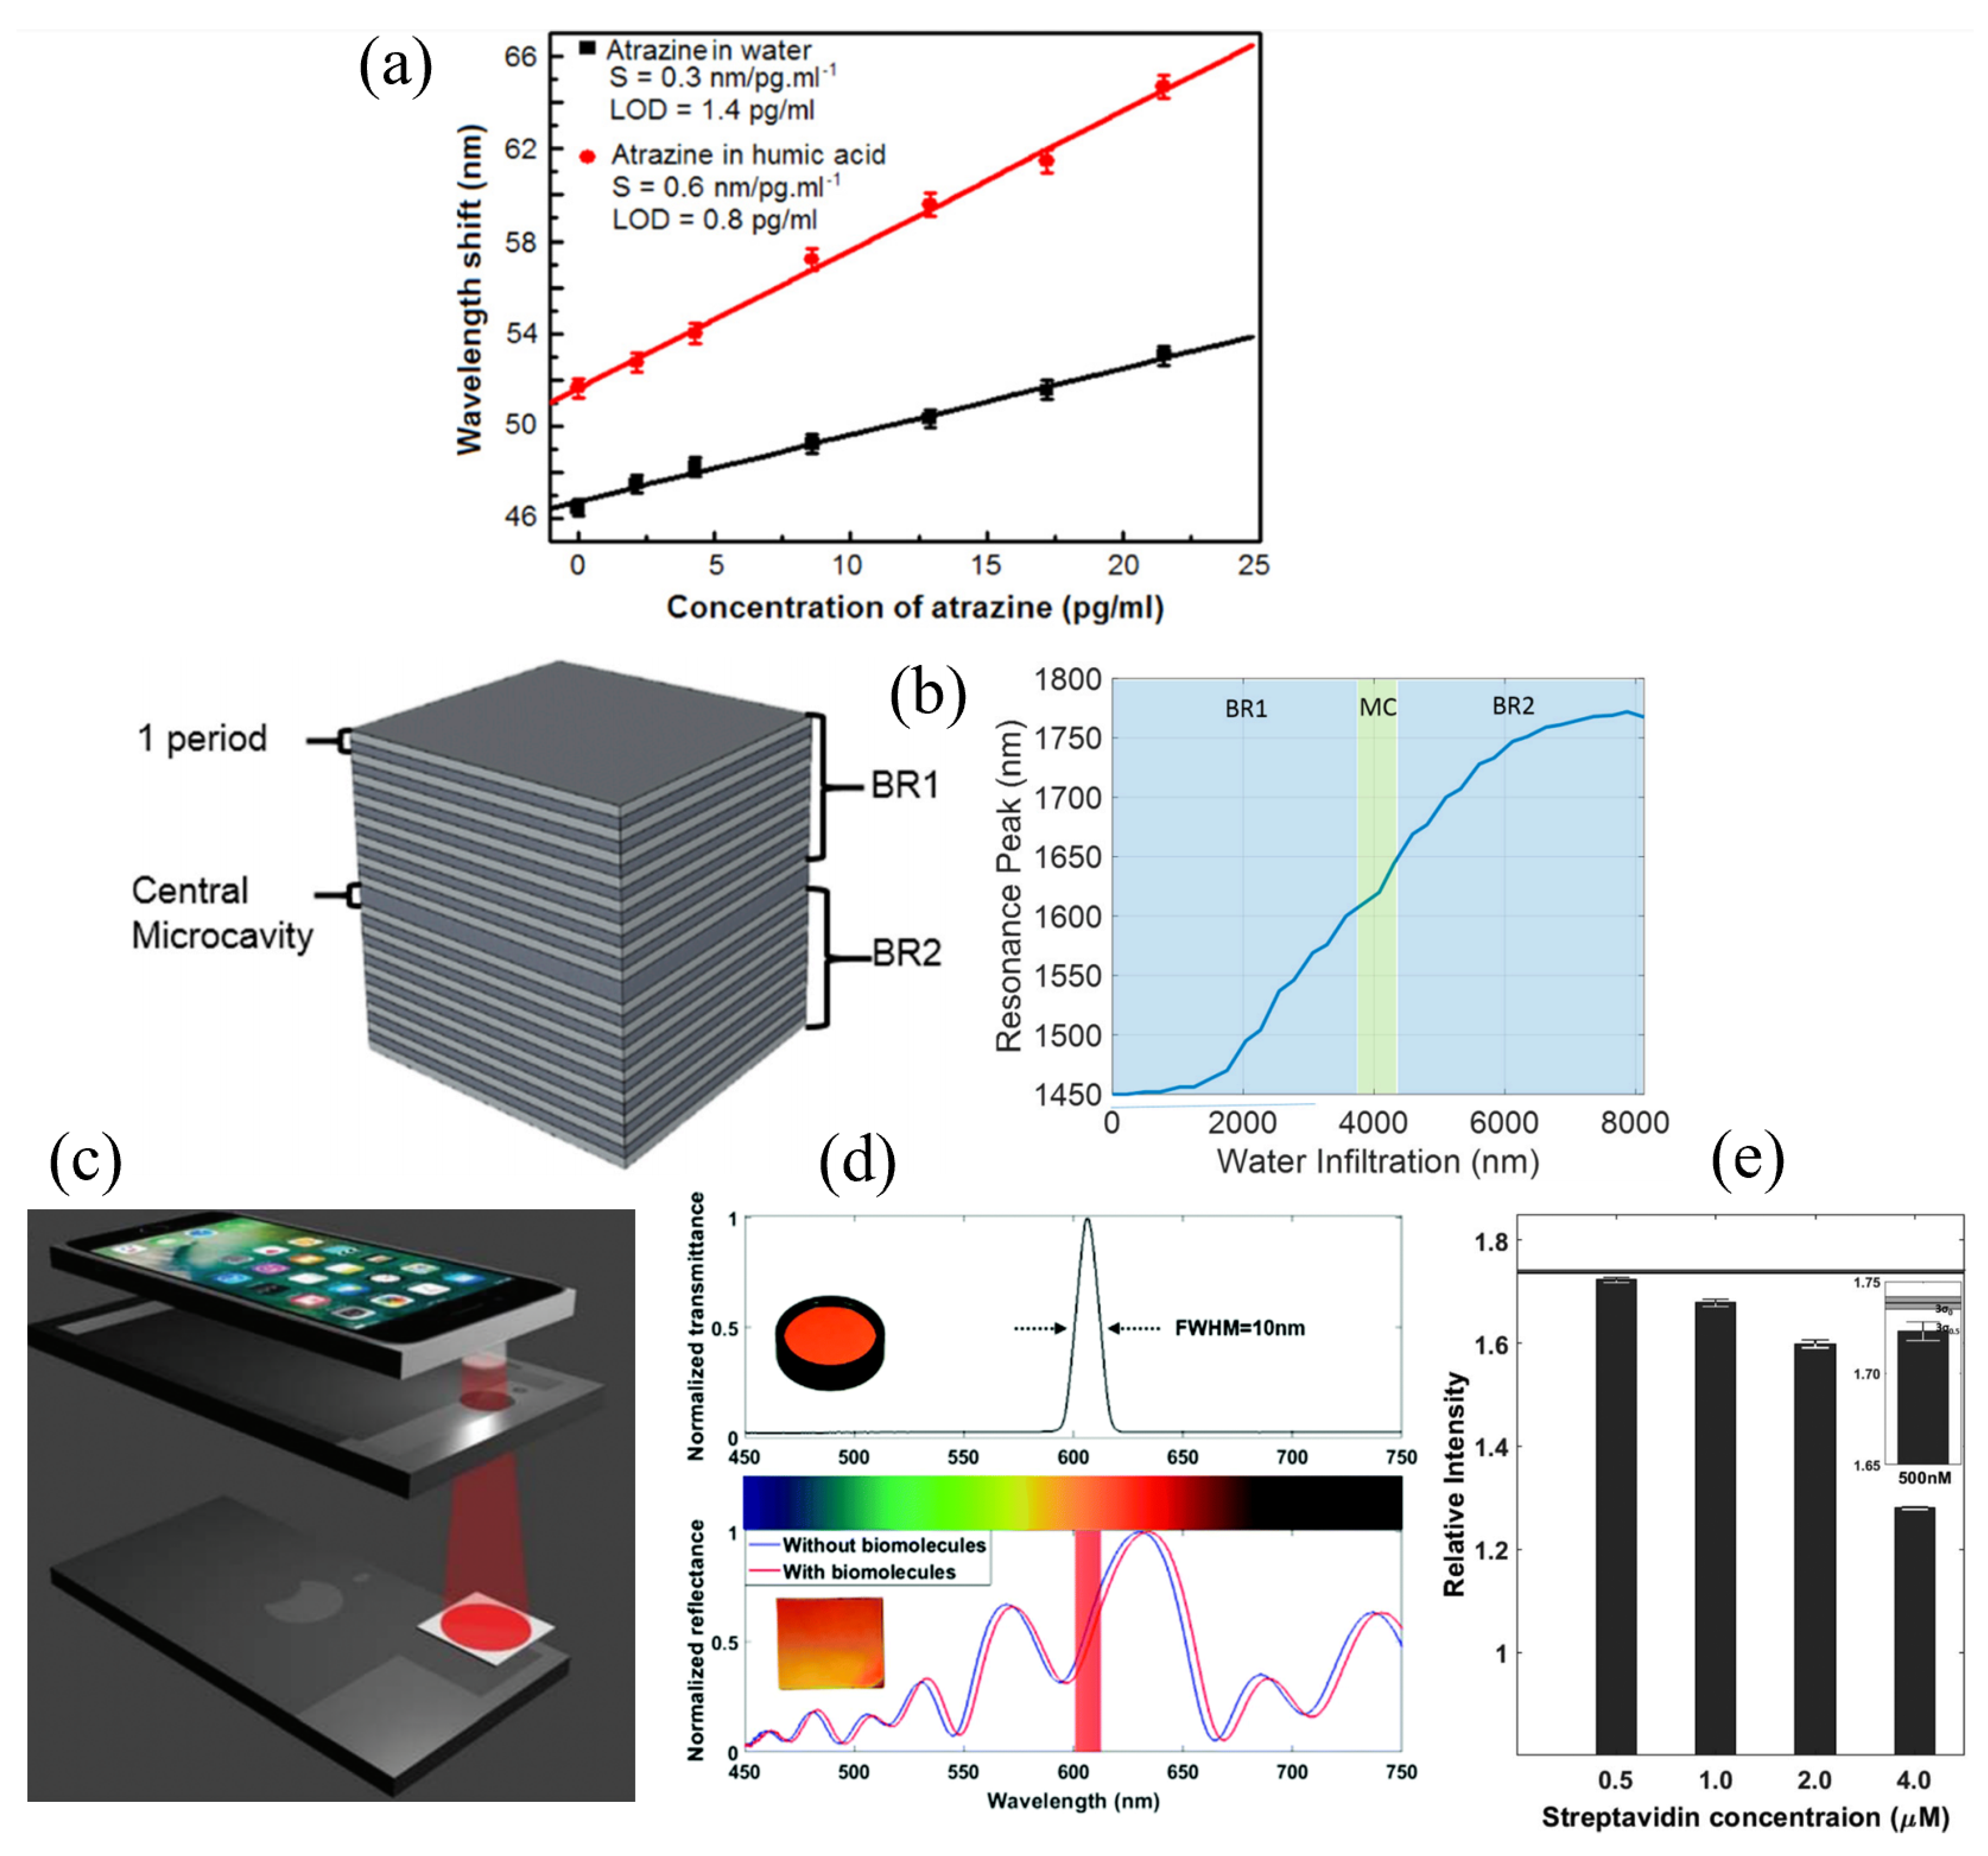
| PSM | - | 10−3 RIU (200 nm/RIU) | Atrazine pesticide | Water, humic acid | 1.4 pg/mL, 0.8 pg/mL | [59] |
| PSM | - | 10−7 RIU (1000 nm/RIU) | - | Water | - | [56] |
| PSM | - | 350 nm/RIU | Streptavidin | DI water | 500 nM | [60] |
| Fiber | - | 7 × 10⁻⁵ RIU | Rabbit IgG | PBS | 100 ng/mL | [69] |
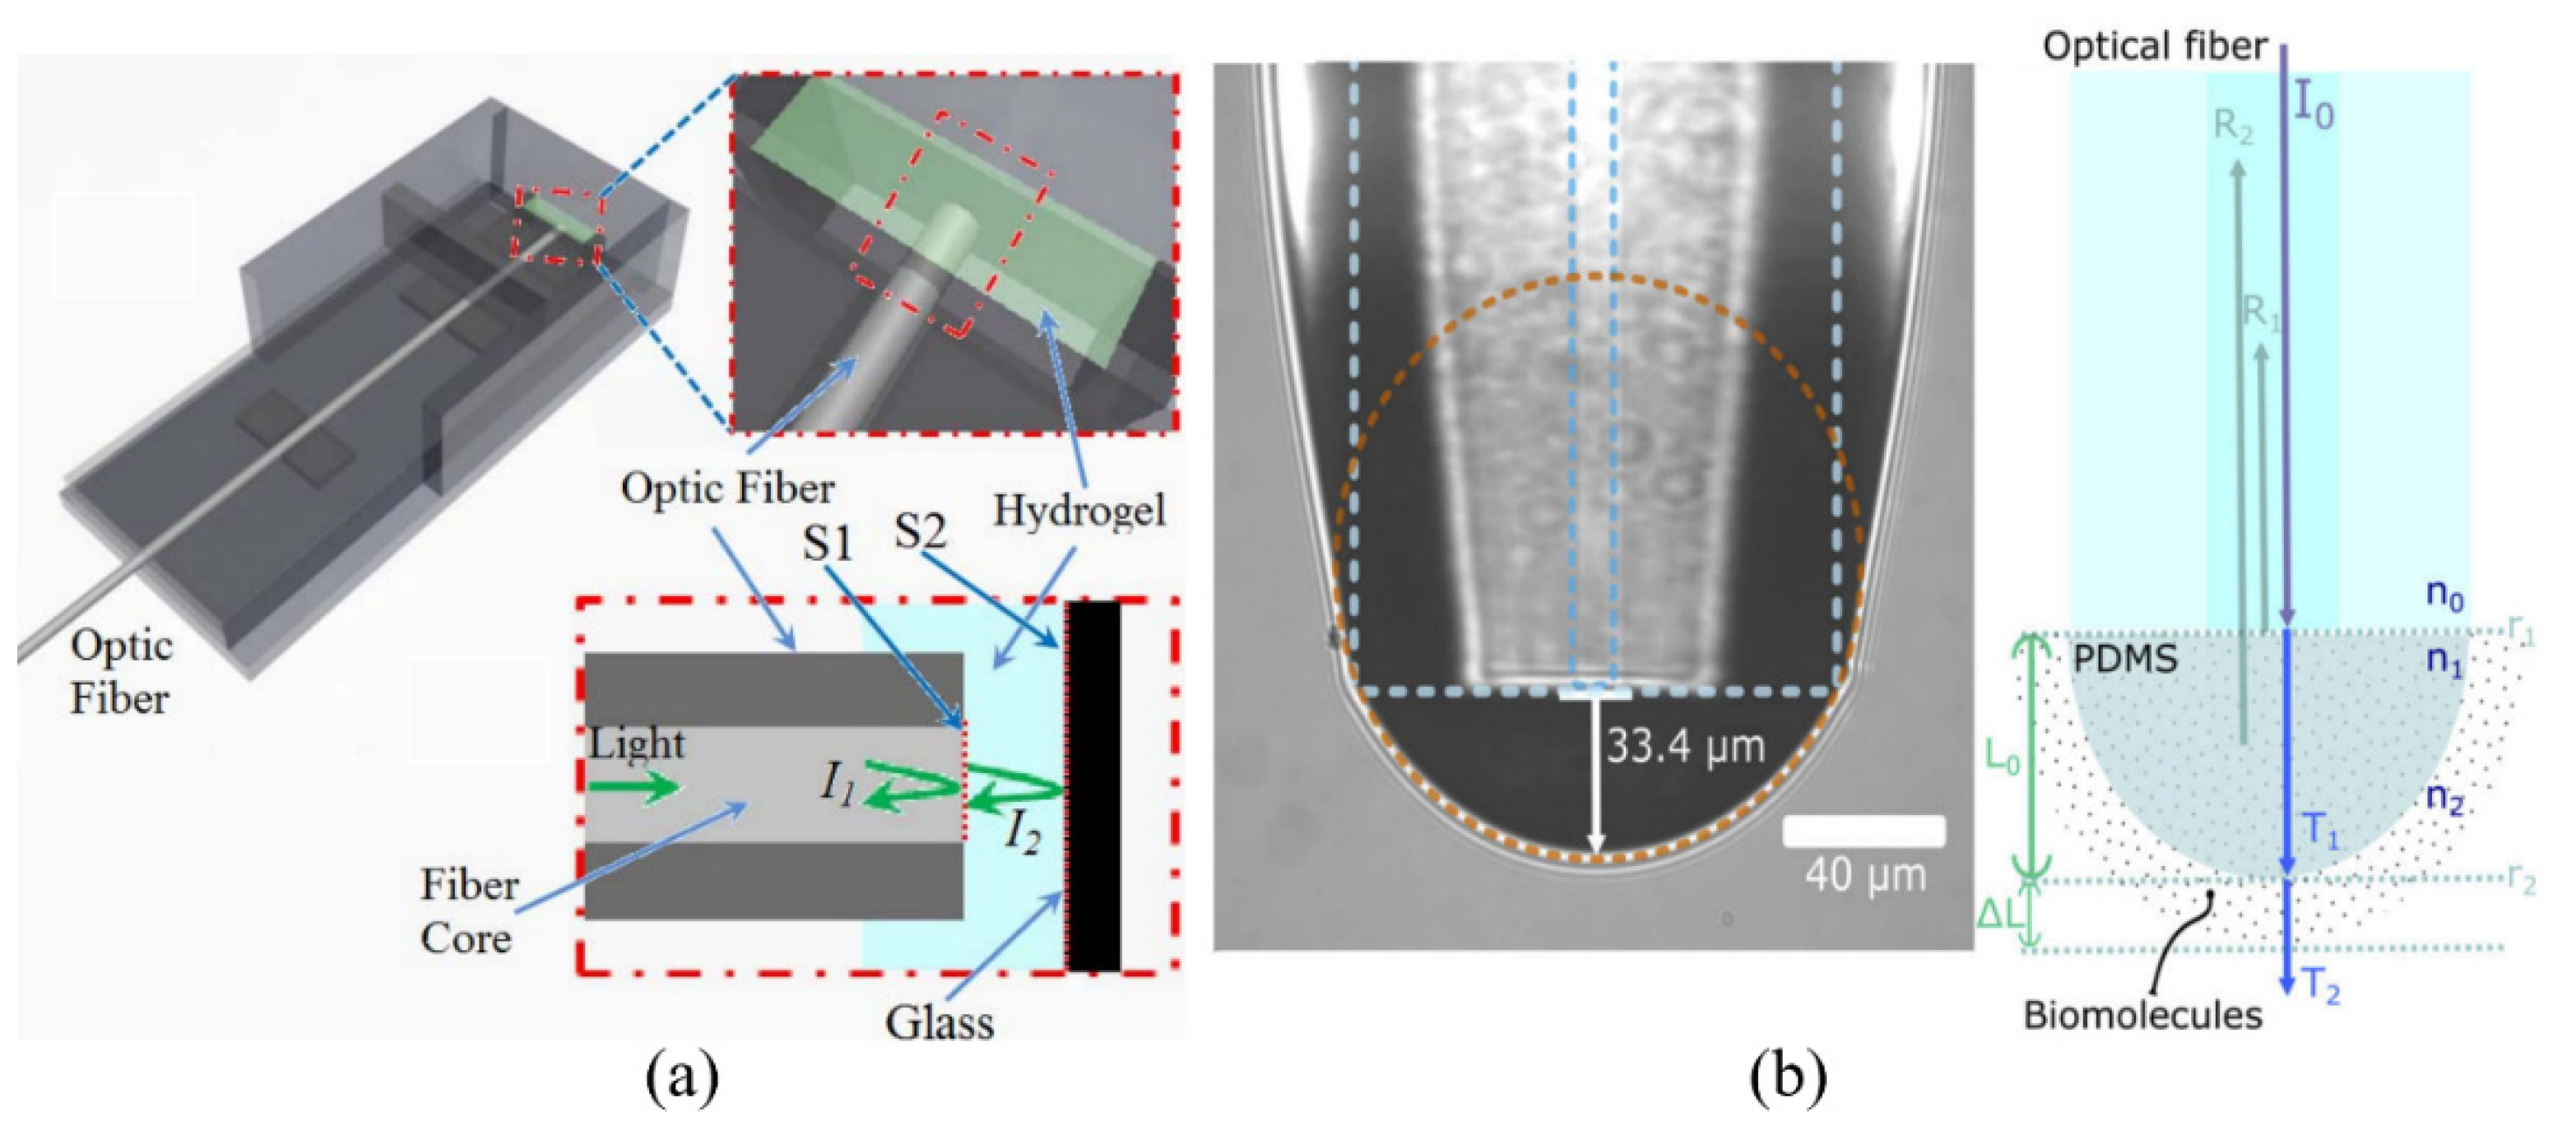
| Fiber-Hydrogel | - | - | DTT | DI water | 50 μM | [71] |
| Fiber-PDMS | - | - | Serum antibody | PBS | - | [72] |
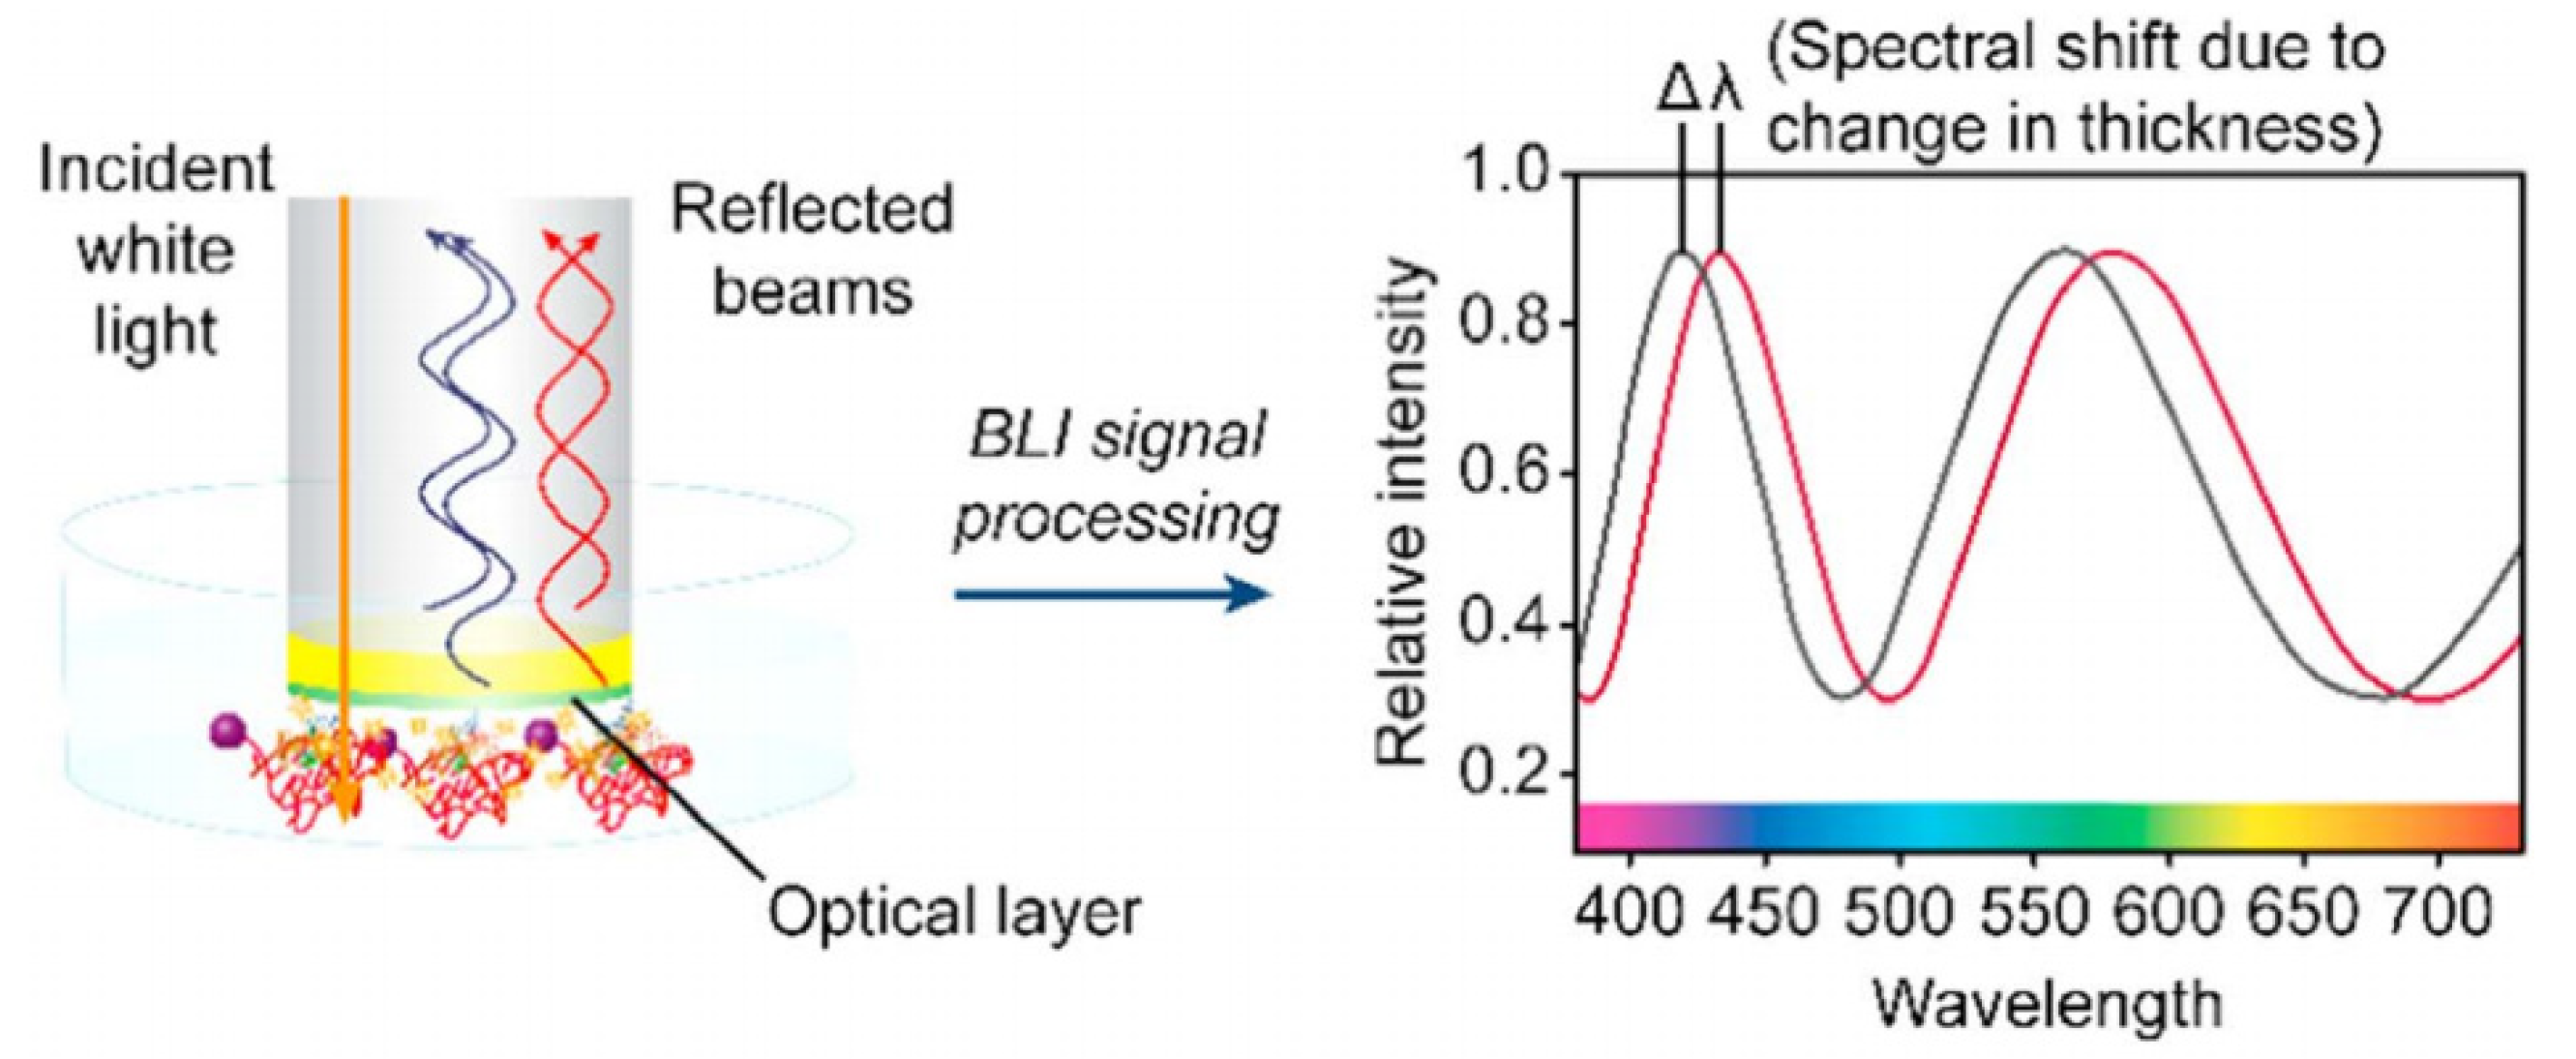
| BLI (Blitz) * | - | - | Tau441 protein | MES/FBS | 6.7 nM | [80] |
| BLI (Octet) * | - | - | GTX1/4 Aptamer, STX Aptamer | Water | 50 pg/mL, 0.5 ng/mL | [91,92] |
| BLI (Octet) * | - | - | Testosterone | PBS | 2.13 ng/mL | [93] |
| Needle-type BLI | - | - | Glucose | Human serum | 45 mg/dL | [96] |
| Type of Assay | Target Analyte | Type of Sample | LOD | Ref. |
|---|---|---|---|---|
| ELISA | Ab42 | Plasma | 0.3 pg/mL | [97] |
| Luminex xMap | Ab42, T-tau | CSF | 60 pg/mL, 25 pg/mL | [98] |
| ELISA | Streptomycin-BSA | Swine urine | 1.9 ng/mL | [99] |
| ELISA | BSA | PBS | 0.38 ng/mL | [100] |
| ELISA | Anti-TG, Anti-TPO | Blood serum | 25 IU/mL, 8 IU/mL | [53] |
| SPR | Atrazine | Water | 20 pg/mL | [101] |
| ELISA | Rabbit IgG | Serum | 3.4 ng/mL | [102] |
Publisher’s Note: MDPI stays neutral with regard to jurisdictional claims in published maps and institutional affiliations. |
© 2020 by the authors. Licensee MDPI, Basel, Switzerland. This article is an open access article distributed under the terms and conditions of the Creative Commons Attribution (CC BY) license (http://creativecommons.org/licenses/by/4.0/).
Share and Cite
Rho, D.; Breaux, C.; Kim, S. Label-Free Optical Resonator-Based Biosensors. Sensors 2020, 20, 5901. https://doi.org/10.3390/s20205901
Rho D, Breaux C, Kim S. Label-Free Optical Resonator-Based Biosensors. Sensors. 2020; 20(20):5901. https://doi.org/10.3390/s20205901
Chicago/Turabian StyleRho, Donggee, Caitlyn Breaux, and Seunghyun Kim. 2020. "Label-Free Optical Resonator-Based Biosensors" Sensors 20, no. 20: 5901. https://doi.org/10.3390/s20205901
APA StyleRho, D., Breaux, C., & Kim, S. (2020). Label-Free Optical Resonator-Based Biosensors. Sensors, 20(20), 5901. https://doi.org/10.3390/s20205901