Article

Palladium-Doped Tin Oxide Nanosensor for the Detection of the Air Pollutant Carbon Monoxide Gas

Department of Electronics and Instrumentation, SRM Institute of Science and Technology, Kattankulathur 603203, Tamil Nadu, India
*
Author to whom correspondence should be addressed.
Sensors 2020, 20(20), 5889; https://doi.org/10.3390/s20205889
Submission received: 10 August 2020 / Revised: 30 September 2020 / Accepted: 14 October 2020 / Published: 17 October 2020

Abstract

:
The exhaust gases from various sources cause air pollution, which is a leading contributor to the global disease burden. Hence, it has become vital to monitor and control the increasing pollutants coming out of the various sources into the environment. This paper has designed and developed a sensor material to determine the amount of carbon monoxide (CO), which is one of the major primary air pollutants produced by human activity. Nanoparticle-based sensors have several benefits in sensitivity and specificity over sensors made from traditional materials. In this study, tin oxide (SnO2), which has greater sensitivity to the target gas, is selected as the sensing material which selectively senses only CO. Tin oxide nanoparticles have been synthesized from stannous chloride dihydrate chemical compound by chemical precipitation method. Palladium, at the concentration of 0.1%, 0.2%, and 0.3% by weight, was added to tin oxide and the results were compared. Synthesized samples were characterized by X-ray diffraction (XRD) and field emission scanning electron microscope (FESEM) techniques. XRD revealed the tetragonal structure of the SnO2 nanoparticles and FESEM analysis showed the size of the nanoparticles to be about 7–20 nm. Further, the real-time sensor testing was performed and the results proved that the tin oxide sensor, doped with 0.2% palladium, senses the CO gas more efficiently with greater sensitivity.

1. Introduction

Air pollution has become the fifth leading risk factor worldwide for mortality [1]. No one is safe from air pollution because the waste from many processes, technically termed as air pollutants, are dumped directly into the environment, which exhibits a direct impact on the environment and thereby endangering the natural ecosystem. The most abundant sources of air pollutants are gases, among which those of primary concern are oxides of carbon (CO2 and CO), SO2, and NOx [2].
Carbon monoxide, an invisible air pollutant, is odorless, tasteless, and non-irritant, but is very toxic and can lead to damage of heart and the central nervous system, becoming lethal at times. Because of insufficient oxygen that leads to incomplete combustion in the operation of vehicles, heating, coal power generation, and biomass burning, CO is produced as a toxic gas [3]. In many countries, the most common type of fatal air poisoning is CO poisoning [4]. When the source of the toxic gas is at the surface of the earth and if it has residence time in the order of several days, this trace gas becomes a basic pollutant, like in the case of CO [5]. Owing to meteorological conditions and emission patterns, the emission of CO showed a seasonal, weekly, and diurnal cycle [6]. Myronuk (1977) [7], had reported long back that the exposure of humans to high concentrations of carbon monoxide can result in headache or nausea, the control of which when failed, leads to setting a strain on heart and lungs. Further studies have confirmed that breathing high concentrations of CO reduces the blood’s ability to carry oxygen by hemoglobin and also causes other health issues like headaches, nausea, vomiting, hypotension, weakness, inflammation of existing diseases, depression and hearing problems [8]. Even at low levels (~9 ppm for 8 h of respiration), CO is toxic to human beings and all life forms. Hence there is a significant need to measure CO levels by using a sensor that can be specific to CO gas even in the parts-per-million range.
In the design of a CO gas sensor, selection of an appropriate sensing material stays as the first and foremost step, which needs to address the type of sensor, the nature of target gas, and the concentration of the detective gas. Literature reviews show that the sensitivity, selectivity, and response speed of the gas-sensing properties are higher in the gas sensors based on nanomaterials [9]. Nanomaterials are well-known to possess excellent electrical, optical, thermal, catalytic properties, and strong mechanical strength, which offer great opportunities to construct nanomaterials-based sensors or devices for monitoring environmental contaminations in air, water, and soil [10]. These sensors have many advantages like small size and optical band gap, as well as increased surface area [11] and fast response [12], when compared to traditional sensors.
The advantage of metal oxide gas sensors, over other sensors, are their low cost, quick production, firm size, and easy measuring electronics, because of which they find their use in portable gas detection systems [13]. Furthermore, when metal oxide semiconductors are compared, tin oxide (SnO2) is a widely studied metal oxide semiconductor which shows greater sensitivity to the target gases [14] and is used to detect many gases in practical application. A comparison of gas-sensing properties among four different metal oxide thin films, namely, tungsten dioxide (WO2), tungsten trioxide (WO3), tin oxide (SnO2), and tin-doped tungsten trioxide (Sn-doped WO3), shows SnO2 to be the best thin film for sensing acetone gas [15]. Tin oxide is a good sensing material to find out the concentration of CO even at a high temperature [16] and therefore, in this study, SnO2 is selected as the sensing material.
In order to enhance the gas-sensing properties, SnO2 nanomaterials with different morphologies and spatial assemblies have been fabricated and reported [17]. Noble metals are effective oxidation catalysts and this property makes them useful to enhance the reactions on gas sensor surfaces. Doping noble metals with metal oxide nanocomposite structures enhances the sensitivity as well as the stability of the sensors and lowers the working temperature [18]. This clearly indicates that doping of noble metals like Au, Ni, Co, Cu, Pt, Pd, etc., enables to increase the sensitivity of the sensing material. The mesostructured Au-doped SnO2 had highly selective response toward CO [19] and Ni-doped SnO2 nanoparticles-based gas sensor exhibited better gas response than pure SnO2 [20]. When cobalt (Co)-doped multilayer SnO2 was tested toward carbon dioxide, it showed a high response of 41%, whereas undoped SnO2 showed a weak response [21]. On the other hand, when copper (Cu)-doped SnO2 films are used in sensing measurements, Cu-doping was found to improve the response of the tin oxide sensor to CO gas [22]. When SnO2 synthesized by hydrothermal method was doped with PdPt by in situ reduction of metallic salt and measured for its response to gaseous methane, the results demonstrated that the dopants can increase the response of SnO2 sensor toward methane and also improve the stability during continuous cycles [23]. Moreover, the Pd-SnO2 composite nanoporous structure showed prominent methane gas-sensing ability as compared with pure nanoparticles and this sensor also exhibited high repeatability and long-term stability [24]. Earlier it was shown that highly uniform SnO2 nanowires act as sensitive, fast, stable, and reproducible gas sensors, that can be easily integrated into a multi-component array and the gas-sensing can be enhanced when functionalized with palladium catalyst [25].
SnO2 is a semiconductor of the n-type, which has a wide band gap of about 3.6 eV at 300 K, and finds its application in catalysts, sensors, lithium battery electrodes, and electrochemical energy storage [2]. This, when heated in air at high temperature, oxygen gets adsorbed on the particle surface by capturing free electrons, leading to changes in electrical conductivity of SnO2 grains, that forms the working principle of SnO2 as gas sensors. SnO2 nanoparticles show higher sensitivity on gas sensors because of their large surface areas and thus, when the size of the particles is minimized, the performance of the sensors can be made better [26]. The sensitivity of SnO2, formed by the method of solid-state reaction, toward CO gas is maximal when worked at a temperature of 275–300 °C [27], though the working temperature range of SnO2-based gas sensor is from 25 °C to 500 °C. At low temperature, SnO2 also senses few more gases like CO2, HC, and NOx. Hence it is necessary to increase its selectivity even at low temperature. Palladium (Pd) has very good activity and outstanding sensitivity toward carbon monoxide at very low temperature [28].
With these background literatures, in this study, we have identified a sensing material SnO2 doped with palladium, which is capable of sensing CO gas among various other gases. The sensing material was then examined by X-ray diffraction for the structure of the particles and field emission scanning electron microscopy techniques for the structure morphology. In the development of Pd-doped SnO2-based hydrogen sensors, the best performances were observed for 0.5% Pd [29]. It has been identified very much earlier that the response of SnO2-based sensors lies in the range of 0.1–0.6% for noble metals [30]. In our study, the pollutant to be detected is carbon monoxide, which is heavier than hydrogen. When the response of the composite graphene-SnO2 is studied with 0.1%, 0.5%, and 1% Pd, 0.1% Pd-doped composite showed the highest response and was found to be the optimum Pd-doping concentration [31]. So, we designed this study to be performed with three concentrations of Pd ≥ 0.1%, viz., 0.1%, 0.2%, and 0.3%, along with stannous chloride dehydrate compound, and are taken as three different samples. The real-time testing of the sensor was also performed to verify its sensitivity and reliability.

2. Experimental Methods

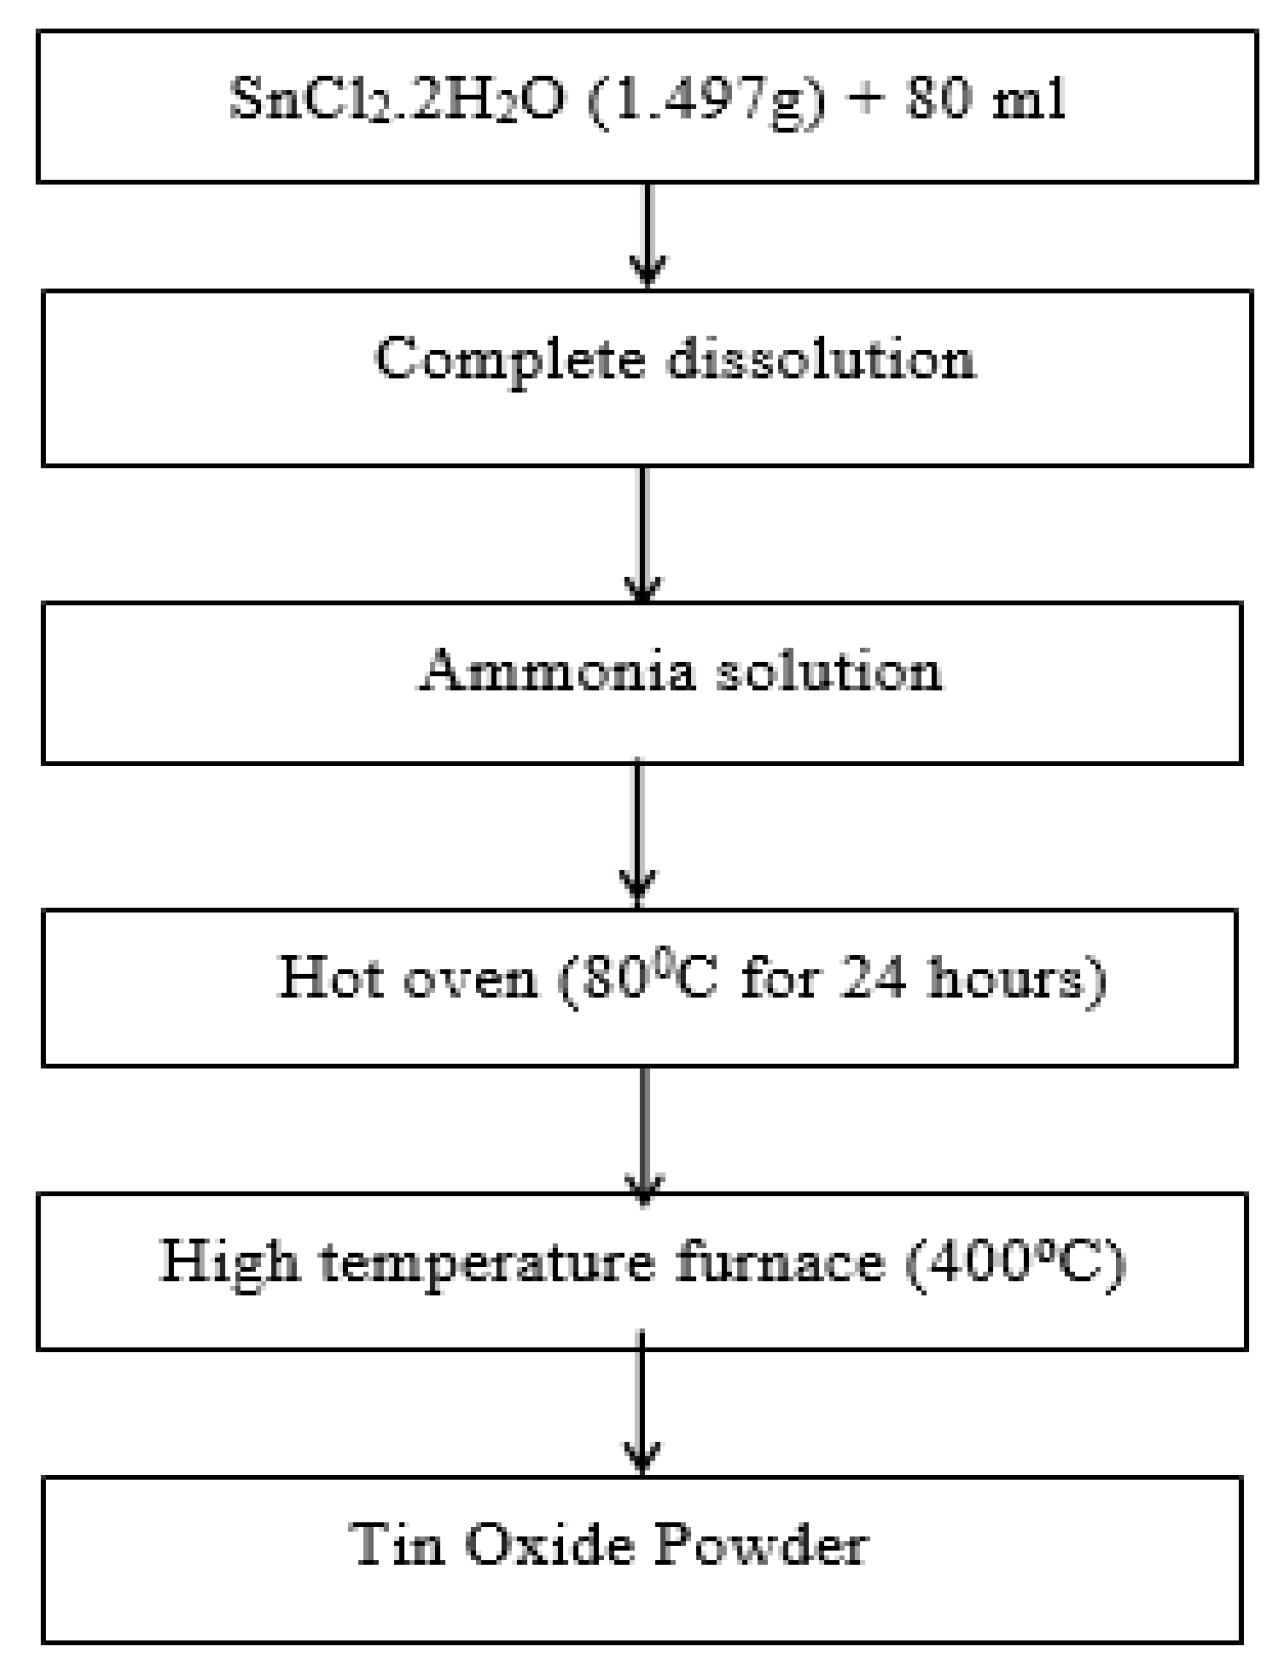
2.1. Synthesis of SnO2

SnO2 nanoparticles were synthesized by simple chemical precipitation synthesis using SnCl2.2H2O as an inorganic precursor. Stannous chloride dehydrate (SnCl2.2H2O) was dissolved in 80 mL distilled water in a beaker with continuous stirring. After complete dissolution, ammonia was added drop wise into the solution as a reagent to control the pH, when pure dense tin oxide is obtained [32]. The synthesis of SnO2 powder is shown as a flow chart in Figure 1.
The solution was stirred to homogeneity and the mixture was kept aside until the formation of gel substances. Once gel substances were formed, the excess water was filtered and the resulting gel was kept in hot oven at 80 °C for 24 h to remove water molecules from the gel. The dried samples were furnaced at 400 °C for 2 h [33]. To increase the sensitivity toward carbon monoxide, palladium was added with stannous chloride dehydrate. To investigate the sensitivity of the sample with different palladium concentrations, the same procedure was repeated by adding 0.1%, 0.2%, and 0.3% by weight of palladium to stannous chloride dehydrate in three different beakers. The crystalline powder obtained from all the four samples synthesized by chemical precipitation method, was carefully stored for further analysis.

2.2. X-ray Diffraction

X-ray diffraction method is the classic technique used to determine the crystal structure of any unknown material and hence, tin oxide crystalline powder synthesized by chemical precipitation method was characterized by X-ray diffraction (XRD; PANalytical, The Netherlands) having generator settings of 40 mA, 45 kV, and CuKα radiation with a wavelength λ =1.541 Å at 2θ values within 20° and 80°. X-ray detector rotates at an angle of 2θ and the data are collected at this angle, for typical powder patterns. The Bragg’s law conditions are contented by various d-spacings in crystalline materials, when the angle θ is varied. The angular degree and intensity are plotted in counts of the obtained diffraction peaks that produced a pattern which is distinctive of the sample. All the four samples synthesized are delicately ground, blended, and the mean particle size is determined. In the X-ray scan, the angles are fixed from 10° to 90° [34].
If the wavelength of X-ray is represented by λ, the full width at half maximum of the diffraction peak by B, and the Bragg diffraction angle by θ, the crystallite size (D) of the prepared powders can be determined using the Scherrer equation [35]
D = 0.9 λ B cos θ
Molecular mechanics and molecular dynamics simulations were combined with X-ray powder diffraction to investigate the structure [36].

2.3. Field Emission Scanning Electron Microscopy

Field emission scanning electron microscopy is used for investigating topographic information of specimens at extremely high magnifications of 40,000× to 800,000× with practically unlimited field depth. The morphologies of the samples were examined using field emission scanning electron microscopy (FESEM; FEI, Quanta 200, The Netherlands), and images were taken at the same magnification of 80,000×. The working distance was adjusted until a crisp focus was achieved, and this working distance was varied between 10 mm and 11 mm. In order to confirm the chemical composition of the samples, FESEM equipped with energy-dispersive X-ray (EDX) was used [37].

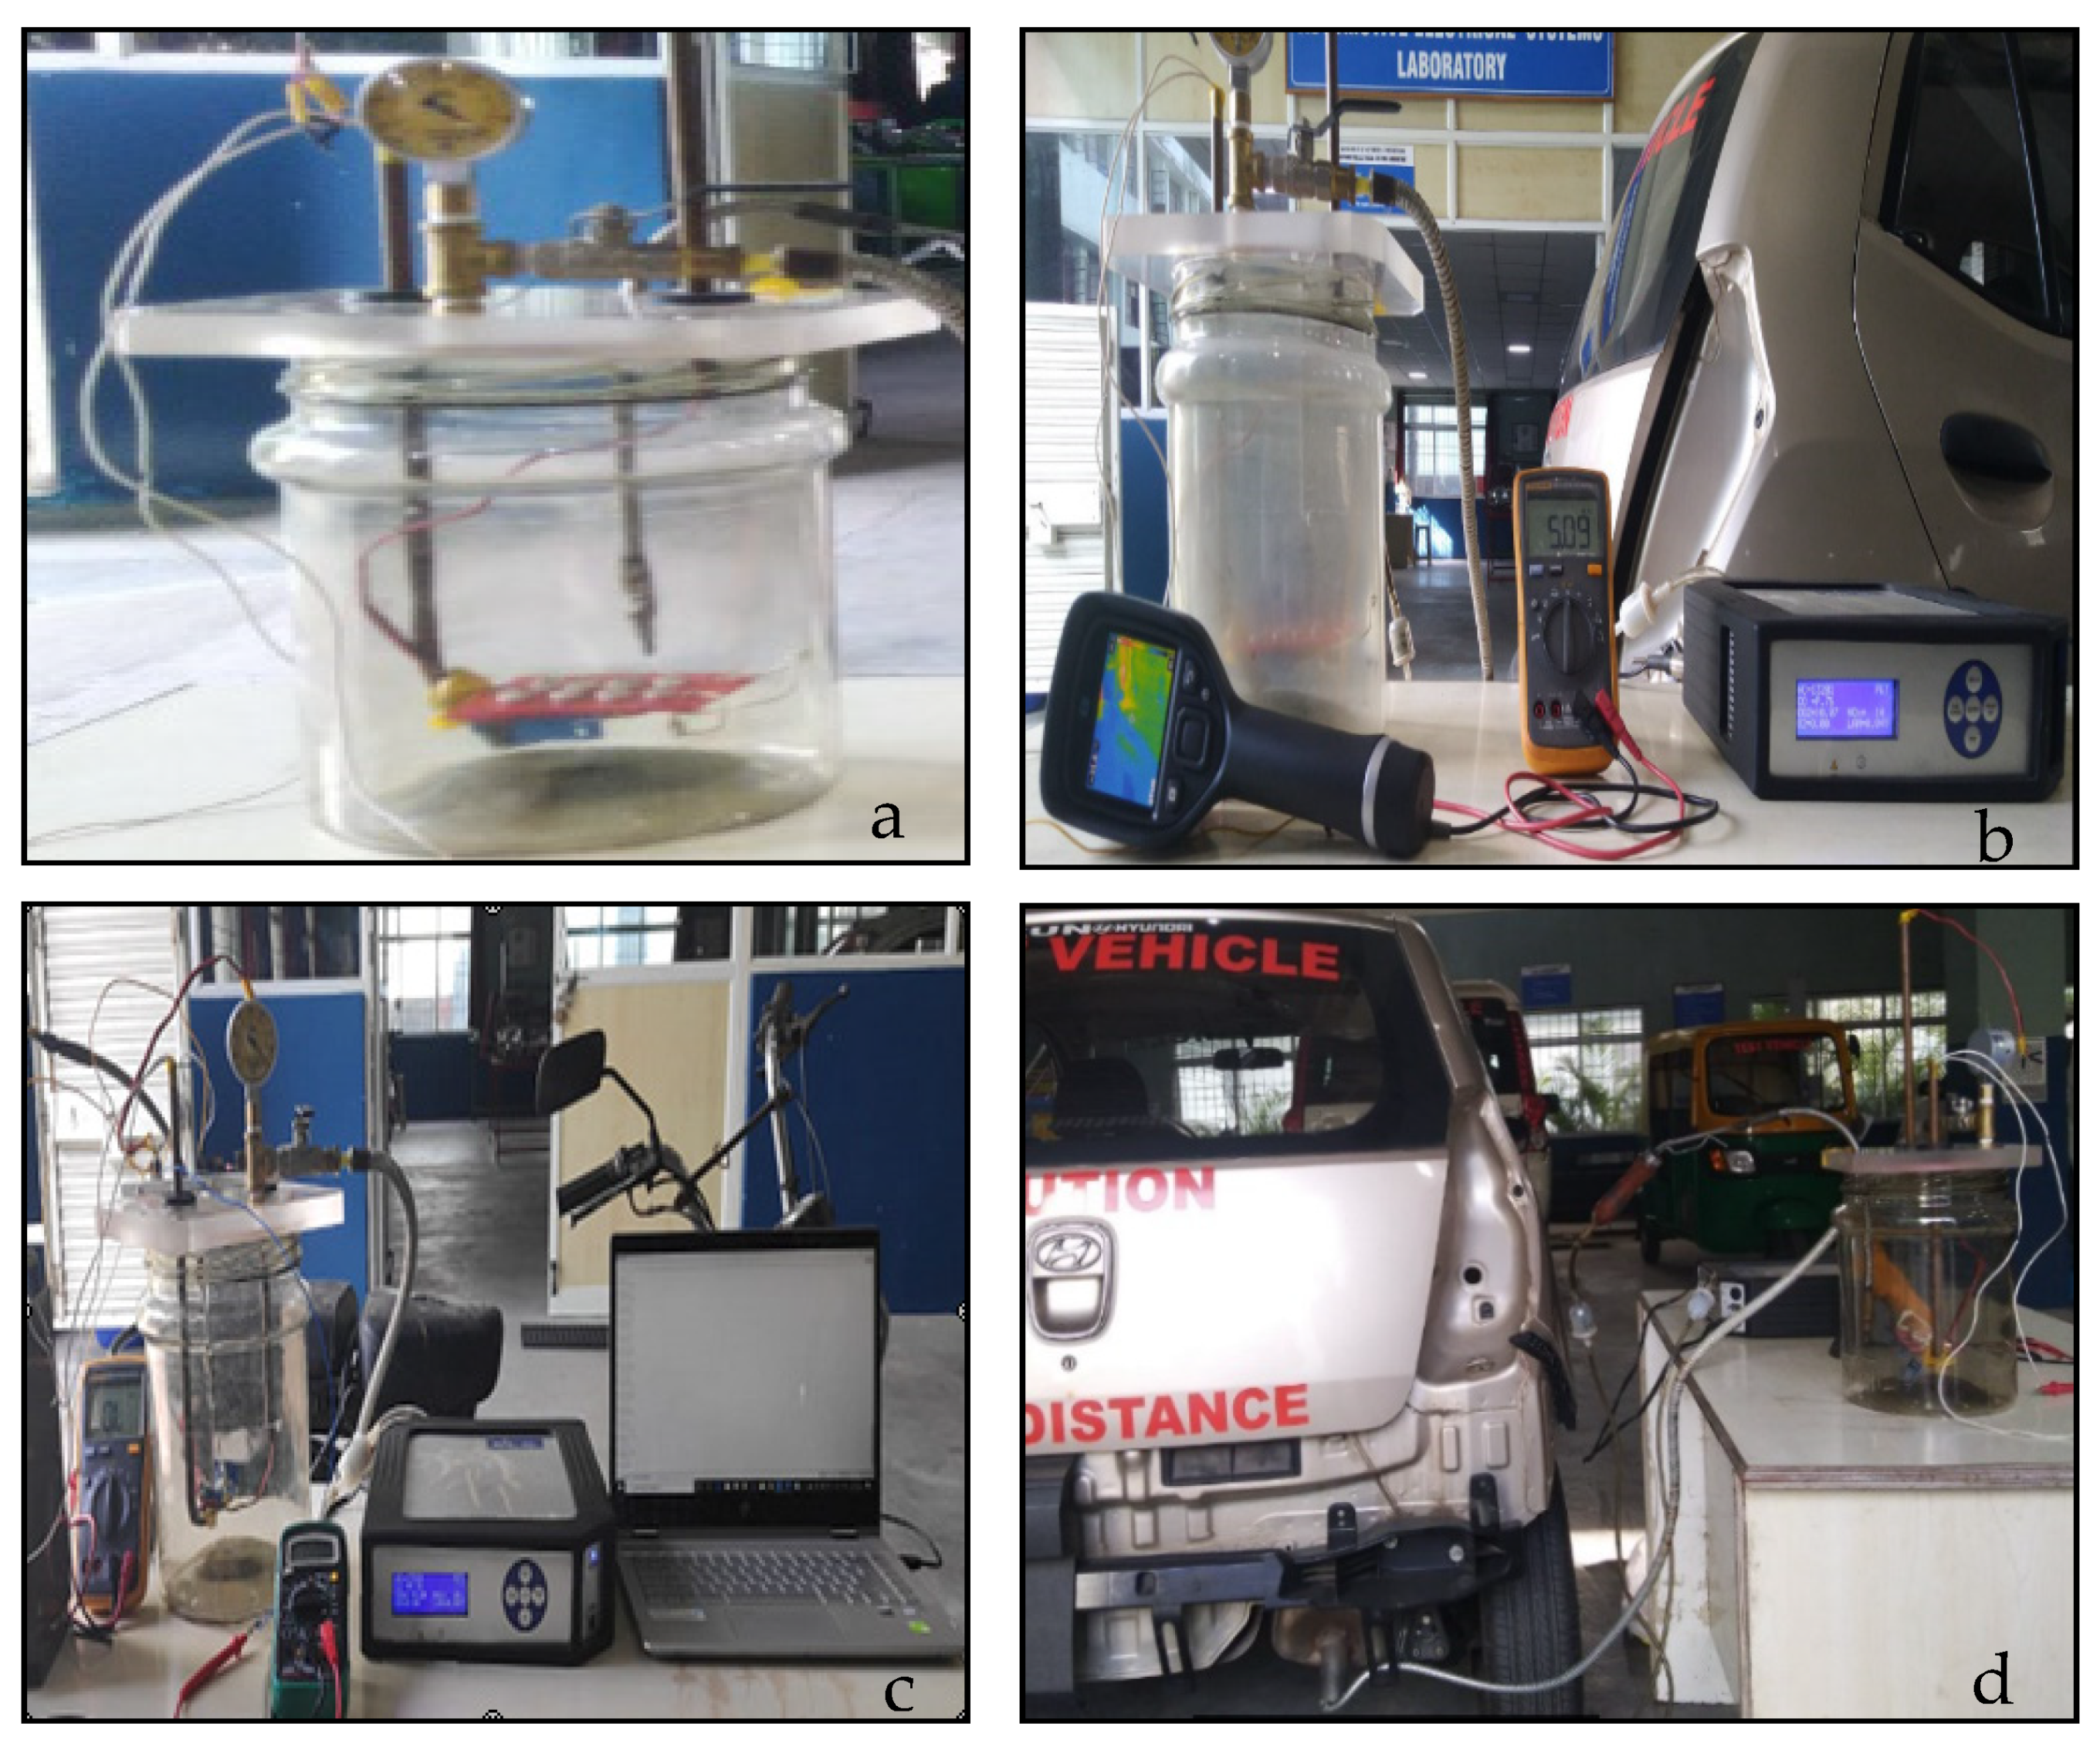
2.4. Real-Time Testing of the Sensor

The contact pads were fixed at 10-mm diameter alumina substrate and the sensing material was coated on it, as depicted in Figure 2. In order to compare the sensitivity, the alumina substrate with the coated sensing material, in three numbers (Figure 2a) and eight numbers (Figure 2b), was connected in series. Mostly, for bonding semiconductor devices, fine gold wires or doped or alloys of gold wires are used [38]. But because of the increased cost of the metal, copper wires coated with lead, was tried and it turned out to be effective for bonding.
To verify and validate the experiment, an exhaust gas analyser (AVL DIGAS 444N) and one commercial carbon monoxide gas sensor (MQ-7) were kept inside the gas chamber, the arrangement of which is shown in Figure 3a. Contact pads on the substrate, connected to lead-coated copper wires, were further connected to the measurement setup using external lead and this entire experimental set-up is shown in Figure 3b. The output of the gas sensors were connected in the analogue input ports of the data acquisition system (MYDAQ, NI USB-6009) and the values were continuously recorded, as shown in Figure 3c. The air inside the chamber was evacuated with the help of vacuum pump and once vacuum was created, the exhaust from petrol engine was connected to the inlet of the chamber, as in Figure 3d.
The engine was maintained at an ideal speed of 1000 rpm. The exhaust gas was permitted to go inside the chamber for 30 min (ON) to check the sensor response and the exhaust was stopped for 30 min by closing the inlet as well as opening the chamber outlet, to check the recovery time of the sensor. The carbon monoxide gas present in the exhaust mixture chemically reacts with SnO2 and the resistance of SnO2 changes. The potential difference of sensor array was recorded as a function of time and then the air was passed inside for 30 min to check the recovery of the sensor. The same experiment was repeated by coating the substrate with the four different sensing materials synthesized, connected in series as 3 sensor array and 8 sensor array, and the responses were recorded respectively.

3. Results and Discussion

The synthesized powder was examined by X-ray diffraction and field emission scanning electron microscopy techniques, the former indicated the structure of the particles and the latter investigated the structure morphology. The real-time sensor testing was then carried out to verify if CO gas could be sensed and the sensing properties were compared, which showed that the tin doped with 0.2% Pd exhibited better sensing ability.

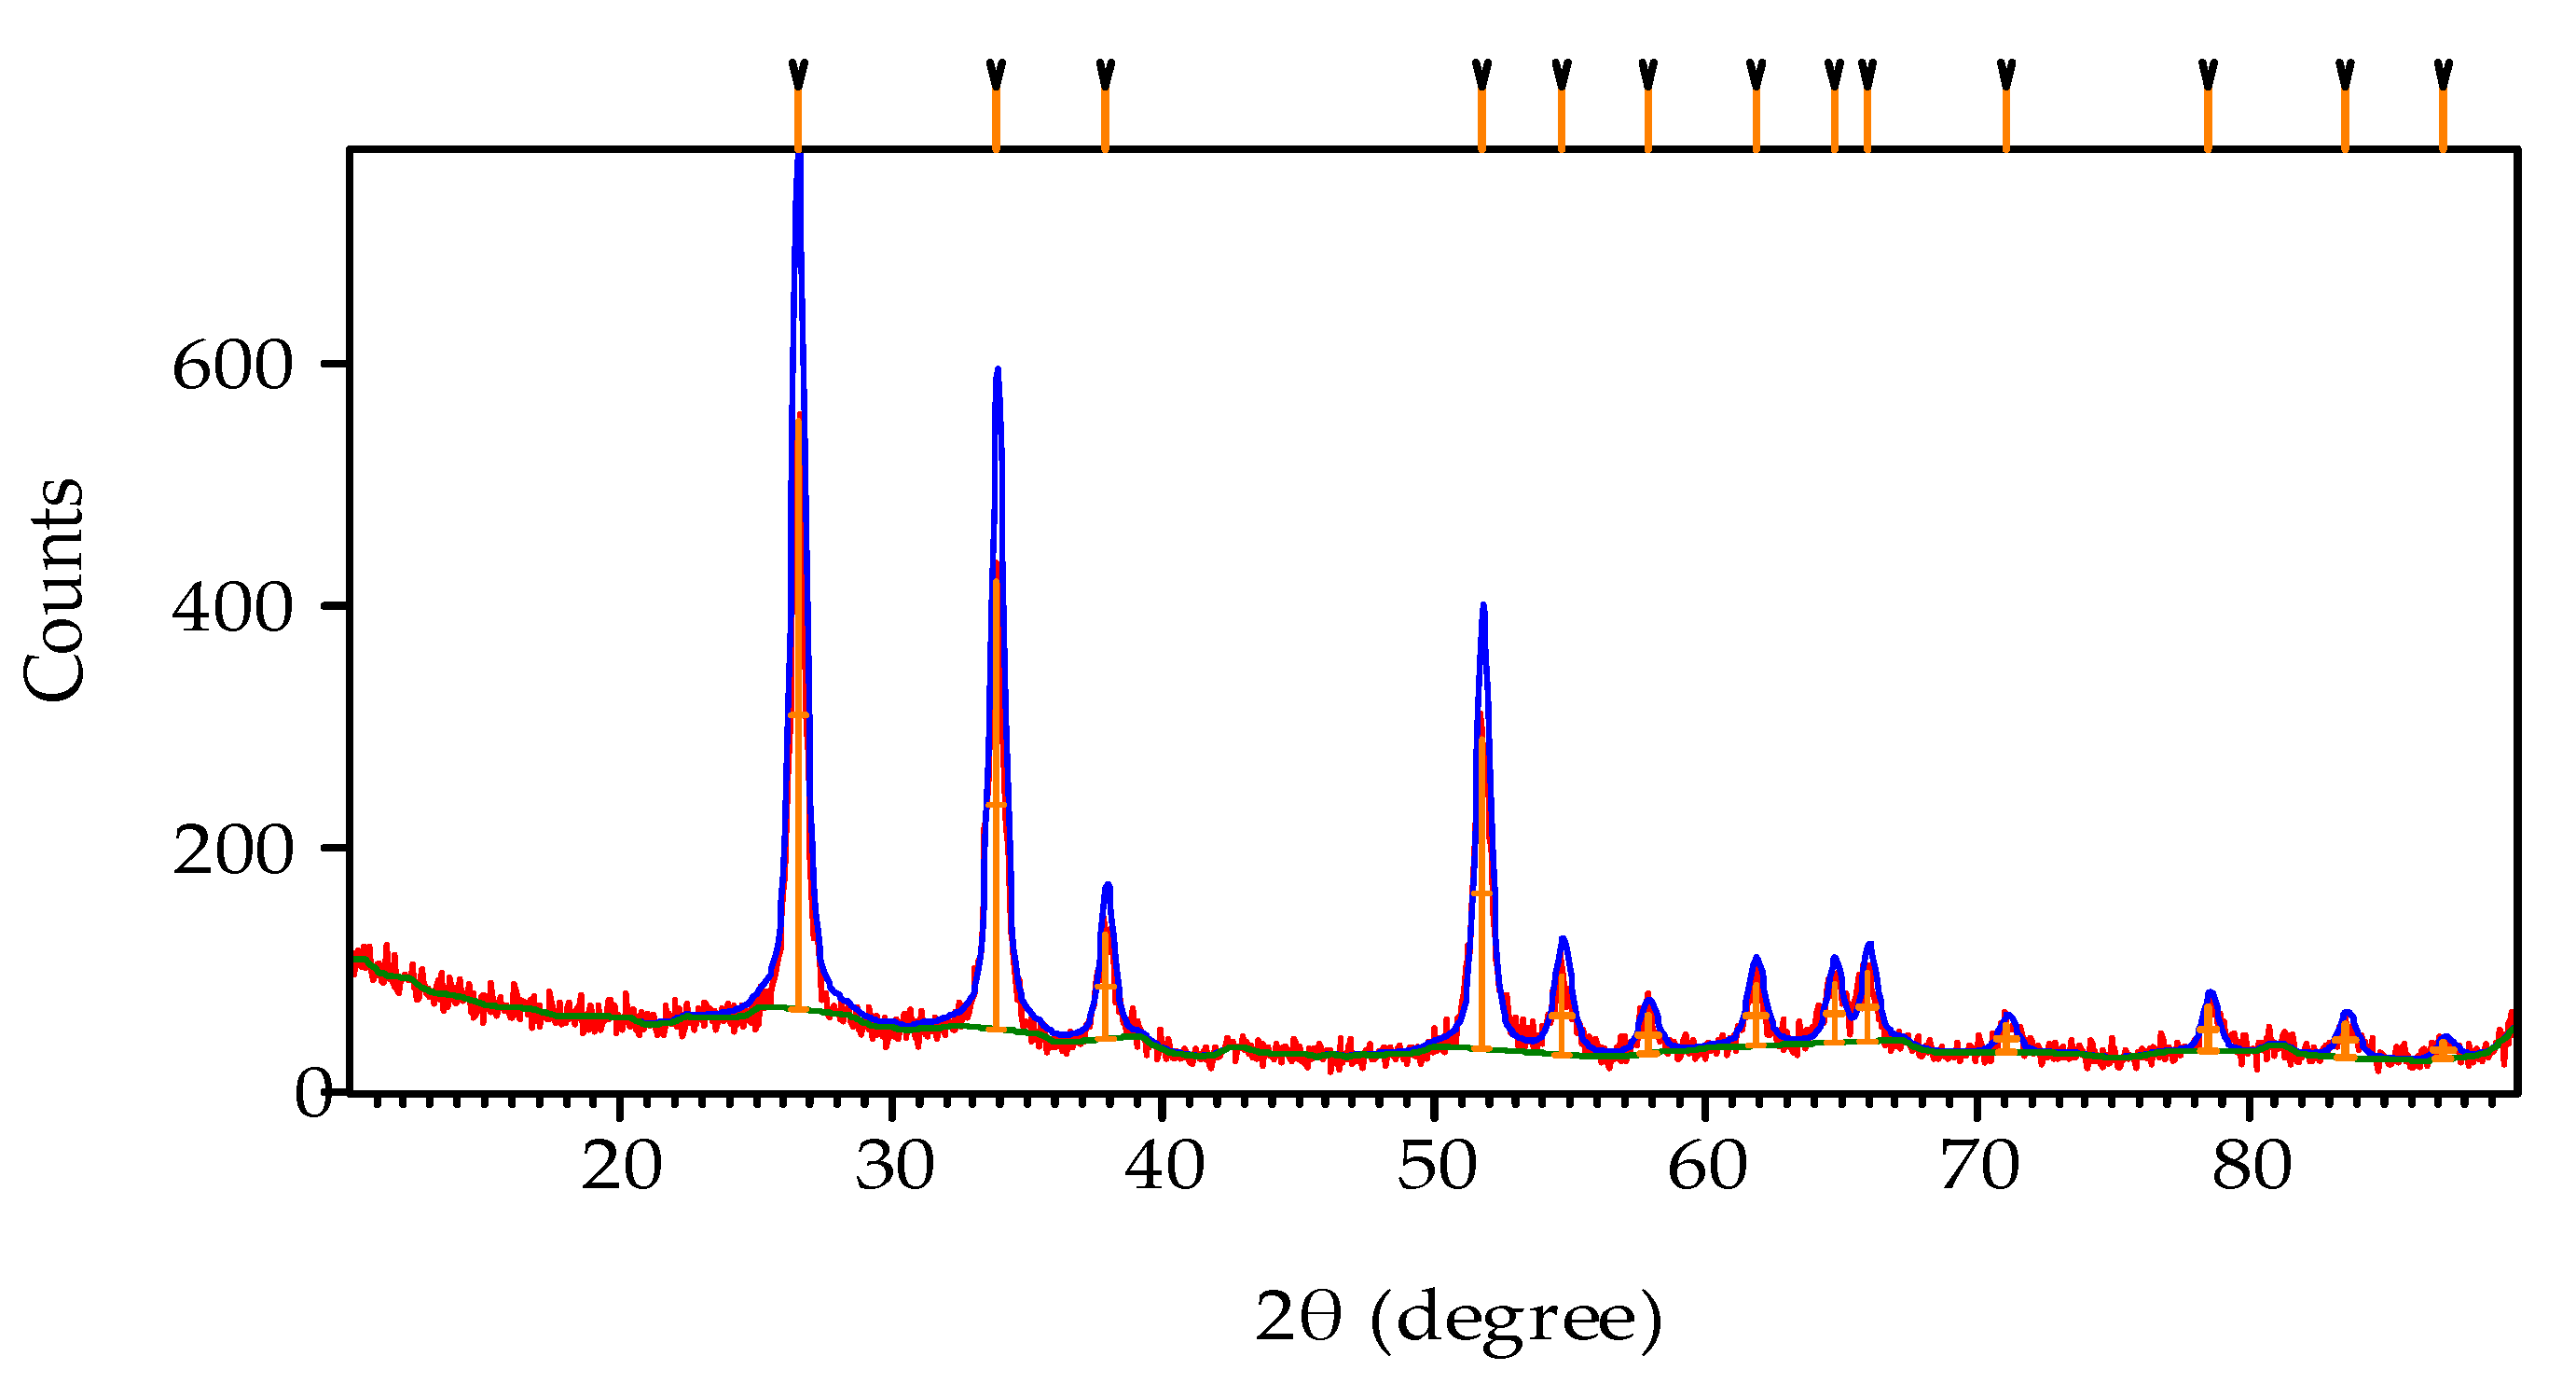
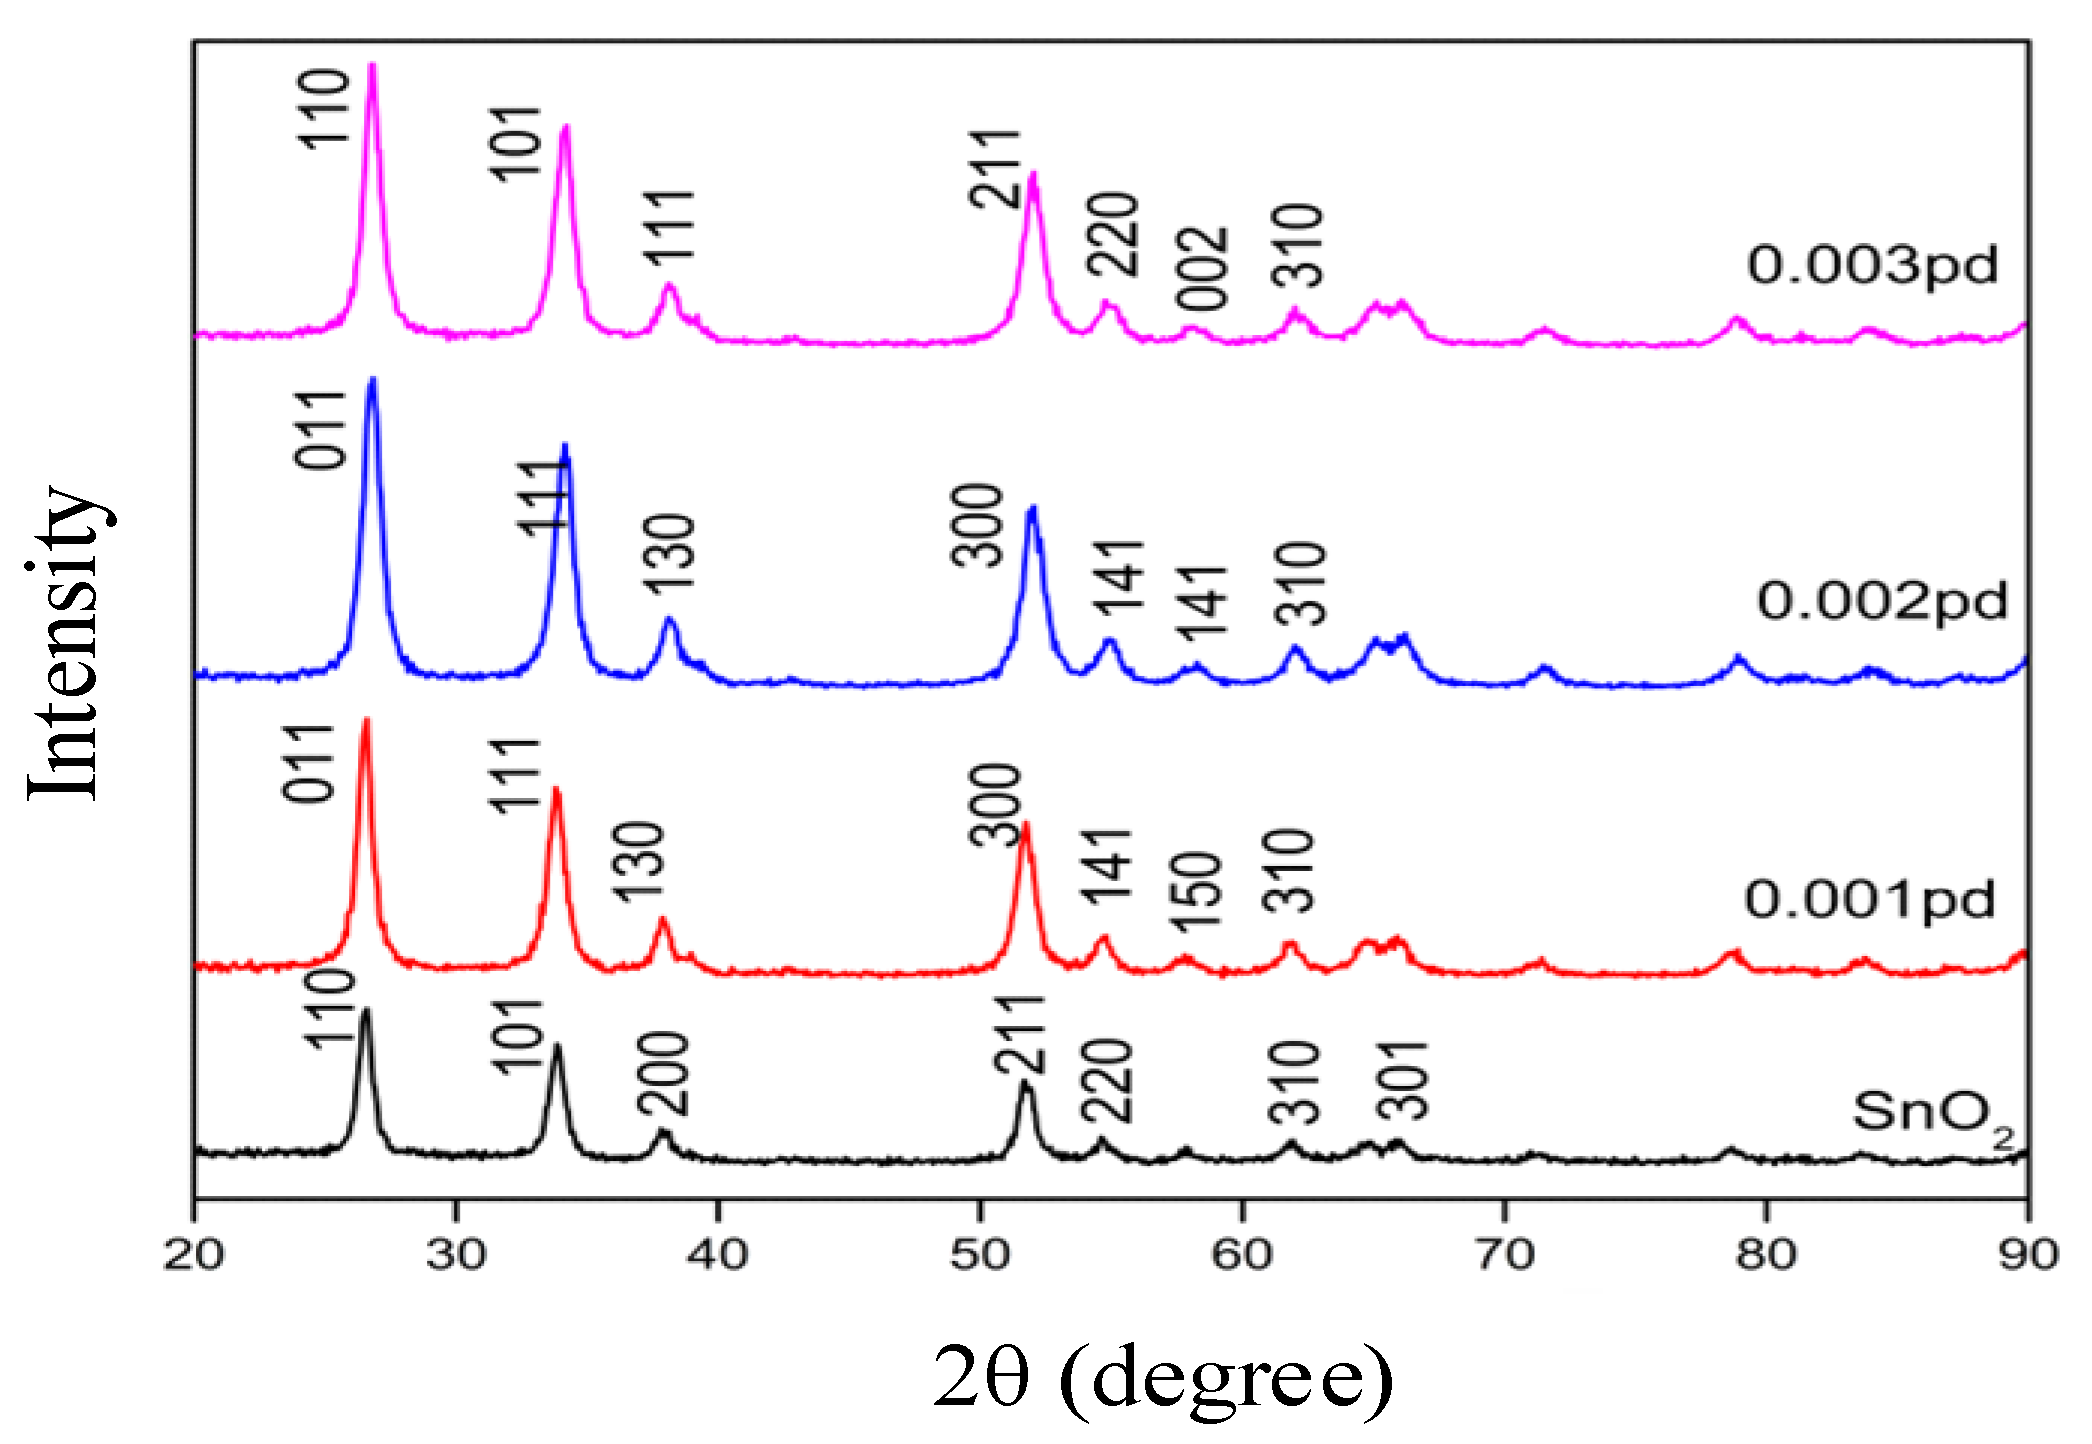
3.1. Structural Properties of SnO2 by XRD Analysis

The XRD pattern obtained by the SnO2 product is depicted in Figure 4. Pattern started from 10.03° and ended at 89.95° with continuous scan type at 25 °C. The peaks seen at 2θ values of 26.58°, 33.87°, 37.95°, 38.98°, 42.64°, 51.77°, 54.76°,61.88°, and 65.97° can be associated with (1 1 0), (1 0 1), (2 0 0), (111), (210), (2 1 1), (2 2 0), (3 1 0), (3 0 1) respectively [36]. The observed standard (hkl) planes, when matched, finalized that the product SnO2 is pure [39]. Having a structure with the literature values (JCPDS card no. 01-088-0287), (ICSD Collection code: 084576), and (ICSD NAME: Tin Oxide).
Similarly, the remaining samples also have reached the peaks at 2θ and have matched standard (hkl) planes that are briefly explained as comparison in Figure 5, which also shows the lattice parameter values. All matched intensity peaks are noted with lattice parameter values. The experimental results obtained clearly depict the structure of the synthesized products, or in other words, the sensing material. When CO sensing mechanisms were investigated with first principles calculations, it was shown that CO molecule grabs oxygen from the pre-adsorbed O on the Pd4 n or PdO cluster on the tin oxide (110) surface, resulting in the formation of CO2 [40]. The sensitivity of tin oxide to CO or any target gas is recently shown to be triggered by oxygen bound to Sn on the nanosheet, because of the conversion of the valency state of tin by the adsorption and desorption of oxygen on the 101 surface compared to the 110 surface [41]. Palladium can replace Sn and thus cause more vacancies for oxygen to be adsorbed on the sensor surface, thereby improving the gas sensor performance [31].
From Figure 5, we can understand that the intensity counts of each sample differ because of its crystalline size and the percentage of palladium added to the SnO2 sample. When the SnO2 sensor is doped with 5 wt% Pd2+ ions, it exhibits higher electric conductance and gas sensing properties to characteristic fault hydrocarbons, with fast response and recovery, at 350–400 °C [42]. Developed NO2 sensors using 1 mol% Pd-loaded In2O3 hierarchical microstructures showed exceptional NO2 detection at a further lower operating temperature of 110 °C, though other prevalent chemicals like H2, CO, CH4, and ethanol were present [43]. The performance of palladium nanoparticles compared to the bulk Pd is more because of the increased surface to volume ratio that further leads to a higher effective surface for the interaction of palladium [44]. Thus, addition of palladium to SnO2 nanoparticles will tend to increase the sensitivity toward carbon monoxide and the gas-sensing property.

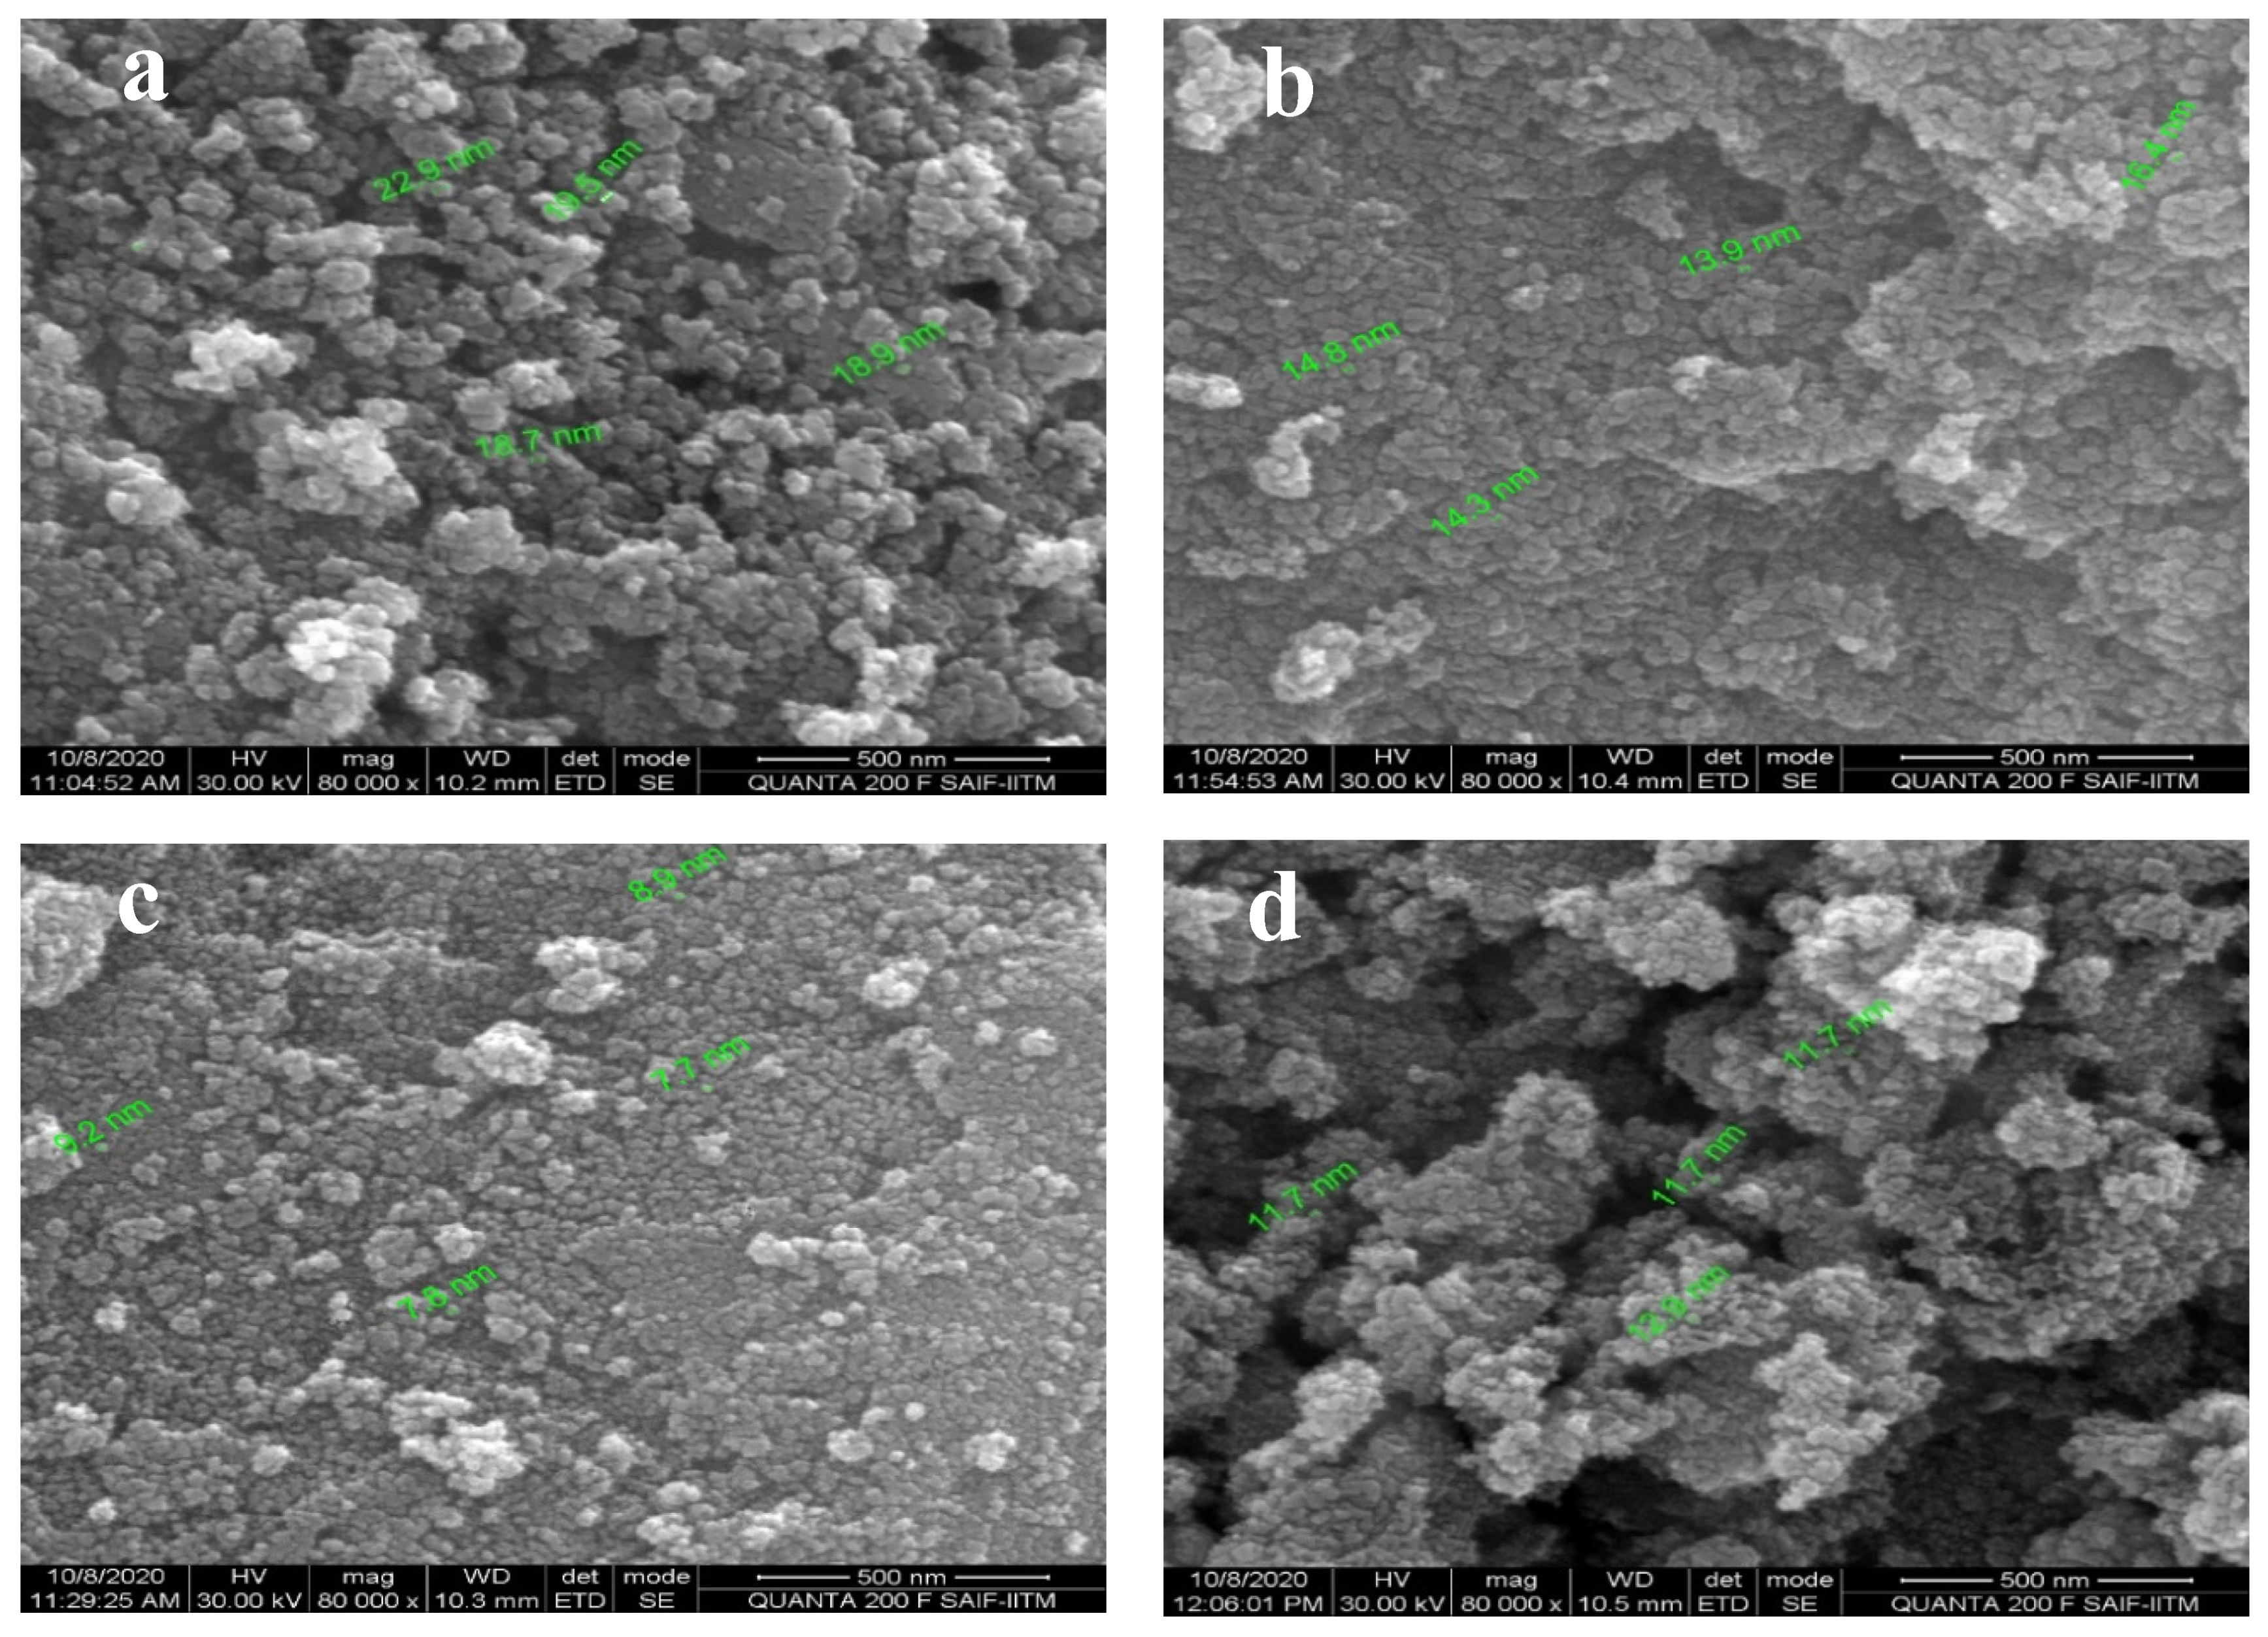
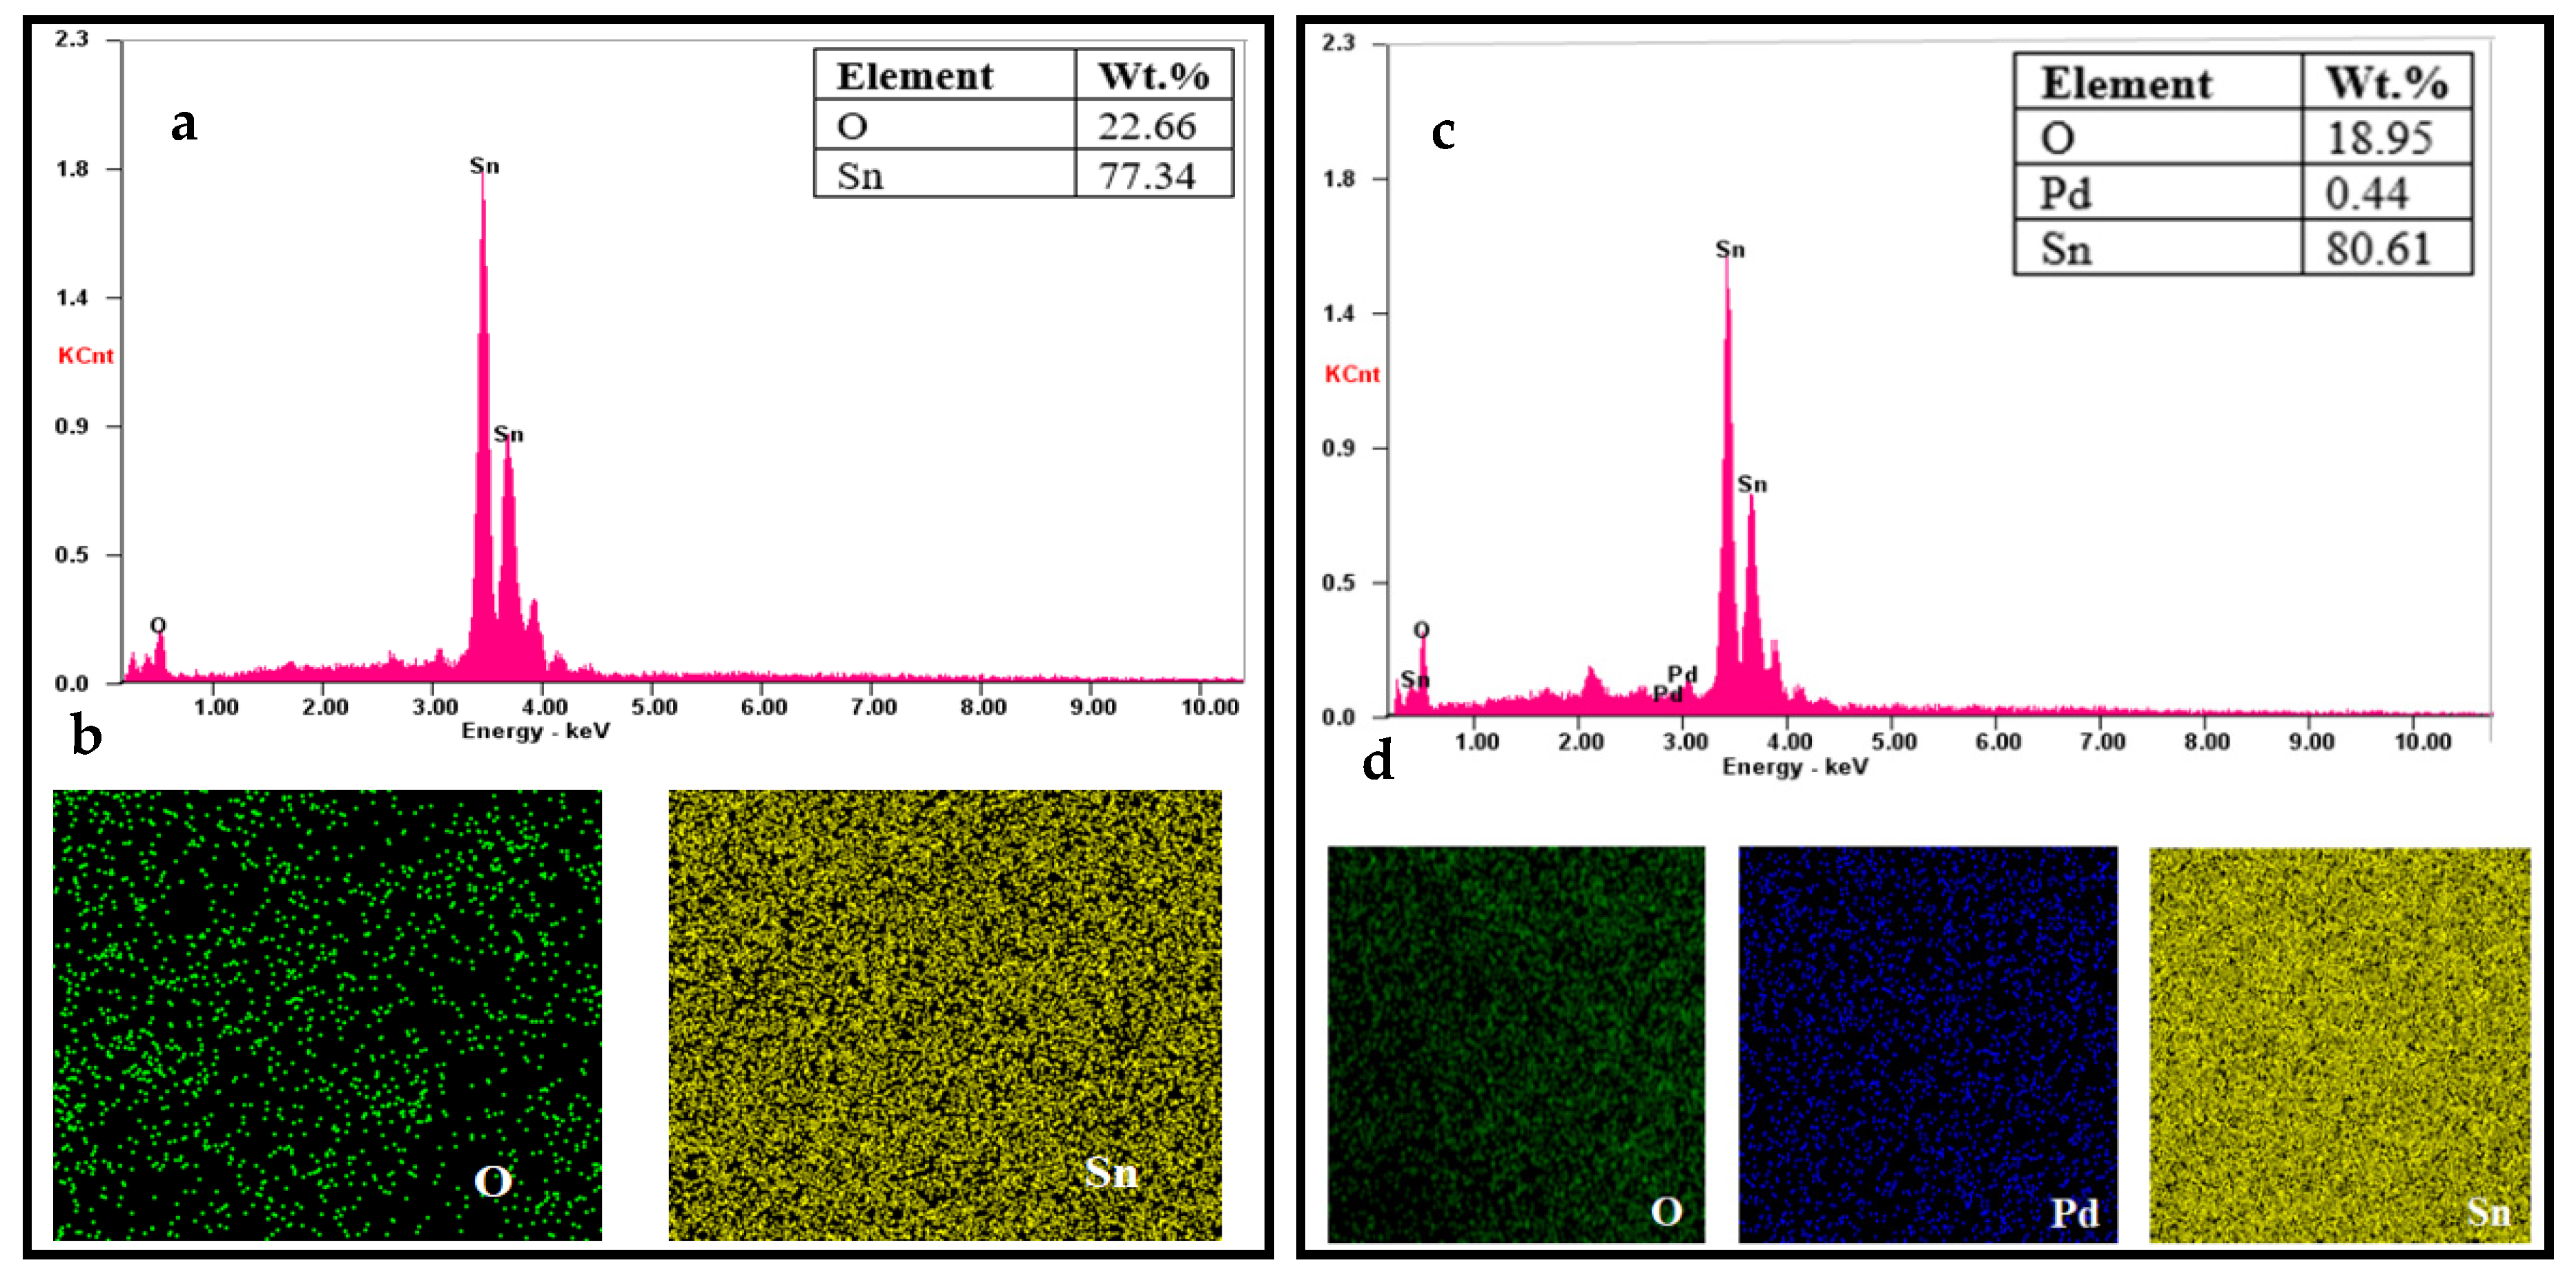
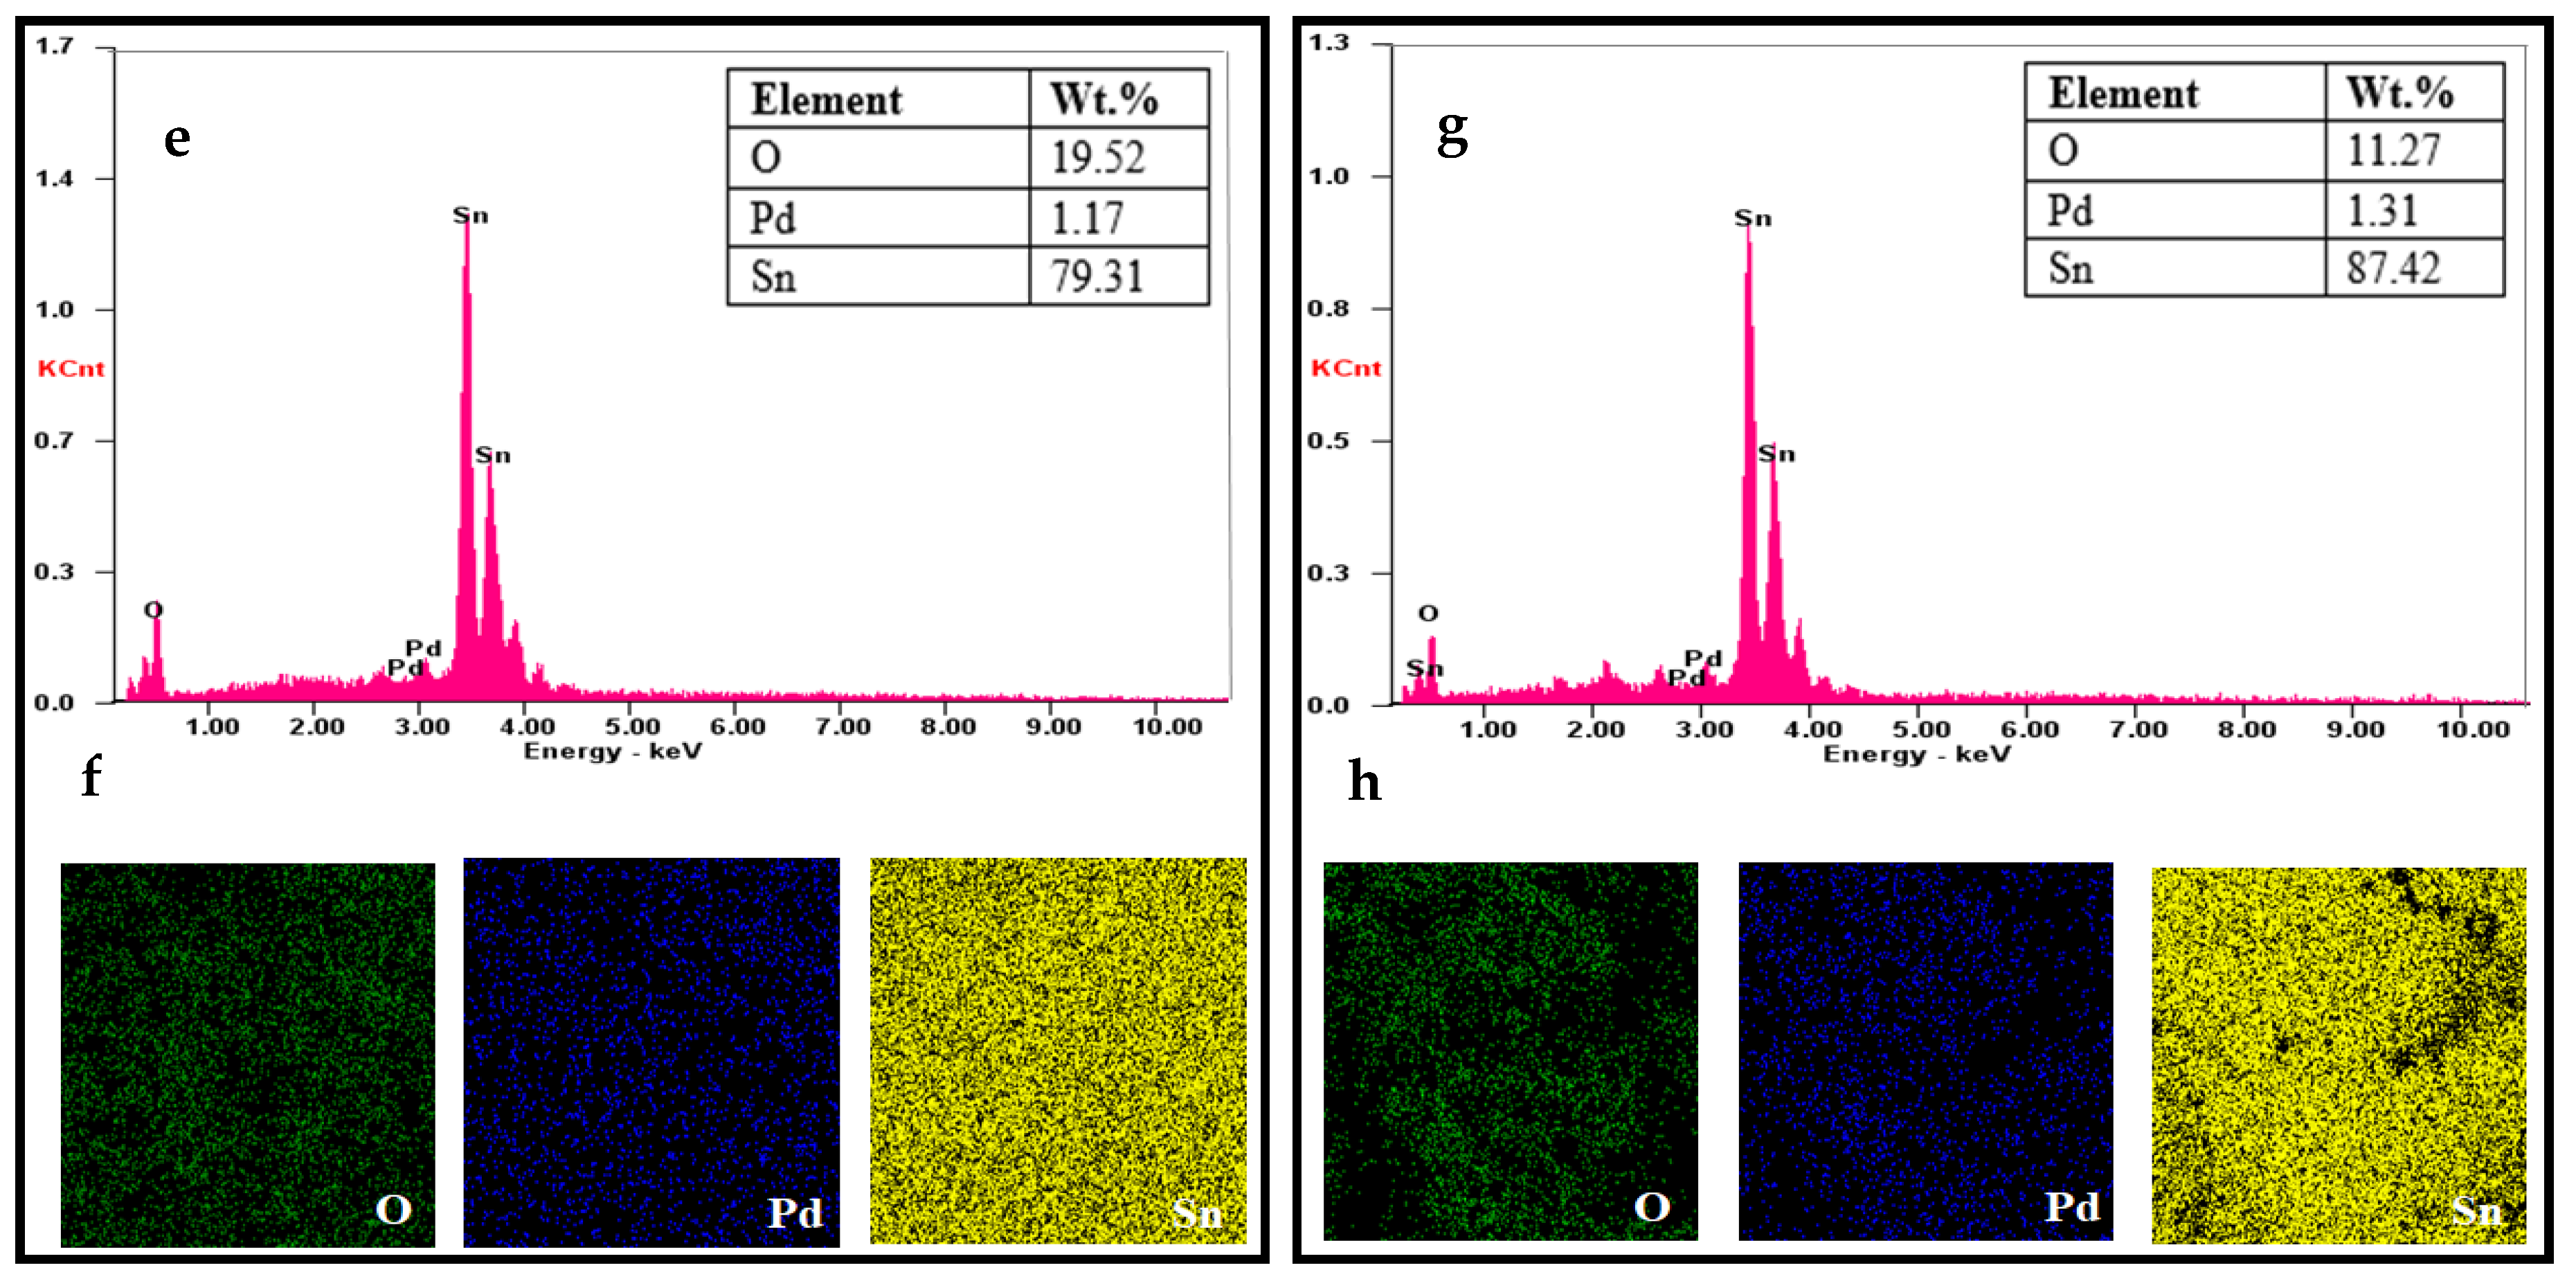
3.2. Morphological Properties of SnO2 by FESEM Analysis

Field emission scanning electron microscope was used to analyze the morphological properties of the synthesized SnO2 sample, and cluster of nanoparticles occurred on the surface. It is clear from the FESEM analysis that the SnO2 particles are crystalline in character and the results reveal their crystalline structure [45]. The result of FESEM analysis at magnification 80,000× is shown in Figure 6. In Figure 6a, it is seen that the average particle size for SnO2 is 20 nm. The result in Figure 6b, which is the FESEM analysis for SnO2 with 0.1% Pd, shows that the average particle size is 15 nm. FESEM analysis for SnO2 with 0.2% Pd, as seen in Figure 6c, shows that the average particle size is 8 nm. Similarly, from FESEM analysis for SnO2 with 0.3% Pd, as depicted in Figure 6d, it is observed that the average particles size is 12 nm. A careful examination of these structures reveals the presence of tin oxide nanoparticles of average size around 7–20 nm, the smallest particle size being observed for the sample containing SnO2 and 0.2% Pd. This spherical morphology with a greater surface area is perhaps the reason for the increased sensitivity [25].
The EDX spectrum of SnO2 (Figure 7a) verified the presence of Sn and O, whereas that of SnO2 with 0.1% Pd (Figure 7c), SnO2 with 0.2% Pd (Figure 7e), and SnO2 with 0.3% Pd (Figure 7g) confirmed the presence of Sn, O, and Pd. Further, EDX mapping of SnO2 (Figure 7b), SnO2 with 0.1% Pd (Figure 7d), SnO2 with 0.2% Pd (Figure 7f), and SnO2 with 0.3% Pd (Figure 7h) illustrated extensive dispersion of Sn, O, and Pd elements, thereby confirming that they are well-distributed on the surface.
It is interesting to note that the size of the nanoparticles decreases drastically on adding 0.1% and 0.2% palladium, however the addition of 0.3% Pd, increases the size of the nanoparticles. The nanostructures of the SnO2 nanoparticles are strongly influenced by doping that can be attributed to the surface to volume ratio, thereby enhancing the agglomeration and leading to increase in particle size. When a sensor was developed with nano-sized PdO loaded on SnO2 nanoparticles, the maximum of the sensor response was obtained in 0.1 mol% PdO and the particle size of PdO increased with loading amount because of the agglomeration of PdO nanoparticles to each other [46]. Likewise, above a particular concentration of the dopants Ni and Co, the radii of the doped ZnO increased the crystallite size resulting in a significant increase of the particle size [47]. Palladium enhancing the sensing capability of SnO2 is attributed to the presence of Pd clusters on the surface of tin oxide support, as well as the incorporation or embedding of Pd into the support [48]. It has been proved that palladium remains in its oxidized state and finely dispersed, when added in small quantities (0.2 wt%), whereas, it forms clusters at higher concentrations [49]. Thus, the increase in size of the nanoparticles on adding 0.3% Pd, may be due to the formation of clusters or the agglomeration of the nanoparticles, after attaining a level of saturation. As the particle size is found to influence the gas-sensing property closely, the increase in size of the nanoparticles will tend to decrease the CO sensing ability of 0.3% Pd.

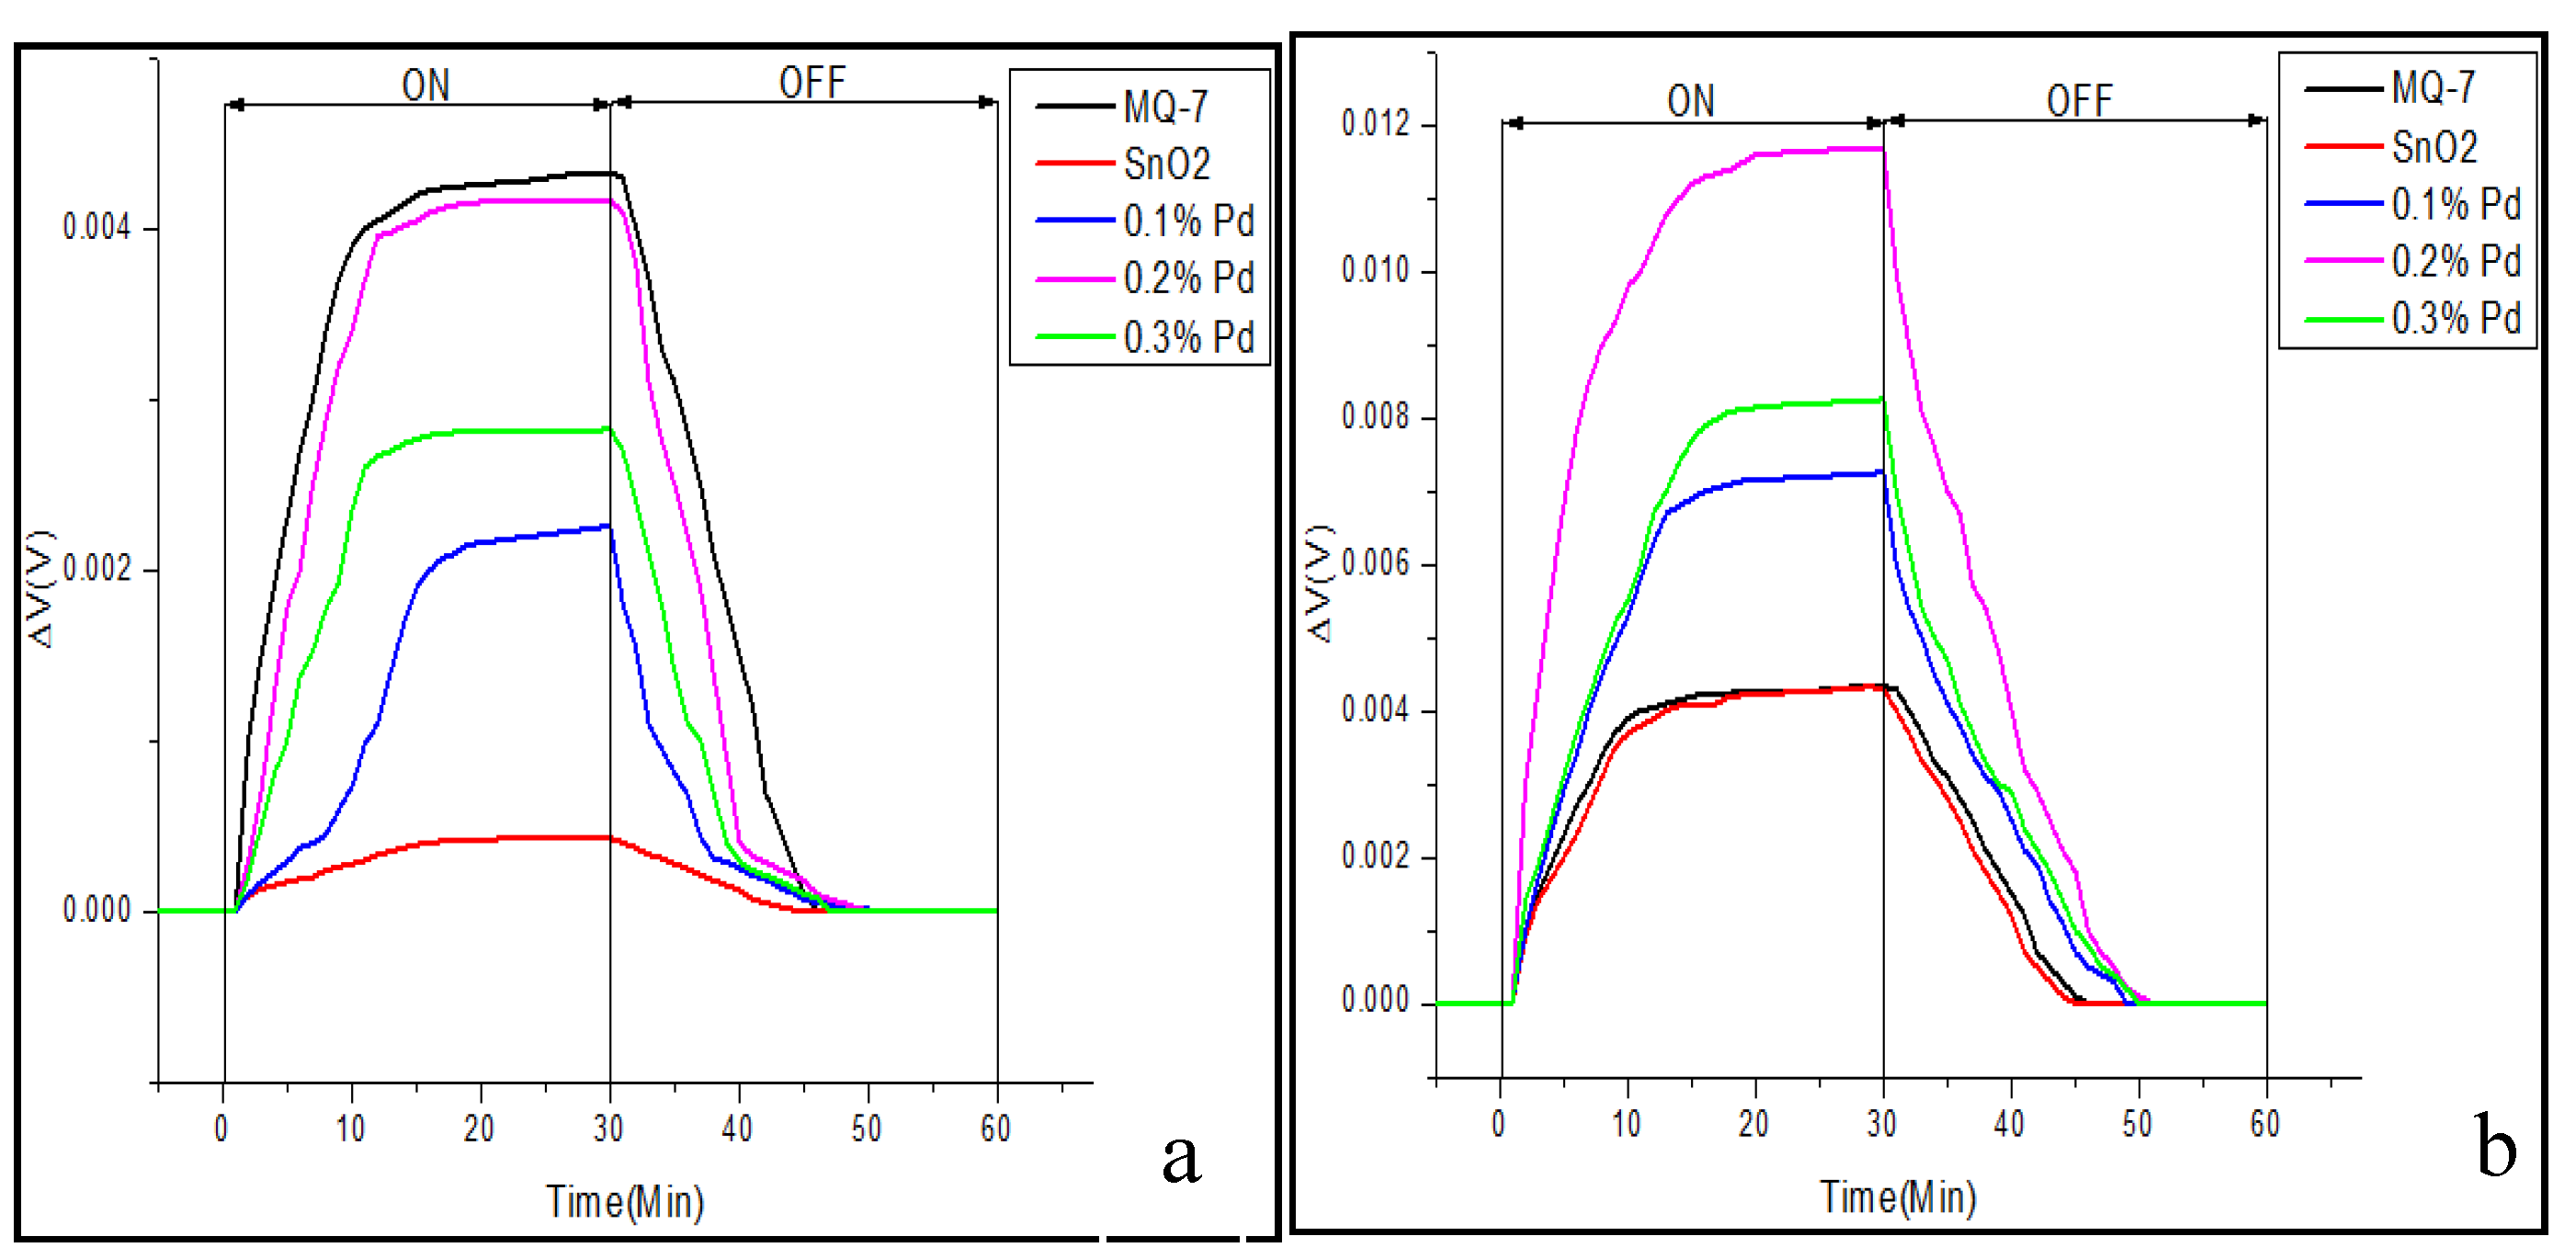
3.3. Real-Time Testing of the Sensor

The three main characterization parameters for the performance of any sensor are sensitivity, response time, and recovery time. Response time is the time for responding to a step concentration change from 0 to 90% of the saturated value and recovery time is the time taken for the signal of the sensor to return to 90% of the initial value [50]. From the results in Figure 8a,b, it is observed that the eight sensor array coated with the sensing material of SnO2 and 0.2% Pd, gives 11.6 mV, compared to 4.1 mV in three sensor array, which is because of the additive effect of the potential. The accepted mechanism in the detection of carbon monoxide, a reducing gas, is the partial chemical reduction of the surface of the sensitive SnO2 layer of nanoparticles, thereby leading to an increase in its conductivity, which can be increased by using a sensor array [51]. Our results clearly show that increasing the sensor array number from three to eight has significantly increased the sensitivity. In the eight sensor array, all the four-sensing materials sense CO gas better, but SnO2 doped with 0.2% Pd gives better result than pure SnO2 as well as SnO2 doped with 0.1% or 0.3% Pd. The sensitivity of this 0.2% Pd-doped SnO2 sensor is even better than that of the commercial sensor MQ-7, which had shown the best sensitivity in three sensor array. The sensitive material of MQ-7 is also tin oxide that detects CO concentrations in the air with high sensitivity and outputs its reading as an analogue voltage. However, it cannot be used to detect CO in the automobile exhaust, because of its size and other drawbacks. Together with MQ-7, an exhaust gas analyser was also kept inside the gas chamber to determine the level of exhaust gases. The hydrocarbon (130 ppm) and NOx (350 ppm) levels were less, whereas the CO (40,000 ppm) and CO2 (110,000 ppm) levels were comparatively higher. On comparing the trend observed in the variation of the exhaust gas levels with that of the sensor values, it resembled the CO levels, thereby suggesting that the voltage change observed must have been caused by CO.
Repeatability is the ability of a sensor to repeat a measurement when put back in the same environment and this is very often directly related to accuracy. In order to test the repeatability of the eight sensor array, the engine speed was kept constant at 1000 rpm and the change in voltage was recorded. This result is shown in Figure 9, which proves that the sensor values were reliable for a period of 2 h. An effective strategy to achieve eminent gas-sensing performances is that the sensor should possess high repeatability and long-term stability [24] and in our study, this repeatability is attributed to the unique nanoporous structures of SnO2 and the chemical as well as electronic sensitization of palladium.
The experiment was repeated for two more different engine speeds 2000 rpm as well as 4000 rpm and the sensitivity was tested. When the amount of oxygen during the combustion is low, CO is emitted as an exhaust product. It has been shown that the CO emission decreases while the speed of the engine rises to nearly 2000 rpm and then is almost constant till 3000 rpm; the CO level again increases reaching maximum at about 4000 rpm and then decreases to a minimum value [52]. Thus in our study, three engine speeds, one lower to 2000 rpm, i.e., 1000 rpm, 2000 rpm, and 4000 rpm are chosen to test the sensitivity of the sensors. The results are shown in Figure 10, which replicate the CO level exhausted from the engine in terms of change in voltage as sensitivity of the sensor. From the data obtained, it is noted that the CO gas coming out of the engine first increases at 1000 rpm, then decreases at 2000 rpm, and again rises at 4000 rpm. This clearly indicates that the real-time testing of the sensors is valid and the sensitivity of the 0.2% Pd-doped SnO2 shows maximum sensitivity, or in other words, senses the emission of CO effectively.
Though palladium is expensive, this noble metal is found to be an excellent catalyst for sensing gases like hydrogen, oxides of nitrogen, and hydrocarbons. On optimization of palladium-based hydrogen sensors for sensitivity, it has been shown that, apart from the design of the sensor, the working temperature and the palladium geometry also play vital roles to achieve desired sensitivity [53]. When studies were carried out with Pt-loaded SnO2 and Pd-doped SnO2, the latter was found to be more selective for hydrogen giving a fast response [54]. The sensitivity and life-time was shown to be higher for Pd-tin reformed microband electrode series, as a nitrate sensor [55]. The sensors using Pd-doped TiO2 fibers exhibited encouraging gas sensing characteristics like low operation temperature and adequate gas response [56]. The sensor response to methane was found to be higher and fast-acting, when 1.41% palladium was added to tin dioxide, compared to the non-doped tin oxide [57]. These gases are seen to be sensed by palladium-doped SnO2, but at concentrations more than 0.5% palladium [29], which pave chances that only CO gas gets sensed at this lesser concentration of 0.1–0.2% Pd, making this sensor highly selective for CO gas, in that case. It has been shown that 0.2% Pd-loaded SnO2 had drastically increased the selectivity of CO against hydrogen than pure tin oxide at 350 °C [58]. However, future studies are carried out to confirm this selectivity of the Pd-doped sensor to carbon monoxide at lower temperature.
Lowering the operation temperature is considered to be an essential criterion in the design of a sensor because though the automobile engine operates at higher temperature, the temperature of the exhaust coming out is comparatively at lower temperature. Hence the sensor that attempts to sense any exhaust gas should function with high specificity at lower temperature and in our study, SnO2 with 0.2% Pd showed maximum sensitivity at relatively lower temperature. When the temperature and gas concentration is increased, sensor response for SnO2-Pd nanofiber system has also increased [59]. At relatively lower operating temperature, the SnO2 nanotubes demonstrate high delicacy and discrimination for acetone detection, when compared with other reported SnO2-based sensing materials [60]. SnO2 nanofibers, when used as nanosensors in electronic noses, have shown higher sensitivity to NO2 when the temperature was low [61]. The temperature-dependent response of PdO showed good sensitivity to various CO concentrations at operating temperatures from 25 °C to 100 °C, because the amount of adsorption of CO varies with temperature [62]. The nanoparticles of PdO/SnO2 has a low detection limit and good selectivity to carbon monoxide than other interfering gases, together with low-temperature stability and reversibility, clearly showing that this sensor is a practical low-temperature sensing material for CO [63].
Many attempts have been made to overcome the problems and challenges encountered by the SnO2 sensors, such as the effect of interfering gases, the low selectivity and the operation of the sensors with variable temperature profiles. By increasing the surface area of the porous nanocomposites and the spillover effects of palladium nanoparticles, CO sensing characteristics of SnO2 had shown to be improved in terms of response, selectivity, and stability, even at low operating temperature [64]. The response of 0.5% palladium-doped graphene-SnO2 toward carbon monoxide gas was lower than that of 0.1% Pd [31], however, they have not checked the intermediate concentrations of 0.1%–0.5% Pd. Moreover, there are a few drawbacks in using graphene such as lack of method for large-scale preparation and the necessity of further treatment of graphene to improve its response sensitivity [65]. Earlier, it has been shown that 0.2% Pd-doped SnO2 exhibits the best response (80%) toward CO at different operating temperatures within the measurement time [66]. In our study, when SnO2 nanoparticles were doped with 0.1%, 0.2%, and 0.3% palladium, the results show an increased sensing capability toward CO gas, the best sensitivity being exhibited by 0.2% Pd-doped SnO2 nanoparticles connected as eight sensor array.

4. Conclusions

The need of the day to minimize air pollution is a sensor to measure the levels of the major air pollutant, carbon monoxide, which can be specific to CO gas even in the parts-per-million range at lower temperatures. In this attempt, SnO2 nanoparticles synthesized from stannous chloride dihydrate chemical compound by chemical precipitation method were doped with 0.1%, 0.2%, and 0.3% palladium, and found to be capable of sensing CO gas among various other gases. The characterization results of the sensing materials were obtained by using XRD and FESEM techniques, which confirms the presence of tin oxide in the final products. XRD indicates the tetragonal structure of the particles and FESEM analysis shows the presence of tin oxide powder with particle size of about 7–20 nm. All the four samples synthesized, viz., pure SnO2, SnO2 with 0.1% Pd, 0.2% Pd, and 0.3% Pd, were coated as three and eight sensor array, with which the real time testing of the sensor was carried out and the results were compared. On validating, this sensor connected in eight sensor array was able to sense the CO gas with greater efficiency and sensitivity, even higher than the commercially available sensor, among which 0.2% Pd-doped SnO2 showed maximum sensitivity to the exhaust CO gas pollutant. However, these that are reported here are preliminary results; further in-depth studies have to be performed on the argument exposed. In future, similar sensor can be designed for sensing other gases by changing the sensing material, and the sensor thus designed can be integrated into a single package.

Author Contributions

Conceptualization, methodology, validation, formal analysis, investigation, resources, data curation, writing—original draft preparation, writing—review and editing by J.S.J., supervision by A.V.J. All authors have read and agreed to the published version of the manuscript.

Funding

This research received no external funding.

Acknowledgments

Department of Electronics and Instrumentation, SRM Institute of Science and Technology, provided required resources and working environment. Department of Nanotechnology and Research Centre, SRM Institute of Science and Technology, supported this work with analysis techniques and laboratory. Automobile Department of SRM Institute of Science and Technology, helped to validate the sensor. The SEM analysis and EDX elemental mapping were performed in SAIF, IITM. Further help rendered by S. Akshya, Helen Annal Therese, and Veeramani, SRM Institute of Science and Technology, is gratefully acknowledged.

Conflicts of Interest

The authors declare no conflict of interest.

References

  1. Tong, S. Air pollution and disease burden. Lancet Planet. Health Comment 2019, 3, 49–50. [Google Scholar] [CrossRef] [Green Version]
  2. Yuliarto, B.; Gumilar, G.; Septiani, N.L.W. SnO2 nanostructure as pollutant gas sensors: Synthesis, sensing performances, and mechanism. Adv. Mater. Sci. Eng. 2015. [Google Scholar] [CrossRef] [Green Version]
  3. Godish, T. Atmospheric pollution and pollutants. In Air Quality, 4th ed.; Lewis Publishers: Boca Raton, FL, USA, 2004; pp. 26–75. [Google Scholar]
  4. Omaye, S.T. Metabolic modulation of carbon monoxide toxicity. Toxicology 2002, 180, 139–150. [Google Scholar] [CrossRef]
  5. Kumar, G.M.; Sampath, S.; Jeena, V.S.; Anjali, R. Carbon monoxide pollution levels at environmentally different sites. J. Indian Geophys. Union 2008, 12, 31–40. [Google Scholar]
  6. Rozante, J.R.; Rozante, V.; Alvim, D.S.; Manzi, A.O.; Chiquetto, J.B.; D’Amelio, M.T.S.; Moreira, D.S. Variations of carbon monoxide concentrations in the megacity of São Paulo from 2000 to 2015 in different time scales. Atmosphere 2017, 8, 81. [Google Scholar] [CrossRef] [Green Version]
  7. Myronuk, D.J. Augmented ingestion of carbon monoxide and sulfur oxides by occupants of vehicles while idling in drive-up facility lines. Water Air Soil Pollut. 1977, 7, 203–213. [Google Scholar]
  8. Penney, D.G. A survey study of public perceptions about carbon monoxide. In Carbon Monoxide Poisoning; Penney, D.G., Ed.; Taylor & Francis Group: Boca Raton, FL, USA, 2008; pp. 325–340. [Google Scholar]
  9. Wang, C.X.; Yin, L.W.; Zhang, L.Y.; Xiang, D.; Gao, R. Metal oxide gas sensors: Sensitivity and influencing factors. Sensors 2010, 10, 2088–2106. [Google Scholar] [CrossRef] [Green Version]
  10. Su, S.; Wu, W.; Gao, J.; Lu, J.; Fan, C. Nanomaterials-based sensors for applications in environmental monitoring. J. Mater. Chem. 2012, 22, 18101–18110. [Google Scholar] [CrossRef]
  11. Habib, I.Y.; Tajuddin, A.A.; Noor, H.A.; Lim, C.M.; Mahadi, A.H.; Kumara, N.T.R.N. Enhanced carbon monoxide-sensing properties of chromium-doped ZnO nanostructures. Sci. Rep. 2019, 9, 9207. [Google Scholar] [CrossRef] [PubMed] [Green Version]
  12. Zeng, W.; Wang, H.; Li, Z. Nanomaterials for sensing applications. J. Nanotechnol. 2016, 2016, 2083948. [Google Scholar] [CrossRef] [Green Version]
  13. Kanan, S.M.; El-Kadri, O.M.; Abu-Yousef, I.A.; Kanan, M.C. Semiconducting metal oxide based sensors for selective gas pollutant detection. Sensors 2009, 9, 8158–8196. [Google Scholar] [CrossRef] [Green Version]
  14. Kanazawa, E.; Sakai, G.; Shimanoe, K.; Kanmura, Y.; Teraoka, Y.; Miura, N.; Yamazoe, N. Metal oxide semiconductor N2O sensor for medical use. Sens. Actuators B Chem. 2001, 77, 72–77. [Google Scholar] [CrossRef]
  15. Sachdeva, S.; Agarwal, A.; Agarwal, R. A comparative study of gas sensing properties of tungsten oxide, tin oxide and tin-doped tungsten oxide thin films for acetone gas detection. J. Electron. Mater. 2019, 48, 1617–1628. [Google Scholar] [CrossRef]
  16. Williams, D.E.; Rahman, A.Z.M.S. Metal-oxide-based gas sensors. In Reference Module in Materials Science and Materials Engineering; Elsevier Publishers: Amsterdam, The Netherlands, 2017. [Google Scholar] [CrossRef]
  17. Cheng, J.P.; Wang, J.; Li, Q.Q.; Liu, H.G.; Li, Y. A review of recent developments in tin dioxide composites for gas sensing application. J. Ind. Eng. Chem. 2016, 44, 1–22. [Google Scholar] [CrossRef]
  18. Govardhan, K.; Nirmala, A. Grace metal/metal oxide doped semiconductor based metal oxide gas sensors—A review. Sens. Lett. 2016, 14, 741–750. [Google Scholar] [CrossRef]
  19. Ramgir, N.S.; Hwang, Y.K.; Jhung, S.H.; Kim, H.K.; Hwang, J.S.; Mulla, I.S.; Chang, J.S. CO sensor derived from mesostructured Au-doped SnO2 thin film. Appl. Surf. Sci. 2006, 252, 4298–4305. [Google Scholar] [CrossRef]
  20. Zhou, Q.; Chen, W.; Xu, L.; Kumar, R.; Gui, Y.; Zhao, Z.; Tang, C.; Zhu, S. Highly sensitive carbon monoxide CO) gas sensors based on Ni and Zn doped SnO2 nanomaterials. Ceram. Int. 2018, 44, 4392–4399. [Google Scholar] [CrossRef]
  21. Basyooni, M.A.; Eker, Y.R.; Yilmaz, M. Structural, optical, electrical and room temperature gas sensing characterizations of spin coated multilayer cobalt-doped tin oxide thin films. Superlattices Microstruct. 2020, 140, 106465. [Google Scholar] [CrossRef]
  22. Tombak, A.; Ocak, Y.S.; Bayansal, F. Cu/SnO2 gas sensor fabricated by ultrasonic spray pyrolysis for effective detection of carbon monoxide. Appl. Surf. Sci. 2019, 493, 1075–1082. [Google Scholar] [CrossRef]
  23. Navazani, S.; Shokuhfar, A.; Hassanisadi, M.; Di Carlo, A.; Nia, N.Y.; Agresti, A. A PdPt decorated SnO2-rGO nanohybrid for high-performance resistive sensing of methane. J. Taiwan Inst. Chem. Eng. 2019, 95, 438–451. [Google Scholar] [CrossRef]
  24. Yao, L.; Li, Y.; Ran, Y.; Yang, Y.; Zhao, R.; Su, L.; Kong, Y.; Ma, D.; Chen, Y.; Wang, Y. Construction of novel Pd–SnO2 composite nanoporous structure as a high-response sensor for methane gas. J. Alloy. Compd. 2020, 826, 154063. [Google Scholar] [CrossRef]
  25. Kolmakov, A.; Klenov, D.O.; Lilach, Y.; Stemmer, S.; Moskovits, M. Enhanced gas sensing by individual SnO2 nanowires and nanobelts functionalized with Pd catalyst particles. Nano Lett. 2005, 5, 667–673. [Google Scholar] [CrossRef] [PubMed]
  26. Liu, S.; Li, L.; Jiang, W.; Liu, C.; Ding, W.; Chai, W. Crystallinity and morphology-controlled synthesis of SnO2 nanoparticles for higher gas sensitivity. Powder Technol. 2013, 245, 168–173. [Google Scholar] [CrossRef]
  27. Firooz, A.A.; Mahjoub, A.R.; Khodadadi, A.A. Effects of flower-like, sheet-like and granular SnO2 nanostructures prepared by solid-state reactions on CO sensing. Mater. Chem. Phys. 2009, 115, 196–199. [Google Scholar] [CrossRef]
  28. Miguel-Garcia, I.; Berenguer-Murcia, A.; Cazorla-Amoros, D. Preferential oxidation of CO catalyzed by supported polymer-protected palladium-based nanoparticles. Appl. Catal. B Environ. 2010, 98, 161–170. [Google Scholar] [CrossRef]
  29. Kasthurirengan, S.; Behera, U.; Nadig, D.S.; Weisend, J.G. Palladium doped tin oxide based hydrogen gas sensors for safety applications. AIP Conf. Proc. 2010, 1218, 1239–1246. [Google Scholar]
  30. Jarzebski, Z.M.; Marton, J.P. Physical properties of SnO2 materials: I. Preparation and defect structure. J. Electrochem. Soc. 1976, 123, 199–205. [Google Scholar] [CrossRef]
  31. Debataraja, A.; Septiani, N.L.W.; Yuliarto, B.; Nugraha, N.; Sunendar, B.; Abdullah, H. High performance of a carbon monoxide sensor based on a Pd-doped graphene-tin oxide nanostructure composite. Ionics 2019, 25, 4459–4468. [Google Scholar] [CrossRef]
  32. Blessi, S.; Sonia, M.; Vijayalakshmi, S.; Pauline, S. Preparation and characterization of SnO2 nanoparticles by hydrothermal method. Int. J. ChemTech Res. 2014, 6, 2153–2155. [Google Scholar]
  33. Naje, A.N.; Norry, A.S.; Suhail, A.M. Preparation and characterization of SnO2 nanoparticles. Int. J. Innov. Res. Sci. Eng. Technol. 2013, 2, 7068–7072. [Google Scholar]
  34. Inderan, V.; Arafat, M.M.; Haseeb, A.S.M.A.; Sudesh, K.; Lee, H.L. A comparative study of structural and ethanol gas sensing properties of pure, nickel and palladium doped SnO2 nanorods synthesised by the hydrothermal method. J. Phys. Sci. 2019, 30, 127–143. [Google Scholar] [CrossRef]
  35. Niranjan, R.S.; Hwang, Y.K.; Kim, D.K.; Jhung, S.H.; Chang, J.S.; Mulla, I.S. Nanostructured tin oxide: Synthesis and gas-sensing properties. Mater. Chem. Phys. 2005, 92, 384–388. [Google Scholar] [CrossRef]
  36. Saranya, M.; Santhosh, C.; Augustine, S.P.; Grace, A.N. Synthesis and characterization of CuS nanomaterials using hydrothermal route. J. Exp. Nanosci. 2014, 9, 329–336. [Google Scholar] [CrossRef]
  37. Eskandari, P.; Farhadian, M.; Nazar, A.R.S.; Jeon, B.-H. Adsorption and photodegradation efficiency of TiO2/Fe2O3/PAC and TiO2/Fe2O3/Zeolite nanophotocatalysts for the removal of cyanide. Ind. Eng. Chem. Res. 2019, 58, 2099–2112. [Google Scholar] [CrossRef]
  38. Simons, C.; Schrapler, L.; Herklotz, G. Doped and low-alloyed gold bonding wires. Gold Bull. 2000, 33, 89–96. [Google Scholar] [CrossRef] [Green Version]
  39. Song, H.M.; Chon, B.S.; Jeon, S.H.; Rai, P.; Yu, Y.T.; Dutta, P.K. Synthesis of Au@SnO2 core–shell nanoparticles with controllable shell thickness and their CO sensing properties. Mater. Chem. Phys. 2015, 166, 87–94. [Google Scholar] [CrossRef]
  40. Chen, Y.; Qin, H.; Hu, J. CO sensing properties and mechanism of Pd doped SnO2 thick-films. Appl. Surf. Sci. 2018, 428, 207–217. [Google Scholar] [CrossRef]
  41. Choi, P.G.; Izu, N.; Shirahata, N.; Masuda, Y. Improvement of sensing properties for SnO2 gas sensor by tuning of exposed crystal face. Sens. Actuators B Chem. 2019, 296, 126655. [Google Scholar] [CrossRef]
  42. Chen, W.; Zhou, Q.; Gao, T.; Su, X.; Wan, F. Pd-doped SnO2-based sensor detecting characteristic fault hydrocarbon gases in transformer oil. J. Nanomater. 2013. [Google Scholar] [CrossRef]
  43. Hu, J.; Liang, Y.; Sun, Y.; Zhao, Z.; Zhang, M.; Li, P.; Zhang, W.; Chen, Y.; Zhuiykov, S. Highly sensitive NO2 detection on ppb level by devices based on Pd-loaded In2O3 hierarchical microstructures. Sens. Actuators B Chem. 2017, 252, 116–126. [Google Scholar] [CrossRef]
  44. Corso, A.J.; Tessarolo, E.; Guidolin, M.; Della Gaspera, E.; Martucci, A.; Angiola, M.; Pelizzo, M.G. Room-temperature optical detection of hydrogen gas using palladium nano-islands. Int. J. Hydrog. Energy 2018, 43, 5783–5792. [Google Scholar] [CrossRef]
  45. Patil, G.E.; Kajale, D.D.; Gaikwad, V.B.; Jain, G.H. Preparation and characterization of SnO2 nanoparticles by hydrothermal route. Int. Nano Lett. 2012, 2, 17. [Google Scholar] [CrossRef] [Green Version]
  46. Yuasa, M.; Masaki, T.; Kida, T.; Shimanoe, K.; Yamazoe, N. Nano-sized PdO loaded SnO2 nanoparticles by reverse micelle method for highly sensitive CO gas sensor. Sens. Actuators B Chem. 2009, 136, 99–104. [Google Scholar] [CrossRef]
  47. Ali, M.; Sharif, S.; Anjum, S.; Imran, M.; Ikram, M.; Naz, M.; Ali, S. Preparation of Co and Ni doped ZnO nanoparticles served as encouraging nano-catalytic application. Mater. Res. Express 2019, 6, 1250d5. [Google Scholar] [CrossRef]
  48. Pineau, N.J.; Keller, S.D.; Güntner, A.T.; Pratsinis, S.E. Palladium embedded in SnO2 enhances the sensitivity of flame-made chemoresistive gas sensors. Microchim. Acta 2020, 187, 96. [Google Scholar] [CrossRef] [PubMed]
  49. Koziej, D.; Hubner, M.; Barsan, N.; Weimar, U.; Sikora, M.; Grunwaldt, J.-D. Operando X-ray absorption spectroscopy studies on Pd-SnO2 based sensors. Phys. Chem. Chem. Phys. 2009, 11, 8620–8625. [Google Scholar] [CrossRef] [PubMed]
  50. Nandy, T.; Coutu, R.A., Jr.; Ababei, C. Carbon monoxide sensing technologies for next-generation cyber-physical systems. Sensors 2018, 18, 3443. [Google Scholar] [CrossRef] [Green Version]
  51. Menini, P.; Parret, F.; Guerrero, K.; Soulantica, K.; Erades, L.; Maisonnat, A.; Chaudret, B. CO response of a nanostructured SnO2 gas sensor doped with palladium and platinum. Sens. Actuators B Chem. 2004, 103, 111–114. [Google Scholar] [CrossRef] [Green Version]
  52. Kilicarslana, A.; Qatub, M. Exhaust gas analysis of an eight cylinder gasoline engine based on engine speed. Energy Procedia 2017, 110, 459–464. [Google Scholar] [CrossRef]
  53. Fisser, M.; Badcock, R.A.; Teal, P.D.; Hunze, A. Optimizing the sensitivity of palladium based hydrogen sensors. Sens. Actuators B Chem. 2018, 259, 10–19. [Google Scholar] [CrossRef]
  54. Meenakshi, C.; Mishra, V.N.; Dwivedi, R. Platinum and palladium doped tin oxide thick film sensors for sensing methane and hydrogen. In Proceedings of the International Conference on Communication and Electronics System Design, SPIE 8760, Jaipur, Rajasthan, India, 28 January 2013; p. 87601X. [Google Scholar] [CrossRef]
  55. Fu, Y.; Bian, C.; Kuang, J.; Wang, J.; Tong, J.; Xia, S. A palladium-tin modified microband electrode array for nitrate determination. Sensors 2015, 15, 23249–23261. [Google Scholar] [CrossRef] [PubMed] [Green Version]
  56. Moon, J.; Park, J.A.; Lee, S.J.; Zyung, T.; Kim, I.D. Pd-doped TiO2 nanofiber networks for gas sensor applications. Sens. Actuators B Chem. 2010, 149, 301–305. [Google Scholar] [CrossRef]
  57. Fedorenko, G.; Oleksenko, L.; Maksymovych, N.; Skolyar, G.; Ripko, O. Semiconductor gas sensors based on Pd/SnO2 nanomaterials for methane detection in air. Nanoscale Res. Lett. 2017, 12, 329. [Google Scholar] [CrossRef] [Green Version]
  58. Yin, X.-T.; Guo, X.-M. Selectivity and sensitivity of Pd-loaded and Fe-doped SnO2 sensor for CO detection. Sens. Actuators B Chem. 2014, 200, 213–218. [Google Scholar] [CrossRef]
  59. Tasaltin, C. Sensor properties of Pd doped SnO2 nanofiber enshrouded with functionalized MWCNT. arXiv 2019, arXiv:1906.03031. [Google Scholar]
  60. Wang, L.; Fu, H.; Jin, O.; Jin, H.; Haick, H.; Wang, S.; Yu, K.; Dengh, S.; Wang, Y. Directly transforming SnS2 nanosheets to hierarchical SnO2 nanotubes: Towards sensitive and selective sensing of acetone at relatively low operating temperatures. Sens. Actuators B Chem. 2019, 292, 148–155. [Google Scholar] [CrossRef]
  61. Sayago, I.; Aleixandre, M.; Santos, J.P. Development of tin oxide-based nanosensors for electronic nose environmental applications. Biosensors 2019, 9, 21. [Google Scholar] [CrossRef] [Green Version]
  62. Zheng, Y.; Qiao, Q.; Wang, J.; Li, X.; Jian, J. Gas sensing behavior of palladium oxide for carbon monoxide at low working temperature. Sens. Actuators B Chem. 2015, 212, 256–263. [Google Scholar] [CrossRef]
  63. Wang, P.; Yuan, T.; Yuan, H.; Zheng, X.; Ijaz, H.; Hui, J.; Fan, D.; Zhao, Y.; Hu, S. PdO/SnO2 heterostructure for low-temperature detection of CO with fast response and recovery. RSC Adv. 2019, 9, 22875–22882. [Google Scholar] [CrossRef] [Green Version]
  64. Absalan, S.; Nasresfahani, S.; Sheikhi, M.H. High-performance carbon monoxide gas sensor based on palladium/tin oxide/porous graphitic carbon nitride nanocomposite. J. Alloy. Compd. 2019, 795, 79–90. [Google Scholar] [CrossRef]
  65. Tian, W.; Liu, X.; Yu, W. Research progress of gas sensor based on graphene and its derivatives: A review. Appl. Sci. 2018, 8, 1118. [Google Scholar] [CrossRef] [Green Version]
  66. Singh, D.; Kundu, V.S.; Maan, A.S. Structural, morphological and gas sensing study of palladium doped tin oxide nanoparticles synthesized via hydrothermal technique. J. Mol. Struct. 2015, 1100, 562–569. [Google Scholar] [CrossRef]
Figure 1. Synthesis process flow of SnO2.
Sensors 20 05889 g001
Figure 2. Contact pads fixed on alumina substrate with the coated sensing material connected by lead-coated copper wires in series of (a) three sensor array (b) eight sensor array.
Sensors 20 05889 g002
Figure 3. Experimental set-up for real-time sensor testing. (a) Sensor arrangement inside chamber with an exhaust gas analyser and a commercial CO sensor MQ-7. (b) Gas chamber with sensor arrangement connected to the measurement setup using external lead. (c) Data collection from chamber by the data acquisition system, continuously recording the values. (d) Test-vehicle engine connected to the inlet of the chamber.
Sensors 20 05889 g003
Figure 4. XRD pattern showing the peaks that matched the product to be SnO2.
Sensors 20 05889 g004
Figure 5. X-ray diffraction intensity of pure SnO2, SnO2 with 0.1% Pd (labeled as 0.001 pd), SnO2 with 0.2% Pd (labeled as 0.002 pd) and SnO2 with 0.3% Pd (labeled as 0.003 pd), given in count values at an angle 2θ.
Sensors 20 05889 g005
Figure 6. FESEM image showing the particle size of (a) SnO2, (b) SnO2 with 0.1% Pd, (c) SnO2 with 0.2% Pd, (d) SnO2 with 0.3% Pd.
Sensors 20 05889 g006
Figure 7. Energy-dispersive X-ray elemental mapping analysis. (a) EDX spectrum of SnO2. (b) EDX mapping of elements O and Sn in SnO2. (c) EDX spectrum of SnO2 with 0.1% Pd. (d) EDX mapping of elements O, Pd, and Sn in SnO2 with 0.1% Pd. (e) EDX spectrum of SnO2 with 0.2% Pd. (f) EDX mapping of elements O, Pd, and Sn in SnO2 with 0.2% Pd. (g) EDX spectrum of SnO2 with 0.3% Pd. (h) EDX mapping of elements O, Pd, and Sn in SnO2 with 0.3% Pd.
Sensors 20 05889 g007aSensors 20 05889 g007b
Figure 8. Comparison of change in voltage for pure SnO2 as well as with different concentrations 0.1%, 0.2%, 0.3% of palladium and commercial CO sensor MQ-7, tested for 60 min @1000 rpm, connected as (a) three sensor array and (b) eight sensor array.
Sensors 20 05889 g008
Figure 9. Change in voltage for eight sensor array of pure SnO2 as well as with different concentrations 0.1%, 0.2%, 0.3% of palladium and commercial CO sensor MQ-7, during repeatability test @1000 rpm.
Sensors 20 05889 g009
Figure 10. Change in voltage for eight sensor array of pure SnO2 as well as with different concentrations 0.1%, 0.2%, 0.3% of palladium and commercial CO sensor MQ-7, @1000 rpm, 2000 and 4000 rpm.
Sensors 20 05889 g010
Publisher’s Note: MDPI stays neutral with regard to jurisdictional claims in published maps and institutional affiliations.

