Chick Embryo Growth Modeling Using Near-Infrared Sensor and Non-Linear Least Square Fitting of Egg Opacity Values

 , ,
, ,
Abstract
1. Introduction
2. Materials and Methods
2.1. Materials
2.2. Experimental Protocols
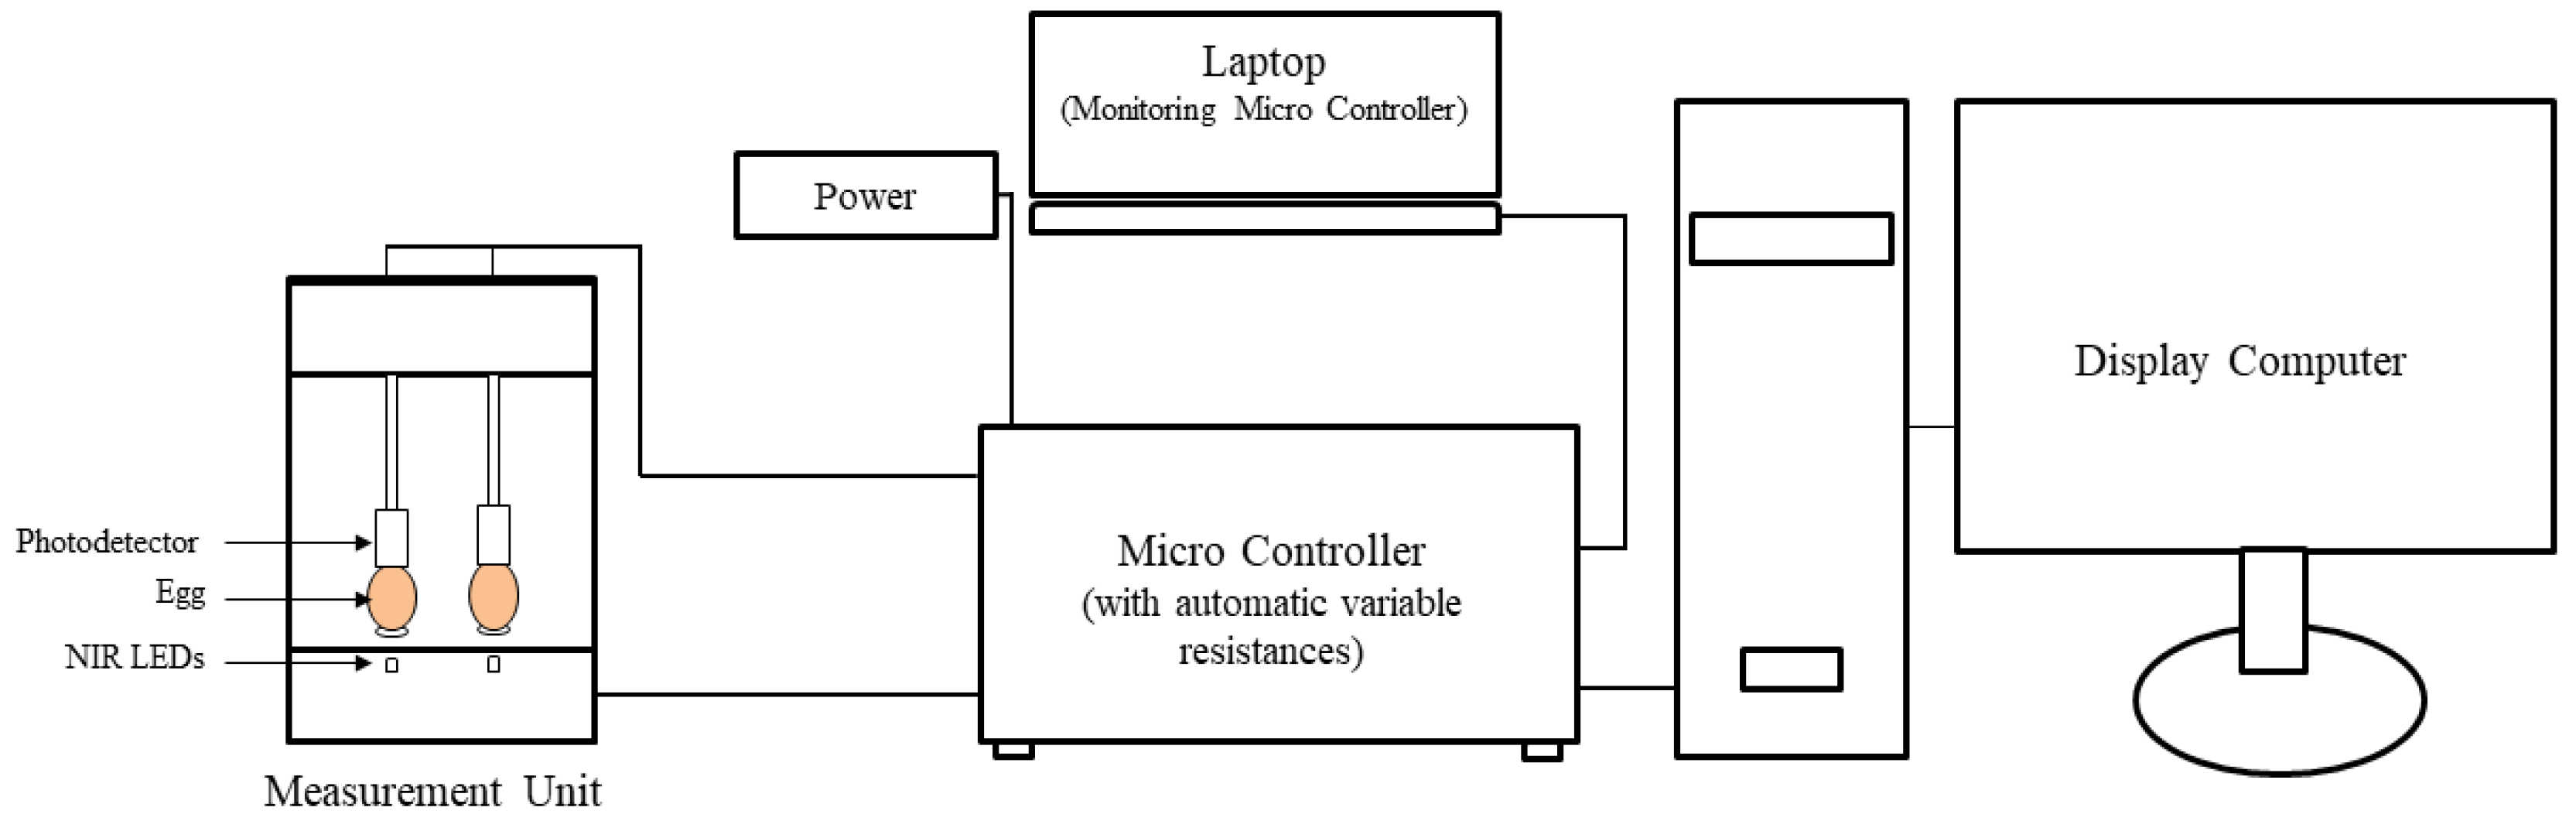
2.3. Near-Infrared Sensor
2.4. Calculation of Egg Opacity Value
2.5. Data Analysis and Curve Fittings
3. Results
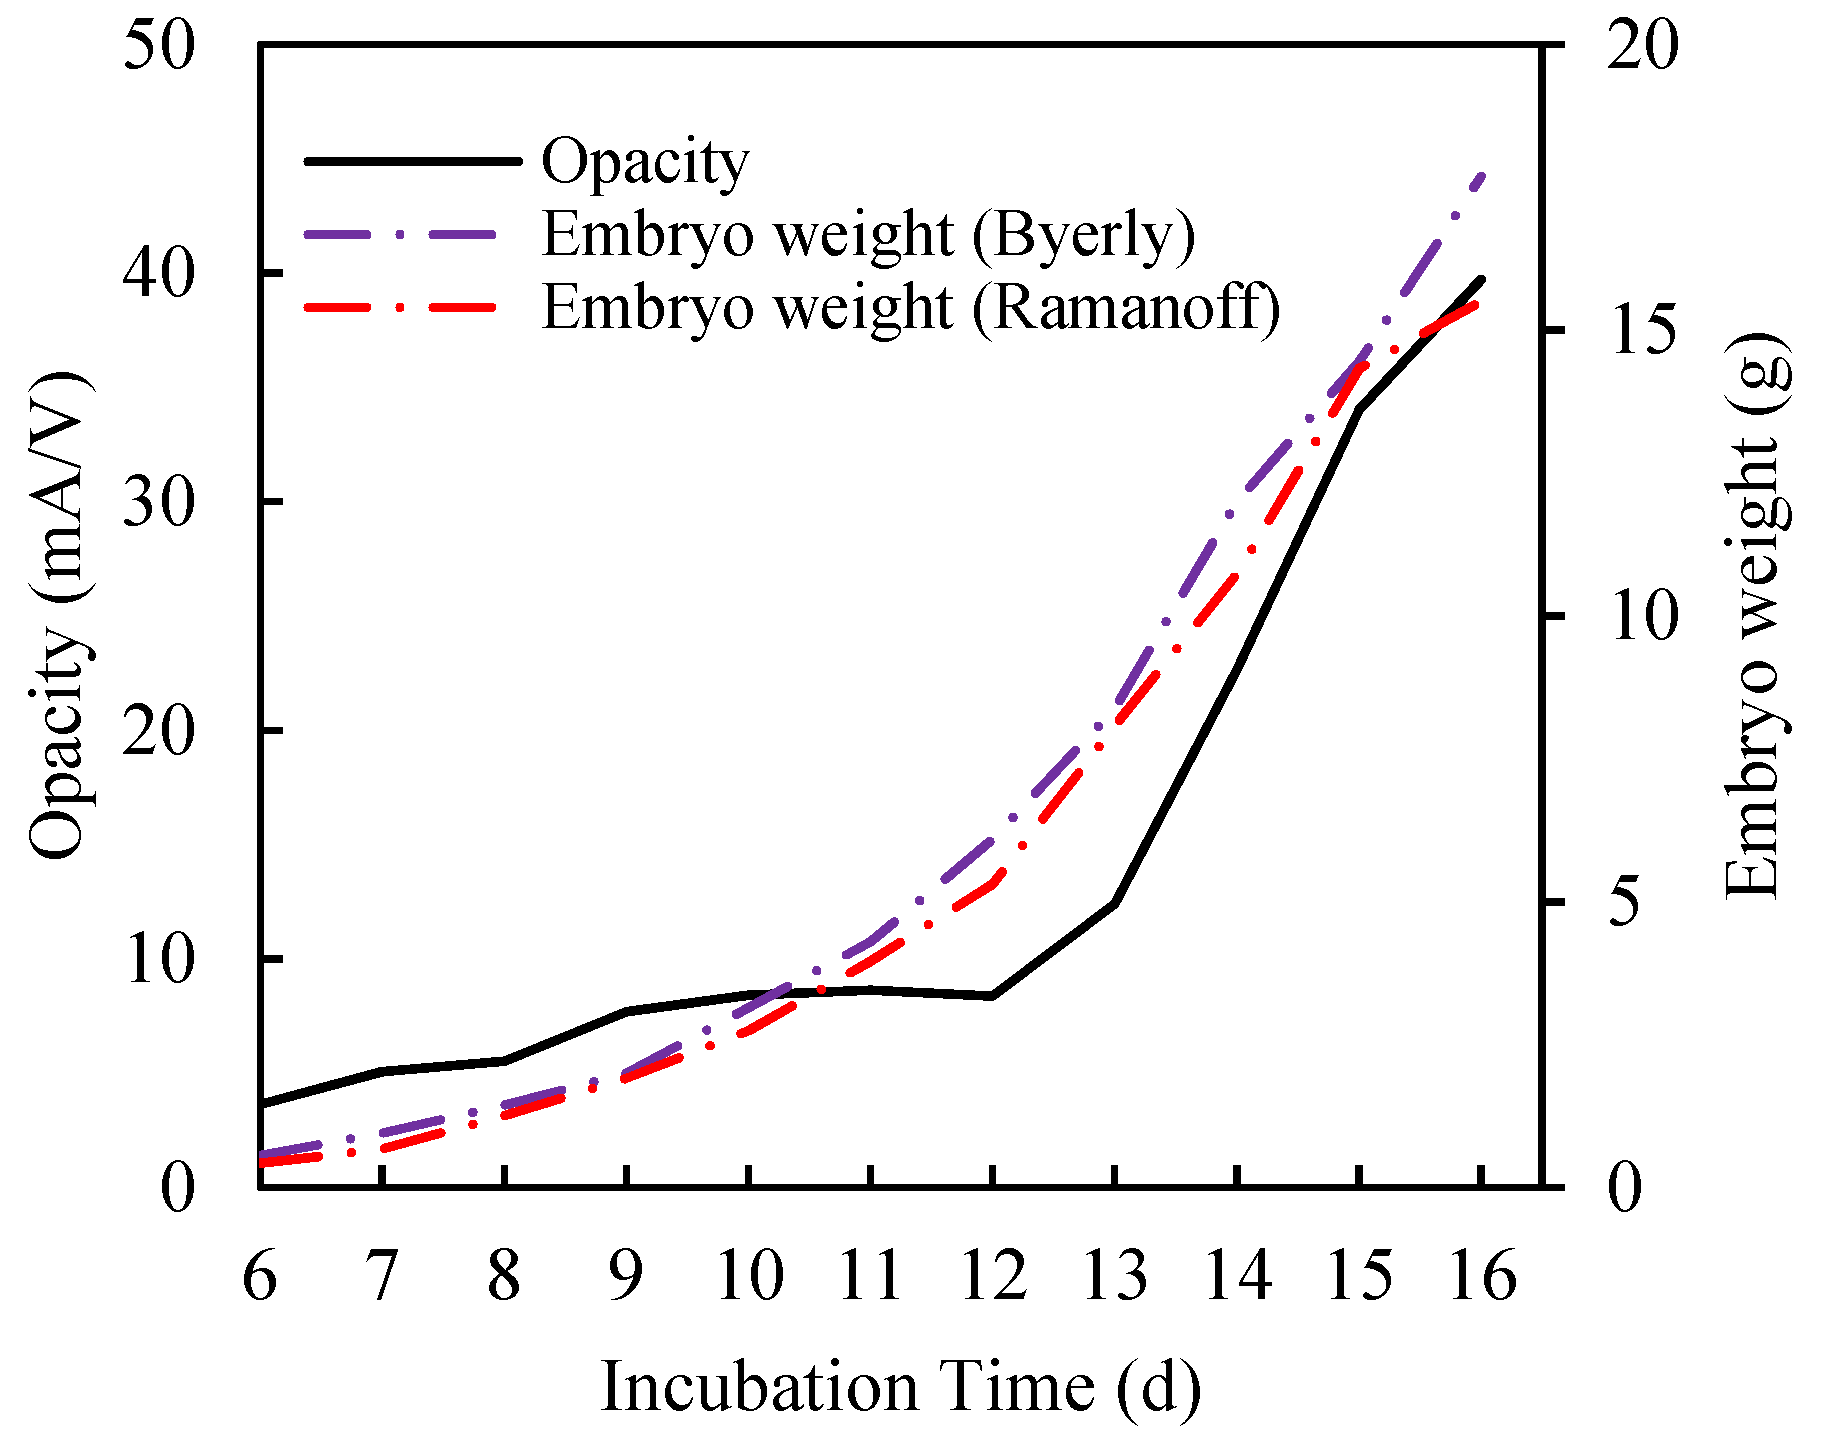
3.1. Physical Meaning of Opacity Curve
3.2. Growth Dependency of Opacity Curve
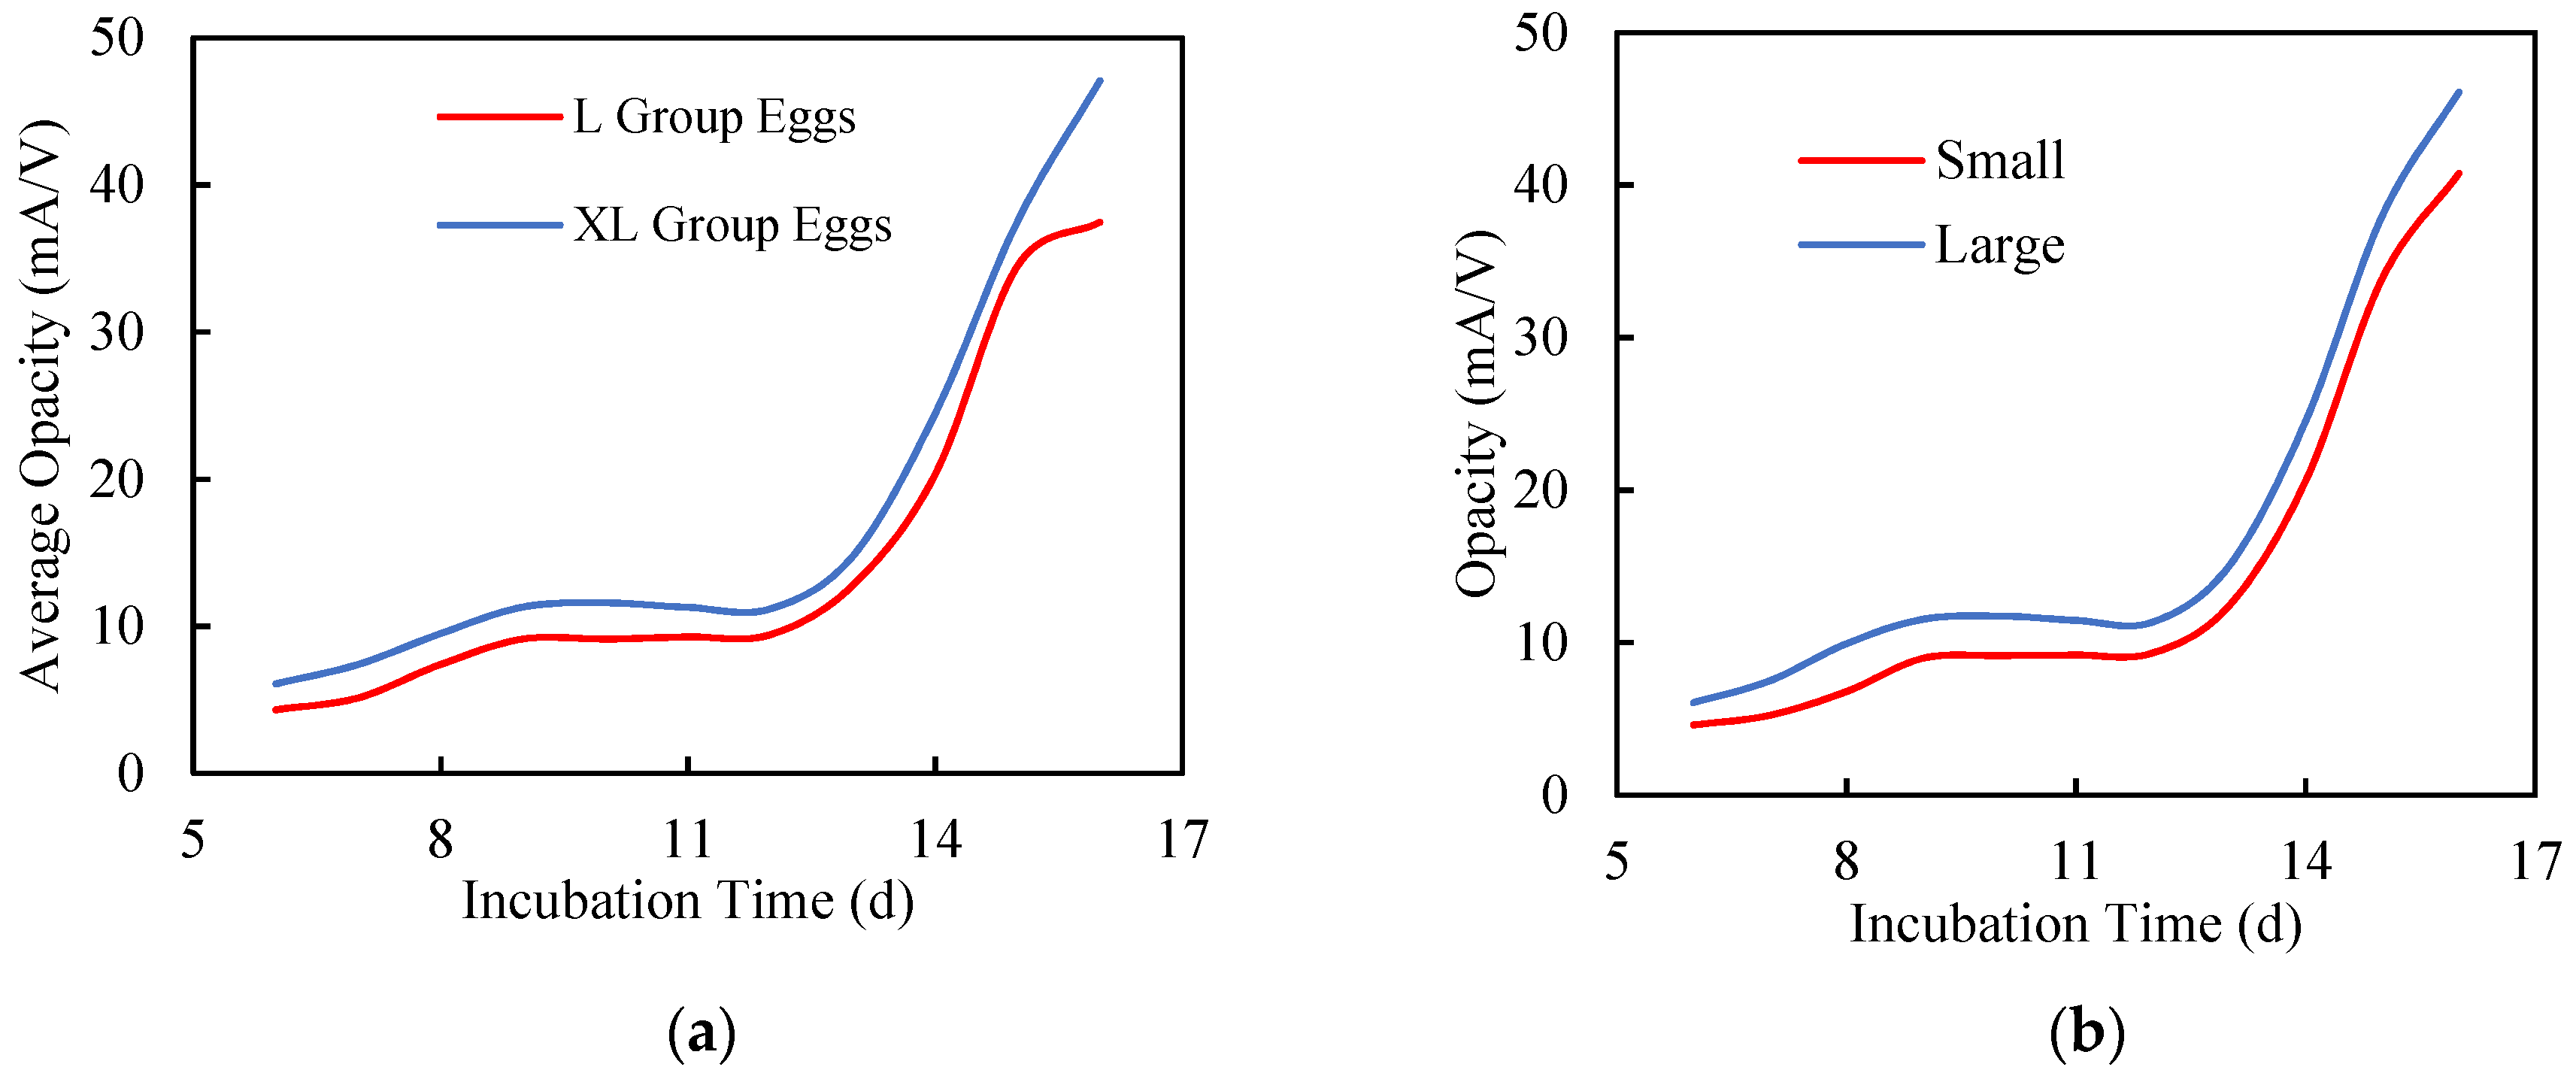
3.2.1. Egg Size
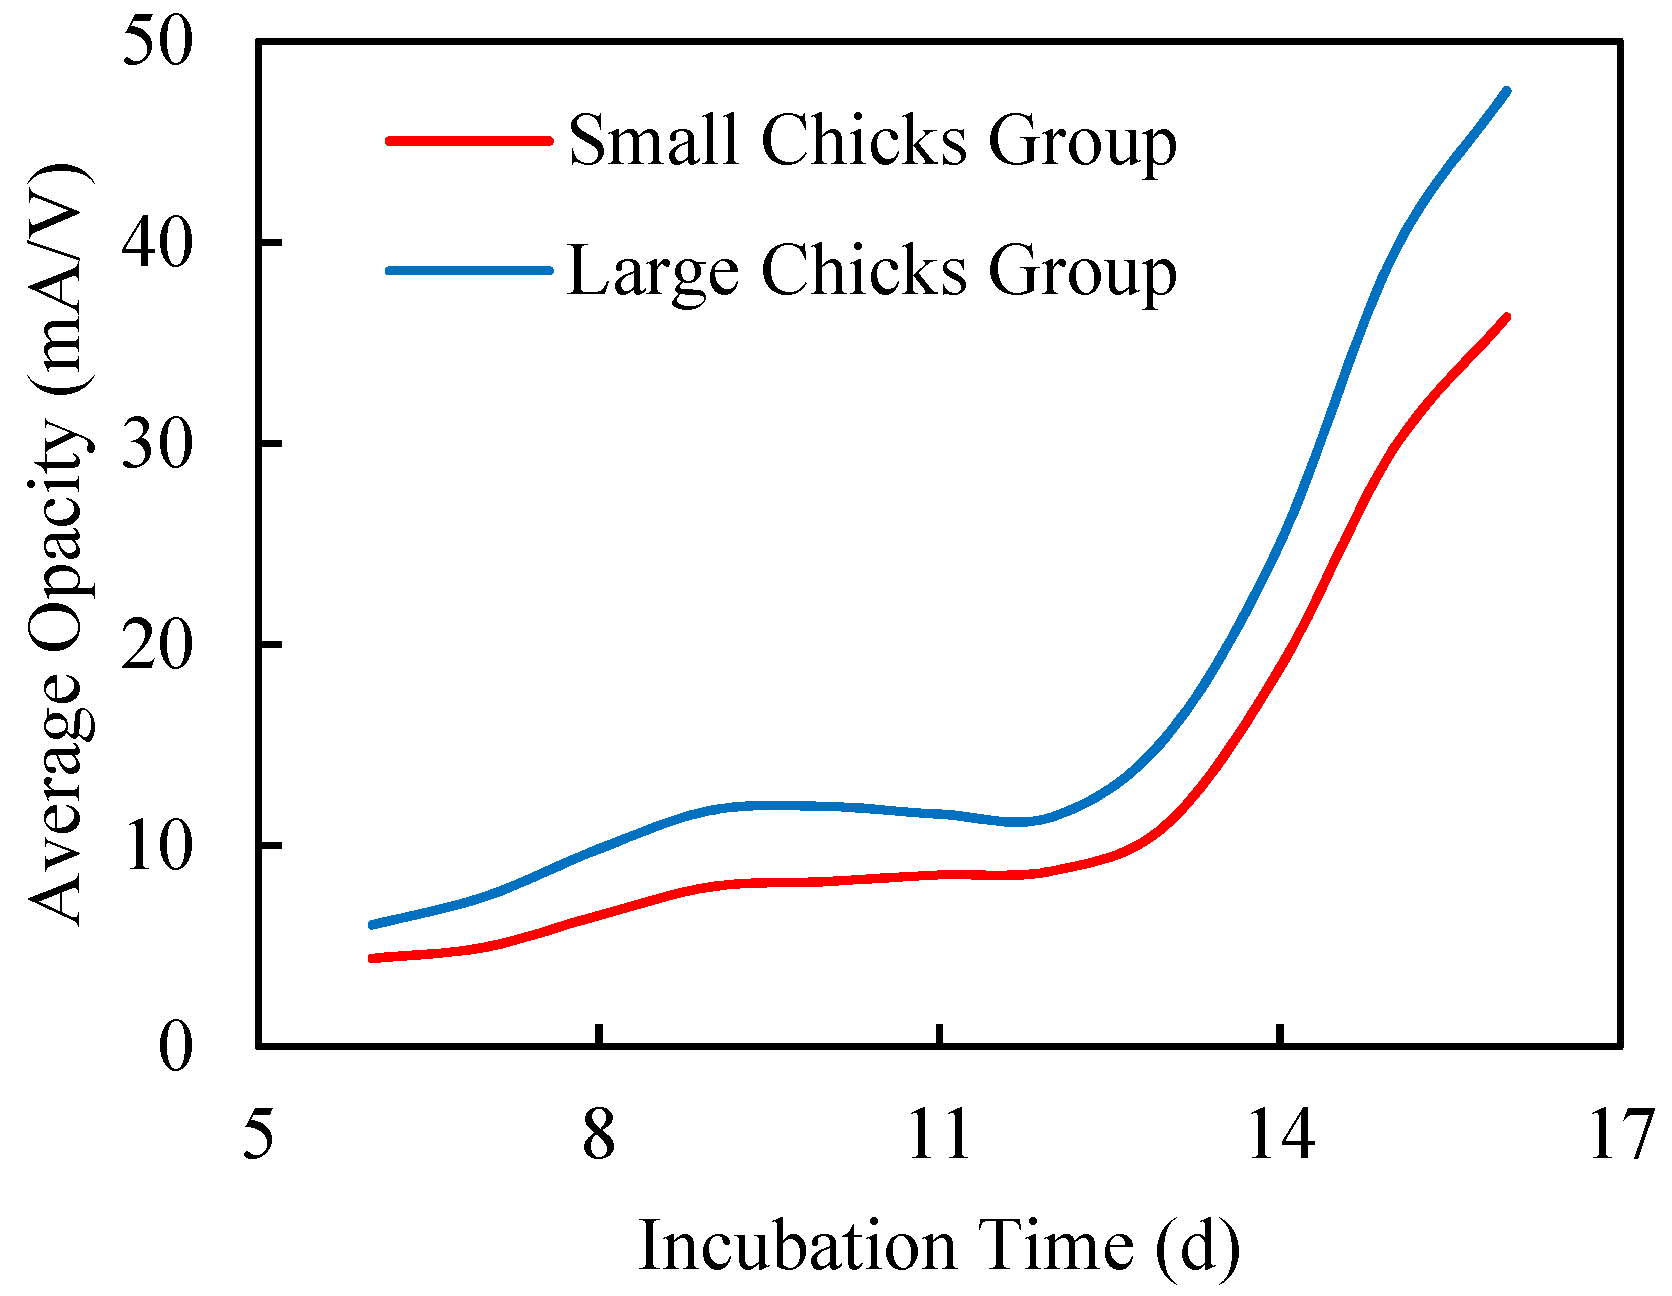
3.2.2. Chick Size
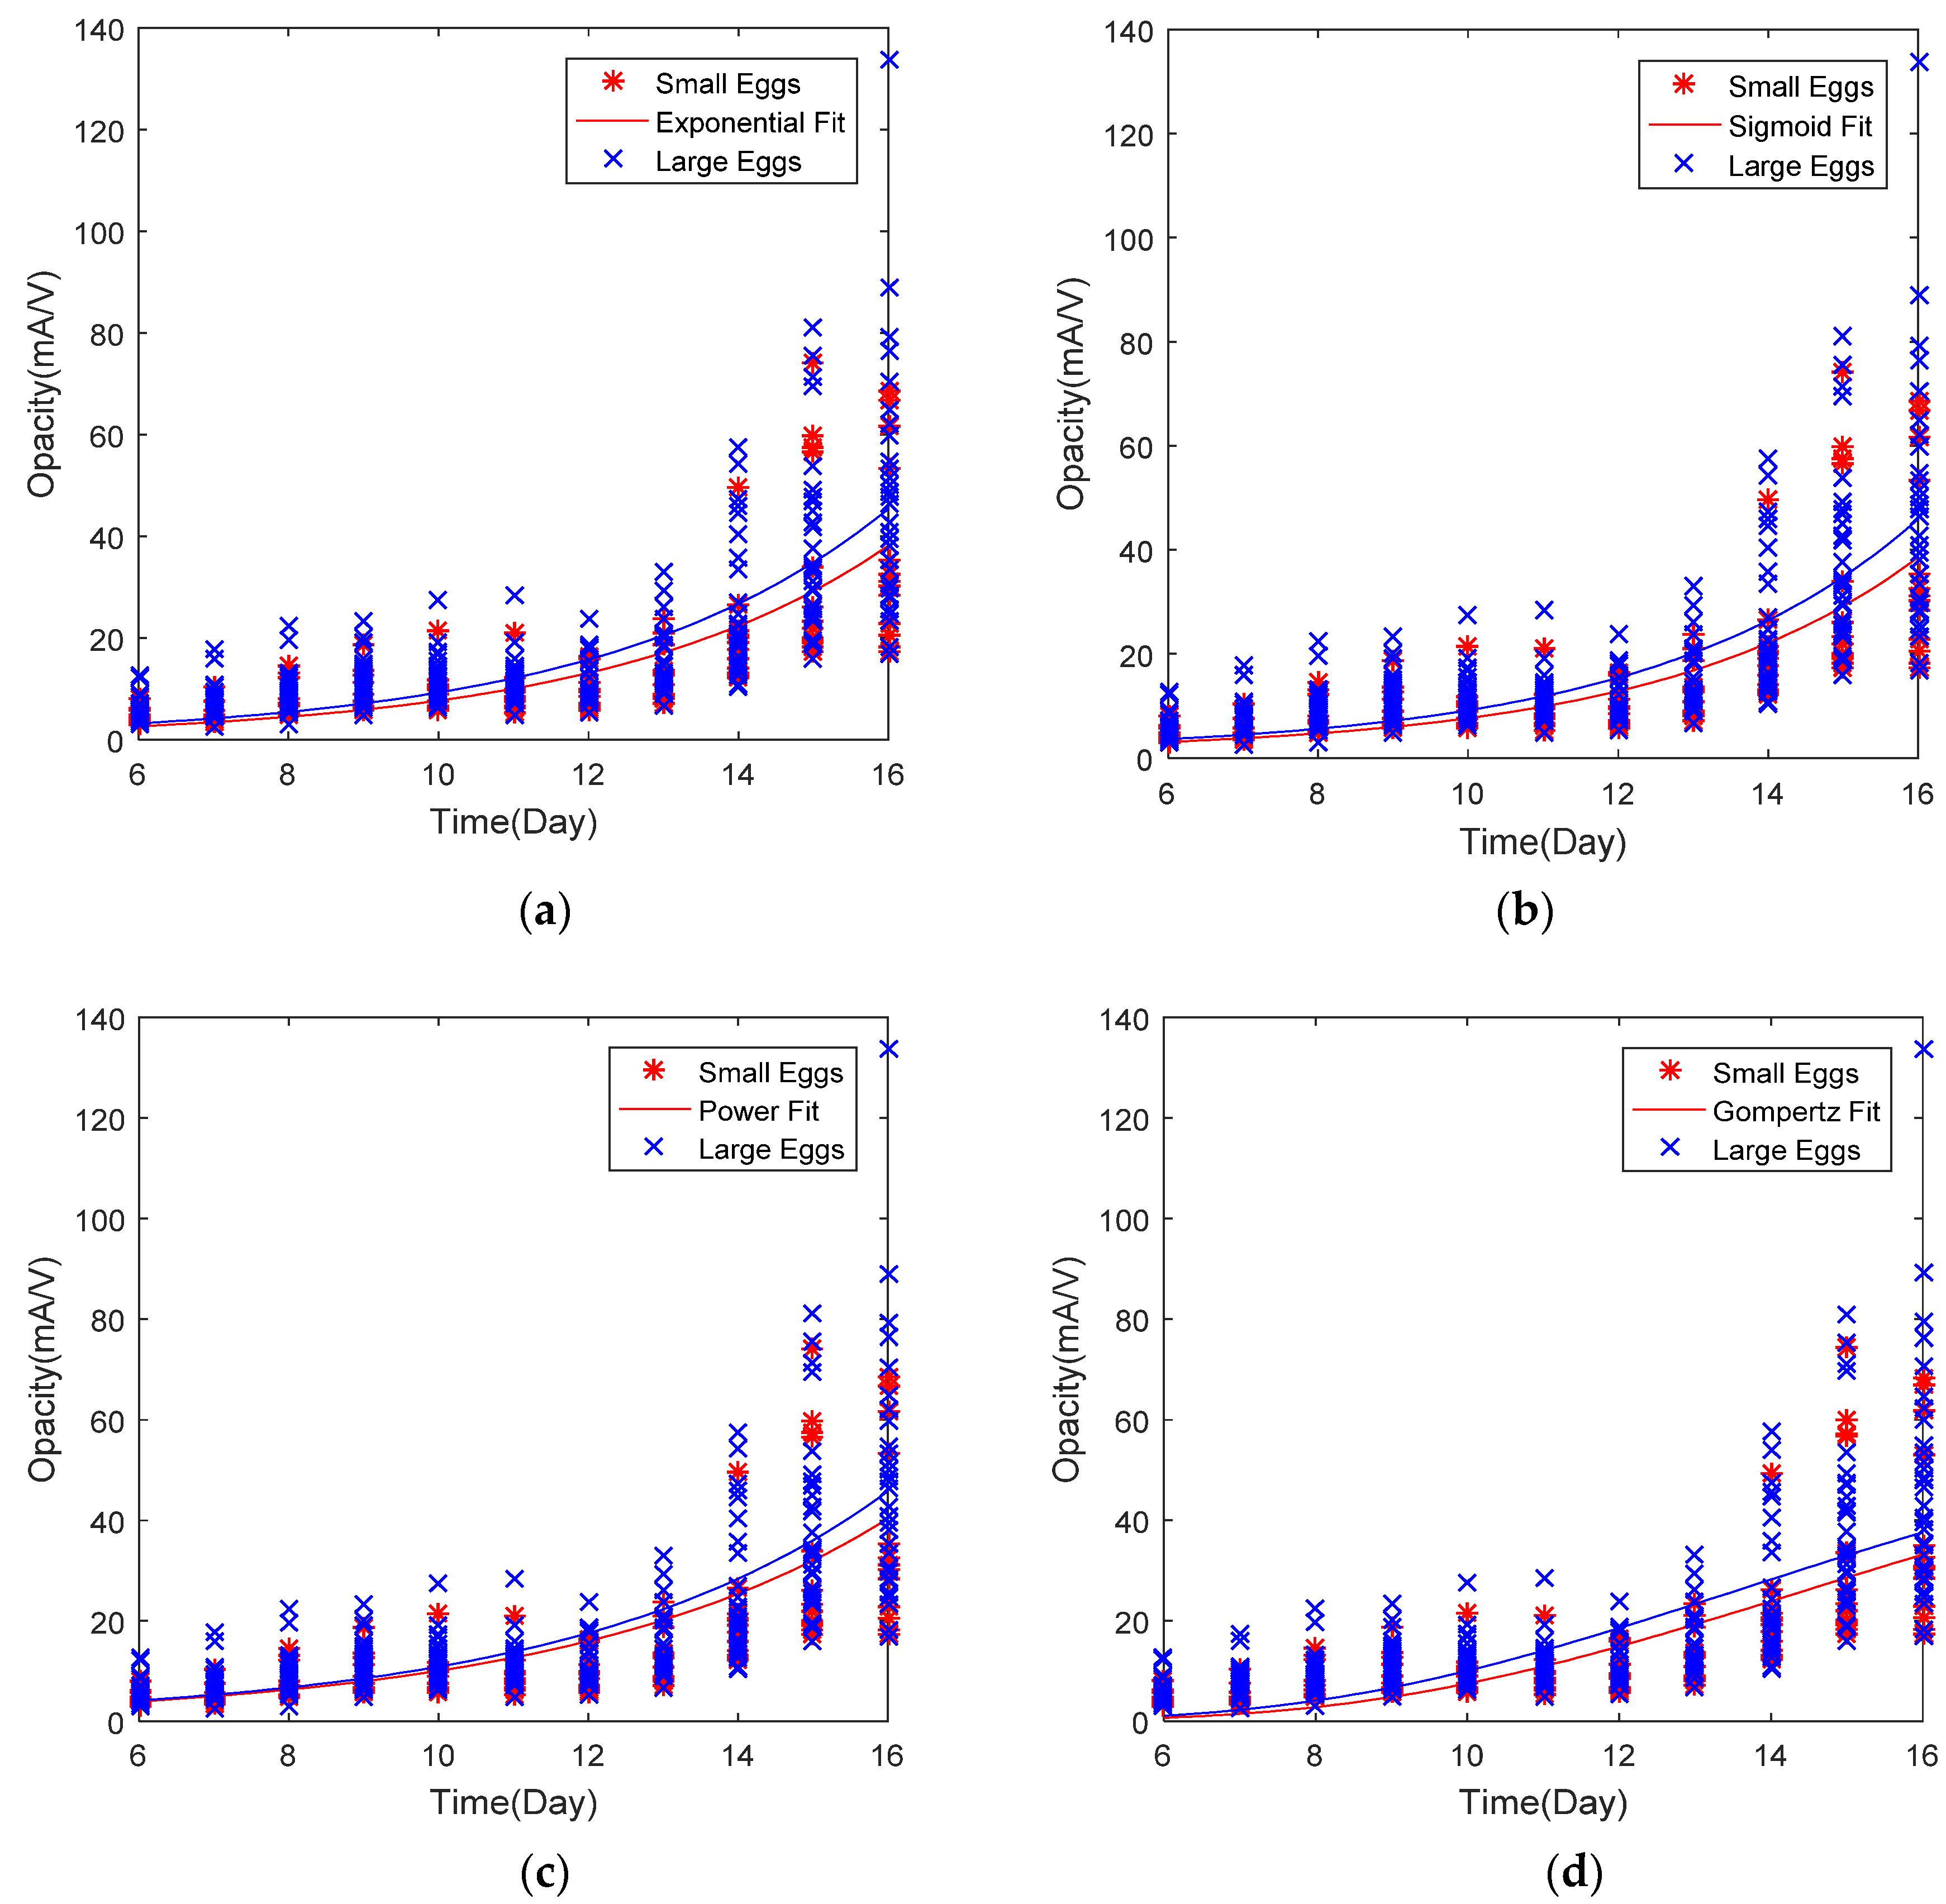
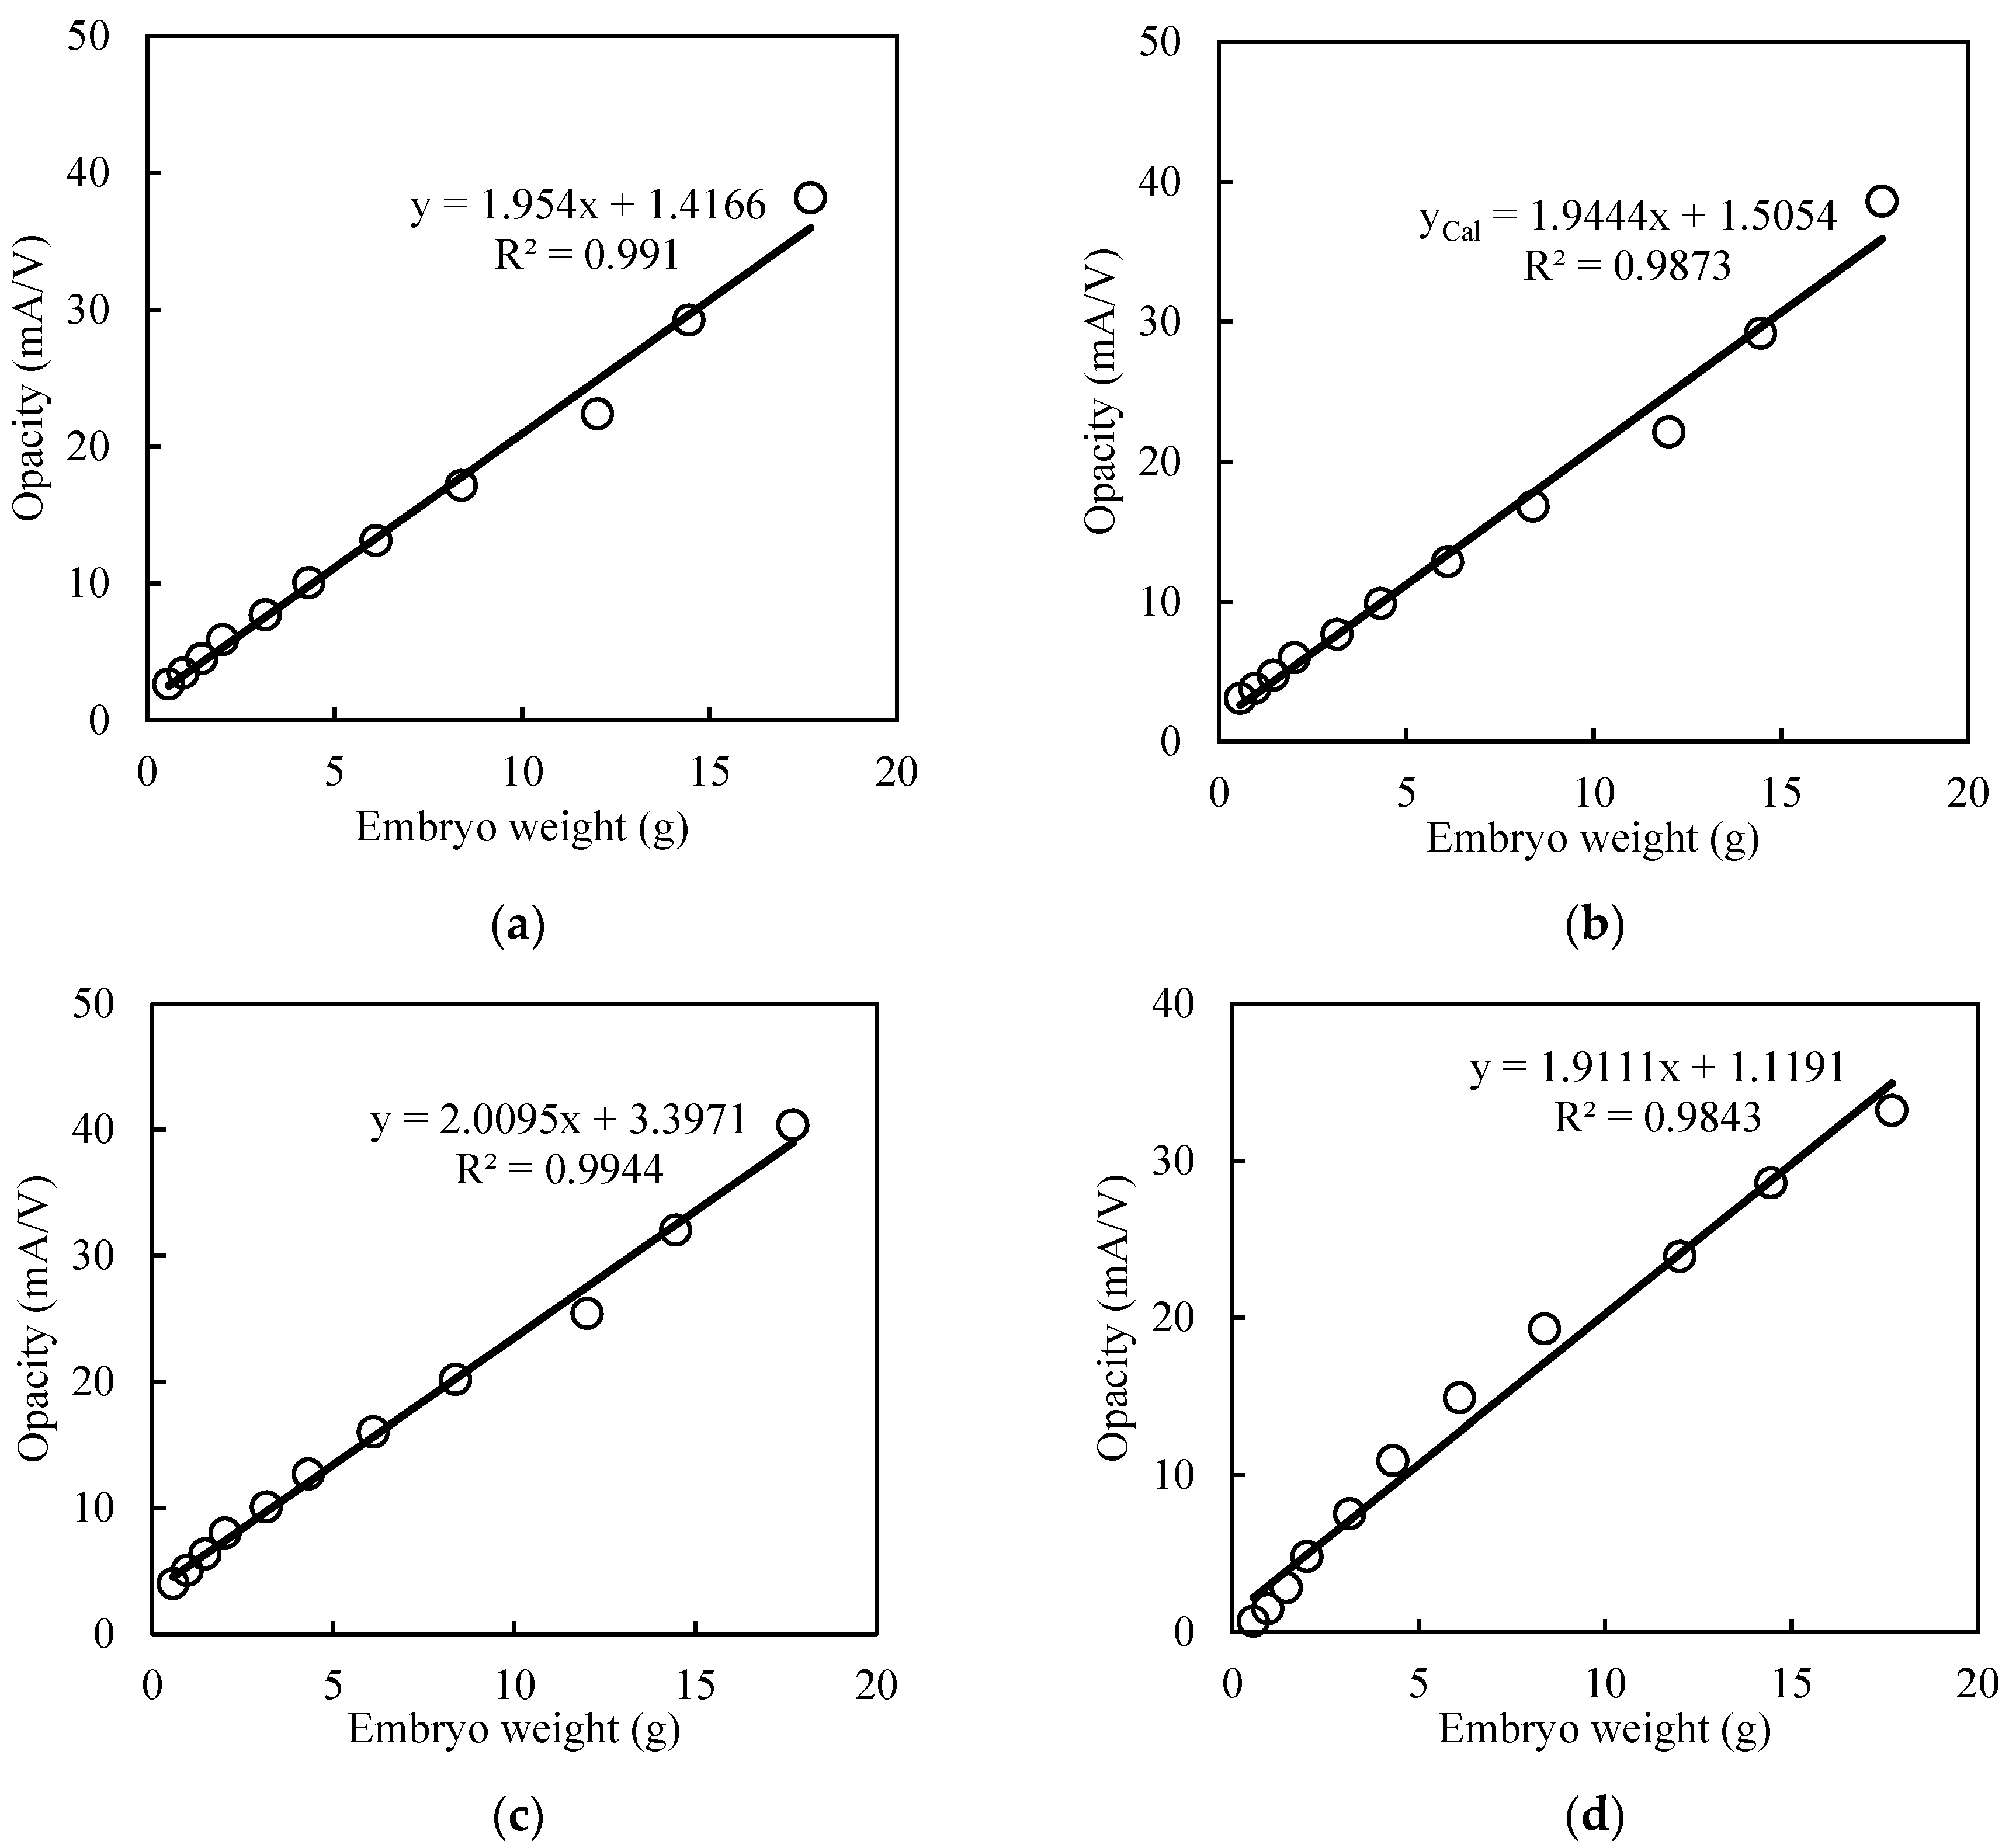
3.3. Curve Fitting and Mathematical Growth Models
4. Conclusions
Author Contributions
Funding
Acknowledgments
Conflicts of Interest
References
- Smith, D.P.; Mauldin, J.M.; Lawrence, K.C.; Park, B.; Heitschmidt, G.W. Detection of fertility and early development of hatching eggs with hyperspectral imaging. In Proceedings of the XI th European Symposium on the Quality of Eggs and Egg Products, Doorwerth, The Netherlands, 23–26 May 2005. [Google Scholar]
- Liu, L.; Ngadi, M.O. Detecting fertility and early embryo development of chicken eggs using near-infrared hyperspectral imaging. Food Bioprocess Technol. 2012, 6, 2503–2513. [Google Scholar] [CrossRef]
- Islam, H.; Kondo, N.; Ogawa, Y.; Fujiura, T.; Ogawa, Y.; Fujitani, S. Detection of infertile eggs using visible transmission spectroscopy combined with multivariate analysis. Eng. Agric. Environ. Food 2017, 10, 115–120. [Google Scholar] [CrossRef]
- Khaliduzzaman, A.; Fujitani, S.; Kondo, N.; Syduzzaman; Rahman, A.; Suzuki, T.; Ogawa, Y.; Kashimori, A.; Fujiura, T. Cardiac signal behavior of early and late hatch chick embryos during incubation. Comput. Electron. Agric. 2018, 148, 188–196. [Google Scholar] [CrossRef]
- Khaliduzzaman, A.; Fujitani, S.; Kondo, N.; Ogawa, Y.; Fujiura, T.; Suzuki, T.; Kashimori, A.; Syduzzaman, M.; Rahman, A. Non-invasive characterization of chick embryo body and cardiac movements using near infrared light. In Engineering in Agriculture, Environment and Food; Elsevier: Amsterdam, The Netherlands, 2019; Volume 12, pp. 32–39. [Google Scholar] [CrossRef]
- Islam, H.; Kondo, N.; Ogawa, Y.; Fujiura, T.; Ogawa, Y.; Nakajima, S.; Fujitani, S. Prediction of chick hatching time using visible transmission spectroscopy combined with partial least squares regression. Eng. Agric. Environ. Food 2015, 8, 61–66. [Google Scholar] [CrossRef]
- Syduzzaman, M.; Rahman, A.; Alin, K.; Fujitani, S.; Kashimori, A.; Suzuki, T.; Ogawa, Y.; Kondo, N.; Afzal, R. Noninvasive quantification of yolk content using Vis-NIR spectroscopy and its effect on hatching time and gender of broiler chicken. Eng. Agric. Environ. Food 2019, 12, 289–296. [Google Scholar] [CrossRef]
- Vleck, C.M.; Vleck, D. Patterns of metabolism and growth in avian embryos. Am. Zool. 1980, 20, 405–416. [Google Scholar] [CrossRef]
- Kemps, B.J.; Bamelis, F.R.; Mertens, K.; Decuypere, E.M.; De Baerdemaeker, J.G.; De Ketelaere, B. Assessment of embryonic growth in chicken eggs by means of visible transmission spectroscopy. Biotechnol. Prog. 2009, 26, 512–516. [Google Scholar] [CrossRef] [PubMed]
- Hamburger, V.; Hamilton, H.L. A series of normal stages in the development of the chick embryo. Dev. Dyn. 1992, 195, 231–272. [Google Scholar] [CrossRef] [PubMed]
- Tong, Q.; Romanini, C.; Exadaktylos, V.; Bahr, C.; Berckmans, D.; Bergoug, H.; Eterradossi, N.; Roulston, N.; Verhelst, R.; McGonnell, I.M.; et al. Embryonic development and the physiological factors that coordinate hatching in domestic chickens. Poult. Sci. 2013, 92, 620–628. [Google Scholar] [CrossRef] [PubMed]
- Khaliduzzaman, A.; Fujitani, S.; Kashimori, A.; Suzuki, T.; Ogawa, Y.; Kondo, N. A non-invasive diagnosis technique of chick embryonic cardiac arrhythmia using near infrared light. Comput. Electron. Agric. 2019, 158, 326–334. [Google Scholar] [CrossRef]
- Ricklefs, R.E. Embryo growth rates in birds and mammals. Funct. Ecol. 2010, 24, 588–596. [Google Scholar] [CrossRef]
- Newbrey, J.L.; Reed, W.L. Growth of yellow-headed blackbirdXanthocephalus xanthocephalusnestlings in relation to maternal body condition, egg mass, and yolk carotenoids concentrations. J. Avian Biol. 2009, 40, 419–429. [Google Scholar] [CrossRef]
- Galli, R.; Preusse, G.; Uckermann, O.; Bartels, T.; Krautwald-Junghanns, M.-E.; Koch, E.; Steiner, G. In ovo sexing of chicken eggs by fluorescence spectroscopy. Anal. Bioanal. Chem. 2016, 409, 1185–1194. [Google Scholar] [CrossRef] [PubMed]
- Available online: http://ci.nii.ac.jp/naid/40021910714/en/ (accessed on 29 January 2020).
- Byerly, T.C. Growth of the chick embryo in relation to its food supply. J. Exp. Biol. 1932, 9, 15–44. Available online: http://jeb.biologists.org/content/9/1/15.short (accessed on 29 January 2020).
- Alin, K.; Fujitani, S.; Kashimori, A.; Suzuki, T.; Ogawa, Y.; Kondo, N. Non-invasive broiler chick embryo sexing based on opacity value of incubated eggs. Comput. Electron. Agric. 2019, 158, 30–35. [Google Scholar] [CrossRef]
- Romanoff, A.L. Effect of humidity on the growth, calcium metabolism, and mortality of the chick embryo. J. Exp. Zool. 1929, 54, 343–348. [Google Scholar] [CrossRef]
- Nijhout, H.F.; Ecallier, V. A new mathematical approach for qualitative modeling of the insulin-TOR-MAPK network. Front. Physiol. 2013, 4, 245. [Google Scholar] [CrossRef] [PubMed]
- Mortola, J.P.; Al Awam, K. Growth of the chicken embryo: Implications of egg size. Comp. Biochem. Physiol. Part A Mol. Integr. Physiol. 2010, 156, 373–379. [Google Scholar] [CrossRef]
- Metcalfe, J.; McCutcheon, I.E.; Francisco, D.L.; Metzenberg, A.B.; Welch, J. Oxygen availability and growth of the chick embryo. Respir. Physiol. 1981, 46, 81–88. [Google Scholar] [CrossRef]


| Groups | Egg Weight, g | Chick Weight, g |
|---|---|---|
| L (Large) Eggs | <67.1 g (n = 13) | |
| XL (Extra Large) Eggs | >67.1 g (n = 33) | |
| Small Chicks | <50.0 g (n = 14) | |
| Large Chicks | >50.0 g (n = 32) |
| Model Name | Eggs Group | Equation | RMSE (Opacity) | R2 (Fitting Curve) | R2 (Cal. Opacity vs. Embryo Wt.) |
|---|---|---|---|---|---|
| Exponential | L-Size | 14.85 | 0.558 | 0.991 | |
| XL-Size | 18.14 | 0.568 | 0.991 | ||
| Sigmoid | L-Size | 14.82 | 0.561 | 0.987 | |
| XL-Size | 18.15 | 0.573 | 0.988 | ||
| Power | L-Size | 12.51 | 0.529 | 0.994 | |
| XL-Size | 16.78 | 0.561 | 0.994 | ||
| Gompertz | L-Size | 15.42 | 0.504 | 0.984 | |
| XL-Size | 18.66 | 0.487 | 0.972 |
Publisher’s Note: MDPI stays neutral with regard to jurisdictional claims in published maps and institutional affiliations. |
© 2020 by the authors. Licensee MDPI, Basel, Switzerland. This article is an open access article distributed under the terms and conditions of the Creative Commons Attribution (CC BY) license (http://creativecommons.org/licenses/by/4.0/).
Share and Cite
Khaliduzzaman, A.; Kashimori, A.; Suzuki, T.; Ogawa, Y.; Kondo, N. Chick Embryo Growth Modeling Using Near-Infrared Sensor and Non-Linear Least Square Fitting of Egg Opacity Values. Sensors 2020, 20, 5888. https://doi.org/10.3390/s20205888
Khaliduzzaman A, Kashimori A, Suzuki T, Ogawa Y, Kondo N. Chick Embryo Growth Modeling Using Near-Infrared Sensor and Non-Linear Least Square Fitting of Egg Opacity Values. Sensors. 2020; 20(20):5888. https://doi.org/10.3390/s20205888
Chicago/Turabian StyleKhaliduzzaman, Alin, Ayuko Kashimori, Tetsuhito Suzuki, Yuichi Ogawa, and Naoshi Kondo. 2020. "Chick Embryo Growth Modeling Using Near-Infrared Sensor and Non-Linear Least Square Fitting of Egg Opacity Values" Sensors 20, no. 20: 5888. https://doi.org/10.3390/s20205888
APA StyleKhaliduzzaman, A., Kashimori, A., Suzuki, T., Ogawa, Y., & Kondo, N. (2020). Chick Embryo Growth Modeling Using Near-Infrared Sensor and Non-Linear Least Square Fitting of Egg Opacity Values. Sensors, 20(20), 5888. https://doi.org/10.3390/s20205888