Identification and Quantitative Determination of Lactate Using Optical Spectroscopy—Towards a Noninvasive Tool for Early Recognition of Sepsis †


 ,
, 
 and
and 
Abstract
:1. Introduction
2. Materials and Methods
2.1. Reagent Preparation
2.2. Instrumentation
2.2.1. UV/Visible and NIR Spectra
- Two light sources—a deuterium lamp and a halogen tungsten lamp—were used to shine light in the wavelength ranges between 300 and 319 nm and 320 and 2600 nm, respectively.
- Three photodetectors, namely, the photomultiplier tube (PMT), the indium gallium arsenide detector (InGaAs), and the lead sulfide detector (PbS), were used to detect the transmitted light photons in the regions between 300 and 860 nm, 800 and 1800 nm, and 1800 and 2600 nm, respectively. Three detectors with specified spectral ranges were used to avoid spectral/detector saturation.
- The slit setting for the InGaAs and PbS detectors were set on “servo mode”, whereby the spectrometer monitors the reference beam energy and adjusts the slits accordingly to avoid saturation of the detectors. A fixed 2 mm slit was used for the PMT detector.
- The gain of the PMT, InGaAs, and PbS detector was set to auto, 5, and 1, respectively, while the response time of all three detectors was set to 0.2 s.
- Prior to the acquisition of NaLac spectra, baseline correction was performed on the spectrophotometer at 100% transmission/0% absorbance to remove background noise. To ensure stable spectral acquisition with high signal-to-noise (SNR), the attenuation in the sample and reference beams were set to 100% and 1%, respectively.
2.2.2. Mir Spectra
- The IR source used in the spectrometer is a silicon carbide-based infrared lamp, and the detector used is a deuterated triglycine sulfate (DTGS) detector.
- The Spectrum Two FTIR spectrometer was fitted with a Horizontal Attenuated Total Reflectance (HATR) accessory containing Zince Selenide (ZnSe) crystal trough plate (PIKE Technologies, Madison, WI, USA) instead of a constant path transmission liquid cell. This was to increase the maximum sensitivity of low concentration components through internal reflections in the crystal. The ZnSe crystal is 4 mm thick, 80 mm in length, and has a refractive index of 2.4. The effective angle of incidence is 45°, thus producing 10 reflections in the crystal.
- Background spectrum without a sample was acquired every 20 minutes or between every three samples, whichever came first to remove instrumental and atmospheric contributions to the spectrum of a sample. The HATR accessory was removed while acquiring the background spectra.
2.3. Experimental Procedure
2.3.1. Acquisition of UV/Visible and NIR Spectra
2.3.2. Acquisition of MIR Spectra
2.4. Analysis of Spectra
3. Results
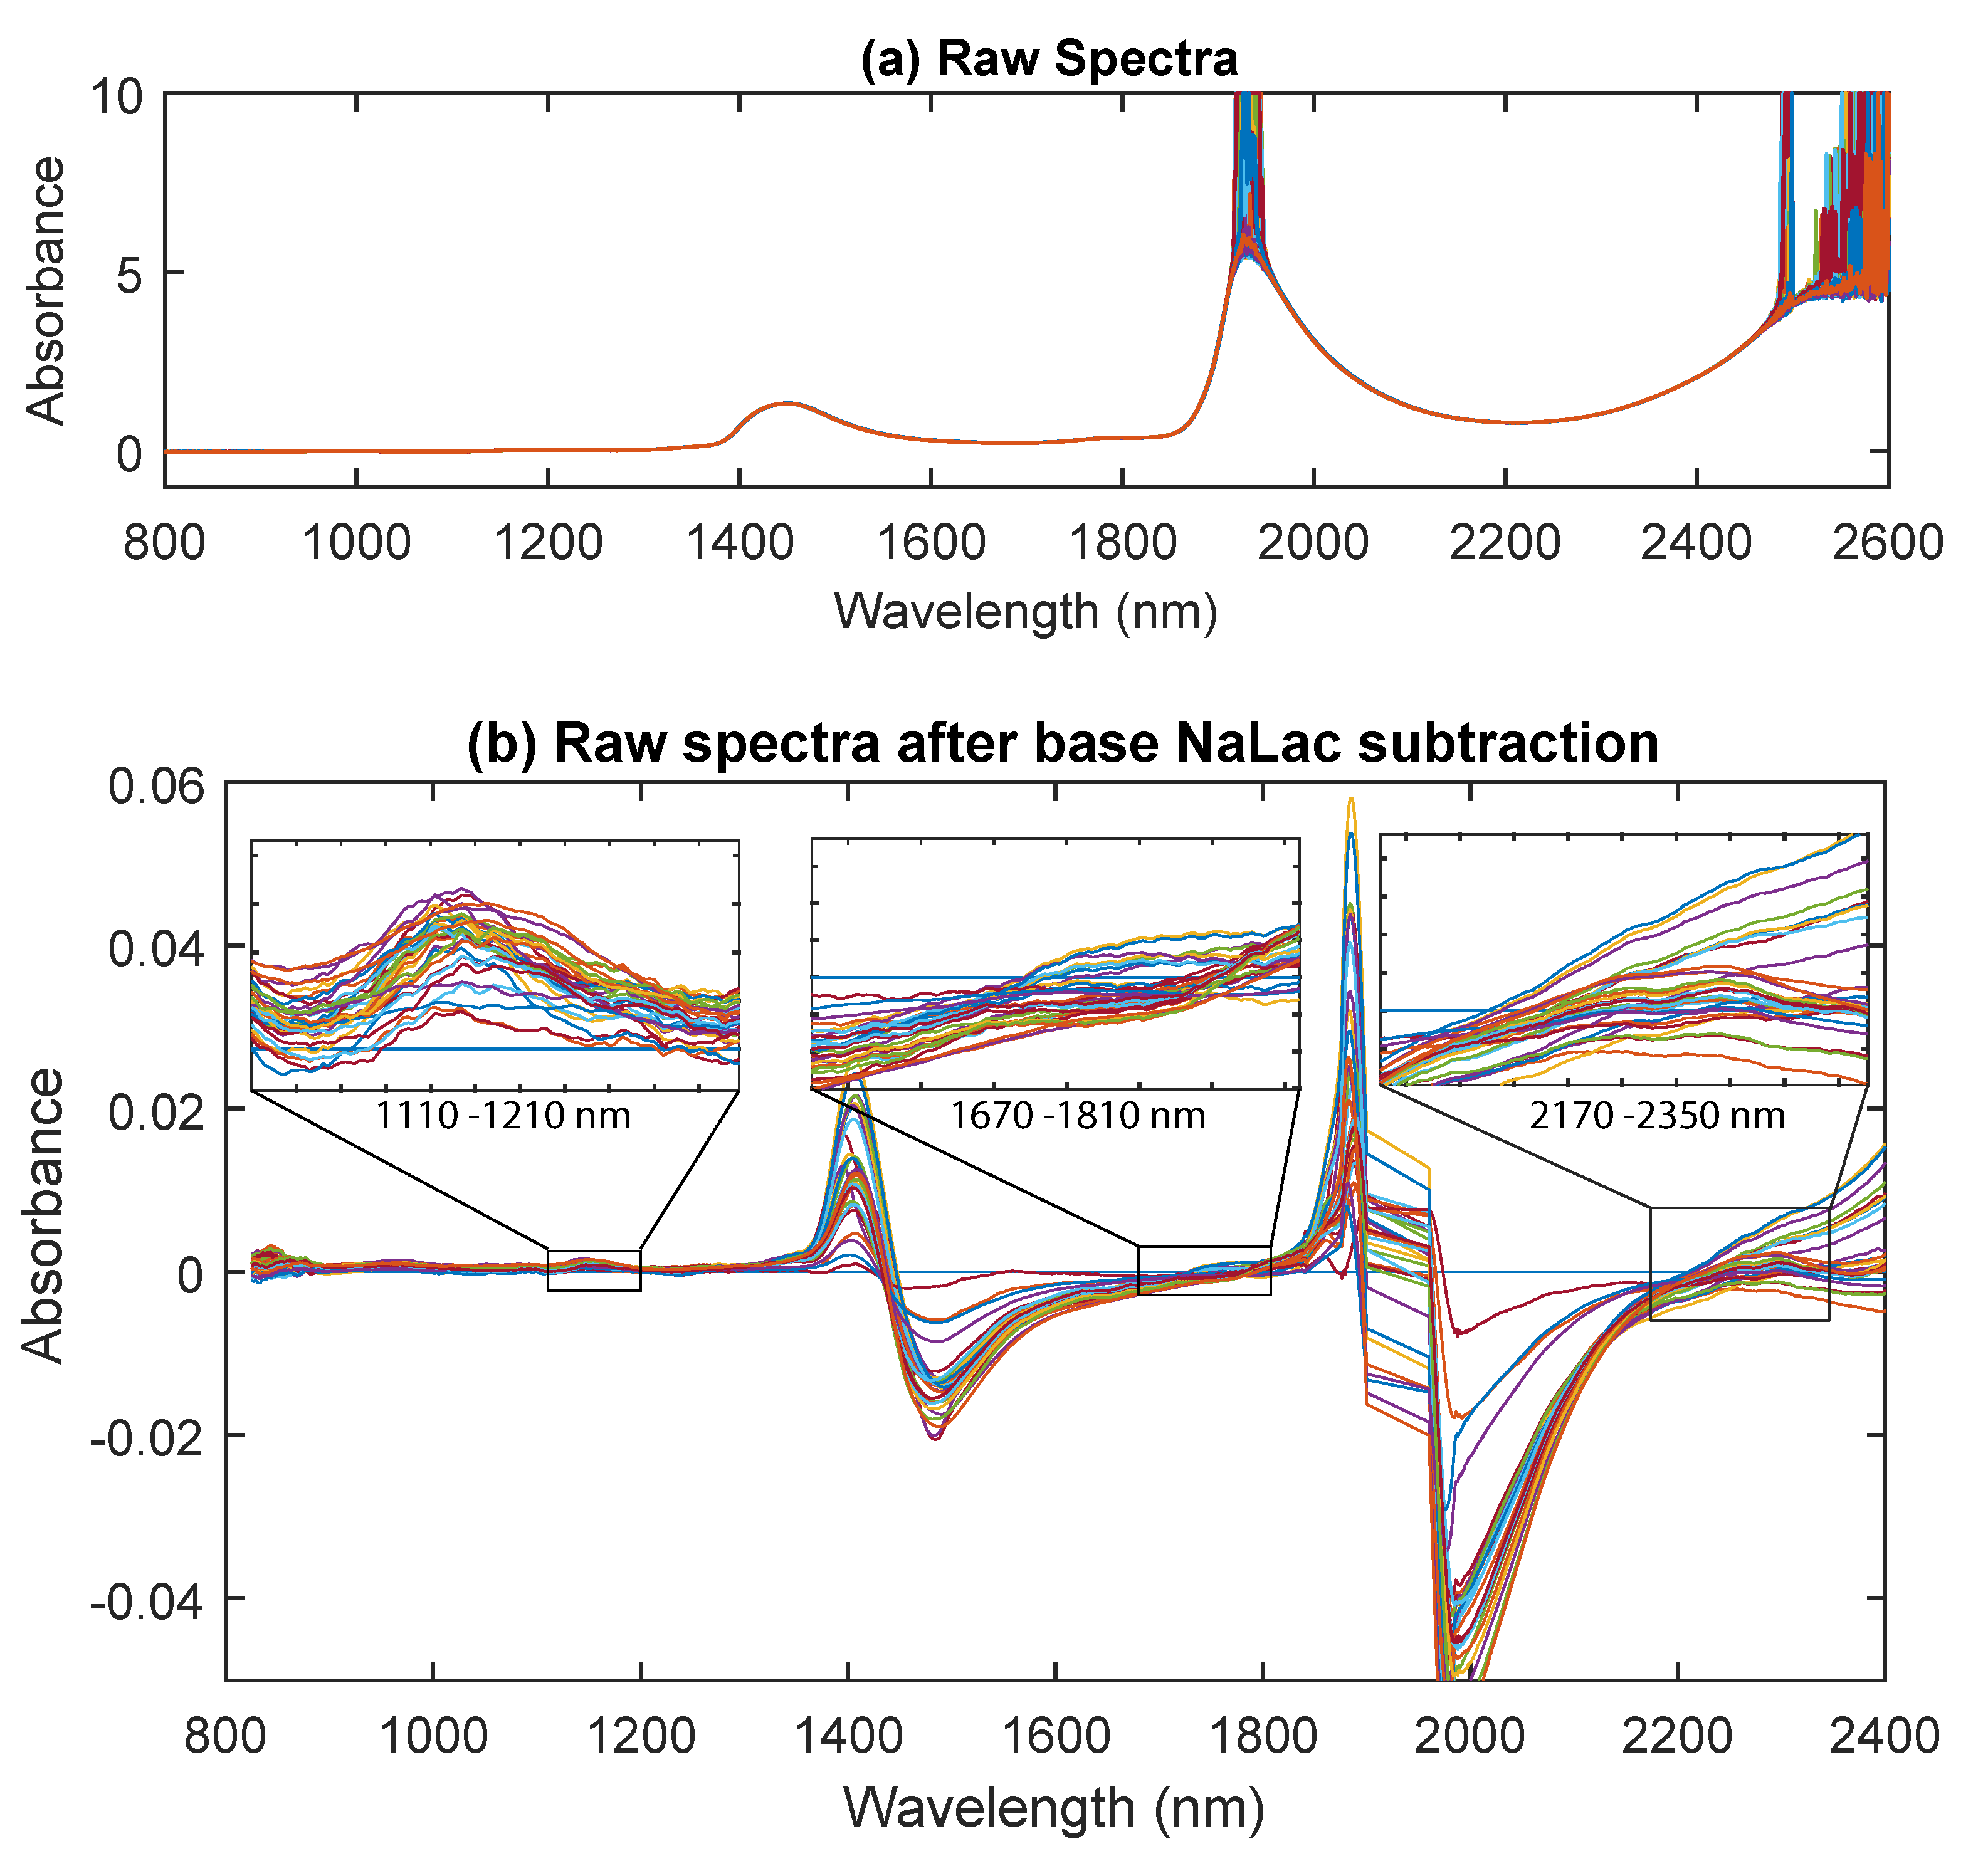
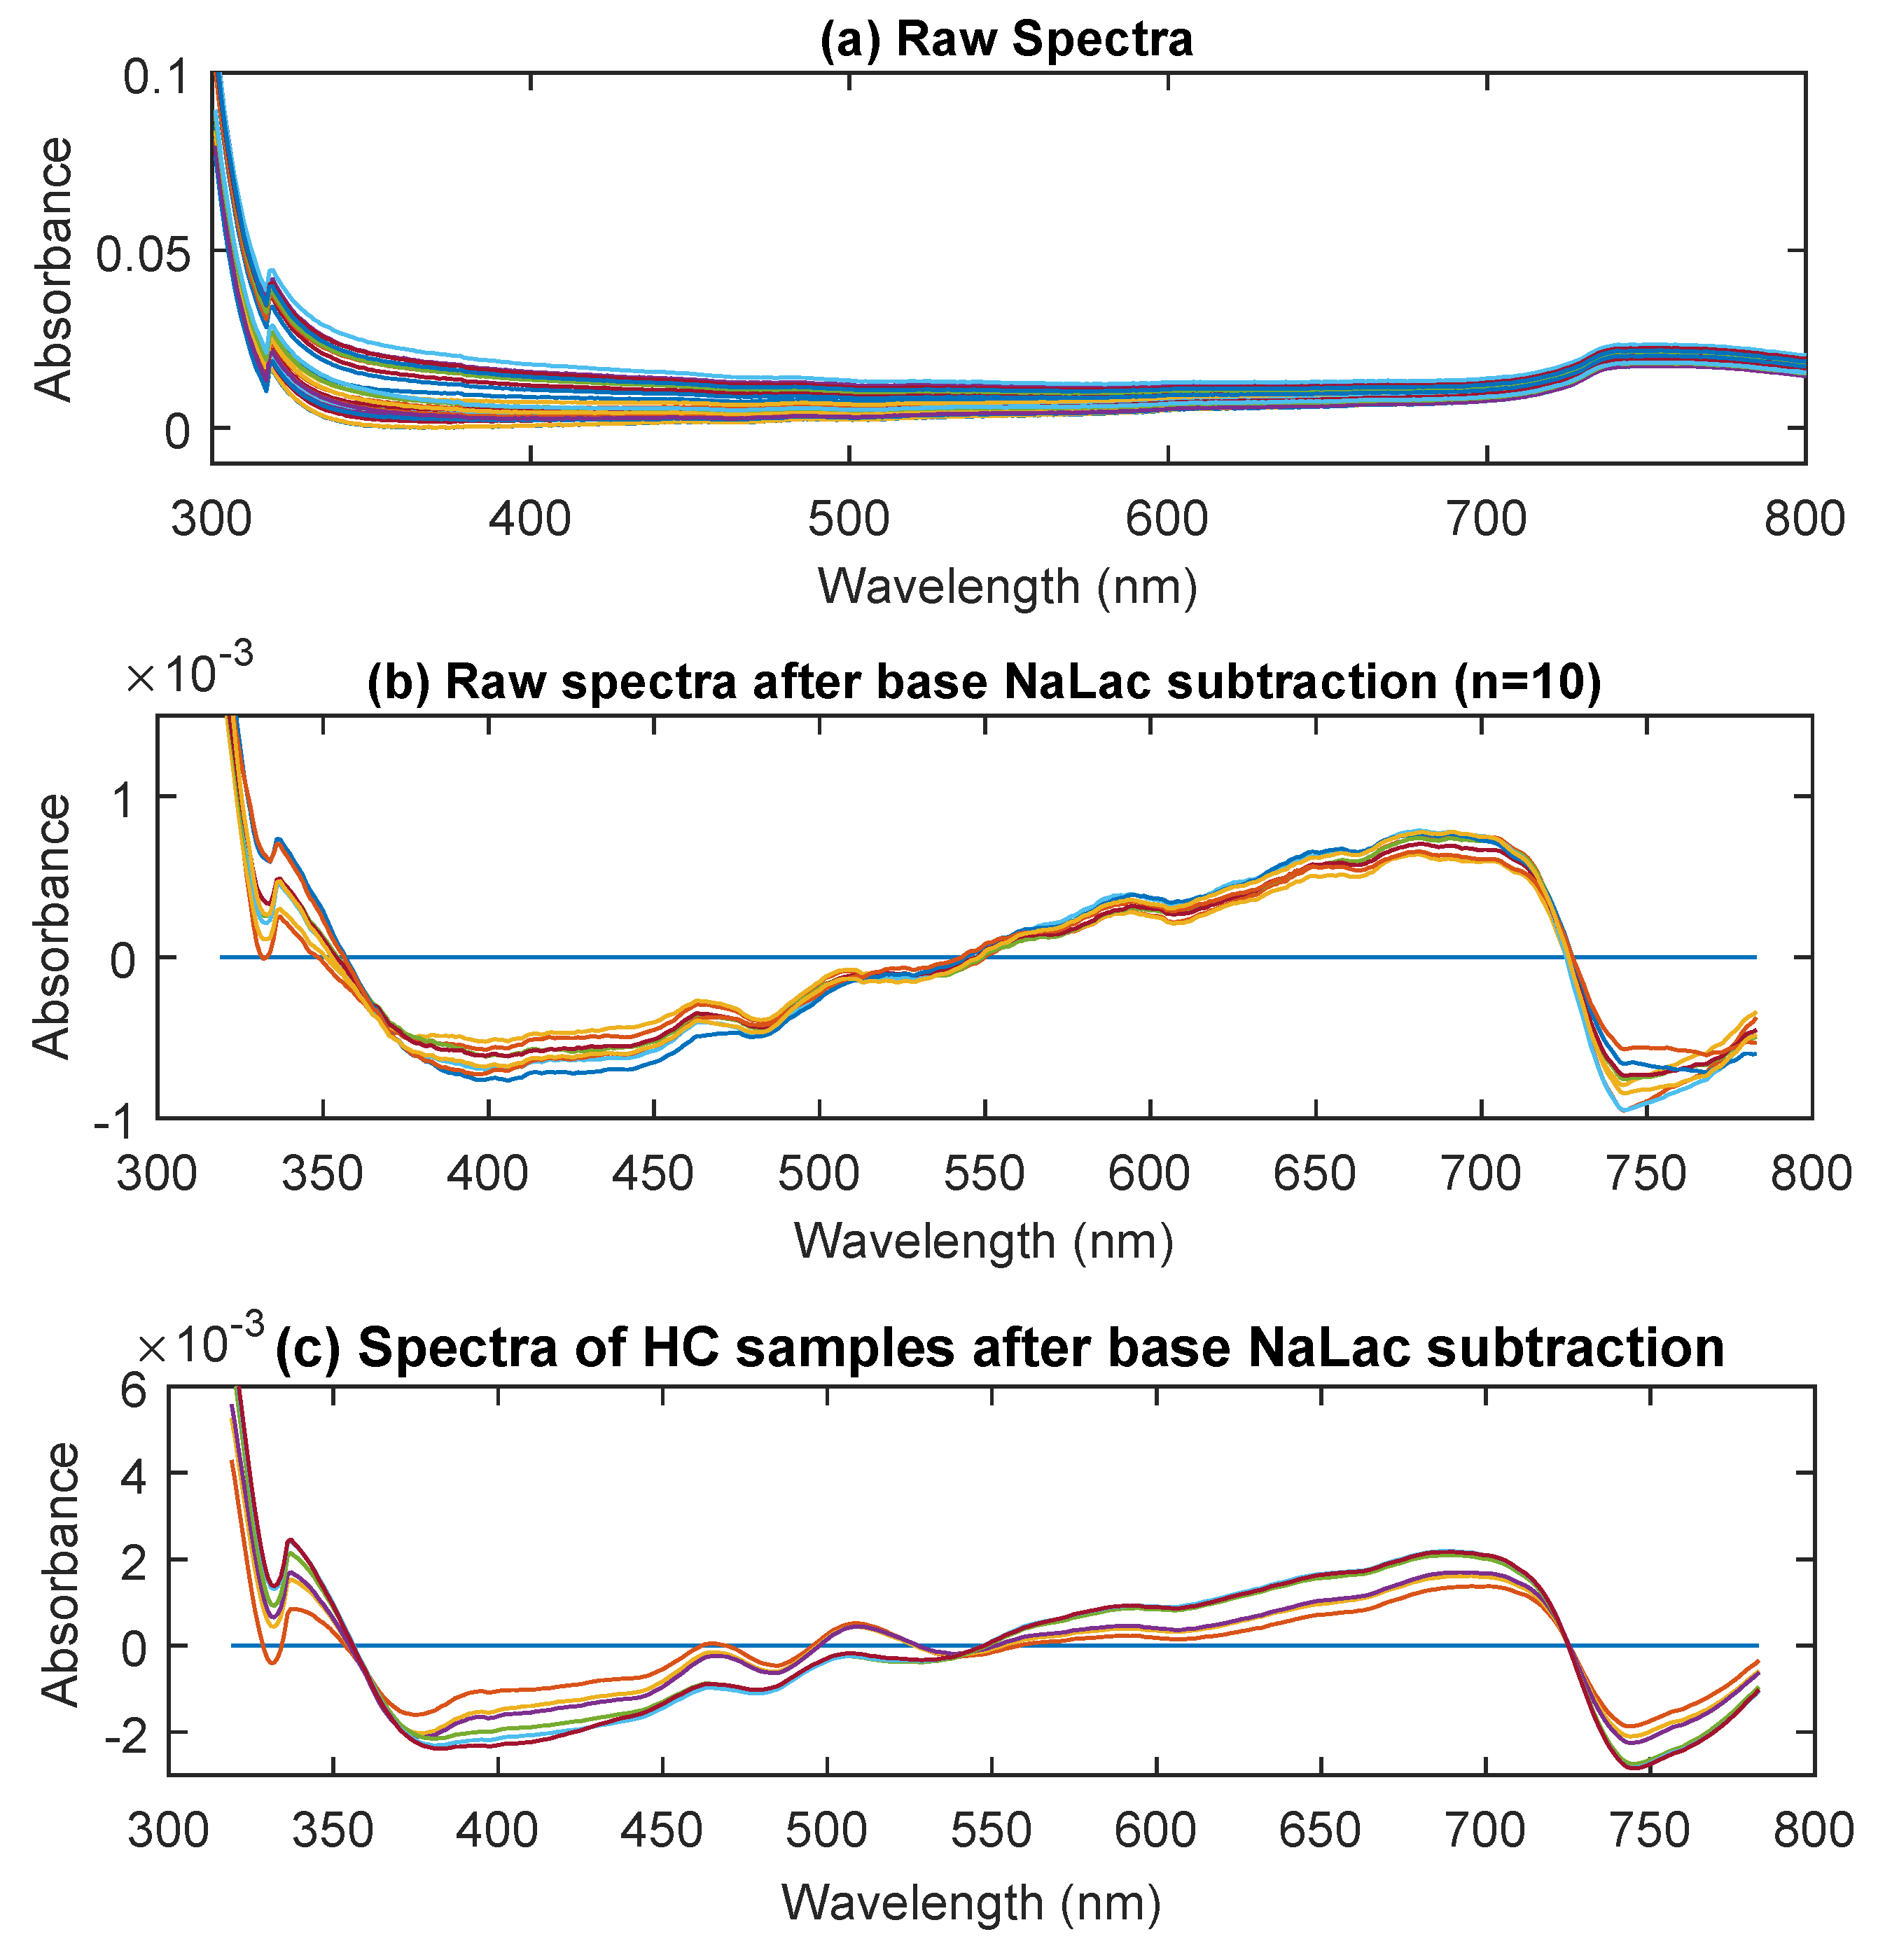
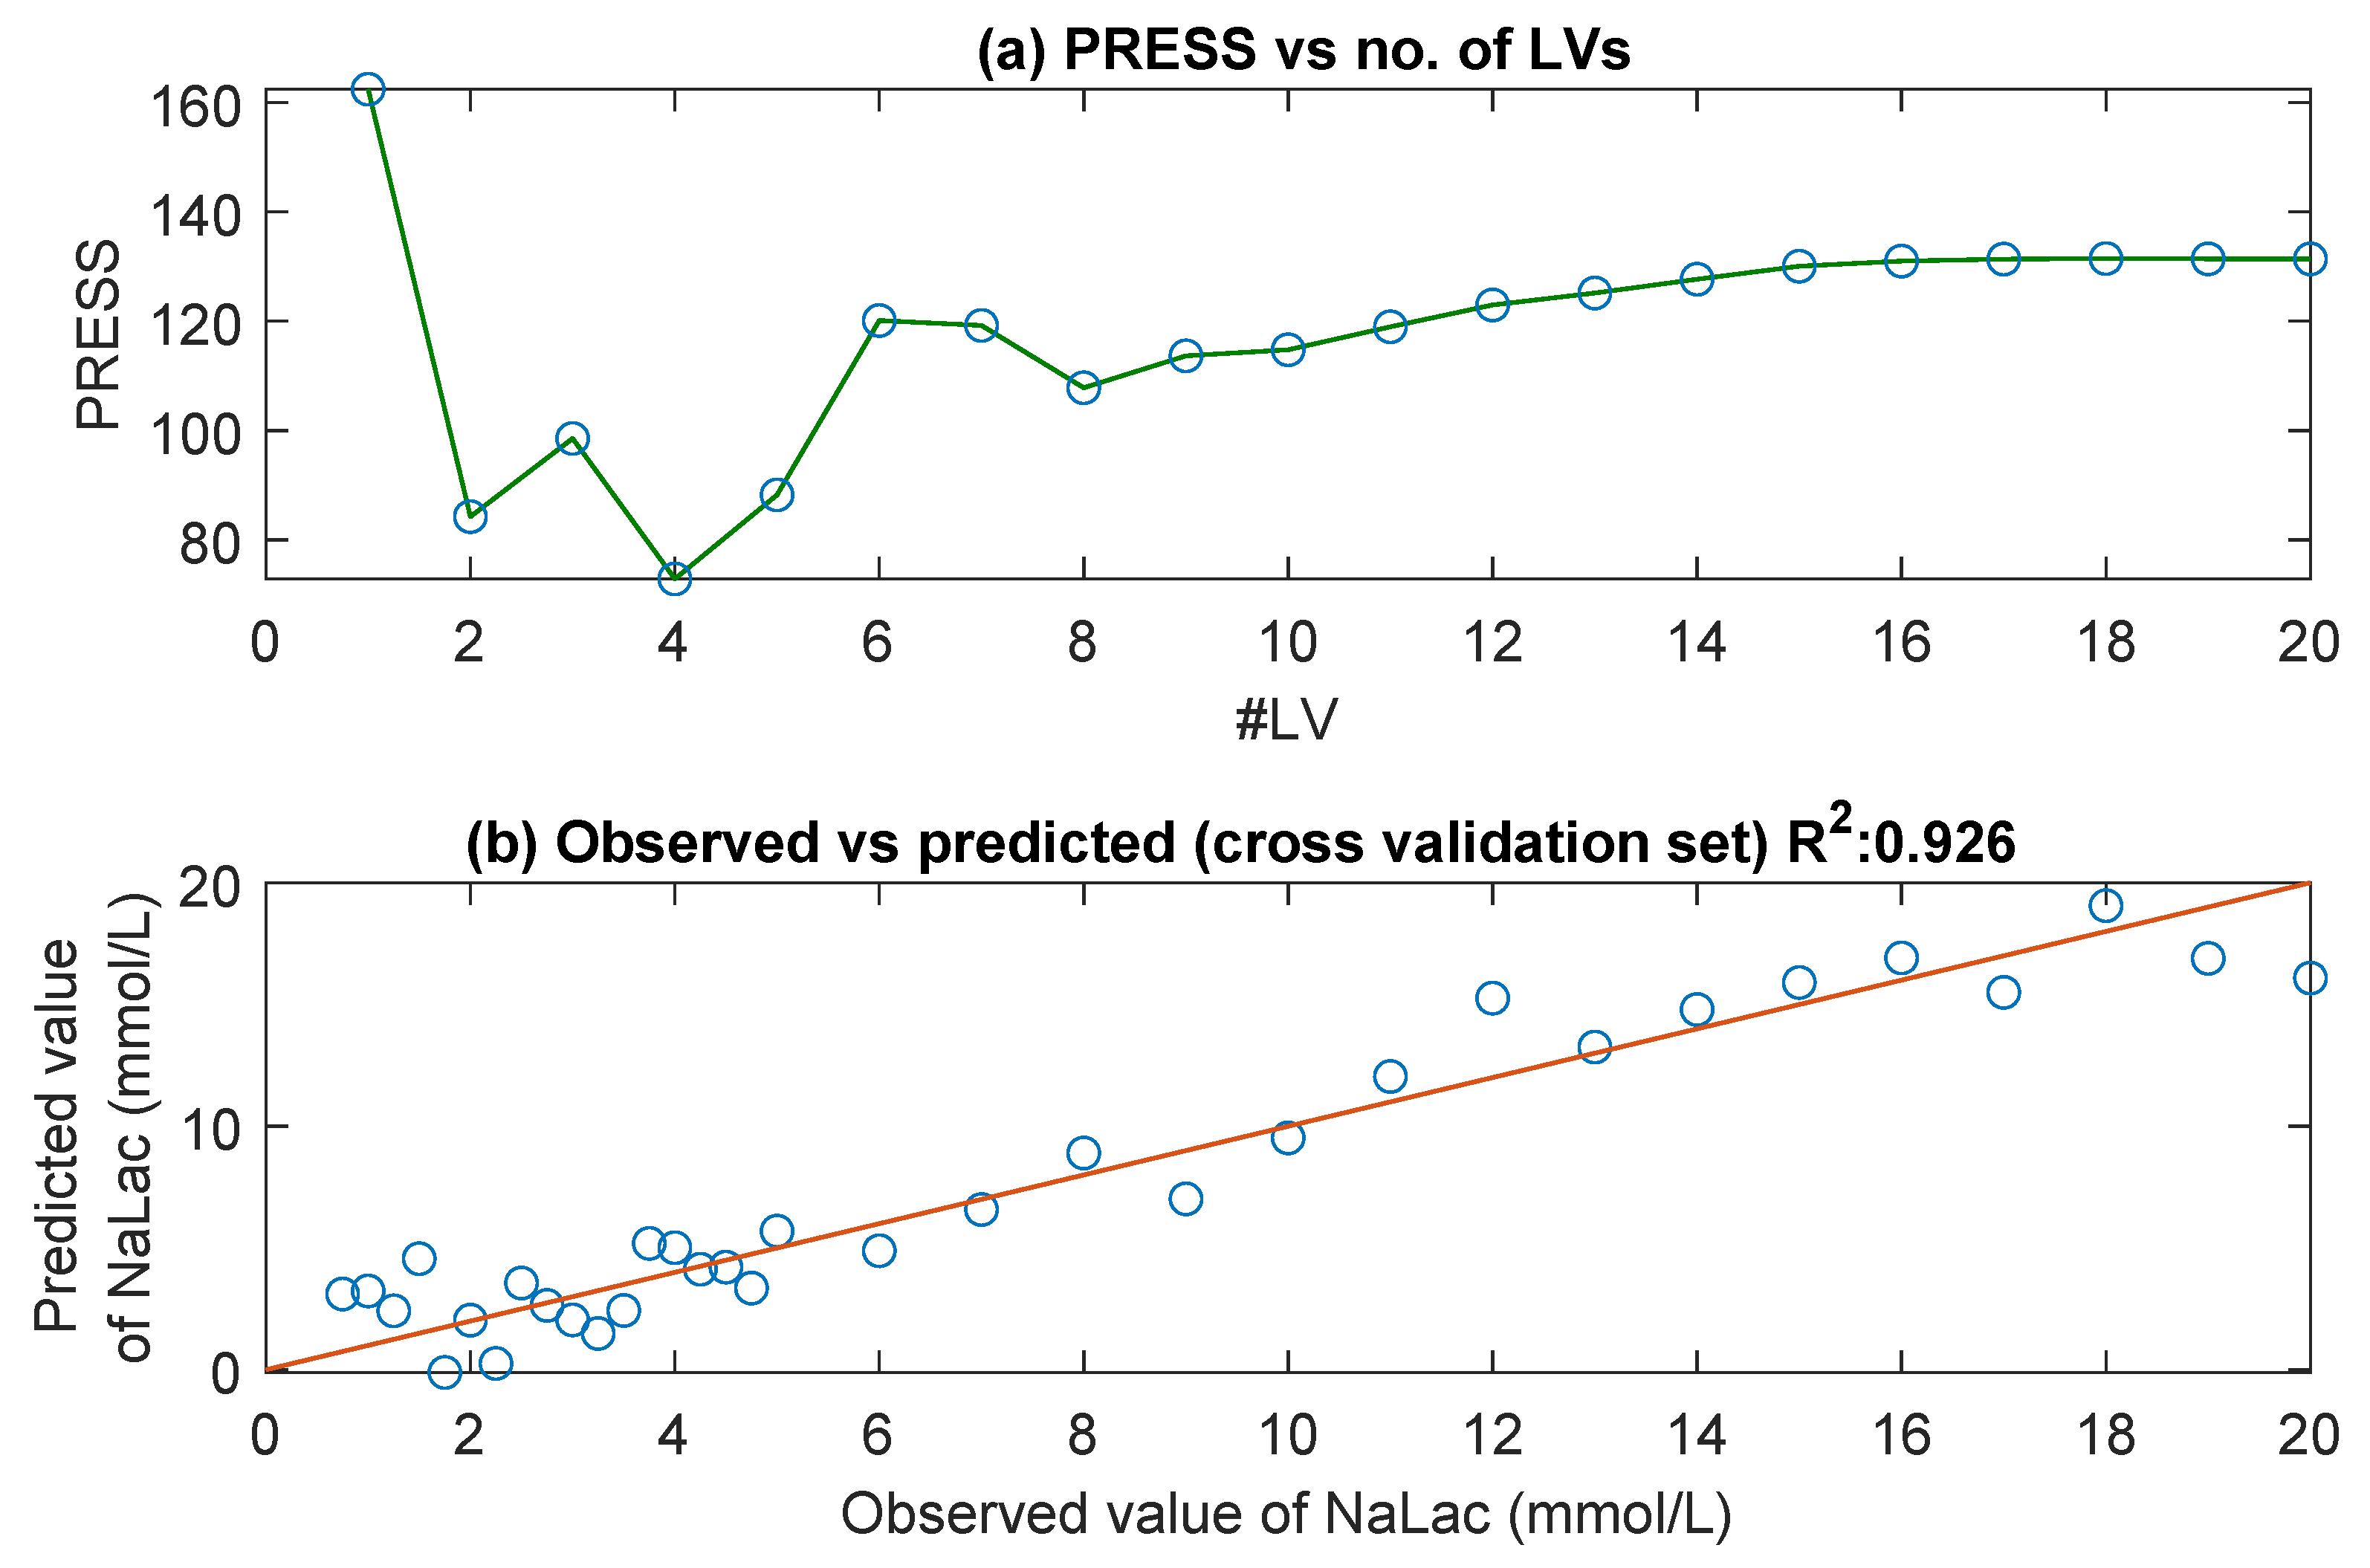
3.1. UV/Visible Spectra
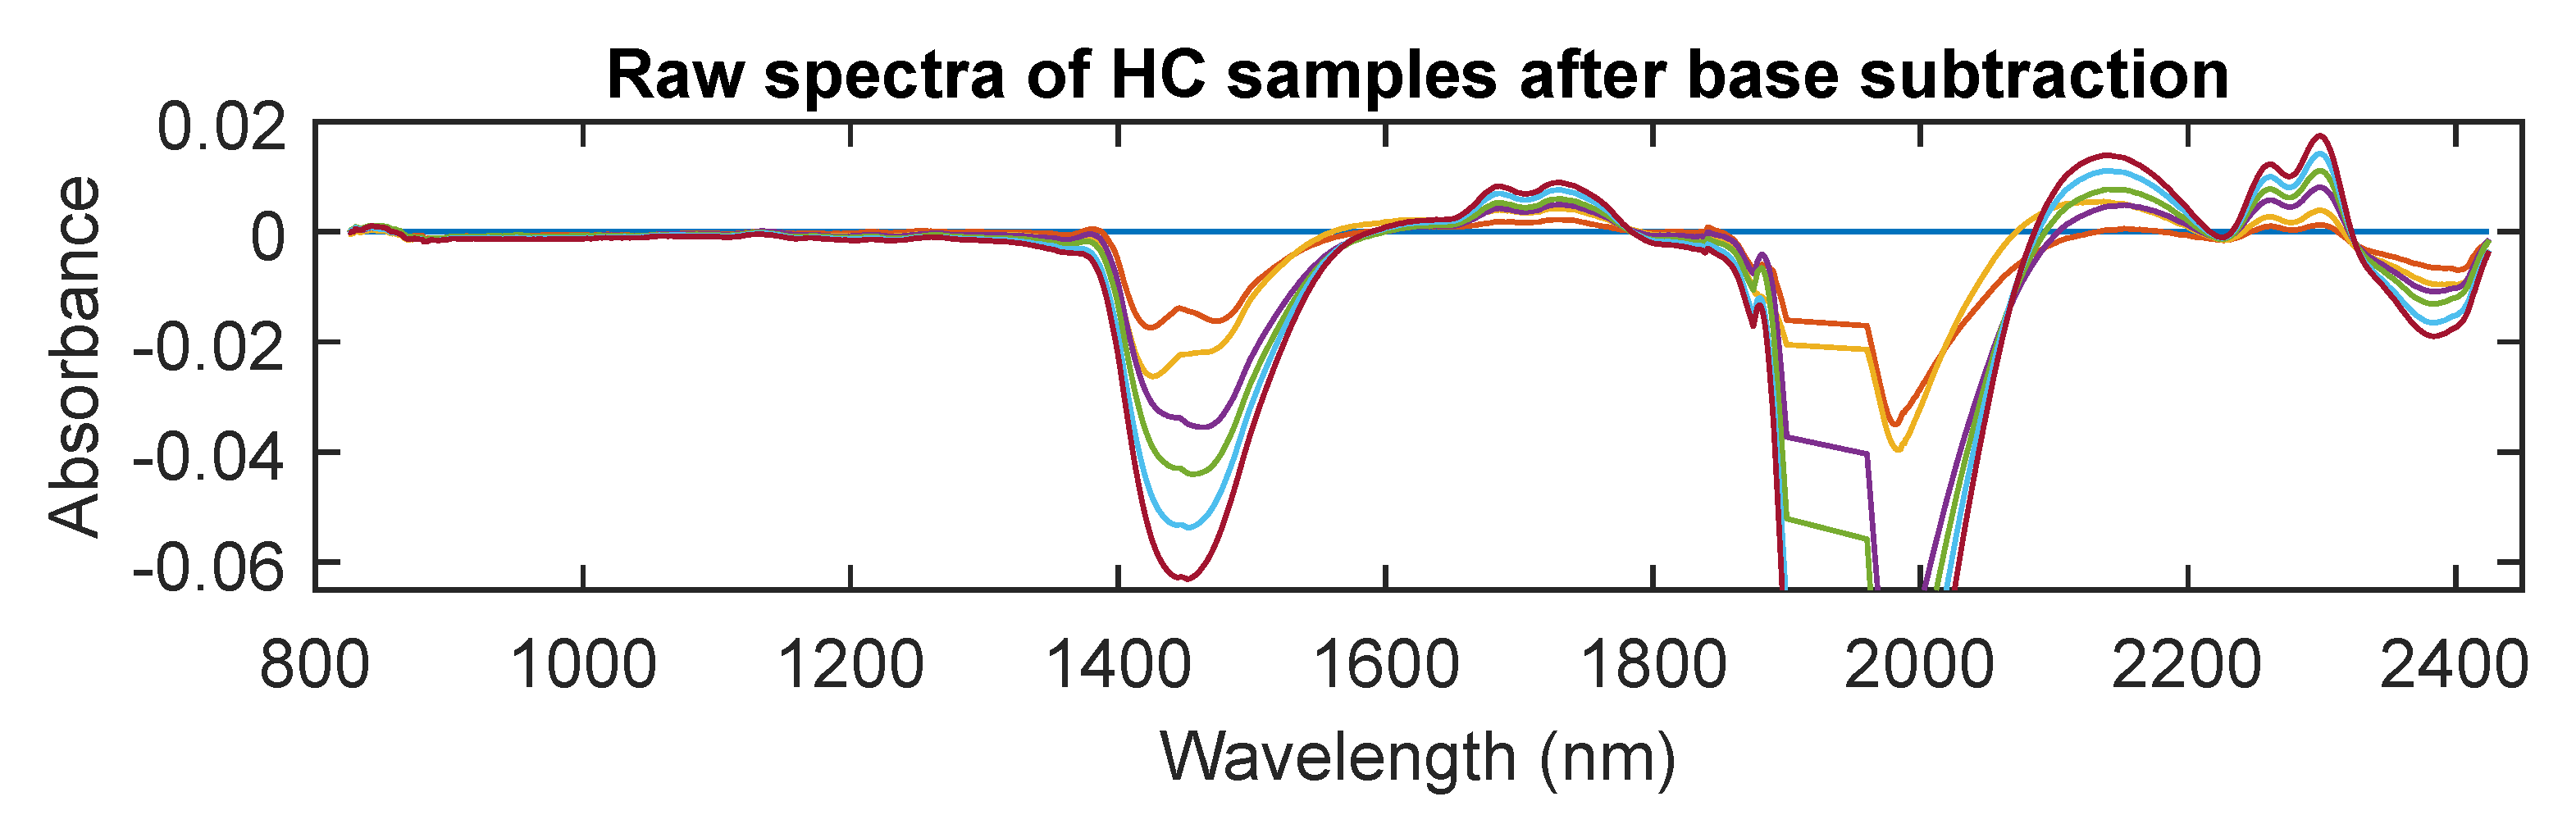
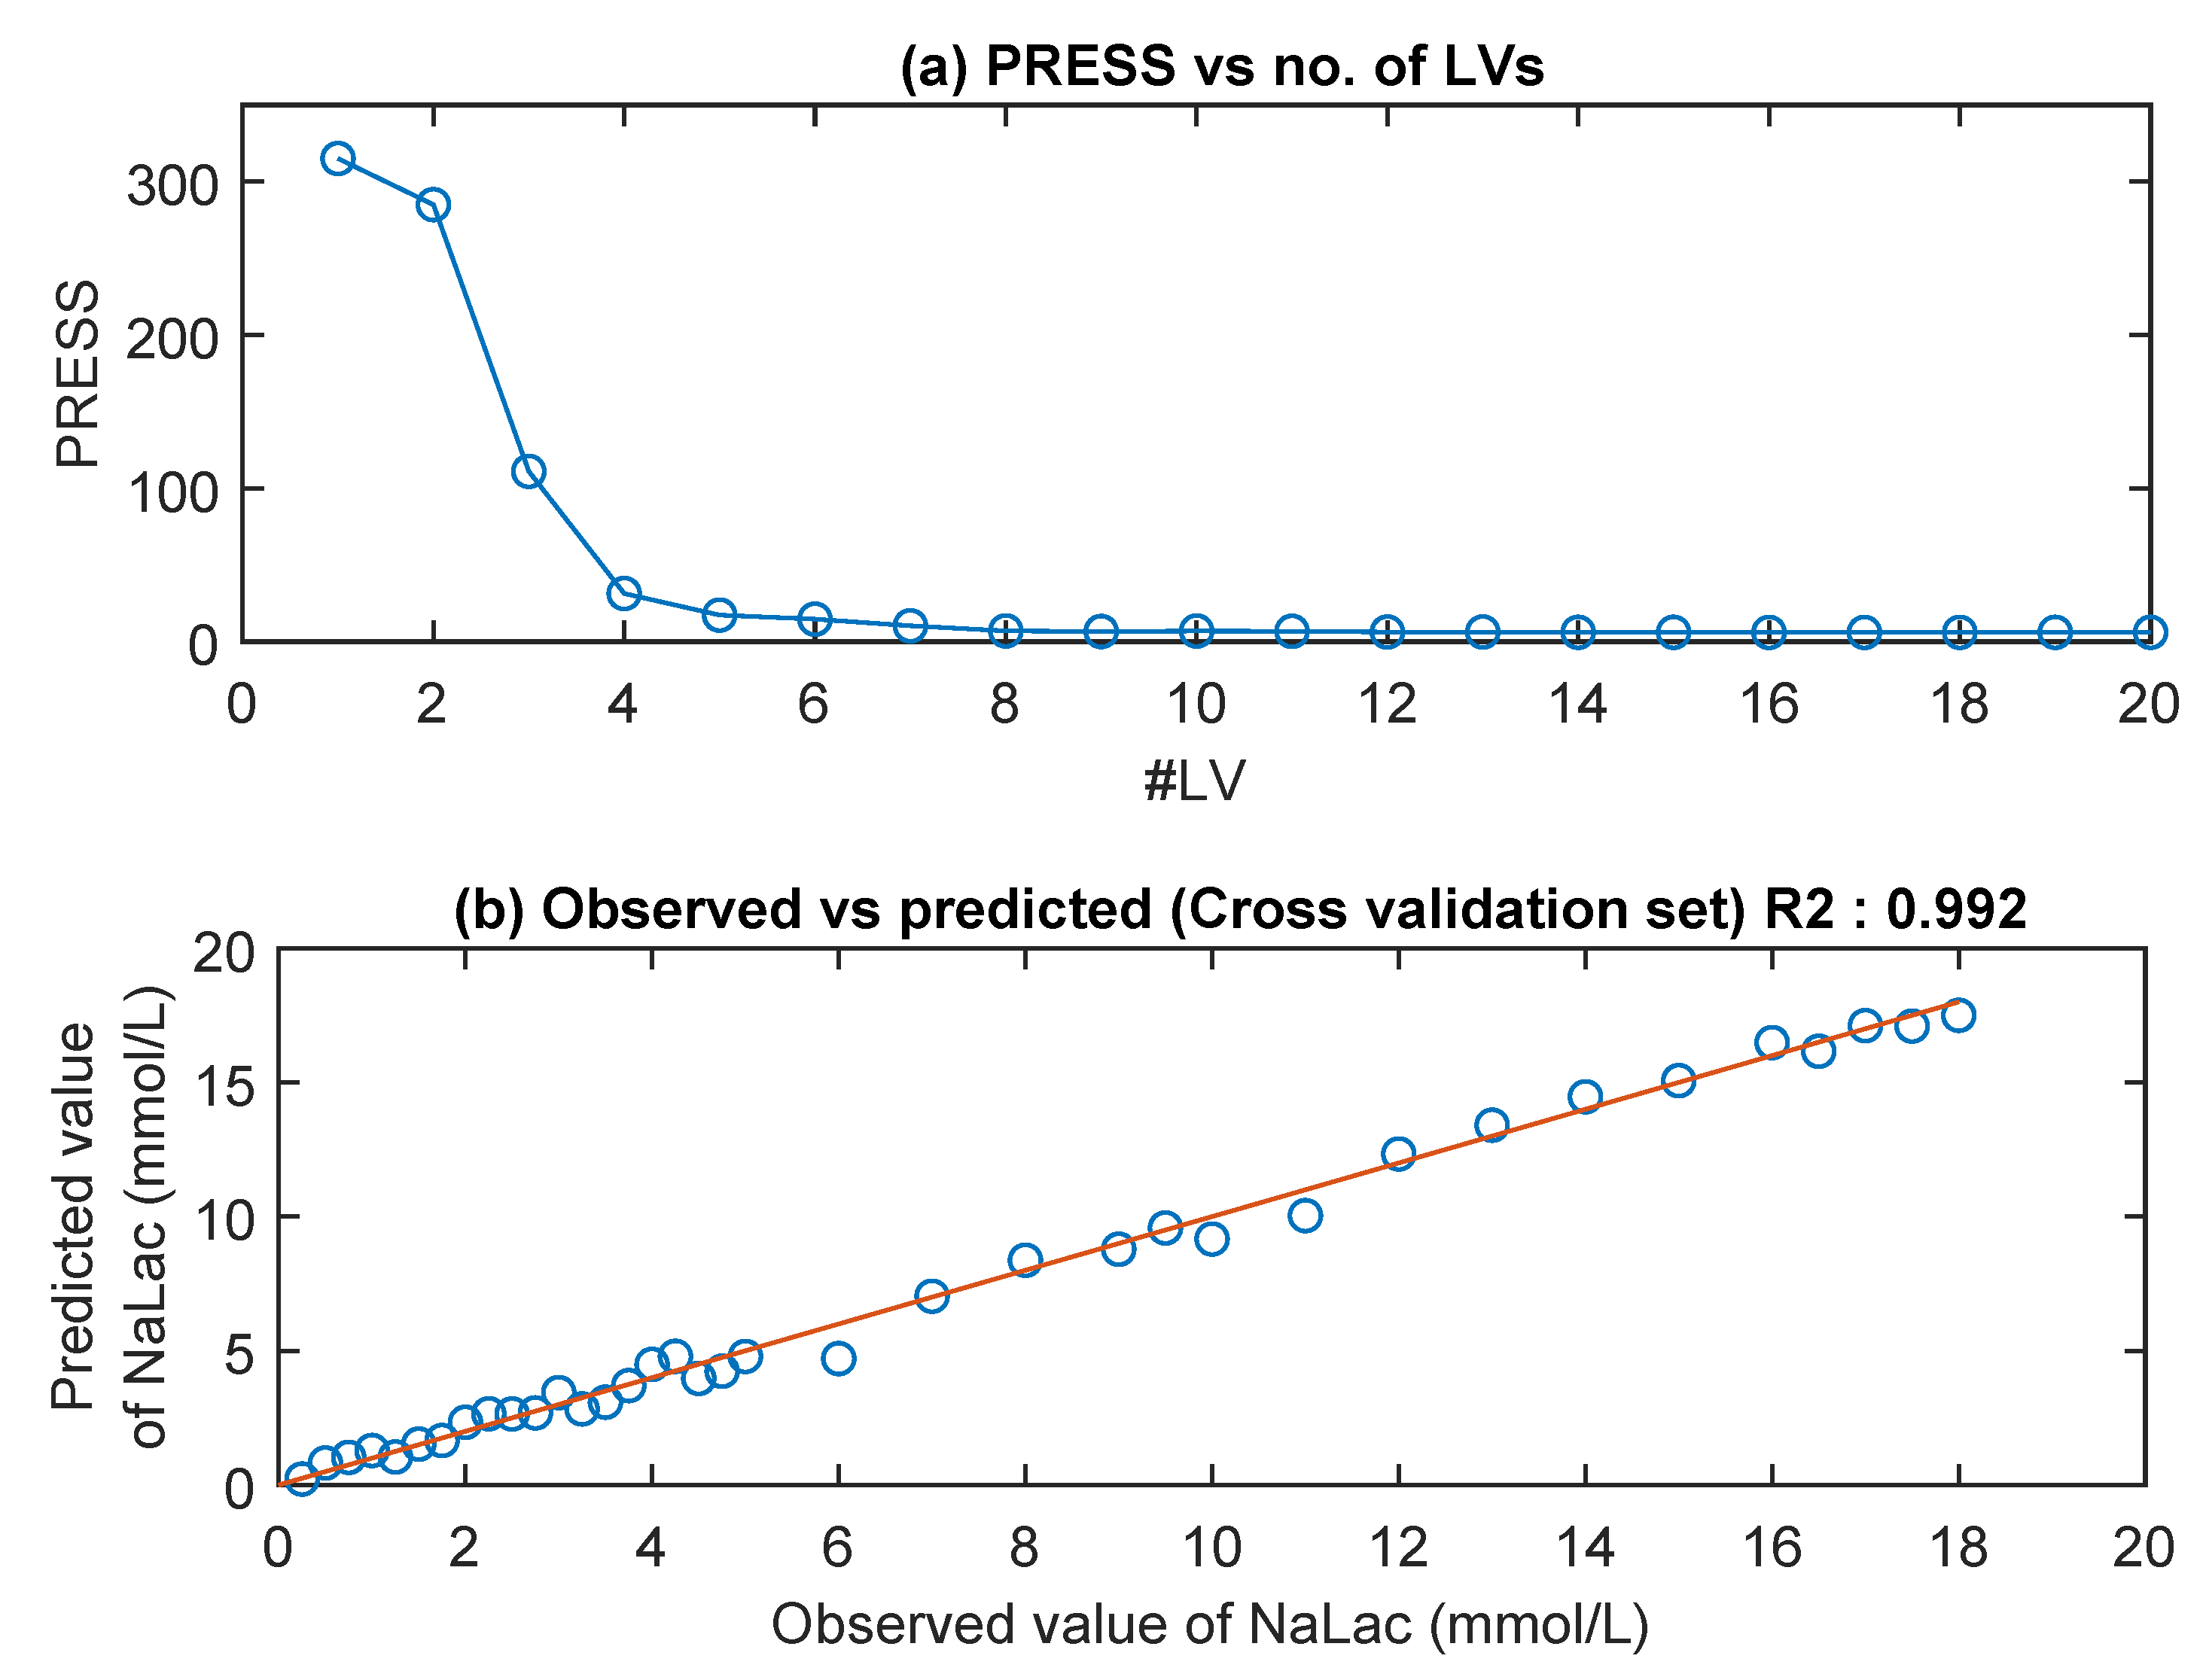
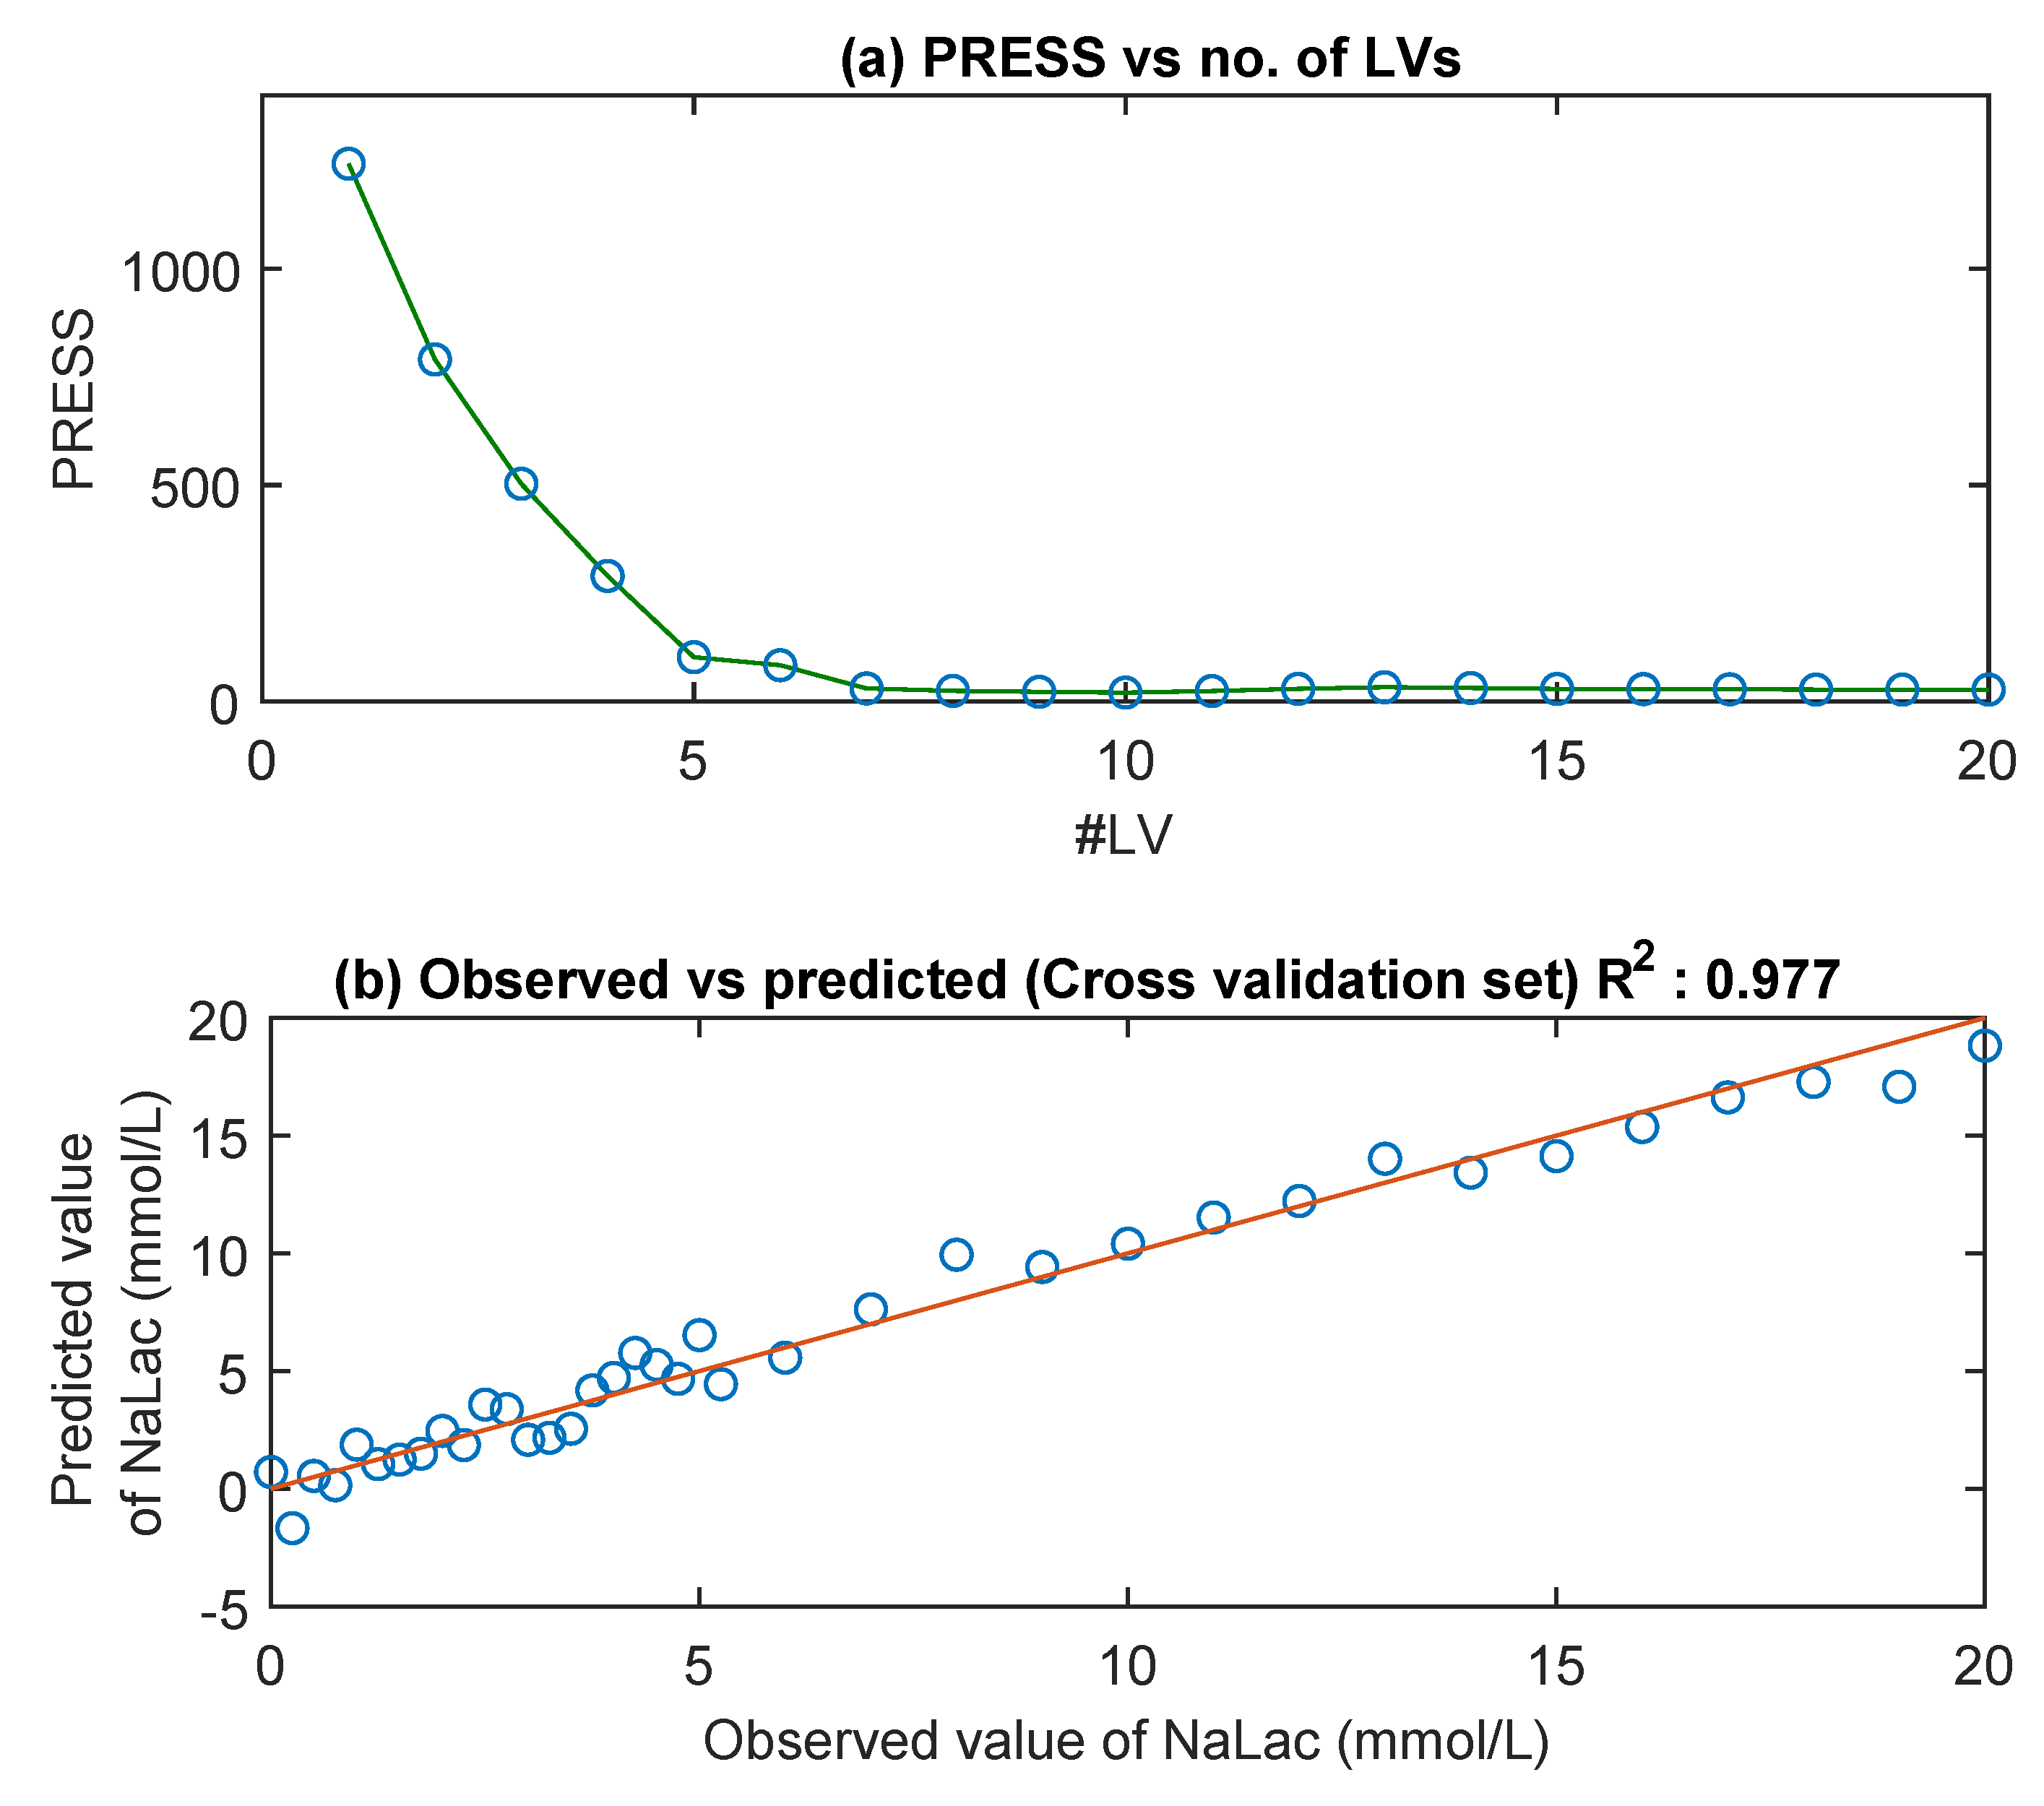
3.2. NIR Spectra
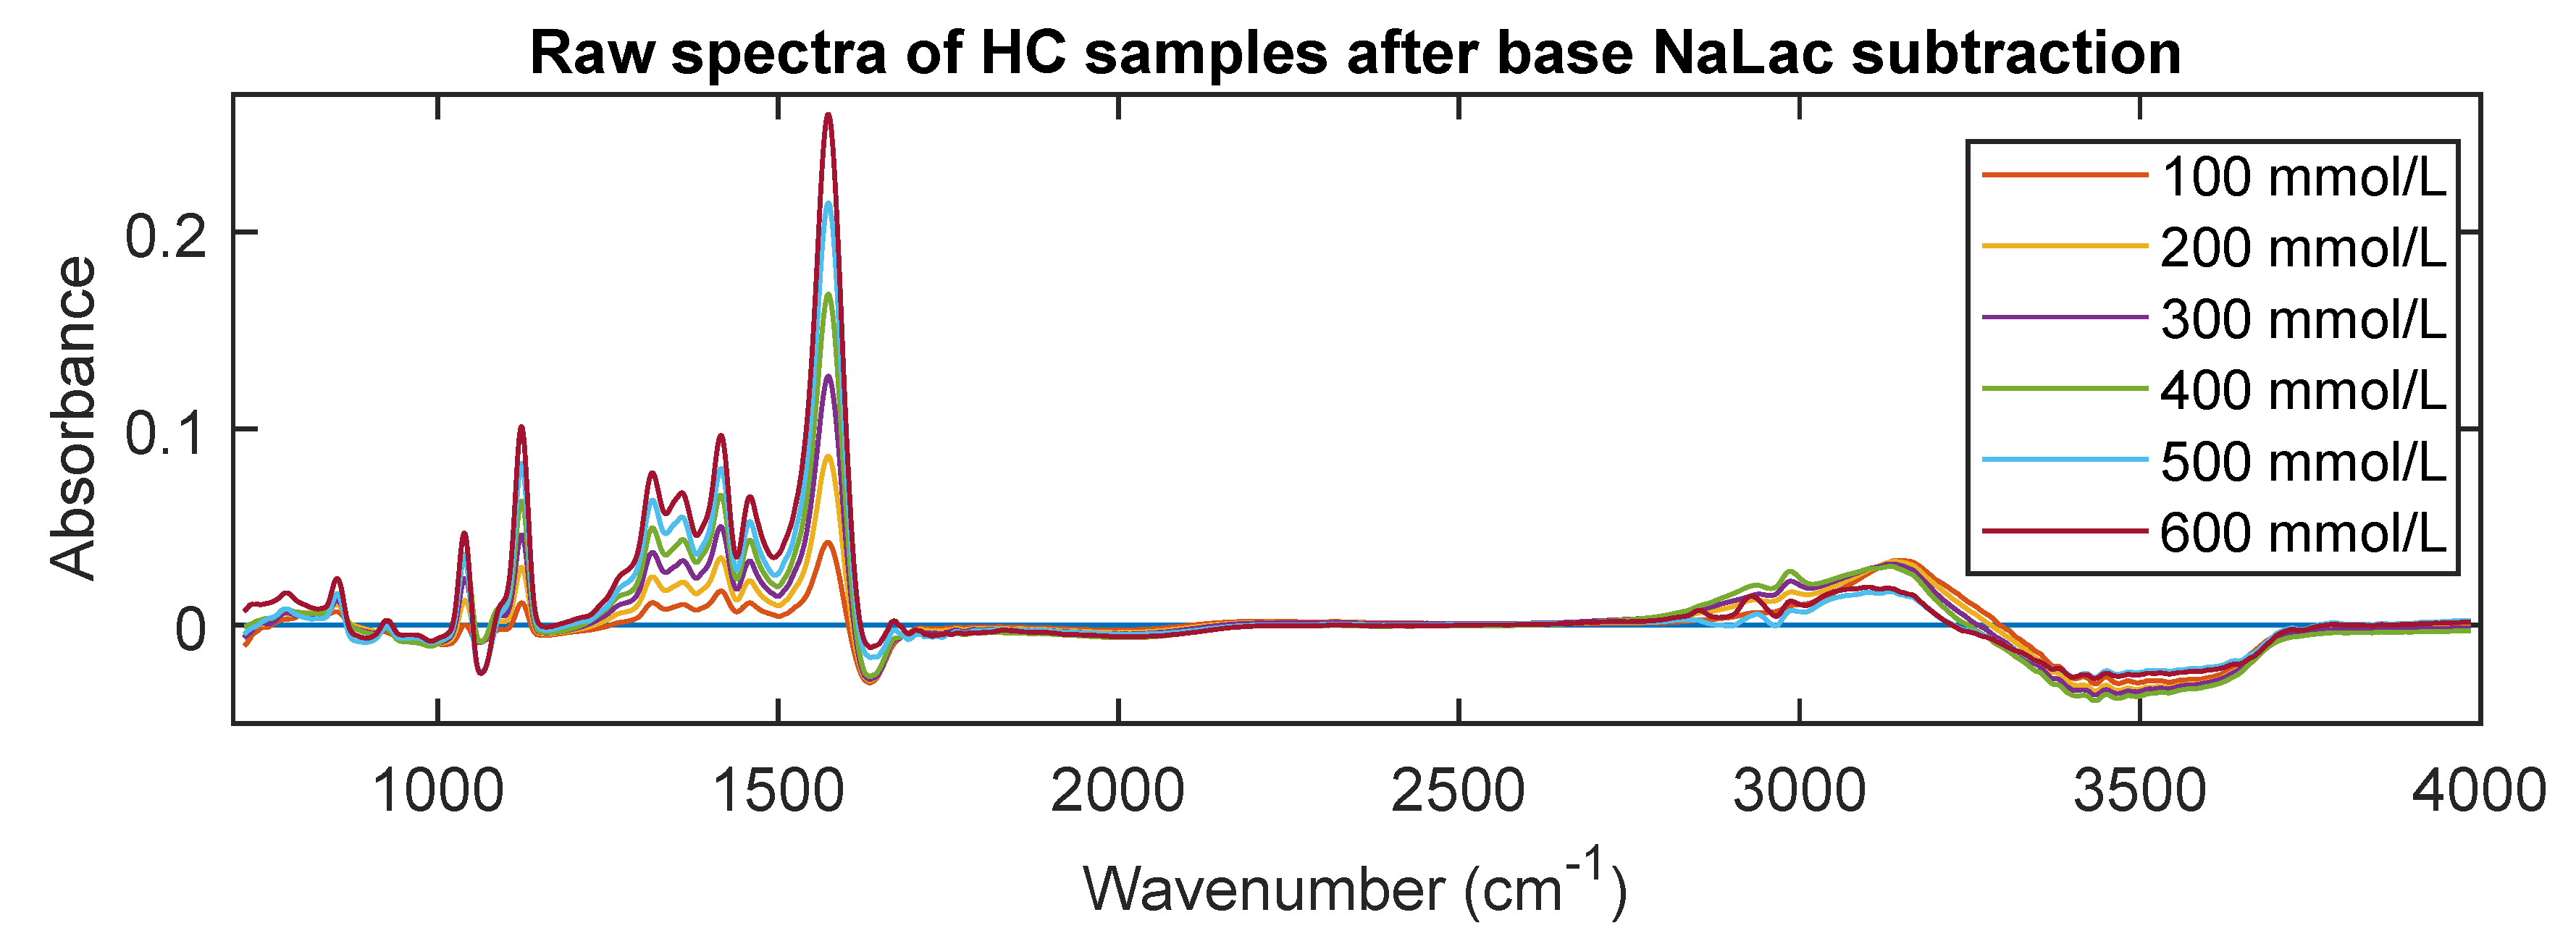
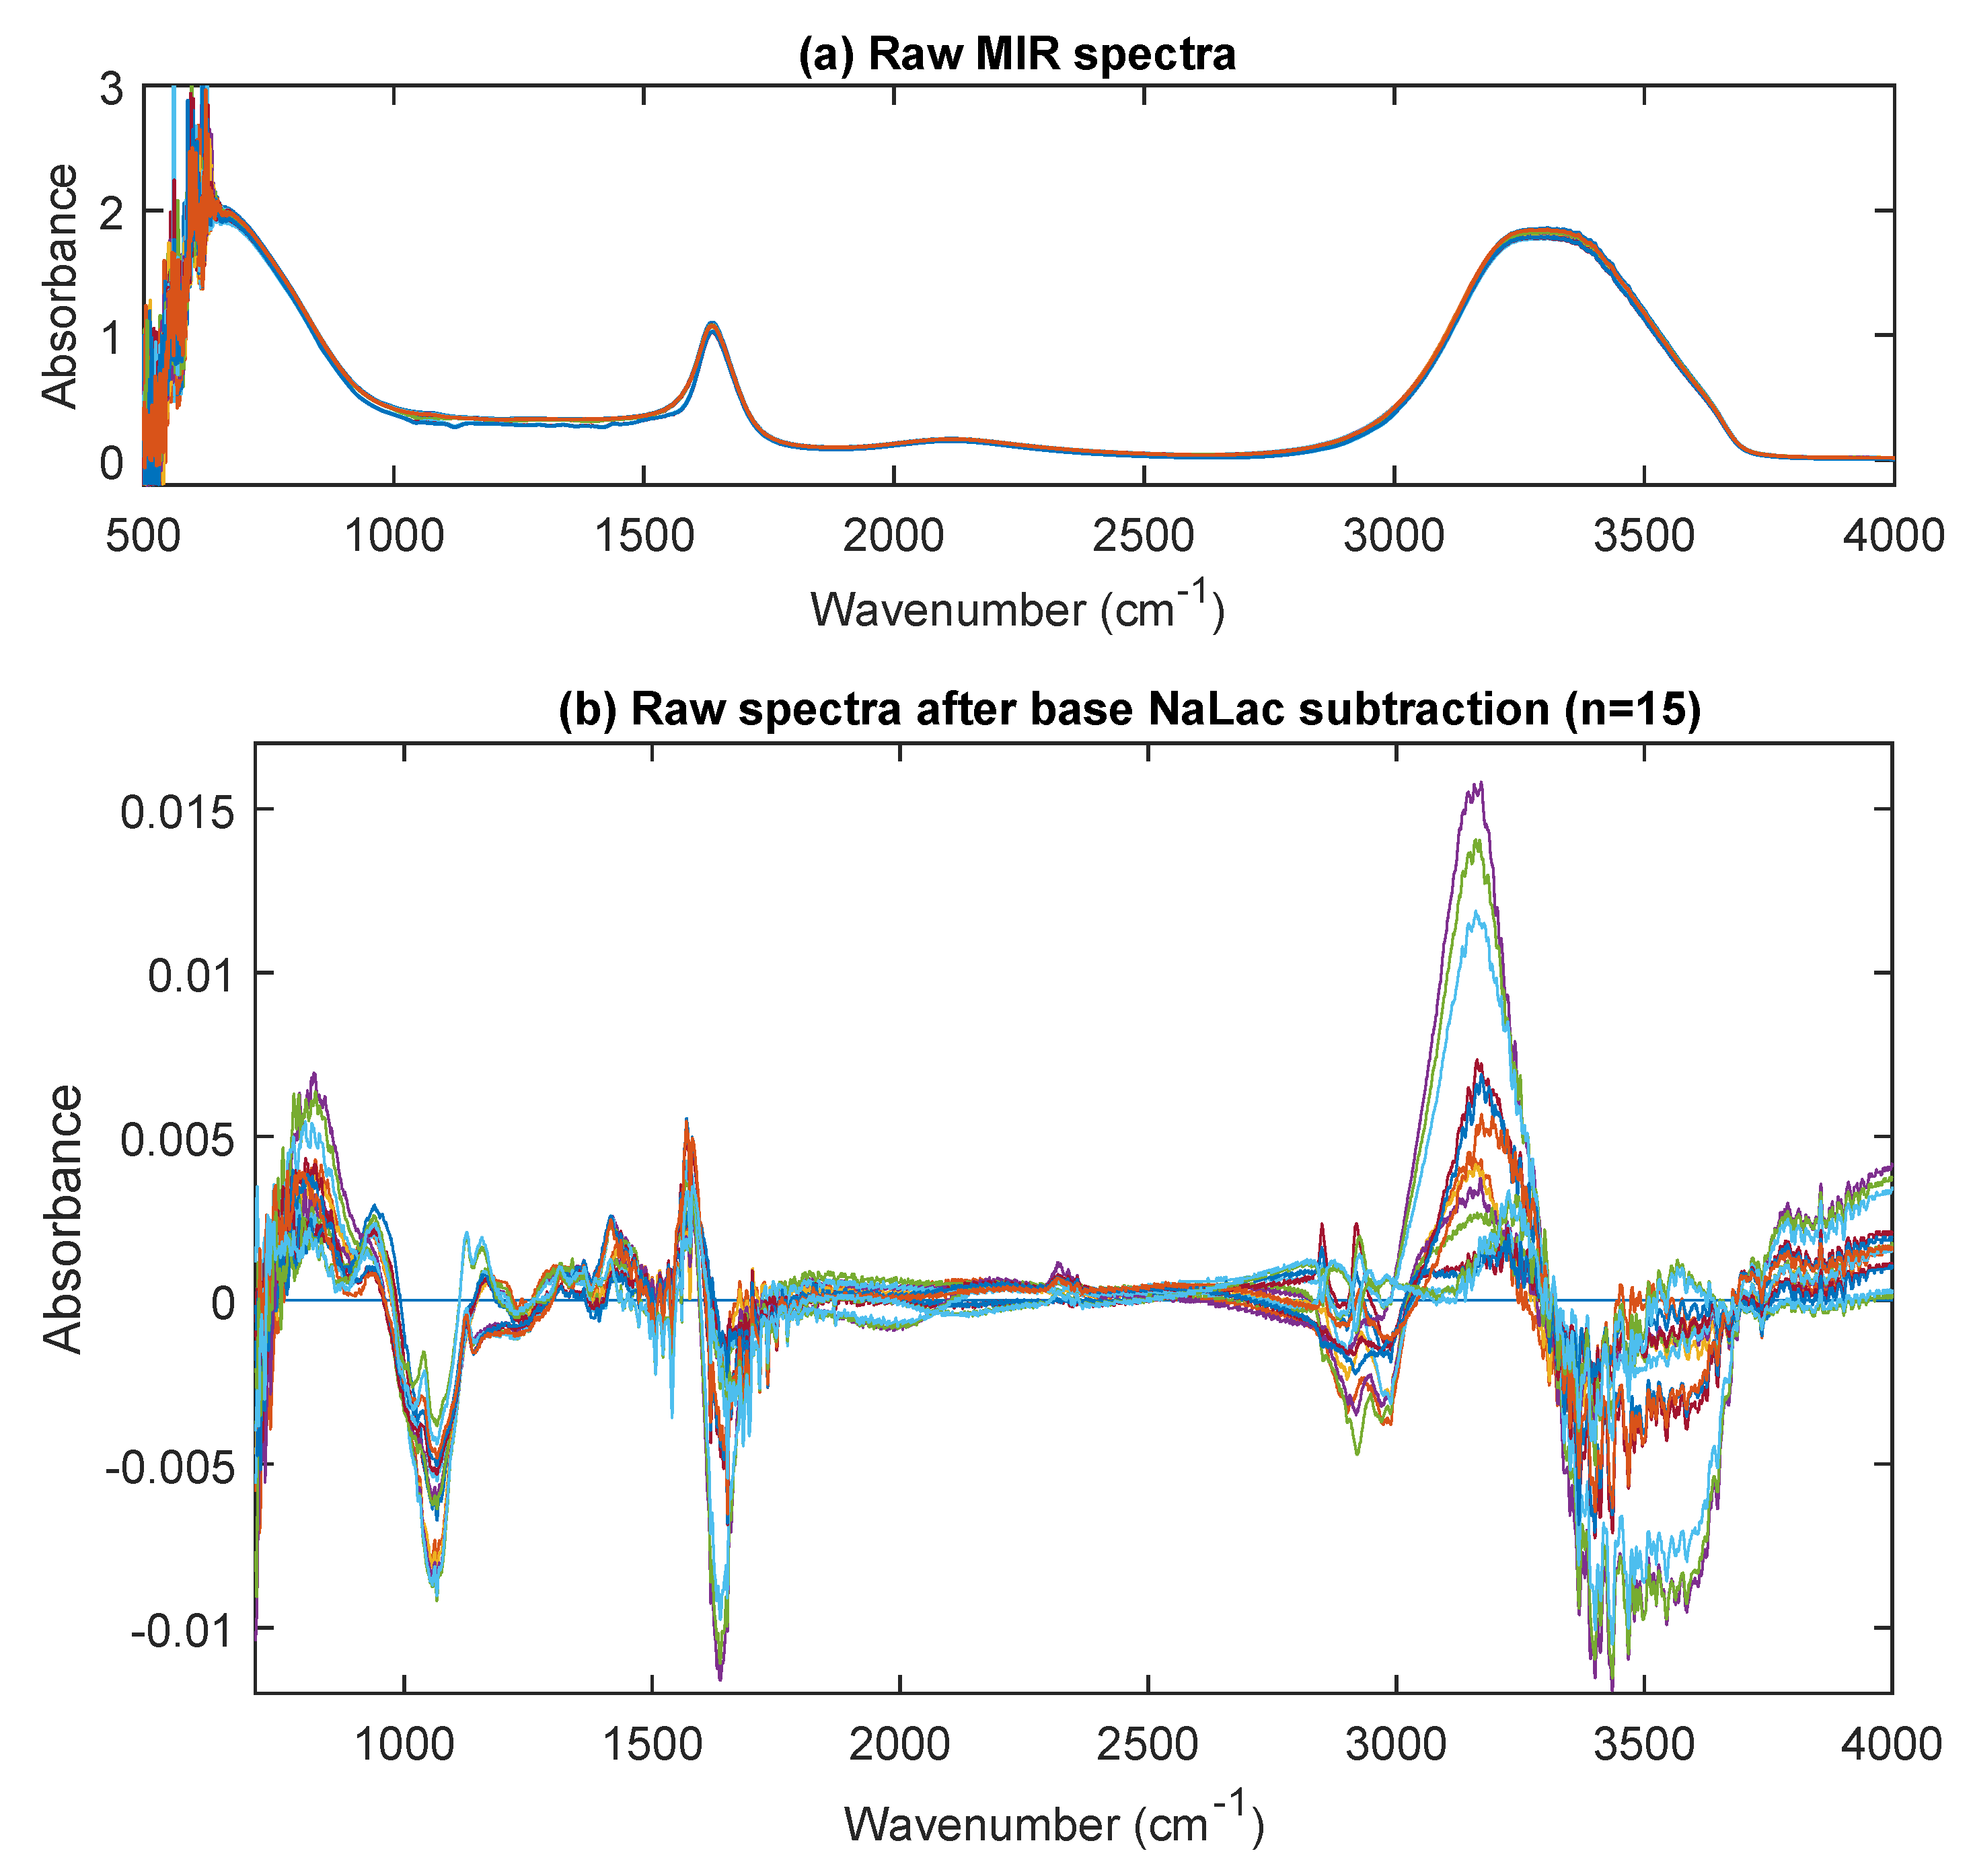
3.3. MIR Spectra
4. Discussion
Author Contributions
Funding
Conflicts of Interest
References
- Rosenstein, P.G.; Tennent-Brown, B.S.; Hughes, D. Clinical use of plasma lactate concentration. Part 2: Prognostic and diagnostic utility and the clinical management of hyperlactatemia. J. Vet. Emerg. Crit. Care 2018, 28, 106–121. [Google Scholar] [CrossRef] [PubMed]
- Sun, S.; Li, H.; Chen, J.; Qian, Q. Lactic Acid: No Longer an Inert and End-Product of Glycolysis. Physiology 2017, 32, 453–463. [Google Scholar] [CrossRef] [PubMed]
- Garcia-Alvarez, M.; Marik, P.; Bellomo, R. Sepsis-associated hyperlactatemia. Crit. Care 2014, 18, 503. [Google Scholar] [CrossRef] [PubMed] [Green Version]
- Rabello Filho, R.; Rocha, L.L.; Corrêa, T.D.; Pessoa, C.M.S.; Colombo, G.; Assuncao, M.S.C. Blood lactate levels cutoff and mortality prediction in sepsis time for a reappraisal? A retrospective cohort study. Shock 2016, 46, 480. [Google Scholar] [CrossRef] [PubMed] [Green Version]
- Lee, S.M.; An, W.S. New clinical criteria for septic shock: Serum lactate level as new emerging vital sign. J. Thorac. Dis. 2016, 8, 1388–1390. [Google Scholar] [CrossRef] [PubMed]
- National Institute for Health and Care Excellence (NICE). SEPSIS: Recognition, Diagnosis and Early Management; NG51; NICE: London, UK, 2016. [Google Scholar]
- Mayr, F.B.; Yende, S.; Angus, D.C. Epidemiology of severe sepsis. Virulence 2014, 5, 4–11. [Google Scholar] [CrossRef] [Green Version]
- Kashyap, R.; Singh, T.D.; Rayes, H.; O’Horo, J.C.; Wilson, G.; Bauer, P.; Gajic, O. Association of septic shock definitions and standardized mortality ratio in a contemporary cohort of critically ill patients. J. Crit. Care 2019, 50, 269–274. [Google Scholar] [CrossRef]
- Rassaei, L.; Olthuis, W.; Tsujimura, S.; Sudholter, E.J.R.; van den Berg, A. Lactate biosensors: Current status and outlook. Anal. Bioanal. Chem. 2014, 406, 123–137. [Google Scholar] [CrossRef]
- Currano, L.J.; Sage, F.C.; Hagedon, M.; Hamilton, L.; Patrone, J.; Gerasopoulos, K. Wearable Sensor System for Detection of Lactate in Sweat. Sci. Rep. 2018, 8, 1–11. [Google Scholar] [CrossRef] [Green Version]
- Lafrance, D.; Lands, L.C.; Hornby, L.; Rohlicek, C.; Burns, D.H. Lactate measurement in whole blood using near infrared spectroscopy. Can. J. Anal. Sci. Spectrosc. 2000, 45, 36–40. [Google Scholar]
- Lafrance, D.; Lands, L.C.; Hornby, L.; Burns, D.H. Near-infrared spectroscopic measurement of lactate in human plasma. Appl. Spectrosc. 2000, 54, 300–304. [Google Scholar] [CrossRef]
- Bosschaart, N.; Edelman, G.J.; Aalders, M.C.G.; van Leeuwen, T.G.; Faber, D.J. A literature review and novel theoretical approach on the optical properties of whole blood. Lasers Med. Sci. 2014, 29, 453–479. [Google Scholar] [CrossRef] [PubMed] [Green Version]
- Kasahara, R.; Kino, S.; Soyama, S.; Matsuura, Y. Noninvasive glucose monitoring using midinfrared absorption spectroscopy based on a few wavenumbers. Biomed. Opt. Express 2018, 9, 289–302. [Google Scholar] [CrossRef] [PubMed] [Green Version]
- Ramasahayam, S.; Chowdhury, S.R. Non Invasive Estimation of Blood Urea Concentration using Near Infrared Spectroscopy. Int. J. Smart Sens. Intell. Syst. 2016, 9. [Google Scholar] [CrossRef] [Green Version]
- Budidha, K.; Mamouei, M.; Baishya, N.; Vadgama, P.; Kyriacou, P. In vitro quantification of lactate in Phosphate Buffer Saline (PBS) samples. In Proceedings of the 2019 41st Annual International Conference of the IEEE Engineering in Medicine and Biology Society (EMBC), Berlin, Germany, 23–27 July 2019; pp. 1205–1208. [Google Scholar]
- Baishya, N.; Budidha, K.; Mamouei, M.; Qassem, M.; Vadgama, P.; Kyriacou, P. Near Infrared Spectrometric Investigations on the behaviour of Lactate. In Proceedings of the 2019 41st Annual International Conference of the IEEE Engineering in Medicine and Biology Society (EMBC), Berlin, Germany, 23–27 July 2019; pp. 5769–5772. [Google Scholar]
- Abdi, H. Partial least squares regression and projection on latent structure regression (PLS Regression). Wiley Interdiscip. Rev. Comput. Stat. 2010, 2, 97–106. [Google Scholar] [CrossRef]
- Palermo, G.; Piraino, P.; Zucht, H.D. Performance of PLS regression coefficients in selecting variables for each response of a multivariate PLS for omics-type data. Adv. App. Bioinf. Chem. AABC 2009, 2, 57–70. [Google Scholar] [CrossRef] [Green Version]
- Pope, R.M.; Fry, E.S. Absorption spectrum (380–700 nm) of pure water. II. Integrating cavity measurements. Appl. Opt. 1997, 36, 8710–8723. [Google Scholar] [CrossRef]
- Kossowski, T.; Kossowska, K.; Stasiński, R. Non-invasive measurement of chemical compounds levels in human body. Meas. Autom. Monit. 2017, 63, 200–202. [Google Scholar]
- Davies, A. An Introduction to near Infrared Spectroscopy. NIR News 2005, 16, 9–11. [Google Scholar] [CrossRef]
- Allen, T.J.; Beard, P.C.; Hall, A.; Dhillon, A.P.; Owen, J.S. Spectroscopic photoacoustic imaging of lipid-rich plaques in the human aorta in the 740 to 1400 nm wavelength range. J Biomed. Opt. 2012, 17, 061209. [Google Scholar] [CrossRef]
- Bokobza, L. Near Infrared Spectroscopy. J. Near Infrared Spectrosc. 1998, 6, 3–17. [Google Scholar] [CrossRef]
- Pasquini, C. Near Infrared Spectroscopy: Fundamentals, practical aspects and analytical applications. J. Braz. Chem. Soc. 2003, 14, 198–219. [Google Scholar] [CrossRef] [Green Version]
- Yano, T.; Matsushige, H.; Suehara, K.I.; Nakano, Y. Measurement of the concentrations of glucose and lactic acid in peritoneal dialysis solutions using near-infrared spectroscopy. J. Biosci. Bioeng. 2000, 90, 540–544. [Google Scholar] [CrossRef]
- Sivakesava, S.; Irudayaraj, J.; Ali, D. Simultaneous determination of multiple components in lactic acid fermentation using FT-MIR, NIR, and FT-Raman spectroscopic techniques. Process Biochem. 2001, 37, 371–378. [Google Scholar] [CrossRef]
- Păucean, A.; Vodnar, D.; Murean, V.; Fetea, F.; Ranga, F.; Man, S.; Muste, S.; Socaciu, C. Monitoring lactic acid concentrations by infrared spectroscopy: A new developed method for Lactobacillus fermenting media with potential food applications. Acta Aliment. 2017, 46, 420–427. [Google Scholar] [CrossRef] [Green Version]
- Vodnar, D.C.; Paucean, A.; DULF, F.V.; Socaciu, C. HPLC characterization of lactic acid formation and FTIR fingerprint of probiotic bacteria during fermentation processes. Notulae Botanicae Horti Agrobotanici Cluj-Napoca 2010, 38, 109–113. [Google Scholar]
- Tripathi, A.D.; Srivastava, S.; Singh, P.; Singh, R.; Singh, S.; Jha, A.; Yadav, P. Optimization of process variables for enhanced lactic acid production utilizing paneer whey as substrate in SMF. Appl. Food Biotechnol. 2015, 2, 46–55. [Google Scholar]
- Cassanas, G.; Morssli, M.; Fabregue, E.; Bardet, L. Vibrational spectra of lactic acid and lactates. J. Raman Spectrosc. 1991, 22, 409–413. [Google Scholar] [CrossRef]
- Kister, G.; Cassanas, G.; Vert, M.; Pauvert, B.; Terol, A. Vibrational analysis of poly (L-lactic acid). J. Raman Spectrosc. 1995, 26, 307–311. [Google Scholar] [CrossRef]
- Ube, T.; Yoneyama, Y.; Ishiguro, T. In situ measurement of the ph-dependent transmission infrared spectra of aqueous lactic acid solutions. Anal. Sci. 2017, 33, 1395–1400. [Google Scholar] [CrossRef] [Green Version]
- Farzam, P.; Starkweather, Z.; Franceschini, M.A. Validation of a novel wearable, wireless technology to estimate oxygen levels and lactate threshold power in the exercising muscle. Physiol. Rep. 2018, 6, e13664. [Google Scholar] [CrossRef] [PubMed] [Green Version]
- Huster, D.; Härtel, F.; Nuding, S.; Schroeder, J.; Zhang, Y.; Werdan, K.; Ebelt, H. Prognostic relevance of tissue oxygen saturation in patients in the early stage of multiple organ dysfunction syndrome. Medizinische Klinik Intensivmedizin und Notfallmedizin 2019, 114, 146–153. [Google Scholar] [CrossRef] [PubMed]
- Makovos, E.B.; Liu, C.C. Measurements of lactate concentration using lactate oxidase and an electrochemical oxygen sensor. Biotechnol. Bioeng. 1985, 27, 167–170. [Google Scholar] [CrossRef]
- White, R.; Yaeger, D. Determination of Blood Lactate Concentration: Reliability and Validity of a Lactate Oxidase-Based Method. Int. J. Exerc. Sci. 2009, 2, 83–93. [Google Scholar]
- Massey, V.; Ghisla, S.; Kieschke, K. Studies on the reaction mechanism of lactate oxidase. Formation of two covalent flavin-substrate adducts on reaction with glycollate. J. Biol. Chem. 1980, 255, 2796–2806. [Google Scholar]
- Borshchevskaya, L.; Gordeeva, T.; Kalinina, A.; Sineokii, S. Spectrophotometric determination of lactic acid. J. Anal. Chem. 2016, 71, 755–758. [Google Scholar] [CrossRef]
- Pyne, D.B.; Boston, T.; Martin, D.T.; Logan, A. Evaluation of the Lactate Pro blood lactate analyser. Eur. J. Appl. Physiol. 2000, 82, 112–116. [Google Scholar] [CrossRef]
- Reeves, J.; McCarty, G.; Meisinger, J. Near infrared reflectance spectroscopy for the analysis of agricultural soils. J. Near Infrared Spectrosc. 1999, 7, 179–193. [Google Scholar] [CrossRef]
- Wenz, J.J. Examining water in model membranes by near infrared spectroscopy and multivariate analysis. Biochimica et Biophysica Acta (BBA)-Biomembranes 2018, 1860, 673–682. [Google Scholar] [CrossRef]
- Tanner, R.K.; Fuller, K.L.; Ross, M.L.R. Evaluation of three portable blood lactate analysers: Lactate Pro, Lactate Scout and Lactate Plus. Eur. J. Appl. Physiol. 2010, 109, 551–559. [Google Scholar] [CrossRef]
- Petibois, C.; Melin, A.M.; Perromat, A.; Cazorla, G.; Deleris, G. Glucose and lactate concentration determination on single microsamples by Fourier-transform infrared spectroscopy. J. Lab. Clin. Med. 2000, 135, 210–215. [Google Scholar] [CrossRef] [PubMed]
- RADIOMETER ABL800 FLEX Operator’s Manual; Technical Report; Radiometer: Copenhagen, Denmark, 2008.
- Mackanos, M.A.; Contag, C.H. Fiber-optic probes enable cancer detection with FTIR spectroscopy. Trends Biotechnol. 2010, 28, 317–323. [Google Scholar] [CrossRef] [PubMed]
- Godinjak, A.; Jusufovic, S.; Rama, A.; Iglica, A.; Zvizdic, F.; Kukuljac, A.; Tancica, I.; Rozajac, S. Hyperlactatemia and the Importance of Repeated Lactate Measurements in Critically Ill Patients. Med. Arch. 2017, 71, 404–407. [Google Scholar] [CrossRef] [PubMed] [Green Version]


© 2020 by the authors. Licensee MDPI, Basel, Switzerland. This article is an open access article distributed under the terms and conditions of the Creative Commons Attribution (CC BY) license (http://creativecommons.org/licenses/by/4.0/).
Share and Cite
Budidha, K.; Mamouei, M.; Baishya, N.; Qassem, M.; Vadgama, P.; Kyriacou, P.A. Identification and Quantitative Determination of Lactate Using Optical Spectroscopy—Towards a Noninvasive Tool for Early Recognition of Sepsis. Sensors 2020, 20, 5402. https://doi.org/10.3390/s20185402
Budidha K, Mamouei M, Baishya N, Qassem M, Vadgama P, Kyriacou PA. Identification and Quantitative Determination of Lactate Using Optical Spectroscopy—Towards a Noninvasive Tool for Early Recognition of Sepsis. Sensors. 2020; 20(18):5402. https://doi.org/10.3390/s20185402
Chicago/Turabian StyleBudidha, Karthik, Mohammad Mamouei, Nystha Baishya, Meha Qassem, Pankaj Vadgama, and Panayiotis A. Kyriacou. 2020. "Identification and Quantitative Determination of Lactate Using Optical Spectroscopy—Towards a Noninvasive Tool for Early Recognition of Sepsis" Sensors 20, no. 18: 5402. https://doi.org/10.3390/s20185402
APA StyleBudidha, K., Mamouei, M., Baishya, N., Qassem, M., Vadgama, P., & Kyriacou, P. A. (2020). Identification and Quantitative Determination of Lactate Using Optical Spectroscopy—Towards a Noninvasive Tool for Early Recognition of Sepsis. Sensors, 20(18), 5402. https://doi.org/10.3390/s20185402