Pattern Recognition of Cognitive Load Using EEG and ECG Signals


Abstract
1. Introduction
2. Materials and Methods
2.1. Subjects
2.2. Experiment Procedure
2.3. Grouping Rules
2.4. Feature Extraction
2.5. Balanced Sample Sets
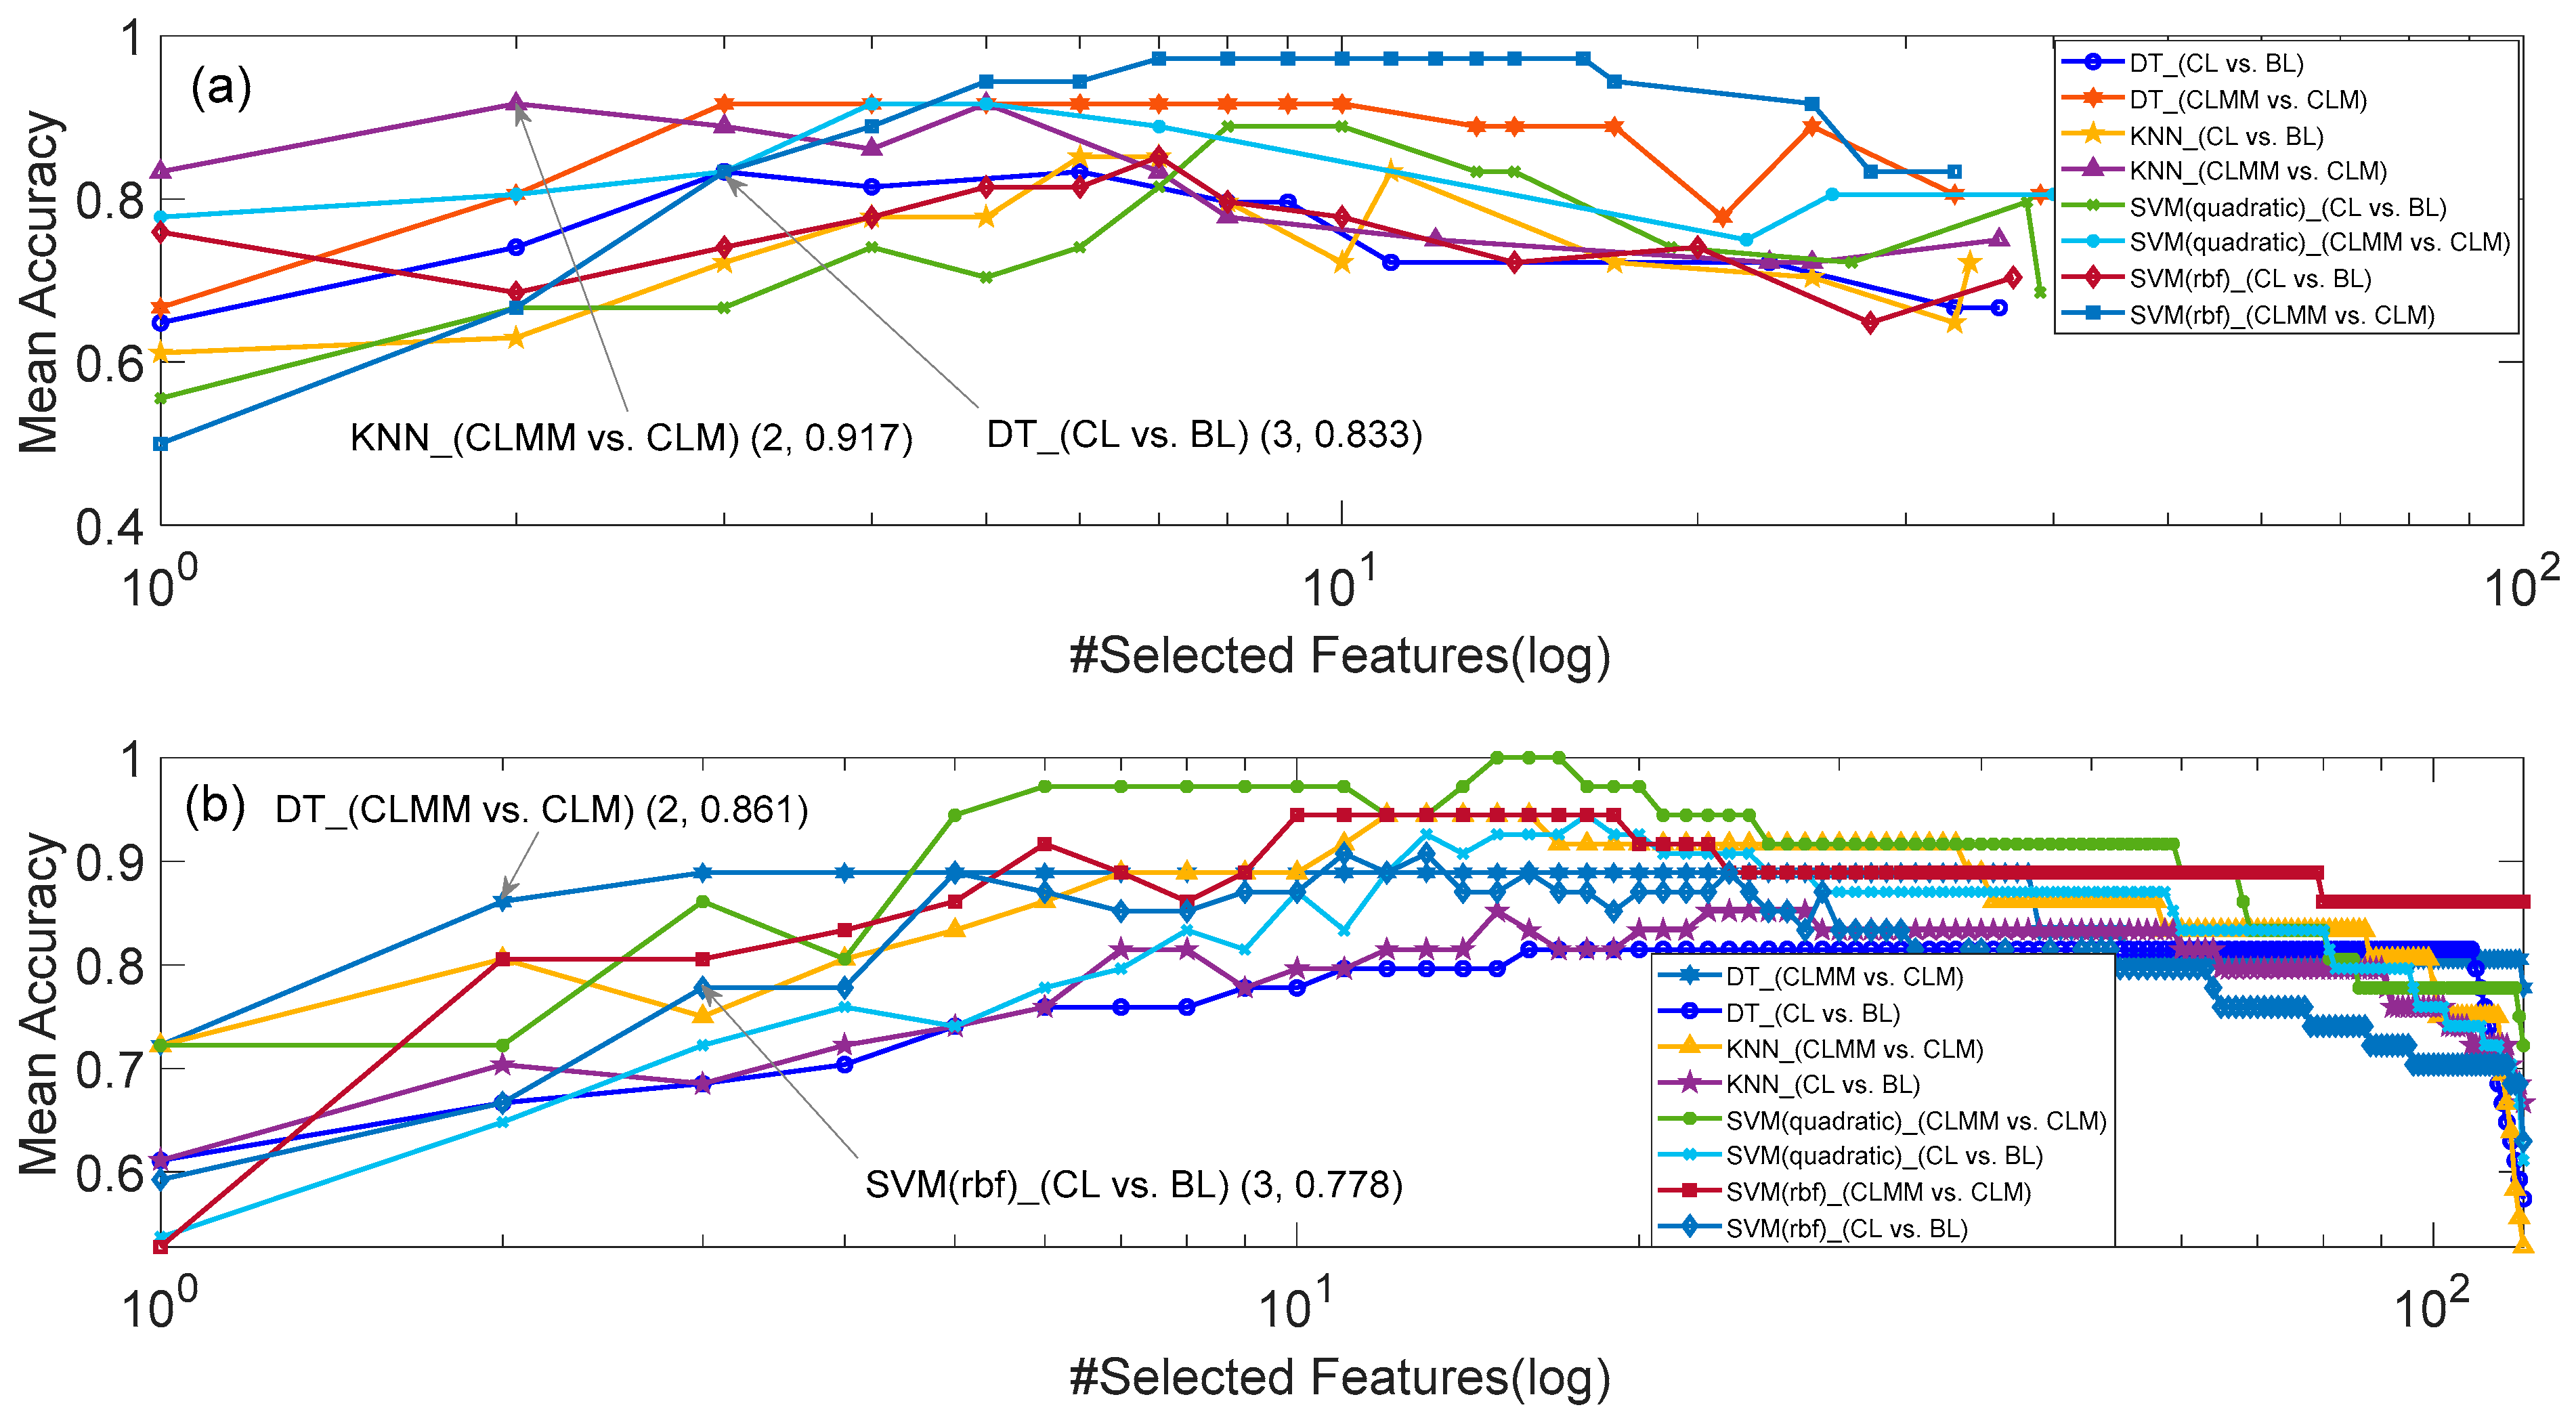
2.6. Feature Selection and Classification

| EEG Index | Description | Relation with CNS Activity |
|---|---|---|
| DP | Delta band (1–4 Hz) power | A measure of unconscious mind [34]. |
| TP | Theta band (4.1–5.8 Hz) power | A measure of subconscious mind [34]. |
| AP | Alpha band (5.9–7.4 Hz) power | A measure of relaxed mental state [34]. |
| BP | Beta band (13–19.9 Hz) power | A measure of active state of mind [34]. |
| GP | Gamma band (20–25 Hz) power | A measure of hyper brain activity [34]. |
| WE | Wavelet entropy | A measure of energy distribution of EEG at different scales [39]. |
3. Results
3.1. Parameter Settings of Entropy Features
3.2. Results of Feature Selection
3.3. Validation with E-Learning Data
4. Discussion
5. Conclusions
Author Contributions
Funding
Conflicts of Interest
References
- Zambrano, J.; Kirschner, F.; Sweller, J.; Kirschner, P.A. Effects of prior knowledge on collaborative and individual learning. Learn. Instr. 2019, 63, 101214. [Google Scholar] [CrossRef]
- Le, Y.; Liu, J.; Deng, C.; Dai, D.Y. Heart rate variability reflects the effects of emotional design principle on mental effort in multimedia learning. Comput. Hum. Behav. 2018, 89, 40–47. [Google Scholar] [CrossRef]
- Wong, A.; Leahy, W.; Marcus, N.; Sweller, J. Cognitive load theory, the transient information effect and e-learning. Learn. Instr. 2012, 22, 449–457. [Google Scholar] [CrossRef]
- Sweller, J. Cognitive Load Theory. Psychol. Learn. Motiv. Cogn. Educ. 2011, 55, 37–76. [Google Scholar]
- Johannessen, E.; Szulewski, A.; Radulovic, N.; White, M.; Braund, H.; Howes, D.; Rodenburg, D.; Davies, C. Psychophysiologic measures of cognitive load in physician team leaders during trauma resuscitation. Comput. Hum. Behav. 2020, 111, 106393. [Google Scholar] [CrossRef]
- MacPherson, M.K.; Abur, D.; Stepp, C.E. Acoustic Measures of Voice and Physiologic Measures of Autonomic Arousal during Speech as a Function of Cognitive Load. J. Voice 2017, 31, 504.e1–504.e9. [Google Scholar] [CrossRef]
- Hughes, A.M.; Hancock, G.M.; Marlow, S.L.; Stowers, K.; Salas, E. Cardiac Measures of Cognitive Workload: A Meta-Analysis. Hum. Factors 2019, 61, 393–414. [Google Scholar] [CrossRef]
- Kardan, O.; Adam, K.C.; Mance, I.; Churchill, N.W.; Vogel, E.K.; Berman, M.G. Distinguishing cognitive effort and working memory load using scale-invariance and alpha suppression in EEG. NeuroImage 2020, 211, 116622. [Google Scholar] [CrossRef]
- Castro-Meneses, L.J.; Kruger, J.-L.; Doherty, S. Validating theta power as an objective measure of cognitive load in educational video. Educ. Technol. Res. Dev. 2019, 68, 181–202. [Google Scholar] [CrossRef]
- Jimenez-Guarneros, M.; Gomez-Gil, P. Custom Domain Adaptation: A New Method for Cross-Subject, EEG-Based Cognitive Load Recognition. IEEE Signal Process. Lett. 2020, 27, 750–754. [Google Scholar] [CrossRef]
- Hasanbasic, A.; Spahic, M.; Bosnjic, D.; Adzic, H.H.; Mesic, V.; Jahic, O. Recognition of stress levels among students with wearable sensors. In Proceedings of the 2019 18th International Symposium INFOTEH-JAHORINA (INFOTEH), East Sarajevo, Bosnia and Herzegovina, 20–22 March 2019; pp. 1–4. [Google Scholar] [CrossRef]
- Melillo, P.; Bracale, U.; Pecchia, L. Nonlinear Heart Rate Variability features for real-life stress detection. Case study: Students under stress due to university examination. Biomed. Eng. Online 2011, 10, 96. [Google Scholar] [CrossRef] [PubMed]
- Cheema, A.; Singh, M. An application of phonocardiography signals for psychological stress detection using non-linear entropy based features in empirical mode decomposition domain. Appl. Soft Comput. 2019, 77, 24–33. [Google Scholar] [CrossRef]
- Wang, Q.; Sourina, O. Real-Time Mental Arithmetic Task Recognition from EEG Signals. IEEE Trans. Neural Syst. Rehabil. Eng. 2013, 21, 225–232. [Google Scholar] [CrossRef] [PubMed]
- Al-Shargie, F.M.; Kiguchi, M.; Badruddin, N.; Dass, S.C.; Hani, A.F.M.; Tang, T.B. Mental stress assessment using simultaneous measurement of EEG and fNIRS. Biomed. Opt. Express 2016, 7, 3882–3898. [Google Scholar] [CrossRef]
- McDuff, D.J.; Hernandez, J.; Gontarek, S.; Picard, R.W. Cogcam: Contact-free measurement of cognitive stress during computer tasks with a digital camera. Presented at the in CHI Conference on Human Factors in Computing Systems, San Jose, CA, USA, 7–12 May 2016. [Google Scholar]
- Ahn, J.W.; Ku, Y.; Kim, H.C. A Novel Wearable EEG and ECG Recording System for Stress Assessment. Sensors 2019, 19, 1991. [Google Scholar] [CrossRef]
- Xia, L.; Malik, A.S.; Subhani, A.R. A physiological signal-based method for early mental-stress detection. Biomed. Signal Process. Control 2018, 46, 18–32. [Google Scholar] [CrossRef]
- Dimitrakopoulos, G.N.; Kakkos, I.; Dai, Z.; Lim, J.; deSouza, J.J.; Bezerianos, A.; Sun, Y. Task-Independent Mental Workload Classification Based Upon Common Multiband EEG Cortical Connectivity. IEEE Trans. Neural Syst. Rehabil. Eng. 2017, 25, 1940–1949. [Google Scholar] [CrossRef]
- Yu, J.; Liu, G.Y.; Wen, W.H.; Chen, C.W. Evaluating cognitive task result through heart rate pattern analysis. Healthc. Technol. Lett. 2020, 7, 41–44. [Google Scholar] [CrossRef]
- Wang, C.; Guo, J. A data-driven framework for learners’ cognitive load detection using ECG-PPG physiological feature fusion and XGBoost classification. Procedia Comput. Sci. 2019, 147, 338–348. [Google Scholar] [CrossRef]
- Das Chakladar, D.; Dey, S.; Roy, P.P.; Dogra, D.P. EEG-based mental workload estimation using deep BLSTM-LSTM network and evolutionary algorithm. Biomed. Signal Process. Control 2020, 60, 101989. [Google Scholar] [CrossRef]
- Barua, S.; Ahmed, M.U.; Begum, S. Towards Intelligent Data Analytics: A Case Study in Driver Cognitive Load Classification. Brain Sci. 2020, 10, 526. [Google Scholar] [CrossRef] [PubMed]
- Plechawska-Wójcik, M.; Tokovarov, M.; Kaczorowska, M.; Zapała, D. A Three-Class Classification of Cognitive Workload Based on EEG Spectral Data. Appl. Sci. 2019, 9, 5340. [Google Scholar] [CrossRef]
- Fan, X.; Zhao, C.; Zhang, X.; Luo, H.; Zhang, W. Assessment of mental workload based on multi-physiological signals. Technol. Health Care 2020, 28, S67–S80. [Google Scholar] [CrossRef] [PubMed]
- Hillmert, M.; Bergmuller, A.; Minow, A.; Raggatz, J.; Bockelmann, I. Psychophysiological strain correlates during cognitive workload A laboratory study using EEG and ECG. Zent. Fur Arb. Arb. Und Ergon. 2020, 70, 149–163. [Google Scholar]
- Goldberger, A.L.; Amaral, L.A.; Glass, L.; Hausdorff, J.M.; Ivanov, P.C.; Mark, R.G.; Mietus, J.E.; Moody, G.B.; Peng, C.K.; Stanley, H. PhysioBank, PhysioToolkit, and PhysioNet: Components of a new research resource for complex physiologic signals. Circulation 2000, 101, e215–e220. [Google Scholar] [CrossRef]
- Zyma, I.; Tukaiev, S.; Seleznov, I.; Kiyono, K.; Popov, A.; Chernykh, M.; Shpenkov, O. Electroencephalograms during Mental Arithmetic Task Performance. Data 2019, 4, 14. [Google Scholar] [CrossRef]
- Wen, W.H.; Liu, G.Y.; Mao, Z.H.; Huang, W.J.; Zhang, X.; Hu, H.; Yang, J.; Jia, W. Toward Constructing a Real-time Social Anxiety Evaluation System: Exploring Effective Heart Rate Features. IEEE Trans. Affect. Comput. 2020, 11, 100–110. [Google Scholar] [CrossRef]
- Carr, O.; de Vos, M.; Saunders, K.E.A. Heart rate variability in bipolar disorder and borderline personality disorder: A clinical review. Évid. Based Ment. Health 2018, 21, 23–30. [Google Scholar] [CrossRef]
- Zhu, J.; Ji, L.; Liu, C. Heart rate variability monitoring for emotion and disorders of emotion. Physiol. Meas. 2019, 40, 064004. [Google Scholar] [CrossRef]
- Hua, Z.; Chen, C.; Zhang, R.; Liu, G.; Wen, W. Diagnosing Various Severity Levels of Congestive Heart Failure Based on Long-Term HRV Signal. Appl. Sci. 2019, 9, 2544. [Google Scholar] [CrossRef]
- Xie, J.; Wen, W.; Liu, G.; Li, Y. Intelligent Biological Alarm Clock for Monitoring Autonomic Nervous Recovery During Nap. Int. J. Comput. Intell. Syst. 2019, 12, 453–459. [Google Scholar] [CrossRef]
- Alarcao, S.M.; Fonseca, M. Emotions Recognition Using EEG Signals: A Survey. IEEE Trans. Affect. Comput. 2019, 10, 374–393. [Google Scholar] [CrossRef]
- Han, H.; Wang, W.-Y.; Mao, B.-H. Borderline-SMOTE: A New Over-Sampling Method in Imbalanced Data Sets Learning. In International Conference on Intelligent Computing; Springer: Berlin/Heidelberg, Germany, 2005; pp. 878–887. [Google Scholar]
- Zhang, J.; Yin, Z.; Cheng, P.; Nichele, S. Emotion recognition using multi-modal data and machine learning techniques: A tutorial and review. Inf. Fusion 2020, 59, 103–126. [Google Scholar] [CrossRef]
- Kennedy, J.; Eberhart, R.C. Particle swarm optimization. In International Conference on Networks; IEEE: Piscataway, NJ, USA, 1995; pp. 1942–1948. [Google Scholar]
- Guyon, I.; Elisseeff, A. An introduction to variable and feature selection. J. Mach. Learn. Res. 2003, 3, 1157–1182. [Google Scholar]
- Marini, F.; Walczak, B. Particle swarm optimization (PSO). A tutorial. Chemom. Intell. Lab. Syst. 2015, 149, 153–165. [Google Scholar] [CrossRef]
- Chen, Y.; Yang, H. Multiscale recurrence analysis of long-term nonlinear and nonstationary time series. Chaos Solitons Fractals 2012, 45, 978–987. [Google Scholar] [CrossRef]


| Study | # Subjects | # Features | # Categories | Classifier | Signals | Best Accuracy | Validation Approach |
|---|---|---|---|---|---|---|---|
| Hasanbasic [11] | 10 | 12 | 3 | SVM | ECG, EDA | 91.00% | SD |
| Melillo [12] | 42 | 3 | 2 | LDA | ECG | 90.00% | SI |
| Cheema [13] | 30 | 5 | 2 | LS-SVM | PCG | 96.67% | SD |
| Wang [14] | 10 | 32 | 2 | PCA, SVM | EEG | 97.14% | SD |
| Al-Shargie [15] | 22 | 9 | 2 | SVM | EEG, fNIRS | 95.10% | SD |
| McDuff [16] | 10 | 7 | 2 | Naïve Bayes | PPG (HR, HRV, BR) | 86.00% | SI |
| Ahn [17] | 14 | 4 | 2 | SVM | ECG, EEG | 87.50% | SD |
| Xia [18] | 22 | 4 | 2 | PCA, SVM | EEG, ECG | 79.54% | SD |
| Dimitrakopoulos [19] | 28 | 23 | 2 | SVM | EEG | 86.00% | SD |
| Yu [20] | 20 | 4 | 2 | ELM | ECG | 84.75% | SI |
| Wang [21] | 160 | - | 2 | LFDM, XGBoost | ECG, PPG | 97.2% | - |
| Das Chakladar [22] | 48 | 6 | 2 | BLSTM-LSTM | EEG | 86.33% | - |
| Barua [23] | 66 | 42 | 2 | Random Forest | HRV, GSR, RESP | 78.00% | SD |
| Plechawska [24] | 11 | 52 | 3 | KNN | EEG | 91.50% | SI |
| Fan [25] | 20 | 5 | 3 | SVM, PCA | EEG, ECG | 80.00% | SI |
| Group | # Subjects | # Male | # Female | Model Name | Physiological Signal |
|---|---|---|---|---|---|
| CL vs. BL | 27 vs. 27 | 8 vs. 7 | 19 vs. 20 | Model A | HRV |
| Model B | EEG | ||||
| Model C | HRV and EEG | ||||
| CLMM vs. CLM | 9 vs. 18 | 3 vs. 5 | 6 vs. 13 | Model D | HRV |
| Model E | EEG | ||||
| Model F | HRV and EEG |
| Indices | Description | Relation with ANS Activity |
|---|---|---|
| SDRR | Standard deviation of RR intervals | A measure of HRV in time domain [26], which reflects the activities of SNS and PNS, mainly SNS activity [27]. |
| RMSSD | Square root of the mean squared differences of successive RR intervals | A measure of HRV at one adjacent beat scale, which reflects the vagal activity [27]. |
| Mean | Mean of RR intervals | A measure of the average level of ANS activity [26]. |
| Area | Summation of RR intervals | A measure of total amount of ANS activity in time domain. |
| MFD | Mean of the first differences of RR intervals | A measure of HRV at one adjacent beat scale, which reflects the average fluctuation of ANS activity [25]. |
| pNN20 | Proportion of differences between successive RR intervals longer than 20 ms | A measure of HRV in time domain, which reflects the fluctuation of ANS activity. |
| pNN10 | Proportion of differences between successive RR intervals longer than 10 ms | A measure of HRV in time domain, which reflects the fluctuation of ANS activity. |
| HRVC | Heart rate variation coefficient, calculated by the ratio of SD to Mean | A measure of normalized fluctuation of ANS activity. |
| VLF | The power of RR intervals between 0 Hz and 0.04 Hz | A measure of SNS activity [28]. |
| LF | The power of RR intervals between 0.04 Hz and 0.15 Hz | A measure of combined activities of SNS and PNS [26,27]. |
| HF | The power of RR intervals between 0.15 Hz and 0.4 Hz | A measure of PNS activity [26,27]. |
| TOTPWR | The power of RR intervals between 0 Hz and 0.4 Hz | A measure of total amount of ANS activity in frequency domain [26]. |
| HF/(LF+HF) | The ratio of HF/(LF+HF) | A measure of normalized PNS activity. |
| LF/(LF+HF) | The ratio of LF/(LF+HF) | A measure of normalized PNS+SNS activity [26]. |
| LF/HF | The ratio of LF/HF | A measure of the balance between SNS and ANS [27]. |
| Entropy | PeEn, ApEn, MFEn, SampEn | Measures of the complexity of RR interval series caused by competition between SNS and PNS [27]. |
| DFA (α1, α2, α1/α2) | Detrend fluctuation analysis | Measures of the fractal properties of RR interval series caused by competition between SNS and PNS [27]. |
| TFC | Total fluctuation coefficient | A measure of the fluctuation of ANS activity in scales 1~M [33]. We set M = 10 in the current work. |
| PP (SD1, SD2, SD1/SD2) | Poincaré Plot | Measures of short-term and long-term HRV, which reflects the fluctuation of ANS activity [26,27]. |
| RLHE | Range of the local Hurst exponents | A measure of the complexity of RR interval series, which is controlled by competition between SNS and PNS [25]. |
| Feature | Group | Mean ± SD | Embedding Dimension | Tolerance Threshold | Sig. | Description |
|---|---|---|---|---|---|---|
| ApEn | CL | 0.67 ± 0.16 | m = 2 | r = 0.4 SDRR | 0.002 | m varies from 1 to 3, and r varies from 0.1 × SDRR to 0.9 × SDRR |
| BL | 0.78 ± 0.14 | |||||
| CLMM | 0.62 ± 0.12 | m = 2 | r = 0.6 SDRR | 0.041 | ||
| CLM | 0.47 ± 0.18 | |||||
| SampEn | CL | 1.17 ± 0.33 | m = 1 | r = 0.3 | 0.01 | m varies from 1 to 3, and r varies from 0.1 to 0.9 |
| BL | 1.39 ± 0.29 | |||||
| CLMM | 0.70 ± 0.16 | m = 2 | r = 0.6 | 0.03 | ||
| CLM | 0.52 ± 0.21 | |||||
| PeEn | CL | 0.59 ± 0.03 | m = 6 | - | 0.009 | m varies from 3 to 7, and τ is calculated by mutual information method |
| BL | 0.61 ± 0.02 | |||||
| CLMM | 0.97 ± 0.13 | m = 3 | - | 0.017 | ||
| CLM | 0.93 ± 0.40 | |||||
| MFEn | CL | 0.33 ± 0.18 | m = 1 | r = 0.1 | <0.001 | m varies from 1 to 3, and r varies from 0.1 to 0.9. The scale of CL vs. BL and CLMM vs. CLM are 5 and 2, respectively |
| BL | 0.50 ± 0.13 | |||||
| CLMM | 1.25 ± 0.16 | m = 3 | r = 0.2 | 0.015 | ||
| CLM | 1.02 ± 0.27 |
| Model | Classifier | Critical Feature Subset | Mfs | Tfs (min) | F1 | Prec. (%) | Sens. (%) | Spec. (%) | AUC | Acc. (%) |
|---|---|---|---|---|---|---|---|---|---|---|
| Model A | SVM_q | Area, LF, HF/(LF+HF) | SBS | 11.9 | 0.87 | 83.3 | 92.6 | 81.5 | 0.87 | 87.0 |
| SVM_r | RMSSD, LF, MFEn | SBS | 10.4 | 0.83 | 82.1 | 85.2 | 81.5 | 0.83 | 83.3 | |
| KNN | Area, LF, LF/HF | SBS | 9.6 | 0.86 | 81.3 | 96.3 | 77.8 | 0.87 | 87.0 | |
| DT | Area, LF, ApEn | SBS | 10.6 | 0.91 | 92.3 | 88.9 | 92.6 | 0.91 | 90.7 | |
| Model B | SVM_q | AP_Pz, BP_F7, BP_O2 | SBS | 29.3 | 0.72 | 71.4 | 74.1 | 70.4 | 0.72 | 72.2 |
| SVM_r | DP_F8, AP_Fp1, BP_Pz | SBS | 25.8 | 0.78 | 75.9 | 81.5 | 74.1 | 0.78 | 77.8 | |
| KNN | DP_T3, TP_F8, AP_O1 | PSO and SBS | 1455.3 | 0.72 | 73.1 | 70.4 | 74.1 | 0.72 | 72.2 | |
| DT | AP_Fp2, AP_Pz, BP_O1 | PSO and SBS | 2234.7 | 0.82 | 78.1 | 92.6 | 74.1 | 0.83 | 83.3 | |
| Model C | SVM_q | AP_O1, AP_A2A1, GP_O1, Mean | SBS | 167.8 | 0.93 | 92.6 | 92.6 | 92.6 | 0.93 | 92.6 |
| SVM_r | WE_P3, Area, LF, ApEn | SBS | 198.5 | 0.91 | 92.3 | 88.9 | 92.6 | 0.91 | 90.7 | |
| KNN | TP_O1, Mean, LF, ApEn | PSO and SBS | 762.9 | 0.90 | 86.7 | 96.3 | 85.2 | 0.91 | 90.7 | |
| DT | BP_F4, Mean, LF, ApEn | SBS | 178.5 | 0.96 | 93.1 | 100 | 92.6 | 0.96 | 96.3 | |
| Model D | SVM_q | MFD, SampEn, MFEn | SBS | 7.9 | 0.88 | 100 | 77.8 | 100 | 0.89 | 88.9 |
| SVM_r | CVrr, SD1, SD1/SD2 | PSO and SBS | 515.8 | 0.91 | 100 | 83.3 | 100 | 0.92 | 91.7 | |
| KNN | ApEn, SD1, SD1/SD2 | PSO and SBS | 558.3 | 0.85 | 93.3 | 77.8 | 94.4 | 0.86 | 86.1 | |
| DT | HF/(LF+HF), α2/α1, TFC | PSO and SBS | 555.0 | 0.92 | 94.1 | 88.9 | 94.4 | 0.92 | 91.7 | |
| Model E | SVM_q | DP_T4, AP_Pz, | PSO and SBS | 1207.0 | 0.80 | 86.7 | 72.2 | 88.9 | 0.81 | 80.6 |
| SVM_r | WE_F4, WE_F7 | SBS | 29.0 | 0.78 | 73.9 | 94.4 | 66.7 | 0.81 | 80.6 | |
| KNN | DP_Cz, BP_F3 | PSO and SBS | 1141.8 | 0.92 | 94.1 | 88.9 | 94.4 | 0.92 | 91.7 | |
| DT | DP_T6, GP_T4 | SBS | 35.2 | 0.85 | 81.0 | 94.4 | 77.8 | 0.86 | 86.1 | |
| Model F | SVM_q | BP_T4, BP_O1, MFD, TFC | SBS | 114.0 | 0.97 | 100 | 94.4 | 100 | 0.97 | 97.2 |
| SVM_r | GP_Fz, MFD, SampEn, SD2 | SBS | 125.8 | 0.94 | 94.4 | 94.4 | 94.4 | 0.94 | 94.4 | |
| KNN | GP_T4, MFD, PeEn, TFC | SBS | 200.8 | 0.94 | 100 | 88.9 | 100 | 0.94 | 94.4 | |
| DT | AP_T4, LF, TFC, SD1/SD2 | SBS | 149.3 | 0.92 | 89.5 | 94.4 | 88.9 | 0.92 | 91.7 |
| Model | Classifier | Mfs | Classified as | CL | BL | CLMM | CLM |
|---|---|---|---|---|---|---|---|
| Model C | SVM_q | SBS | CL | 92.6% | 7.4% | - | - |
| BL | 7.4% | 92.6% | - | - | |||
| SVM_r | SBS | CL | 88.9% | 11.1% | - | - | |
| BL | 7.4% | 92.6% | - | - | |||
| KNN | SBS and PSO | CL | 96.3% | 3.7% | - | - | |
| BL | 14.8% | 85.2% | - | - | |||
| DT | SBS | CL | 100 | 0% | - | - | |
| BL | 7.4% | 92.6% | - | - | |||
| Model F | SVM_q | SBS | CLMM | - | - | 100% | 0% |
| CLM | - | - | 5.6% | 94.4% | |||
| SVM_r | SBS | CLMM | - | - | 94.4% | 5.6% | |
| CLM | - | - | 5.6% | 94.4% | |||
| KNN | SBS | CLMM | - | - | 100% | 0% | |
| CLM | - | - | 11.1% | 88.9% | |||
| DT | SBS | CLMM | - | - | 88.9% | 11.1% | |
| CLM | - | - | 5.6% | 94.4% |
| Classifier | Classified as | CL | BL |
|---|---|---|---|
| DT | CL | 55.0% | 45.0% |
| BL | 19.0% | 81.0% |
© 2020 by the authors. Licensee MDPI, Basel, Switzerland. This article is an open access article distributed under the terms and conditions of the Creative Commons Attribution (CC BY) license (http://creativecommons.org/licenses/by/4.0/).
Share and Cite
Xiong, R.; Kong, F.; Yang, X.; Liu, G.; Wen, W. Pattern Recognition of Cognitive Load Using EEG and ECG Signals. Sensors 2020, 20, 5122. https://doi.org/10.3390/s20185122
Xiong R, Kong F, Yang X, Liu G, Wen W. Pattern Recognition of Cognitive Load Using EEG and ECG Signals. Sensors. 2020; 20(18):5122. https://doi.org/10.3390/s20185122
Chicago/Turabian StyleXiong, Ronglong, Fanmeng Kong, Xuehong Yang, Guangyuan Liu, and Wanhui Wen. 2020. "Pattern Recognition of Cognitive Load Using EEG and ECG Signals" Sensors 20, no. 18: 5122. https://doi.org/10.3390/s20185122
APA StyleXiong, R., Kong, F., Yang, X., Liu, G., & Wen, W. (2020). Pattern Recognition of Cognitive Load Using EEG and ECG Signals. Sensors, 20(18), 5122. https://doi.org/10.3390/s20185122