Comparative Analysis of Object Digitization Techniques Applied to the Characterization of Deformed Materials in Ballistic Tests

 and
and
Abstract
1. Introduction
2. Review of Surface 3D Scanning
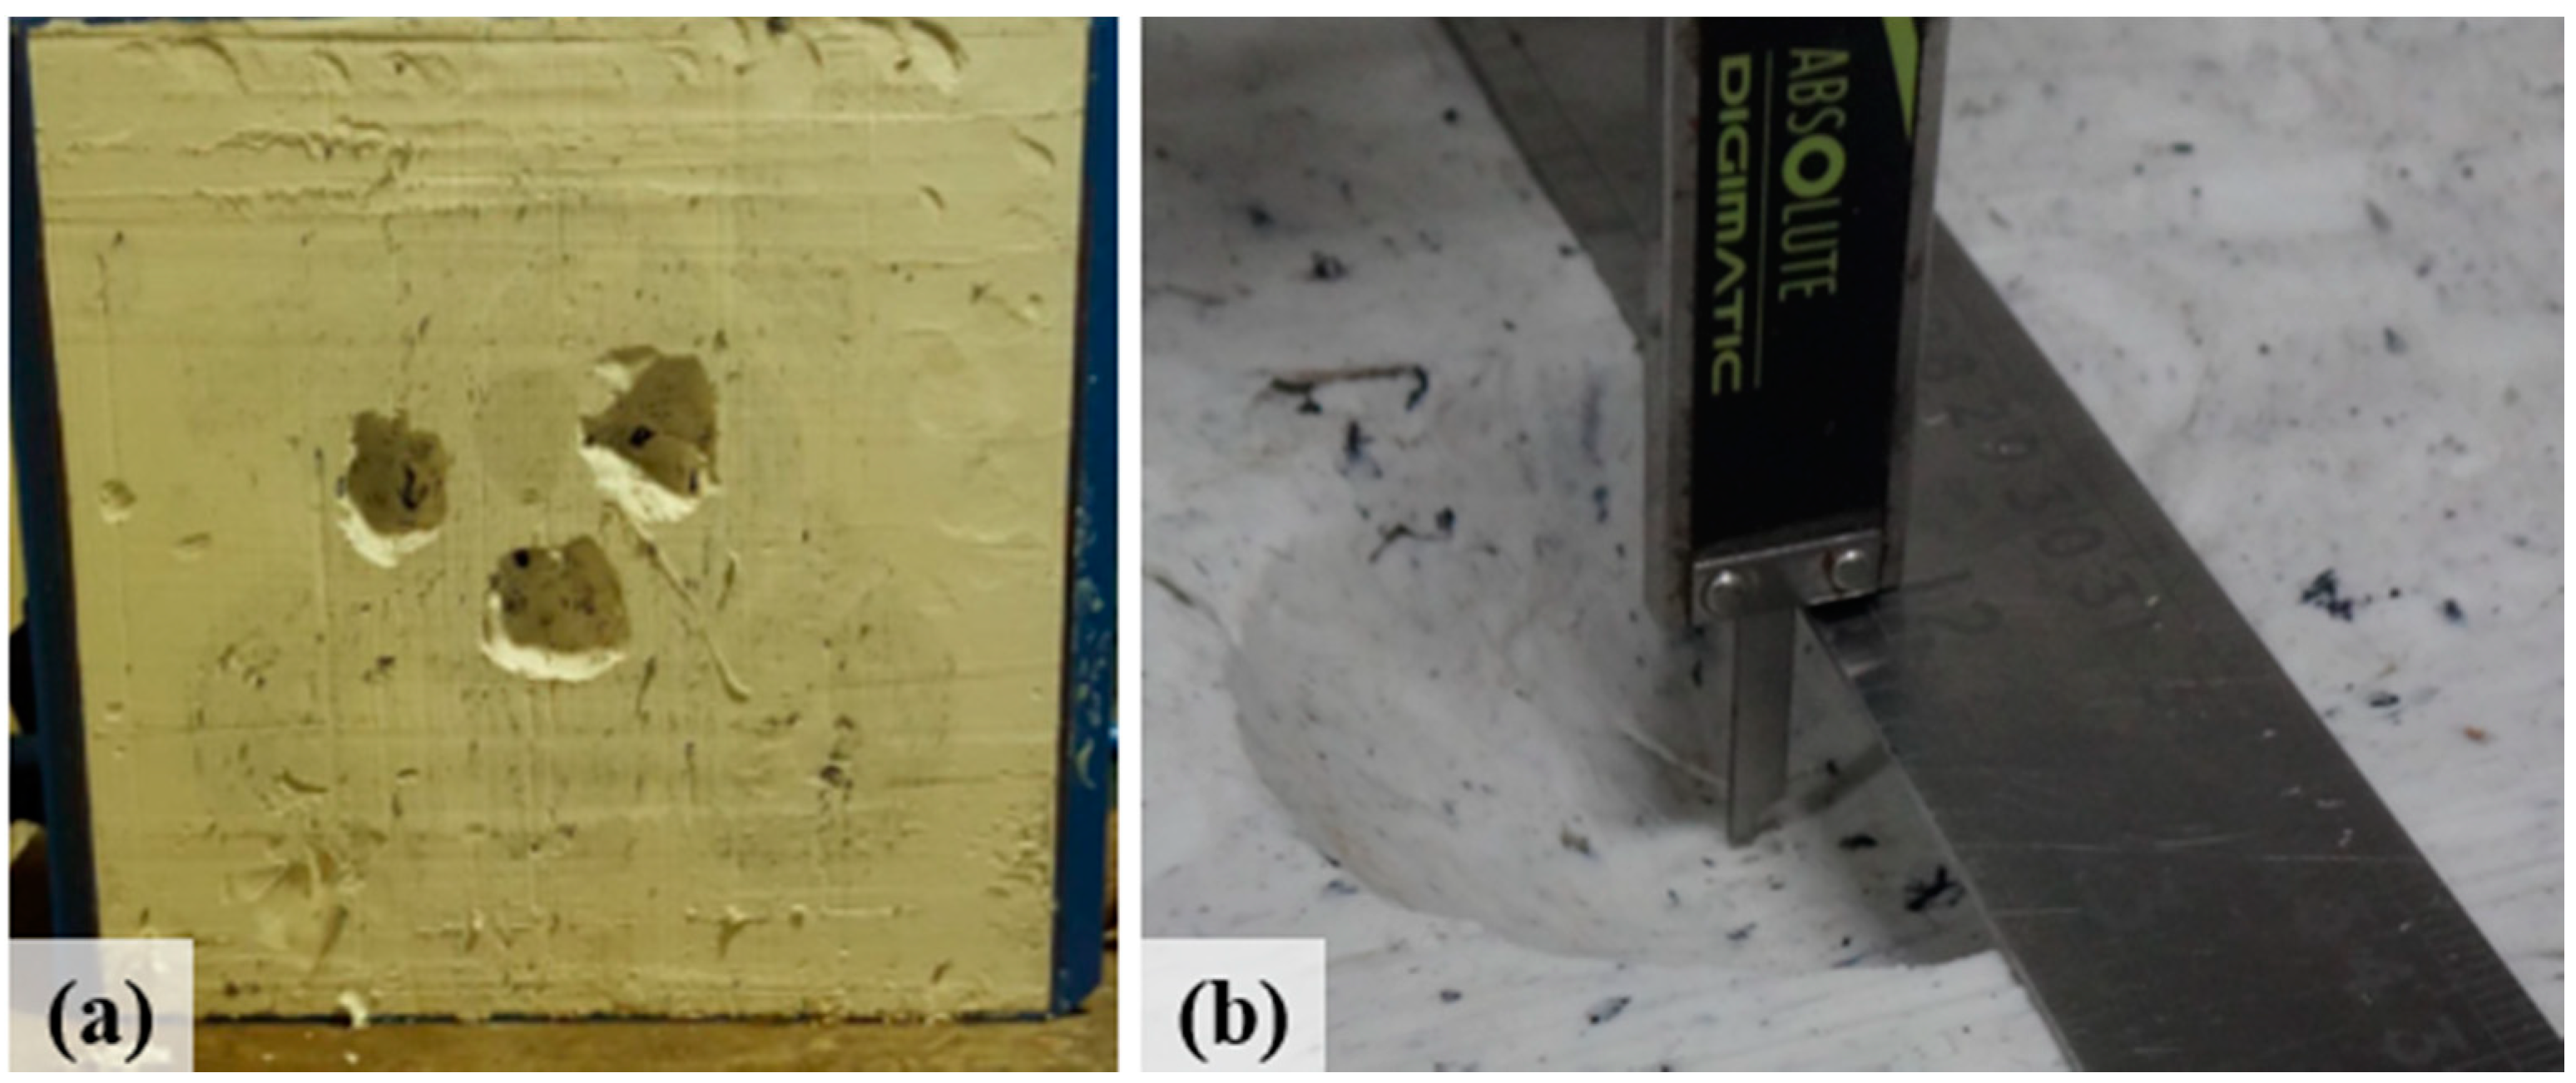
3. Ballistic Tests on Bulletproof Vests (Body Armor)
4. 3D Scanning Techniques
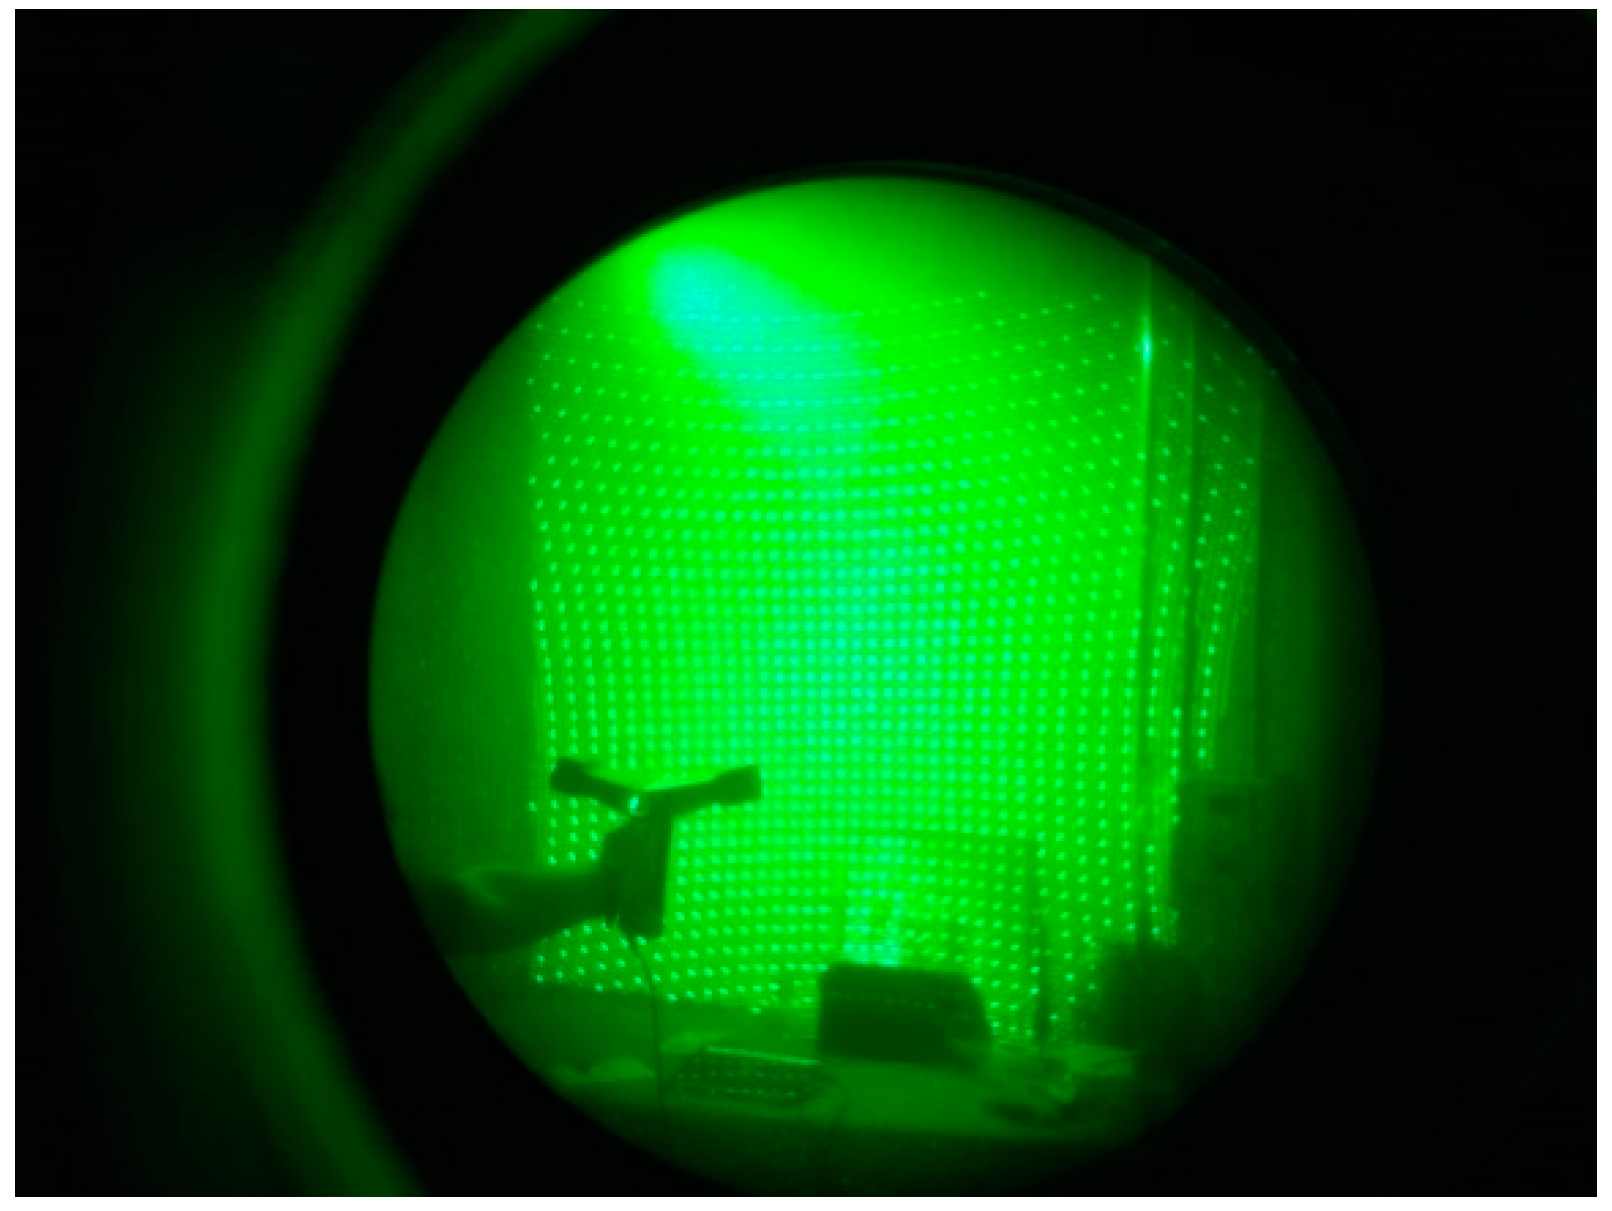
4.1. Optical 3D Scanners by Structured Light Projection
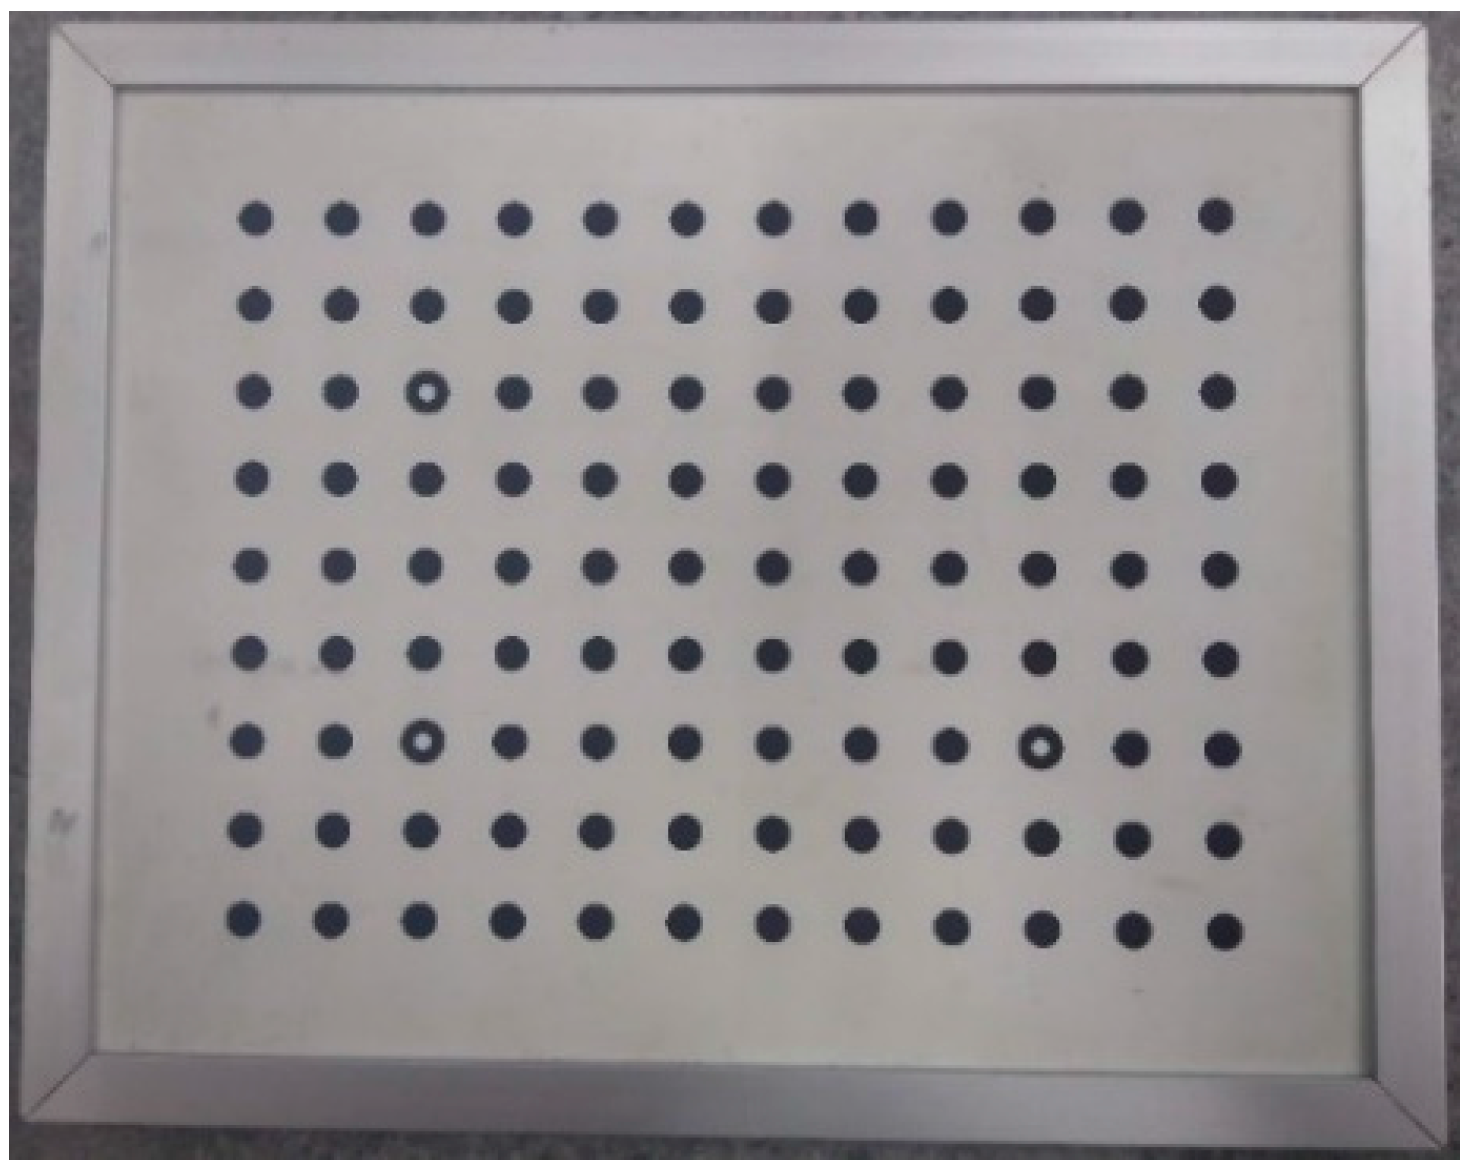
4.2. 3D Reconstruction by Stereo Images
- (a)
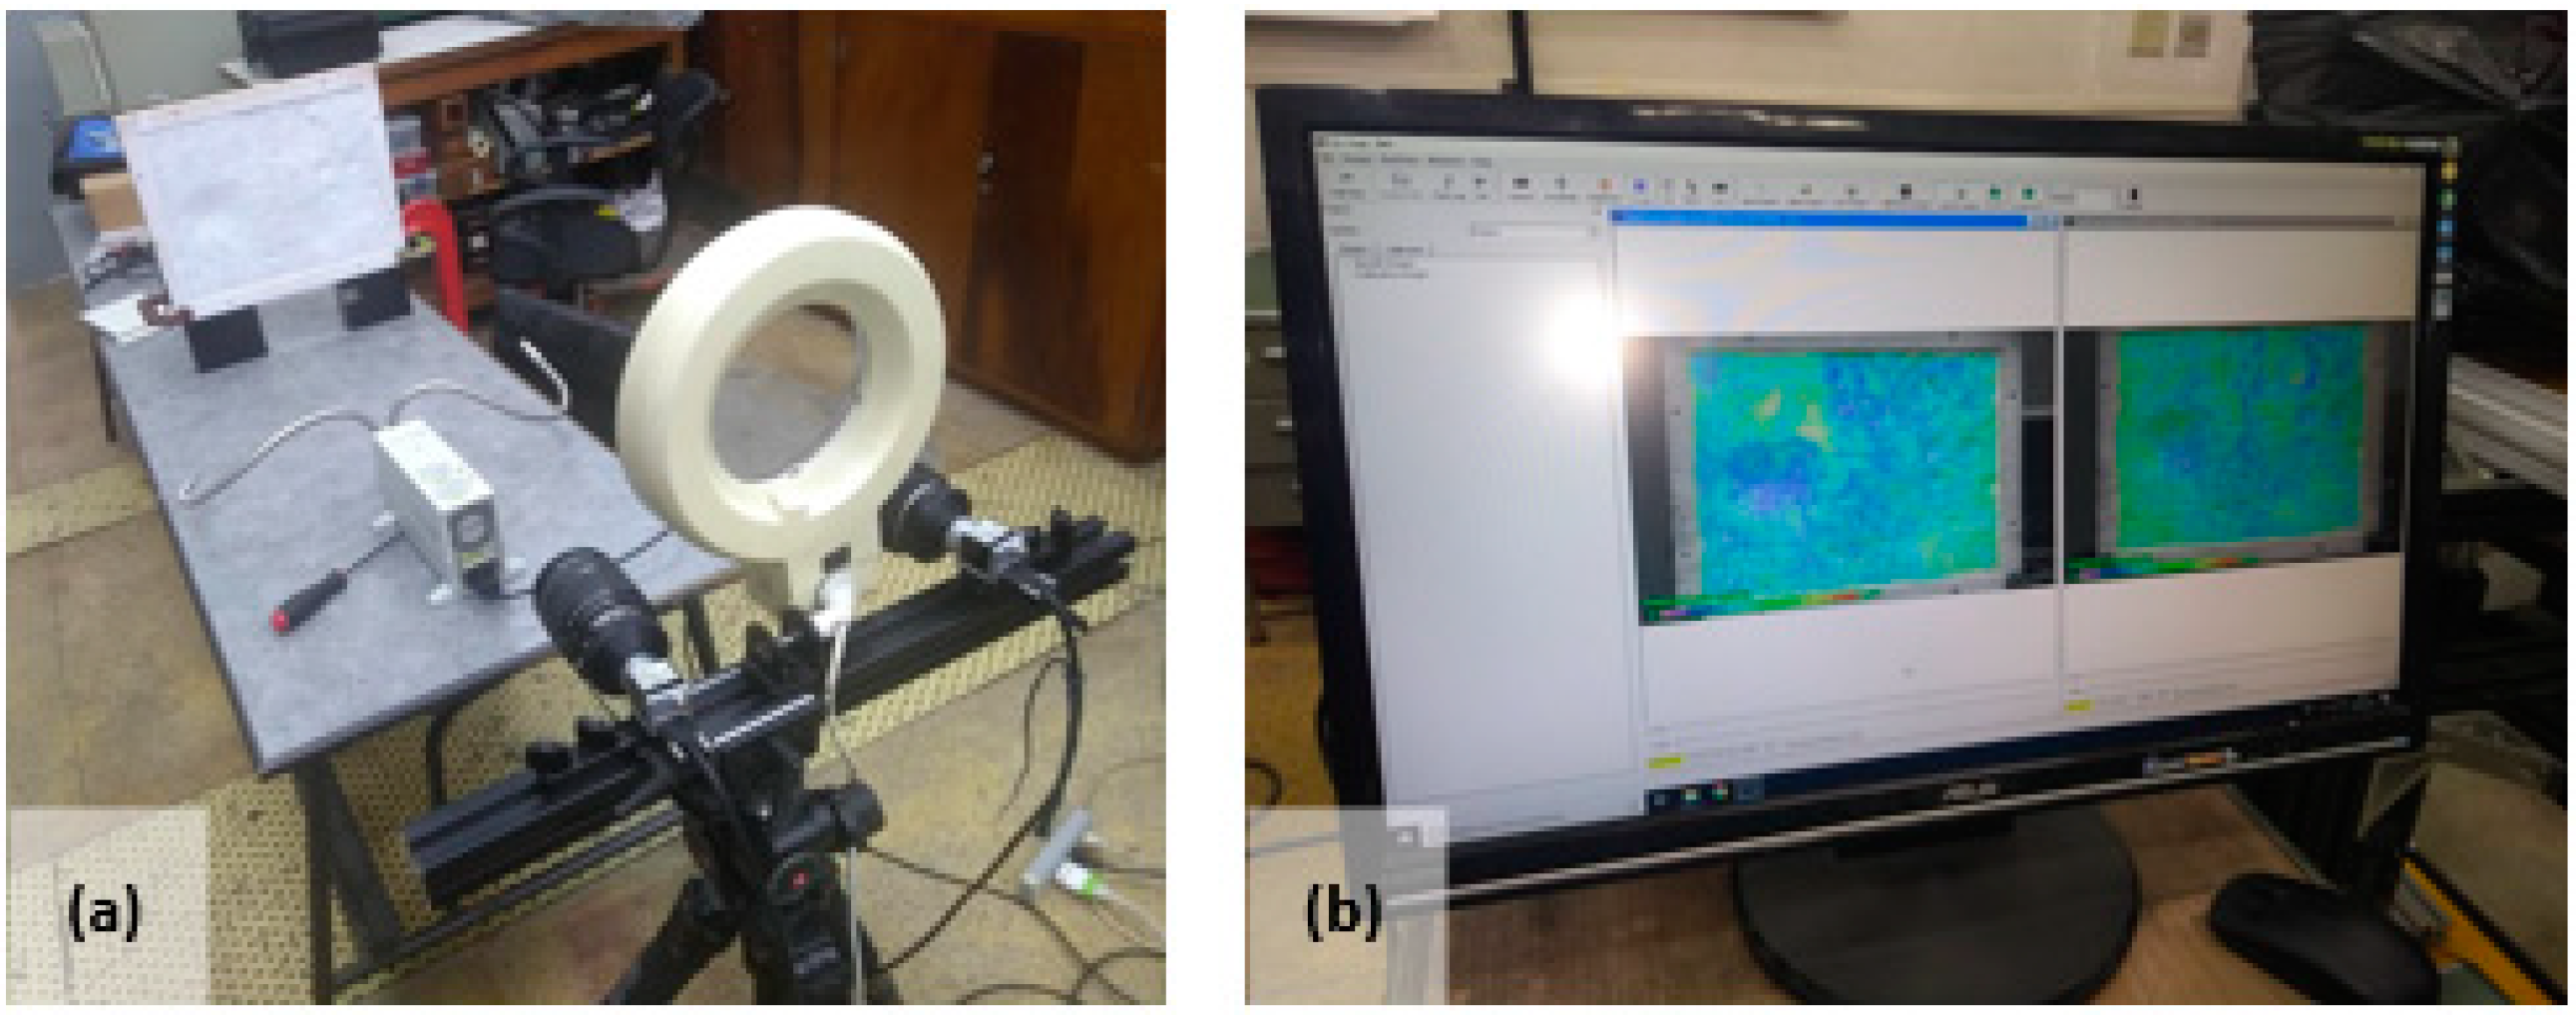
- Calibration of the cameras, which defines the internal and external parameters of the vision system used [34]. Calibration allows the acquisition to be carried out with some level of standardization of information at the level of the vision system employed, using some known reference standard (Figure 4).
- (b)
- Acquisition of stereo images of the same object by a pair of identical or similar cameras. It should be noted that information such as the distance between cameras and other aspects, such as the luminosity and reflectivity of the surface of interest, can influence the acquisition process, as previously mentioned.
- (c)
- A stereo analysis extracts information by comparing the two images and the location of objects in three-dimensional space [34].
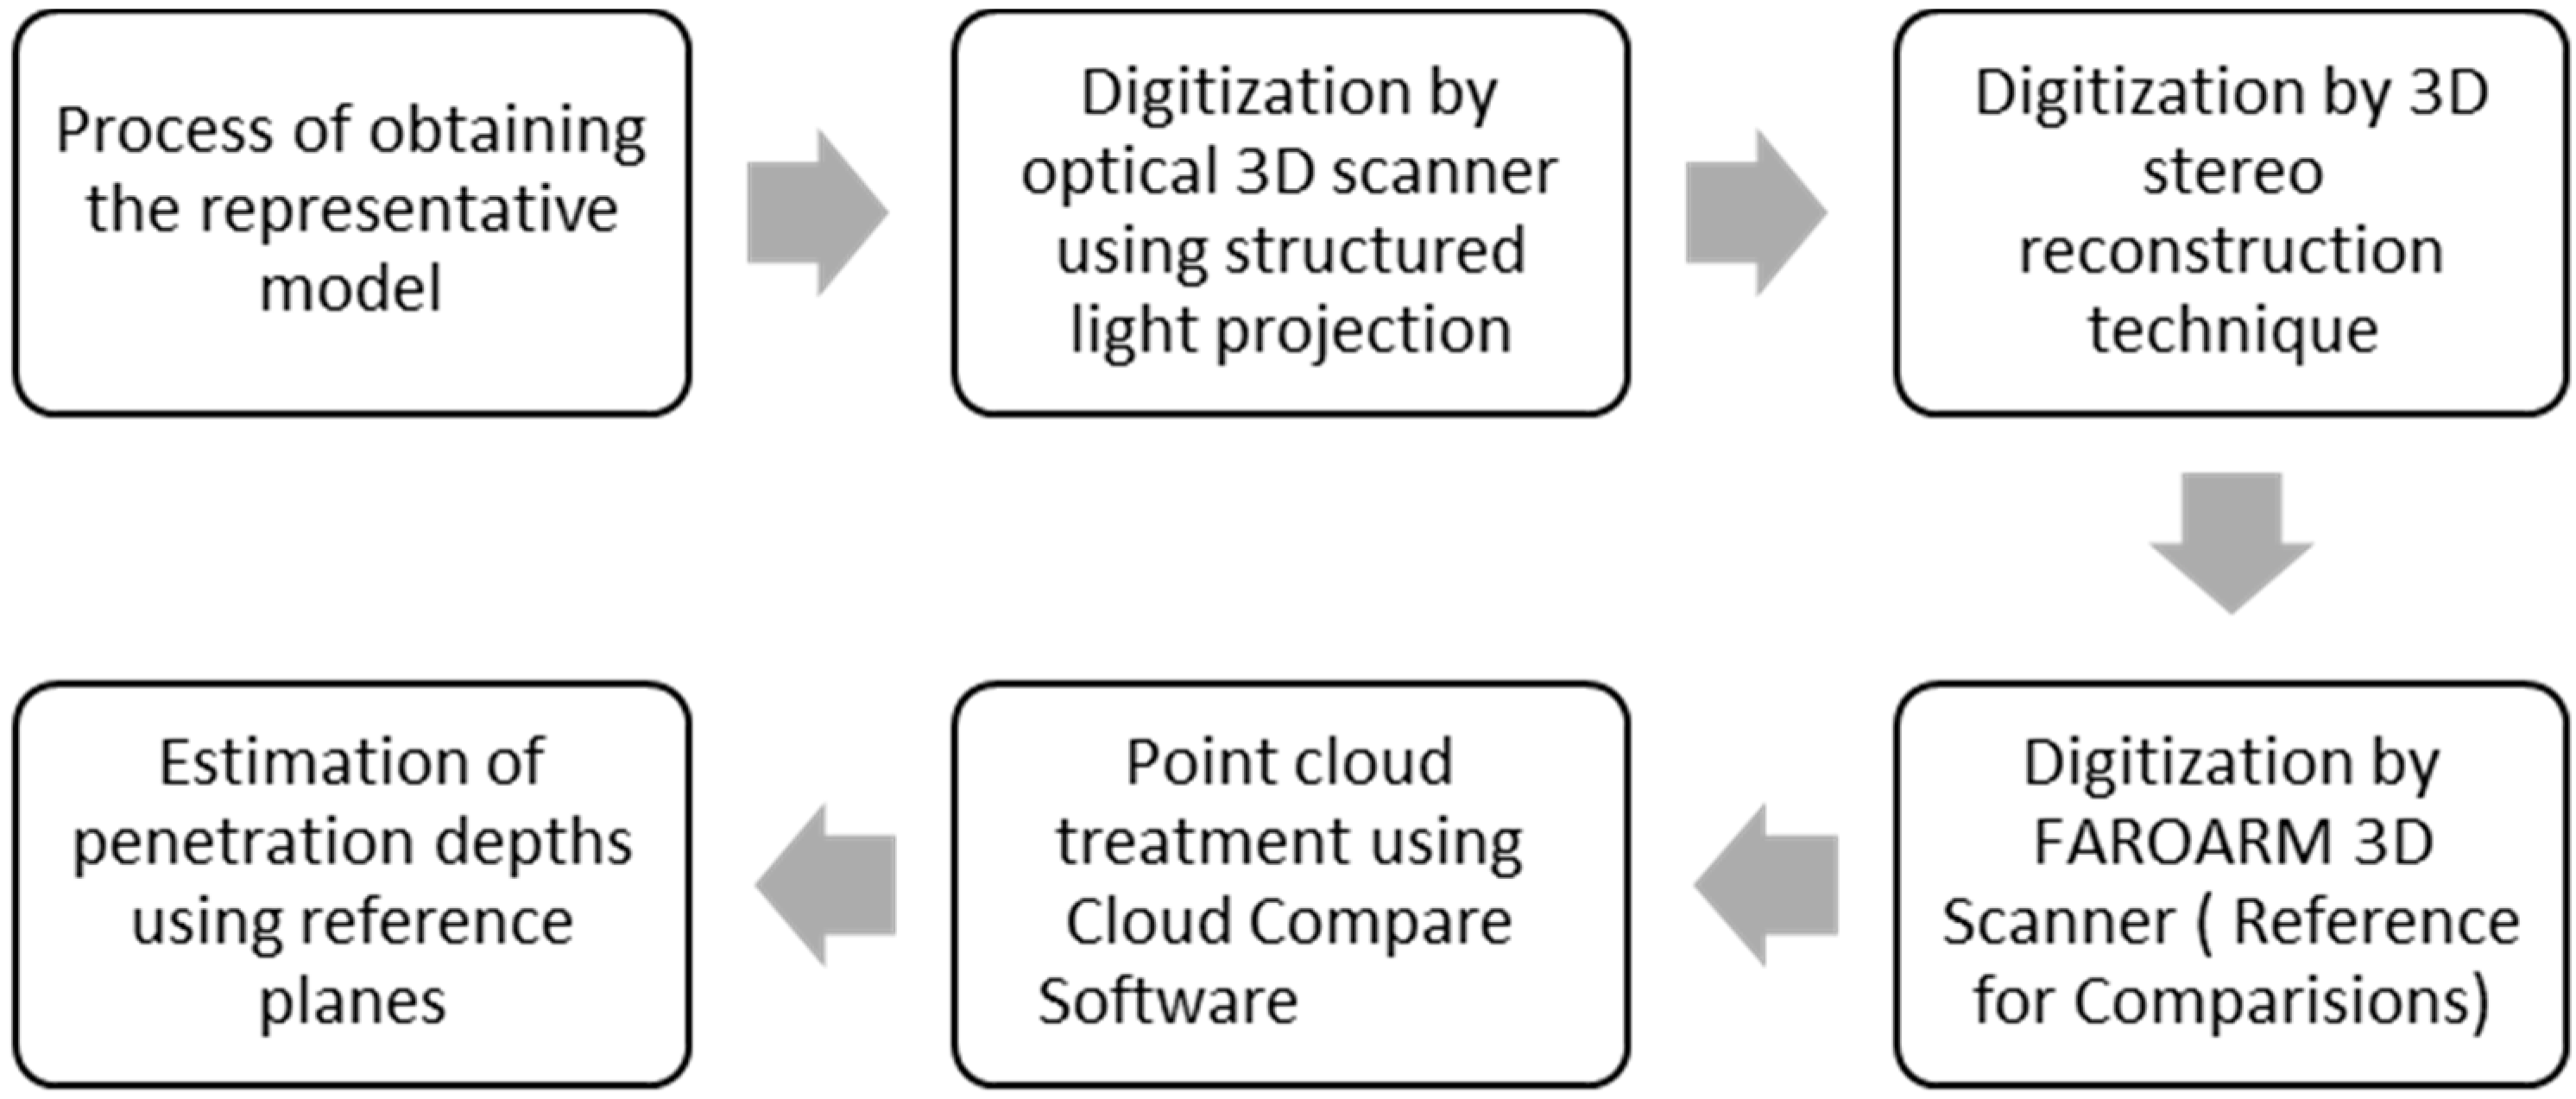
5. Materials and Methods
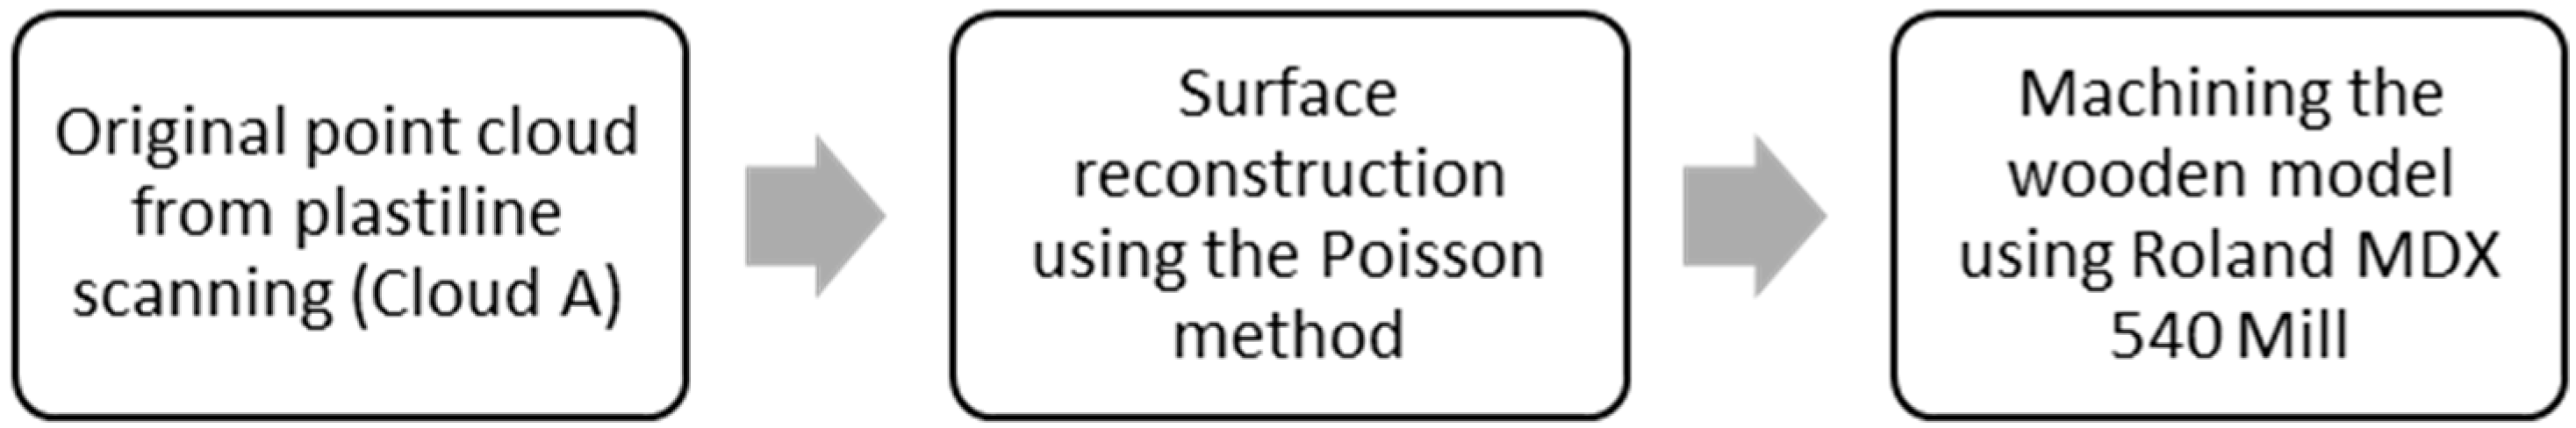
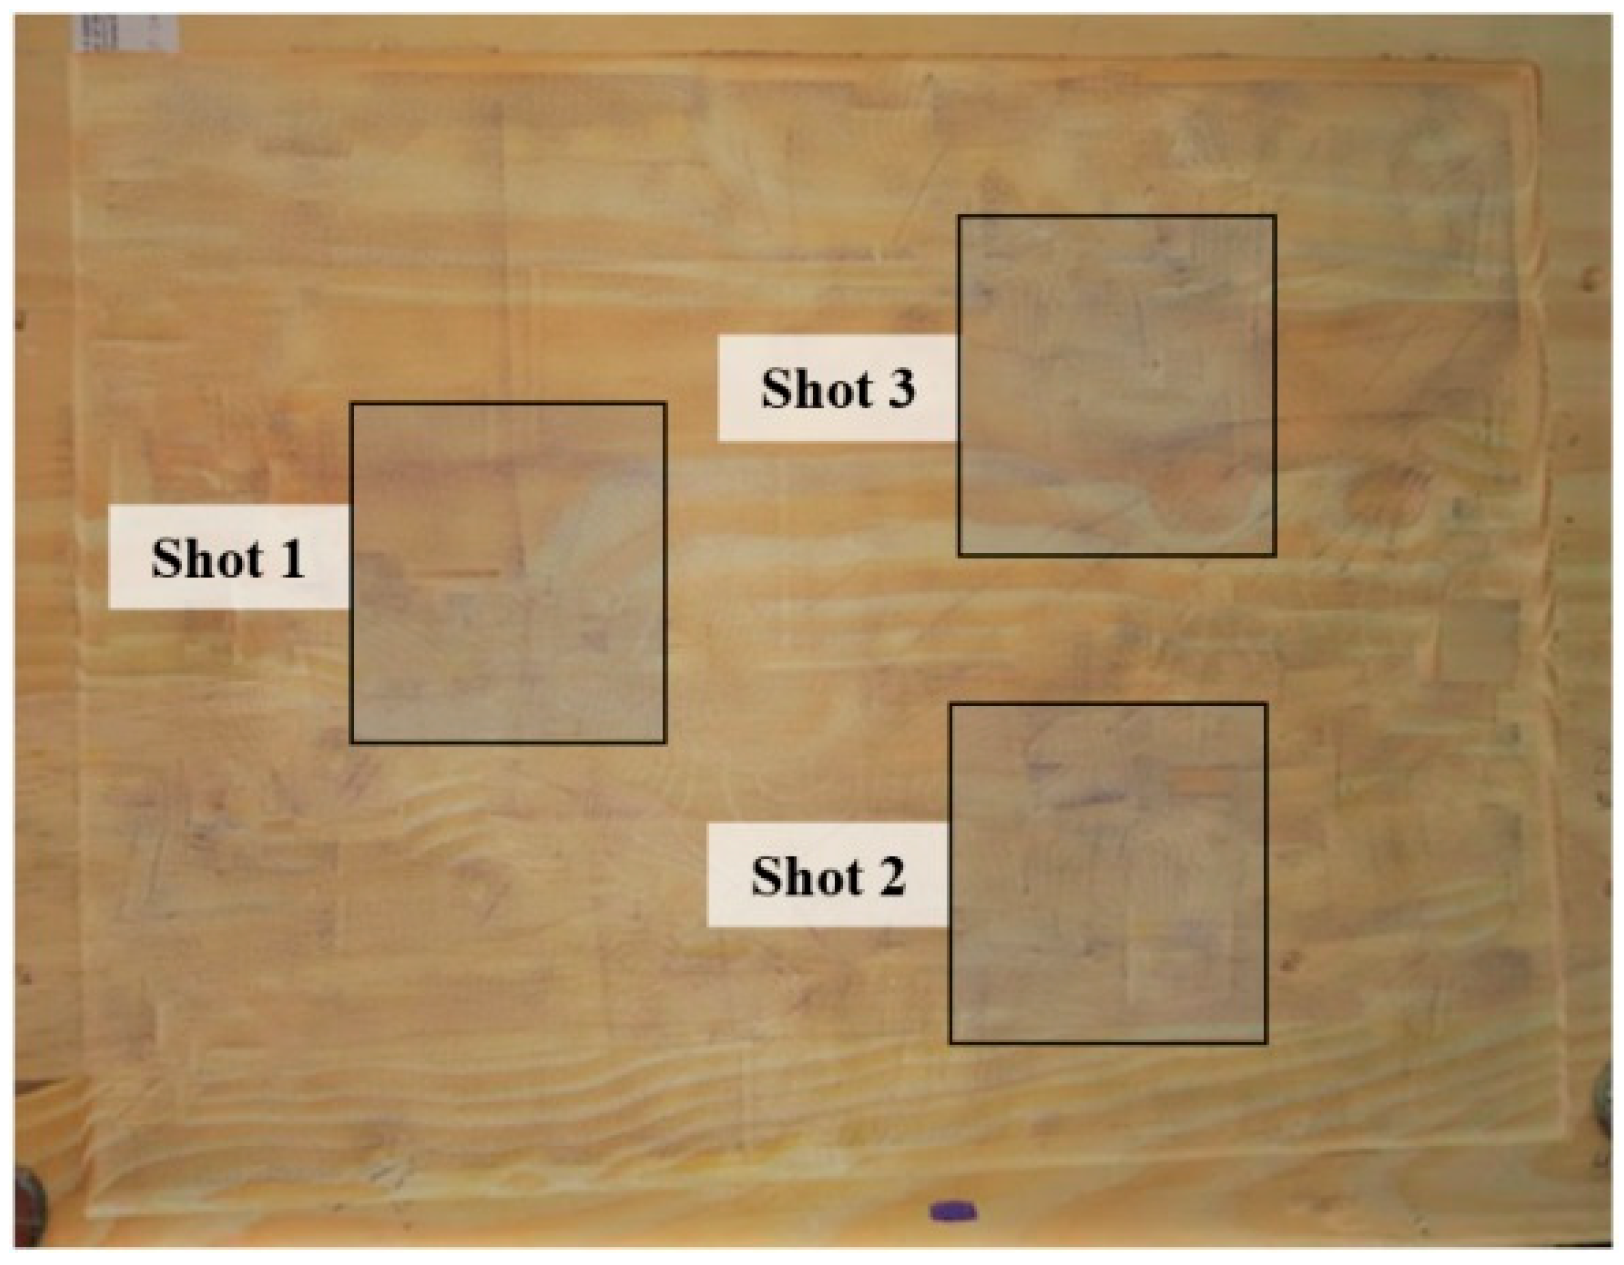
5.1. Process of Obtaining the Representative Model and Point Cloud
5.2. Digitization by the Optical 3D Handheld Scanner Using Structured Light Projection
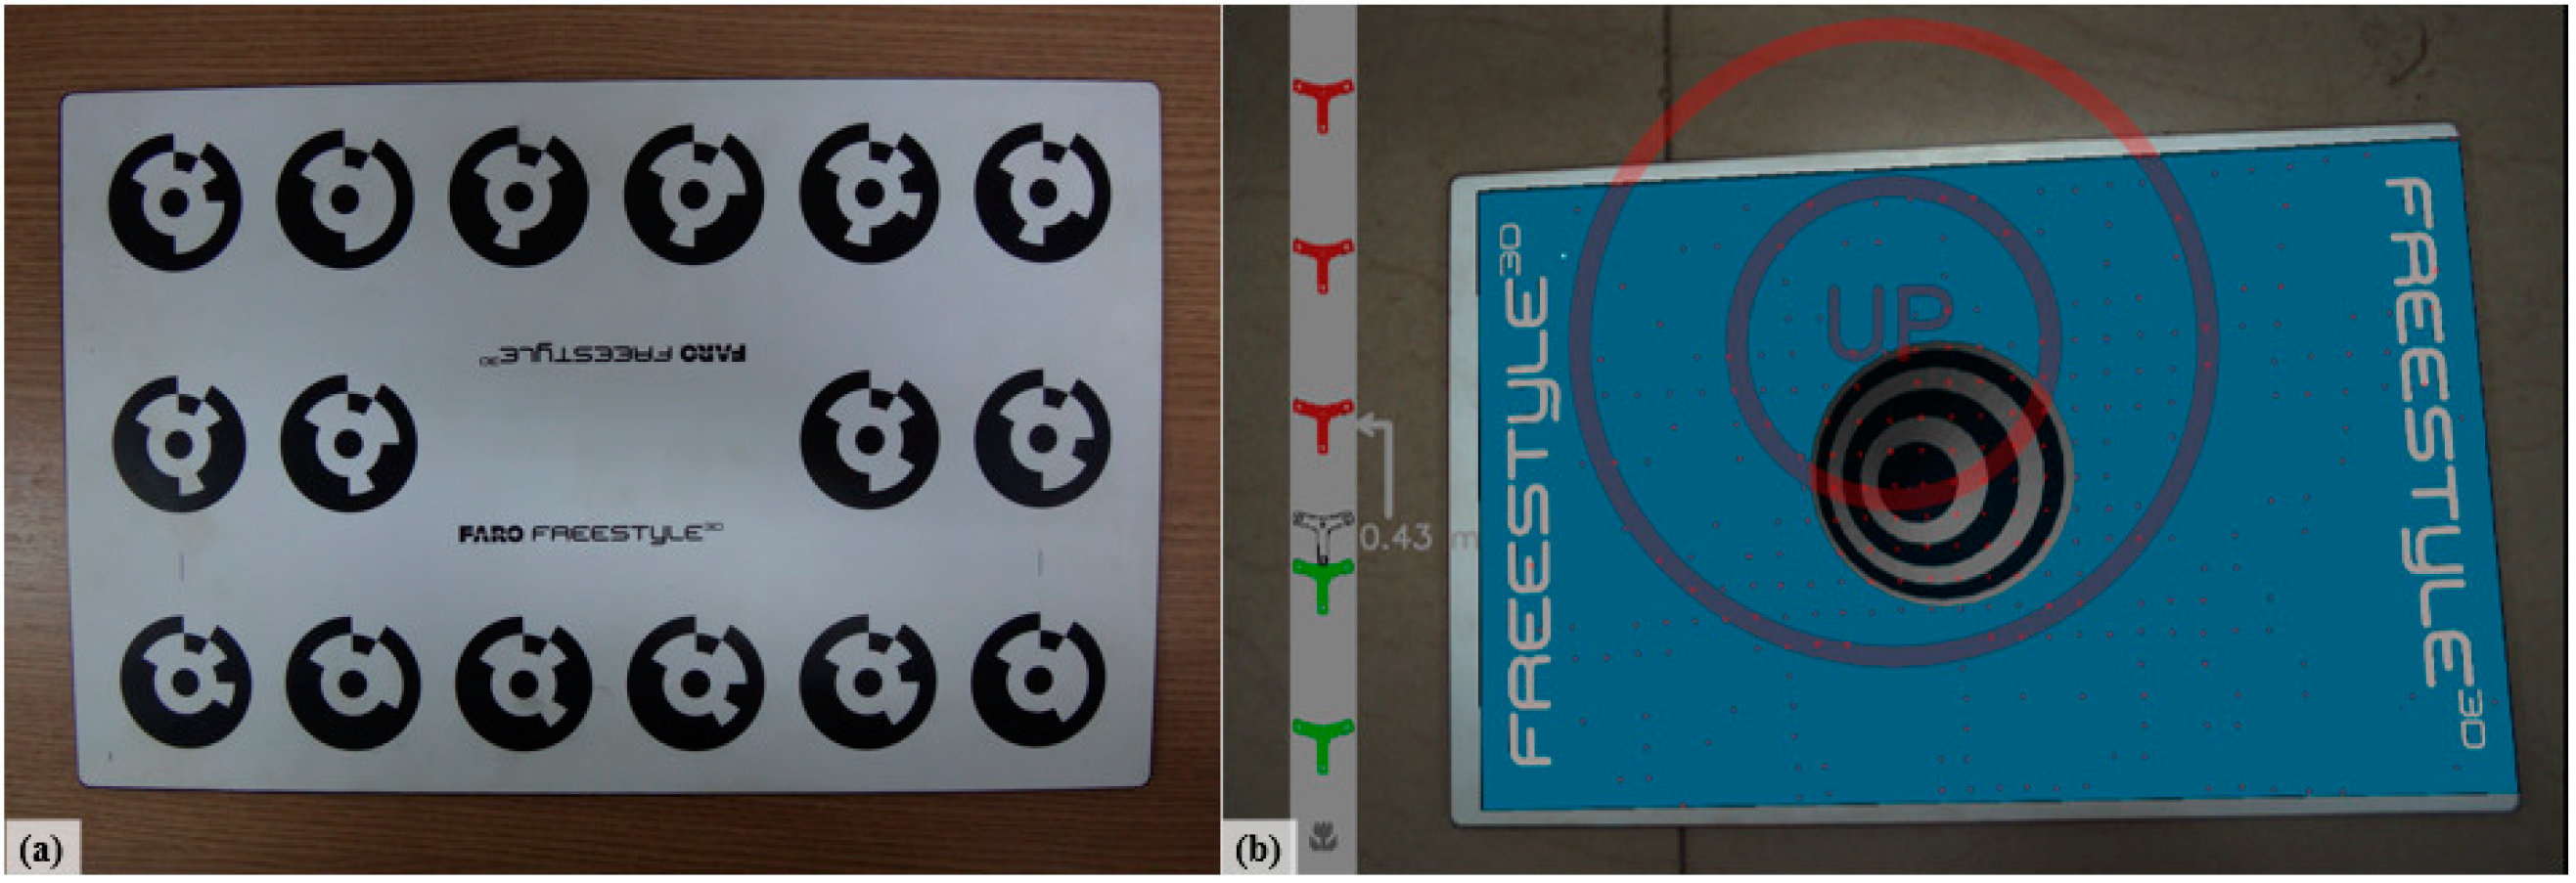
5.3. Digitization by 3D Stereo Reconstruction Technique
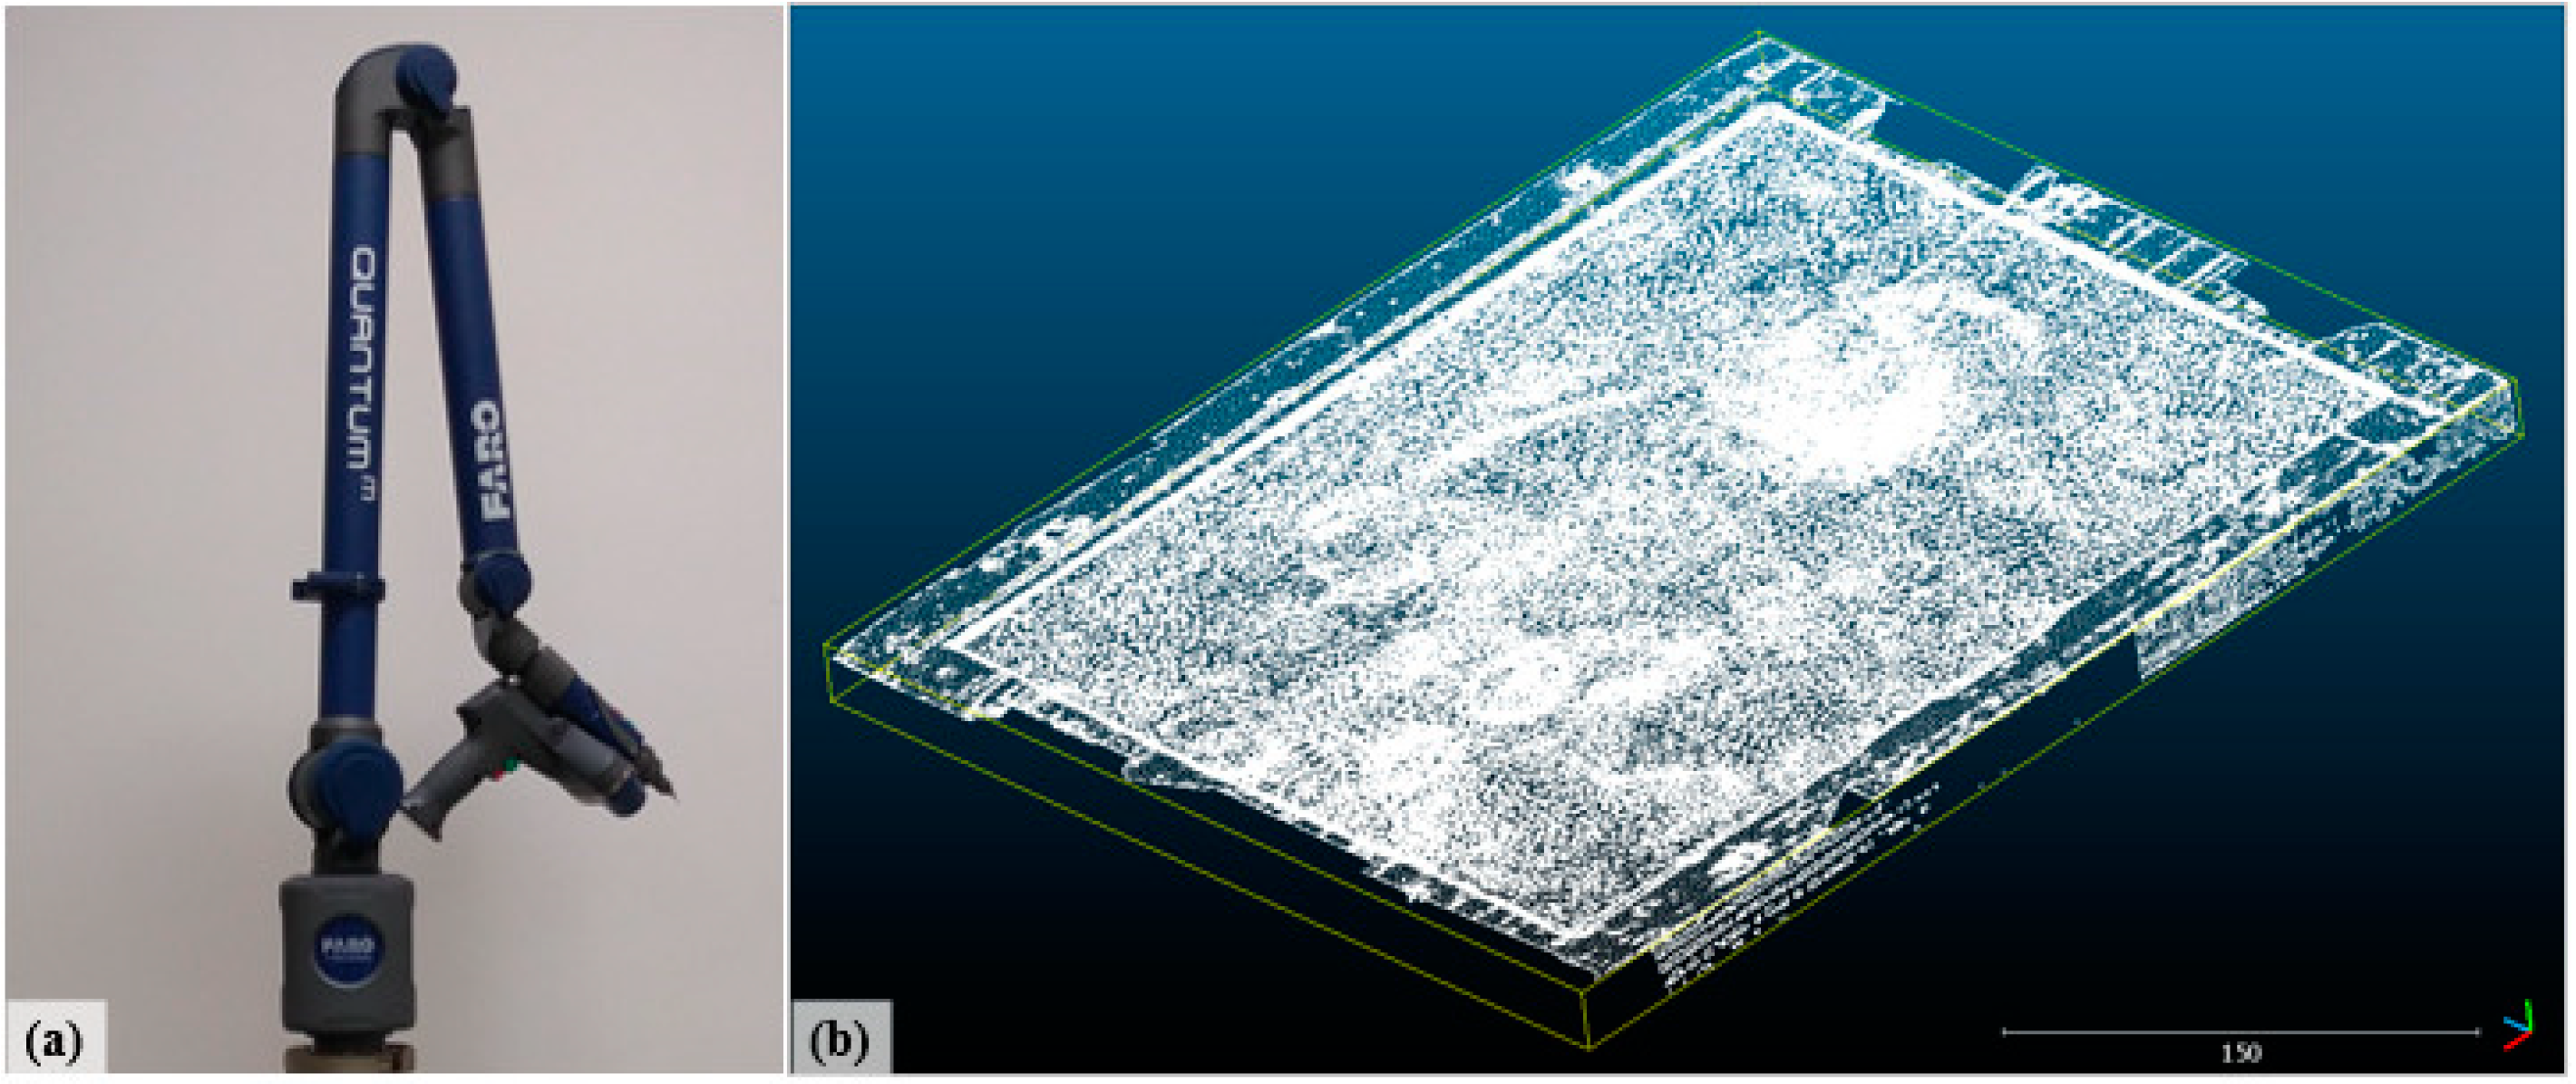
5.4. Digitization by FAROARM® 3D Scanner.
5.5. Point Cloud Treatment via Cloud Compare Software
5.6. Estimation of Penetration Depths Using Reference Planes
6. Results and Discussions
7. Conclusions and Future Work
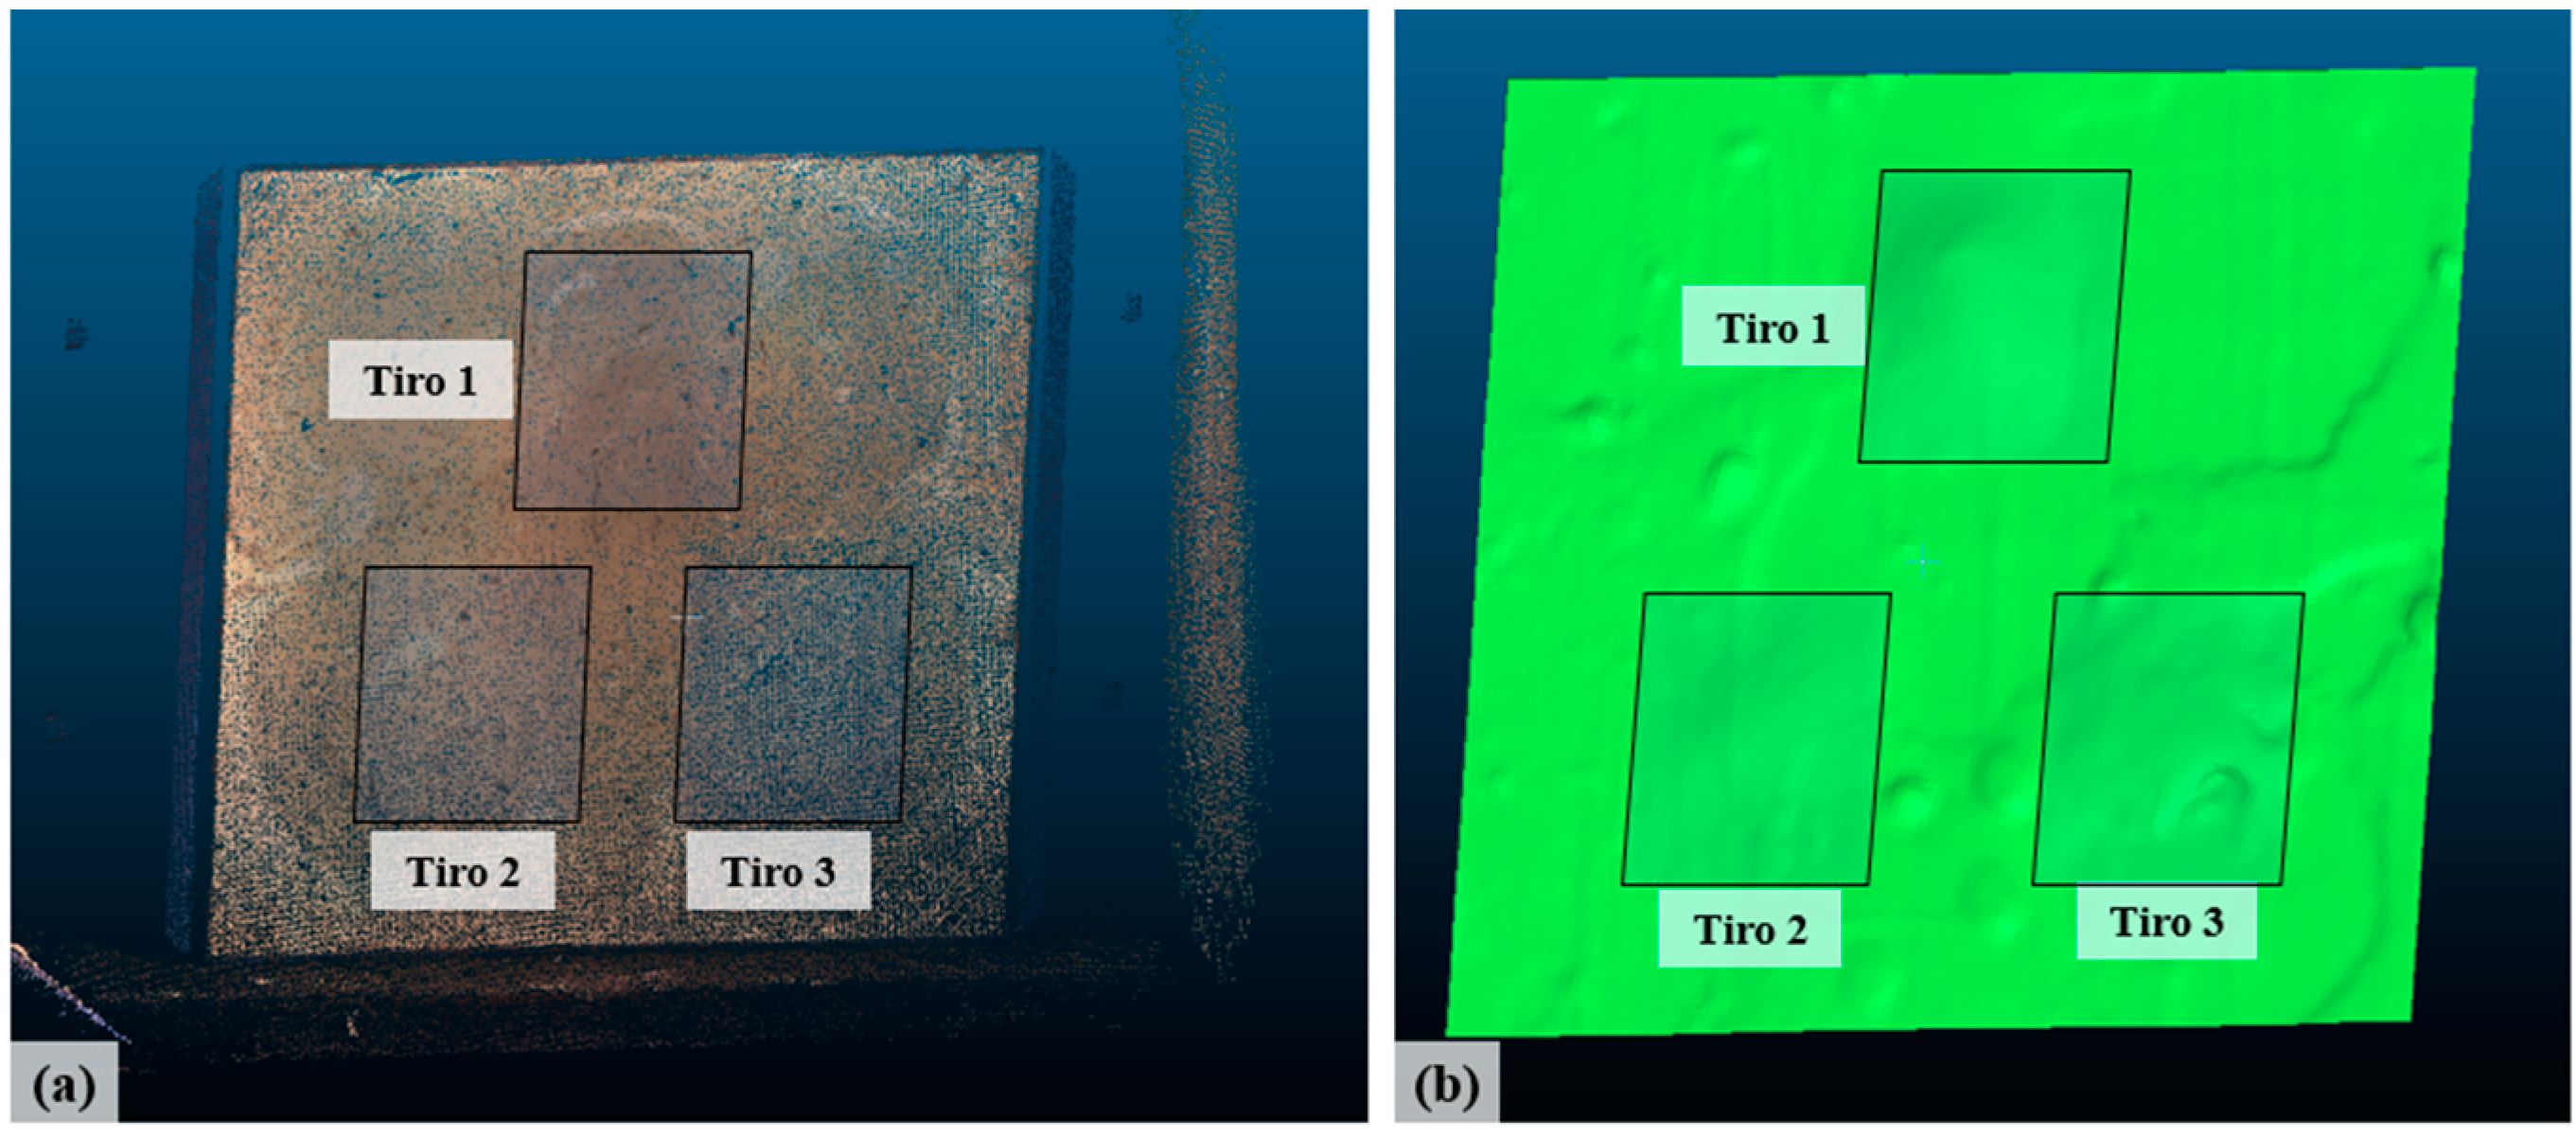
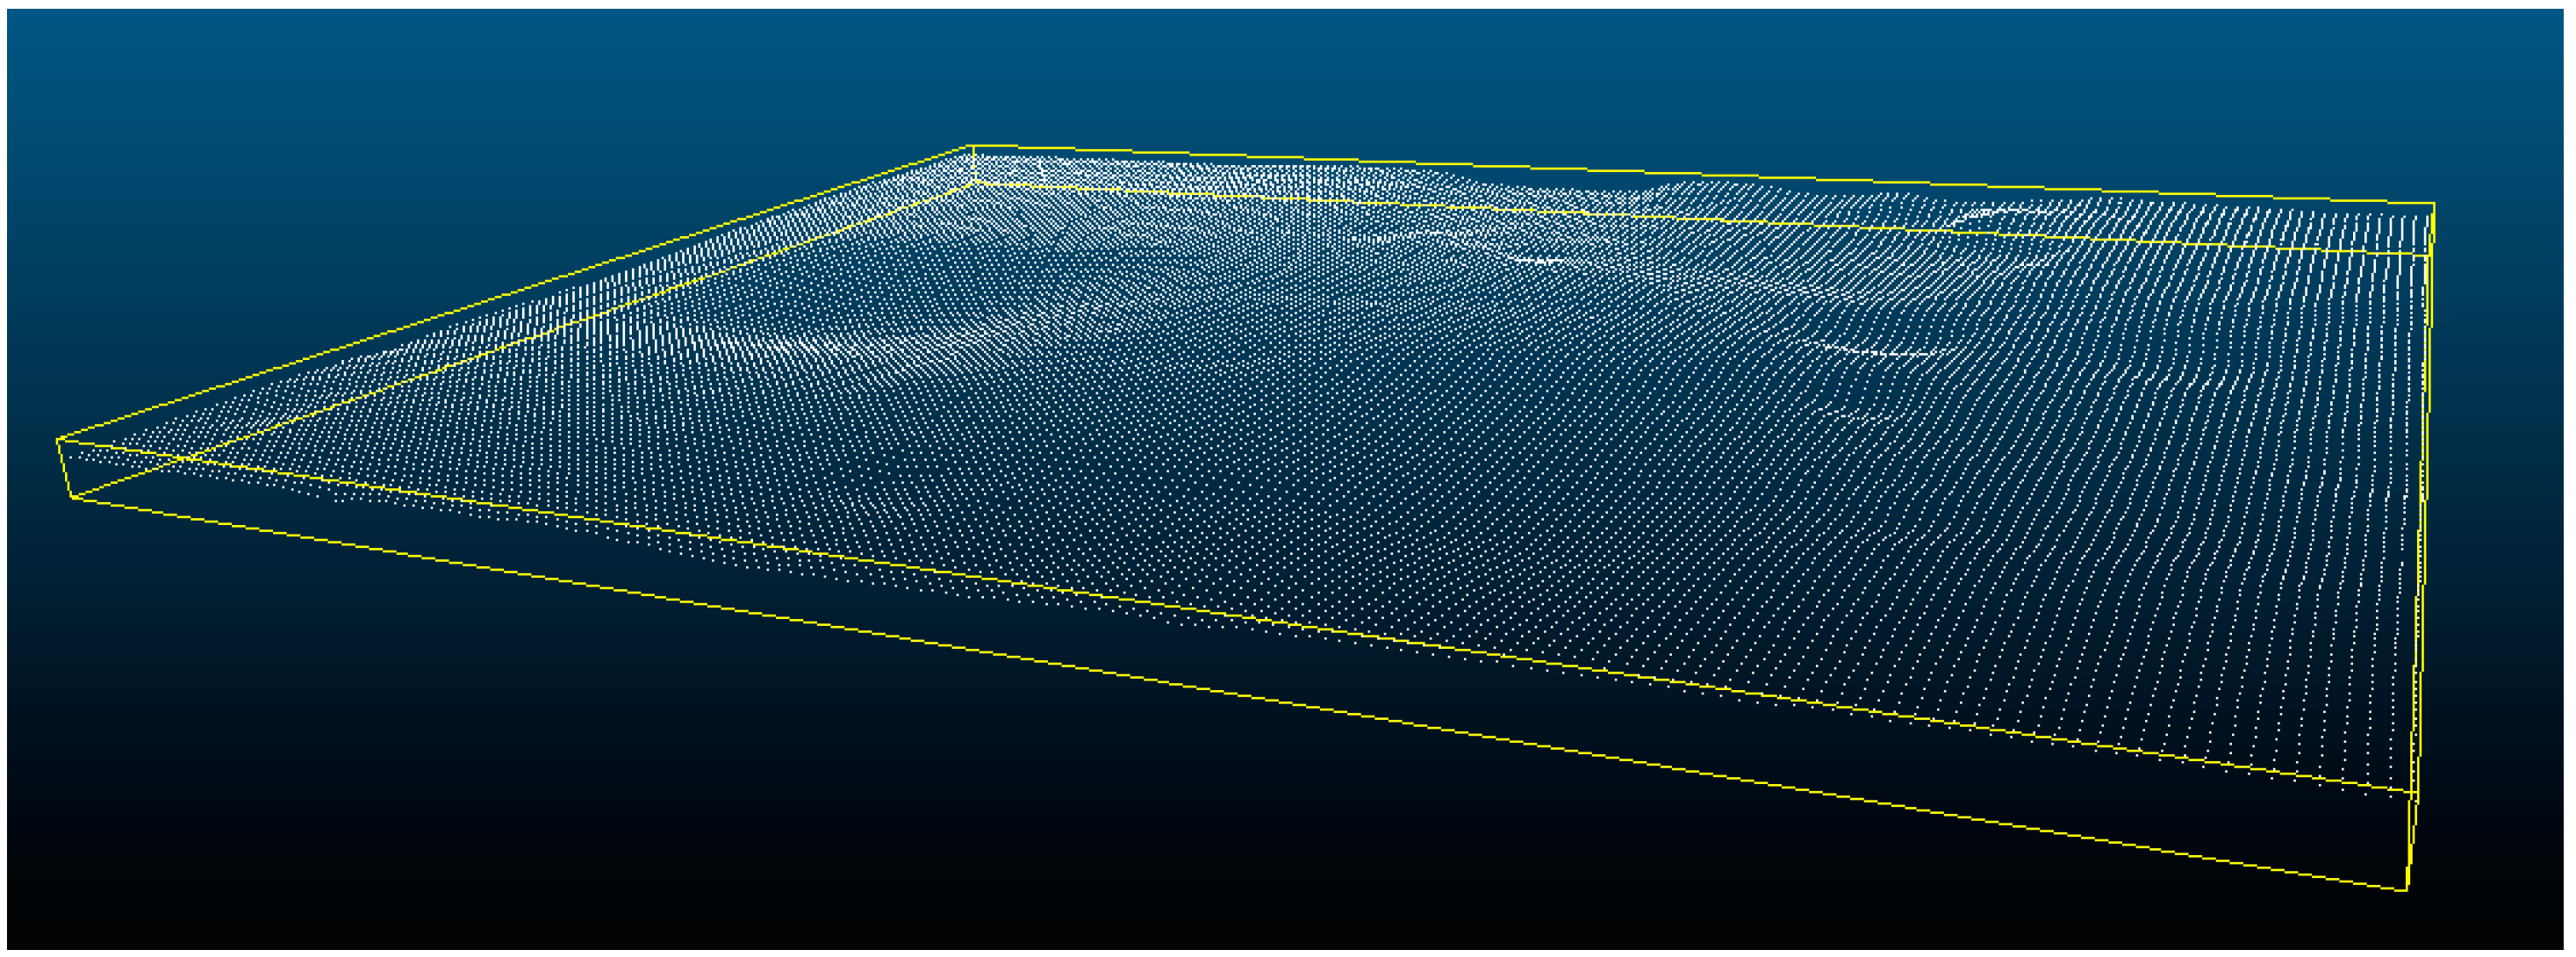
- As the 3D reconstruction technique is based on the use of stereo images of a given object, and considering that the surface presented relatively small deformations when compared to others commonly observed in ballistic tests, the focal distance for capturing the images allowed good depth estimates. The observed fact also explains the ease in establishing reference plans using the RANSAC methodology. Possibly, the result would be different with very deformed surfaces.
- For 3D Scanner data acquisition, the operator must do some small movements around the object of interest, and these movements can be a source of error. In the 3D reconstruction process, the acquisition is made statically.
Author Contributions
Funding
Acknowledgments
Conflicts of Interest
References
- Li, F.; Longstaff, A. Integrated tactile and optical measuring systems in three dimensional metrology. In Proceedings of the Queen’s Diamond Jubilee Computing and Engineering Annual Researchers’ Conference 2012: CEARC’12, Huddersfield, UK, 26 April 2012; pp. 1–6. [Google Scholar]
- Webster, J.G.; Bell, T.; Li, B.; Zhang, S. Structured Light Techniques and Applications. Wiley Encycl. Electr. Electron. Eng. 2016, 1–24. [Google Scholar] [CrossRef]
- National Institute Of Justice. Ballistic Resistance of Personal Body Armor, NIJ Standard—0101.04. NIJ J. 2001, 1–4. [CrossRef]
- National Institute Of Justice. Ballistic Resistance of Personal Body Armor NIJ Standard—0101.06. NIJ J. 2008, 74. [Google Scholar] [CrossRef]
- National Research Council Of The National Academies. Testing of Body Armor Materials Phase III; National Research Council of the National Academies: Washington, DC, USA, 2012; ISBN 9780309255998. [Google Scholar]
- Rubio, I.; Antonio, D.Á.; Bernier, R.; Rusinek, A.; Loya, J.A.; Miguelez, M.H.; Rodr, M. Postmortem Analysis Using Different Sensors and Technologies on Aramid Composites Samples after Ballistic Impact. Sensors 2020, 2853. [Google Scholar] [CrossRef]
- Bing, P. Digital image correlation for surface deformation measurement: Historical developments, recent advances and future goals. Meas. Sci. Technol. 2018, 29, 82001–82032. [Google Scholar]
- FARO Technologies, Inc. FARO Freestyle 3D User Manual 2017. Available online: https://knowledge.faro.com/Hardware/Legacy-Hardware/Freestyle/User_Manual_for_Freestyle3D-SCENE_Capture_and_SCENE_Process (accessed on 21 August 2020).
- Ferraiuoli, P.; Taylor, J.C.; Martin, E.; Fenner, J.W.; Narracott, A.J. The accuracy of 3D optical reconstruction and additive manufacturing processes in reproducing detailed subject-specific anatomy. J. Imaging 2017, 3, 45. [Google Scholar] [CrossRef]
- Sugimoto, K.; Cohen, R.A.; Tian, D.; Vetro, A. Trends in Efficient Representation of 3D Point Clouds. In 2017 Asia-Pacific Signal and Information Processing Association Annual Summit and Conference (APSIPA ASC); IEEE: Piscataway, NJ, USA, 2018; pp. 364–369. [Google Scholar] [CrossRef]
- Roca-Pardiñas, J.; Lorenzo, H.; Arias, P.; Armesto, J. From laser point clouds to surfaces: Statistical nonparametric methods for three-dimensional reconstruction. Comput. Aided Des. 2008, 40, 646–652. [Google Scholar] [CrossRef]
- Ebrahim, M.A.B. 3D Laser Scanners’ Techniques Overview. Int. J. Sci. Res. 2013, 4, 2319–7064. [Google Scholar]
- Várady, T.; Martin, R.R.; Cox, J. Reverse engineering of geometric models—An introduction. Comput. Aided Des. 1997, 29, 255–268. [Google Scholar] [CrossRef]
- Anwer, N.; Mathieu, L. From reverse engineering to shape engineering in mechanical design. CIRP Ann. Manuf. Technol. 2016, 65, 165–168. [Google Scholar] [CrossRef]
- Rua, J. Exploration of FARO Freestyle 3D Laser Scanners as a Method for Estimating Surface Fuel Loading for Wildland Fire Management. Diploma Thesis, Rutgers University, Camden, NJ, USA, 2018. [Google Scholar] [CrossRef]
- Levoy, M.; Rusinkiewicz, S.; Ginzton, M.; Ginsberg, J.; Pulli, K.; Koller, D.; Anderson, S.; Shade, J.; Curless, B.; Pereira, L.; et al. The Digital Michelangelo Project: 3D Scanning of Large Statues. Most 2000, 131–144. [Google Scholar]
- Rodríguez-Martín, M.; Rodríguez-Gonzálvez, P. Suitability of Automatic Photogrammetric Reconstruction Configurations for Small Archaeological Remains. Sensors 2020, 2936. [Google Scholar] [CrossRef] [PubMed]
- Bouillod, A.; Oggiano, L.; Soto-Romero, G.; Brunet, E.; Grappe, F. Preliminary study: A new method to assess the effective frontal area of cyclists. In Proceedings of the 4th International Congress on Sport Sciences Research and Technology Support, Porto, Portugal, 7–9 November 2016. [Google Scholar]
- Sa, A.M.E.; Filho, E.S.D.M.; Carvalho, P.; Velho, L. Coded Structured Light for 3D-Photography: An Overview. Rita 1999, 4, 203–219. [Google Scholar]
- Longuet-Higgins, H.C. Longuet-Higgins A Computer Algorithm for Reconstructing a Scene from Two Projections. Nature 1981, 293, 133–135. [Google Scholar] [CrossRef]
- Sutton, M.; Wolters, W.; Peters, W.; Ranson, W.; McNeill, S. Determination of displacements using an improved digital correlation method. Image Vis. Comput. 1983. [Google Scholar] [CrossRef]
- Westoby, M.J.; Brasington, J.; Glasser, N.F.; Hambrey, M.J.; Reynolds, J.M. “Structure-from-Motion” photogrammetry: A low-cost, effective tool for geoscience applications. Geomorphology 2012, 179, 300–314. [Google Scholar] [CrossRef]
- Isa, M.A.; Lazoglu, I. Design and analysis of a 3D laser scanner. Measurement 2017, 111, 122–133. [Google Scholar] [CrossRef]
- Batlle, J.; Mouaddib, E.; Salvi, J. Recent progress in coded structured light as a technique to solve the correspondence problem: A survey. Pattern Recognit. 1998. [Google Scholar] [CrossRef]
- Stančić, I.; Musić, J.; Zanchi, V. Improved structured light 3D scanner with application to anthropometric parameter estimation. Measurement 2013, 46, 716–726. [Google Scholar] [CrossRef]
- Chen, M.; Yang, S.; Yi, X.; Wu, D. Real-time 3D mapping using a 2D laser scanner and IMU-aided visual SLAM. In Proceedings of the 2017 IEEE International Conference on Real-time Computing and Robotics, Okinawa, Japan, 14–18 July 2018; pp. 297–302. [Google Scholar]
- De Asís López, F.; García-cortés, S.; Roca-pardiñas, J.; Ordóñez, C. Geometric optimization of trough collectors using terrestrial laser scanning: Feasibility analysis using a new statistical assessment method. Measurement 2014, 47, 92–99. [Google Scholar] [CrossRef]
- Xia, S.; Guo, S.; Li, J.; Istook, C. Comparison of different body measurement techniques: 3D stationary scanner, 3D handheld scanner, and tape measurement. J. Text. Inst. 2019, 110, 1103–1113. [Google Scholar] [CrossRef]
- Bernardini, F.; Rushmeier, H. The 3D model acquisition pipeline. Comput. Graph. Forum. 2002, 21, 149–172. [Google Scholar] [CrossRef]
- Boehler, W.; Marbs, A. 3D scanning instruments. Proc. CIPA WG 6 Int. Work. Scanning Cult. Herit. Rec. 2002, 9–18. [Google Scholar] [CrossRef]
- FARO Technologies Inc. FARO Freestyle3D Objects TechSheet. 2016. Available online: https://knowledge.faro.com/Hardware/LegacyHardware/Freestyle/Technical_Specification_Sheet_for_the_Freestyle3D (accessed on 21 August 2020).
- Ma, Z.; Liu, S. A review of 3D reconstruction techniques in civil engineering and their applications. Adv. Eng. Inform. 2018, 37, 163–174. [Google Scholar] [CrossRef]
- Khan, U.; Yasin, A.U.; Abid, M.; Awan, I.S.; Khan, S.A. A Methodological Review of 3D Reconstruction Techniques in Tomographic Imaging. J. Med. Syst. 2018, 42. [Google Scholar] [CrossRef] [PubMed]
- Truco, E.; Verri, A. Introductory Techniques for 3-D Computer Vision; Prentice Hall: Upper Saddle River, NJ, USA, 1998. [Google Scholar]
- Correlated Solutions, Inc. VIC-3D 8 System. Available online: https://www.correlatedsolutions.com/vic-3d (accessed on 21 August 2020).
- FARO Technologies Inc. Technical Specification Sheets for the Quantum FaroArm/ScanArm and Gage. Available online: https://knowledge.faro.com/Hardware/FaroArm_and_ScanArm/FaroArm_and_ScanArm/Technical_Specification_Sheets_for_the_Quantum_FaroArm-ScanArm_and_Gage (accessed on 21 August 2020).
- CloudCompare (Version 2.11 RC 1) [GPL Software]. 2020. Available online: http://www.cloudcompare.org/ (accessed on 21 August 2020).
- Kazhdan, M.; Bolitho, M.; Hoppe, H. Poisson Surface Reconstruction. Eurographics Symp. Geom. Process. 2006, 7, 61–70. [Google Scholar]
- Besl, P.J.; McKay, N.D. A Method for Registration of 3-D Shapes. IEEE Trans. Pattern Anal. Mach. Intell. 1992, 14, 239–255. [Google Scholar] [CrossRef]
- Zhang, Z. Iterative point matching for registration of free-form curves and surfaces. Int. J. Comput. Vis. 1994, 13, 119–152. [Google Scholar] [CrossRef]
- Xue, S.; Zhang, Z.; Lv, Q.; Meng, X.; Tu, X. Point Cloud Registration Method for Pipeline Workpieces Based on PCA and Improved ICP Algorithms. Mater. Sci. Eng. 2019, 612. [Google Scholar] [CrossRef]
- Senin, N.; Colosimo, B.M.; Pacella, M. Point set augmentation through fitting for enhanced ICP registration of point clouds in multisensor coordinate metrology. Robot. Comput. Integr. Manuf. 2013, 29, 39–52. [Google Scholar] [CrossRef]
- Schnabel, R.; Wahl, R.; Klein, R. Efficient RANSAC for point-cloud shape detection. Comput. Graph. Forum 2007, 26, 214–226. [Google Scholar] [CrossRef]
- Li, L.; Yang, F.; Zhu, H.; Li, D.; Li, Y.; Tang, L. An improved RANSAC for 3D point cloud plane segmentation based on normal distribution transformation cells. Remote Sens. 2017, 9, 433. [Google Scholar] [CrossRef]
- Ackermann, F. Digital image correlation: Performance and potential application in photogrammetry. Photogramm. Rec. 2006, 11, 429–439. [Google Scholar] [CrossRef]
- Sidor, K.; Wysocki, M. Recognition of Human Activities Using Depth Maps and the Viewpoint Feature Histogram Descriptor. Sensors 2020, 2940. [Google Scholar] [CrossRef]
- Pandey, G.; Giri, S.; McBride, J.R. Alignment of 3D point clouds with a dominant ground plane. In Proceedings of the IEEE International Conference on Intelligent Robots and Systems, Vancouver, BC, Canada, 24–28 September 2017; pp. 2143–2150. [Google Scholar]
- Friedman, J.H.; Tukey, J.W. A Projection Pursuit Algorithm for Exploratory Data Analysis. IEEE Trans. Comput. 1974, 23, 881–890. [Google Scholar] [CrossRef]
- Rahmani, H.; Mahmood, A.; Du, Q.H.; Mian, A. Hopc: Histogram of oriented principal components of 3d pointclouds for action recognition. In Proceedings of the European Conference on Computer Vision, Zurich, Switzerland, 5–12 September 2014; pp. 742–757. [Google Scholar]


| Level | Ammunition | Speed |
|---|---|---|
| I | 0.22 LR | 329 ± 9 m/s |
| 0.380 ACP | 322 ± 9 m/s | |
| IIA | 9 mm | 341 ± 9 m/s |
| 0.40 S & W | 322 ± 9 m/s | |
| II | 9 mm | 367 ± 9 m/s |
| 0.357 Mag | 436 ± 9 m/s | |
| IIIA | 9 mm | 436 ± 9 m/s |
| 0.44 Mag | 436 ± 9 m/s | |
| III | 7.62 mm NATO | 847 ± 9 m/s |
| IV | 0.30 M2 AP | 878 ± 9 m/s |
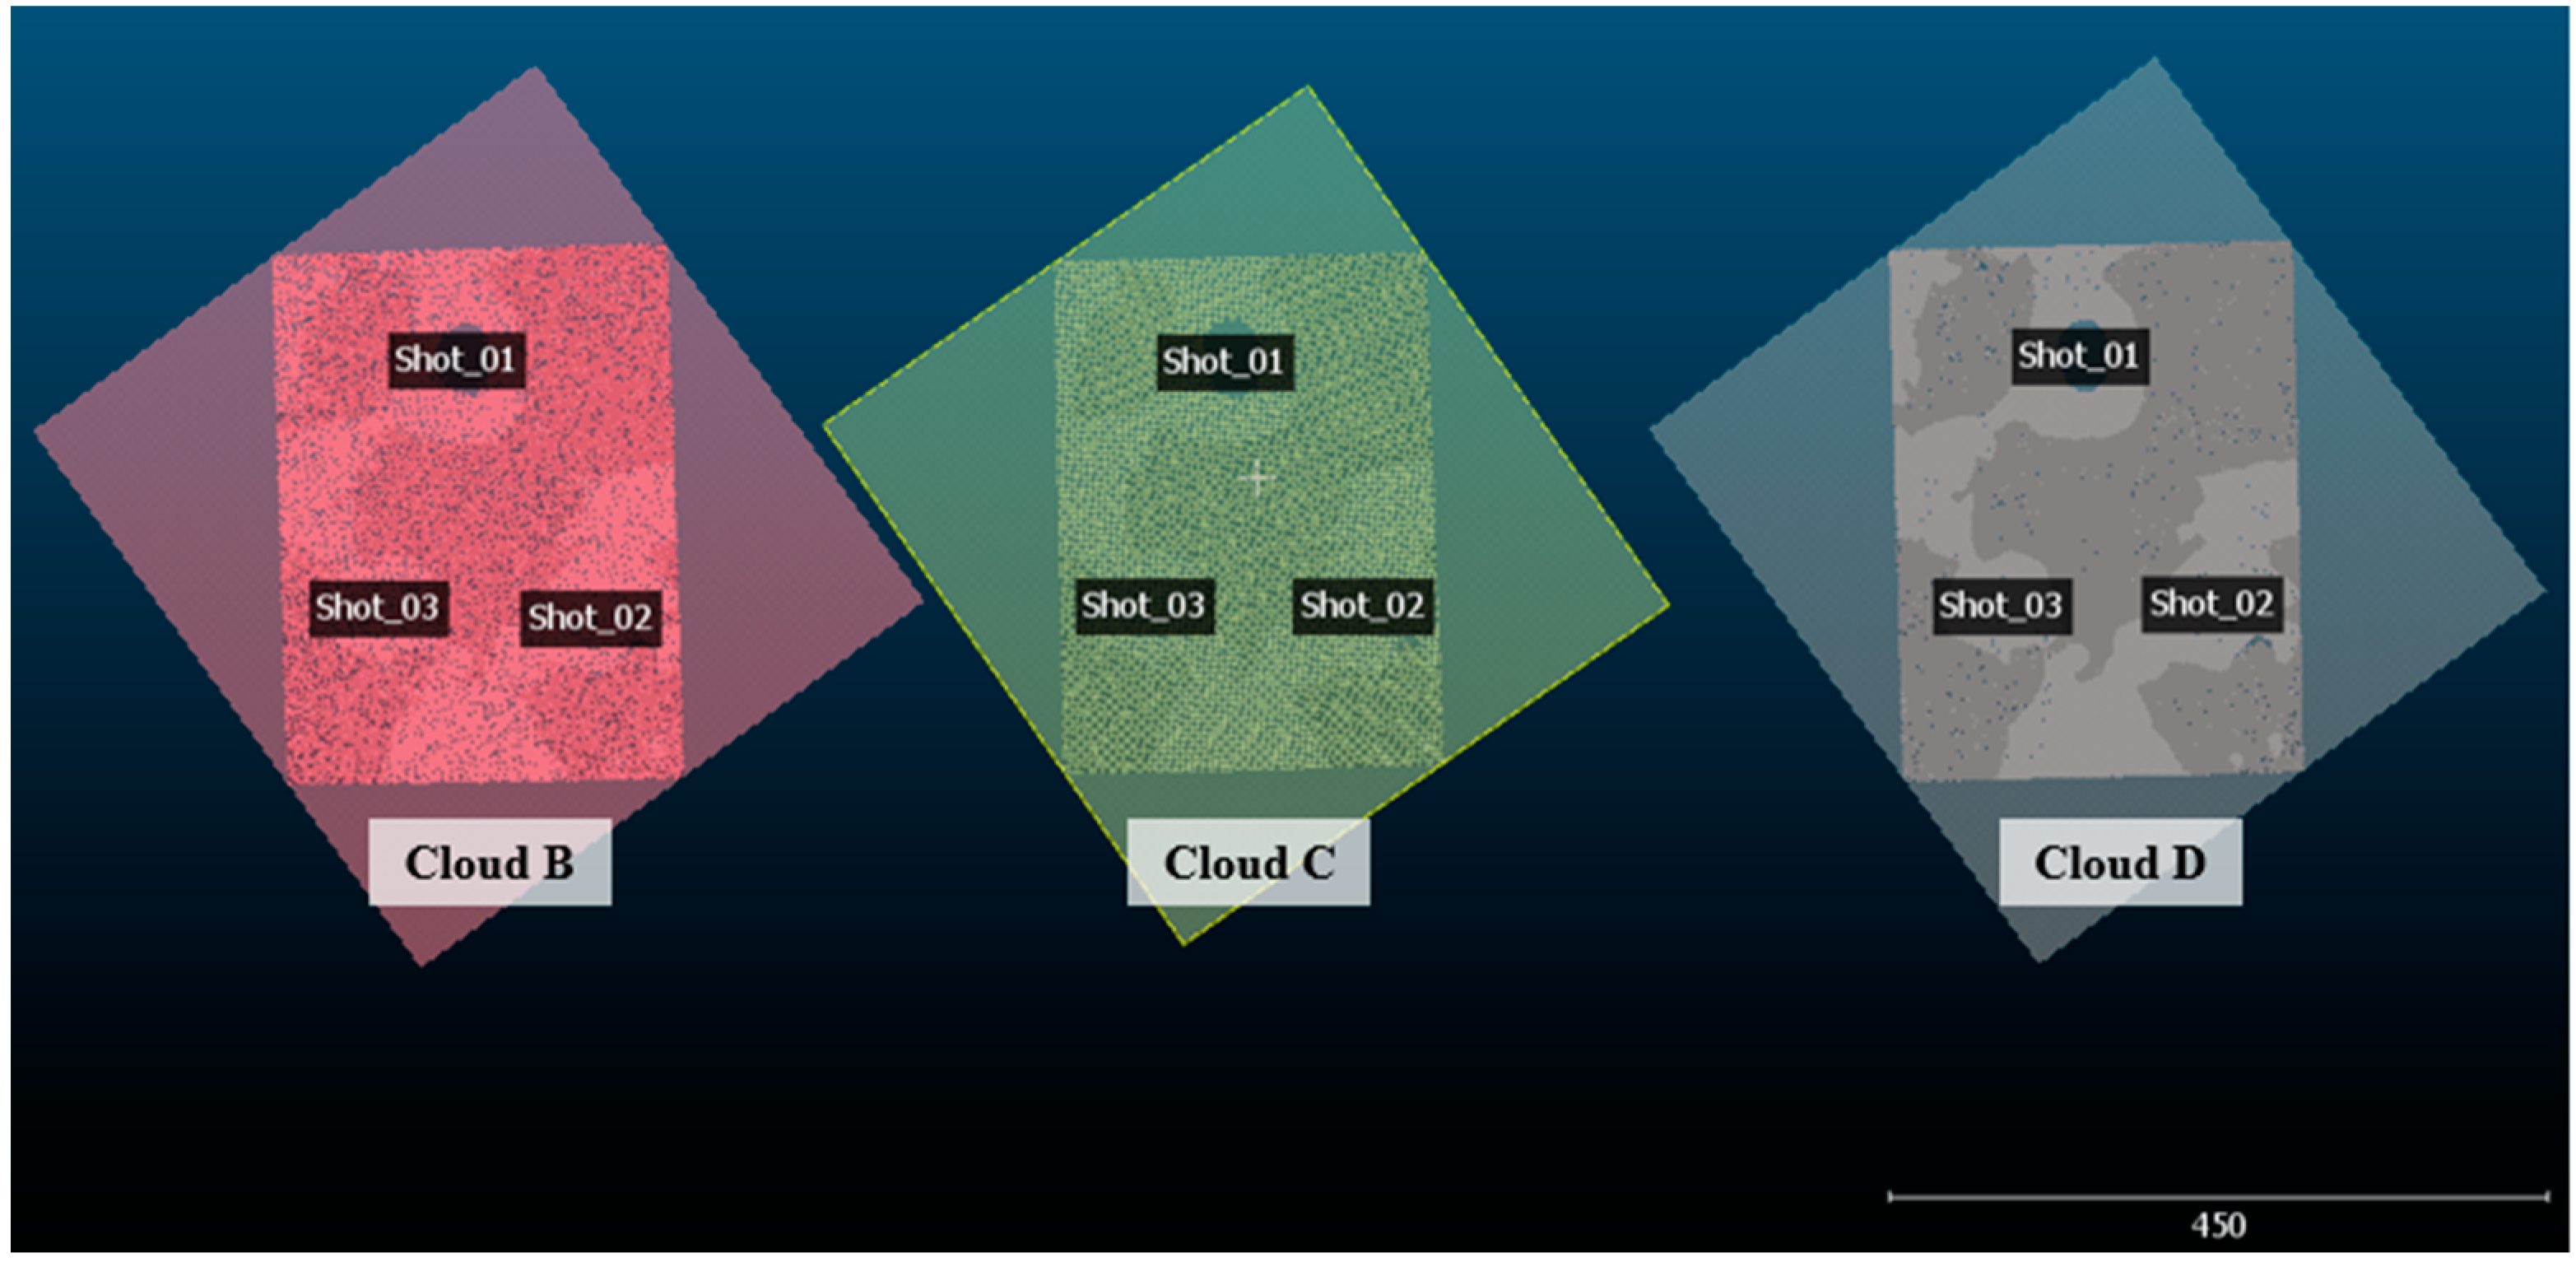
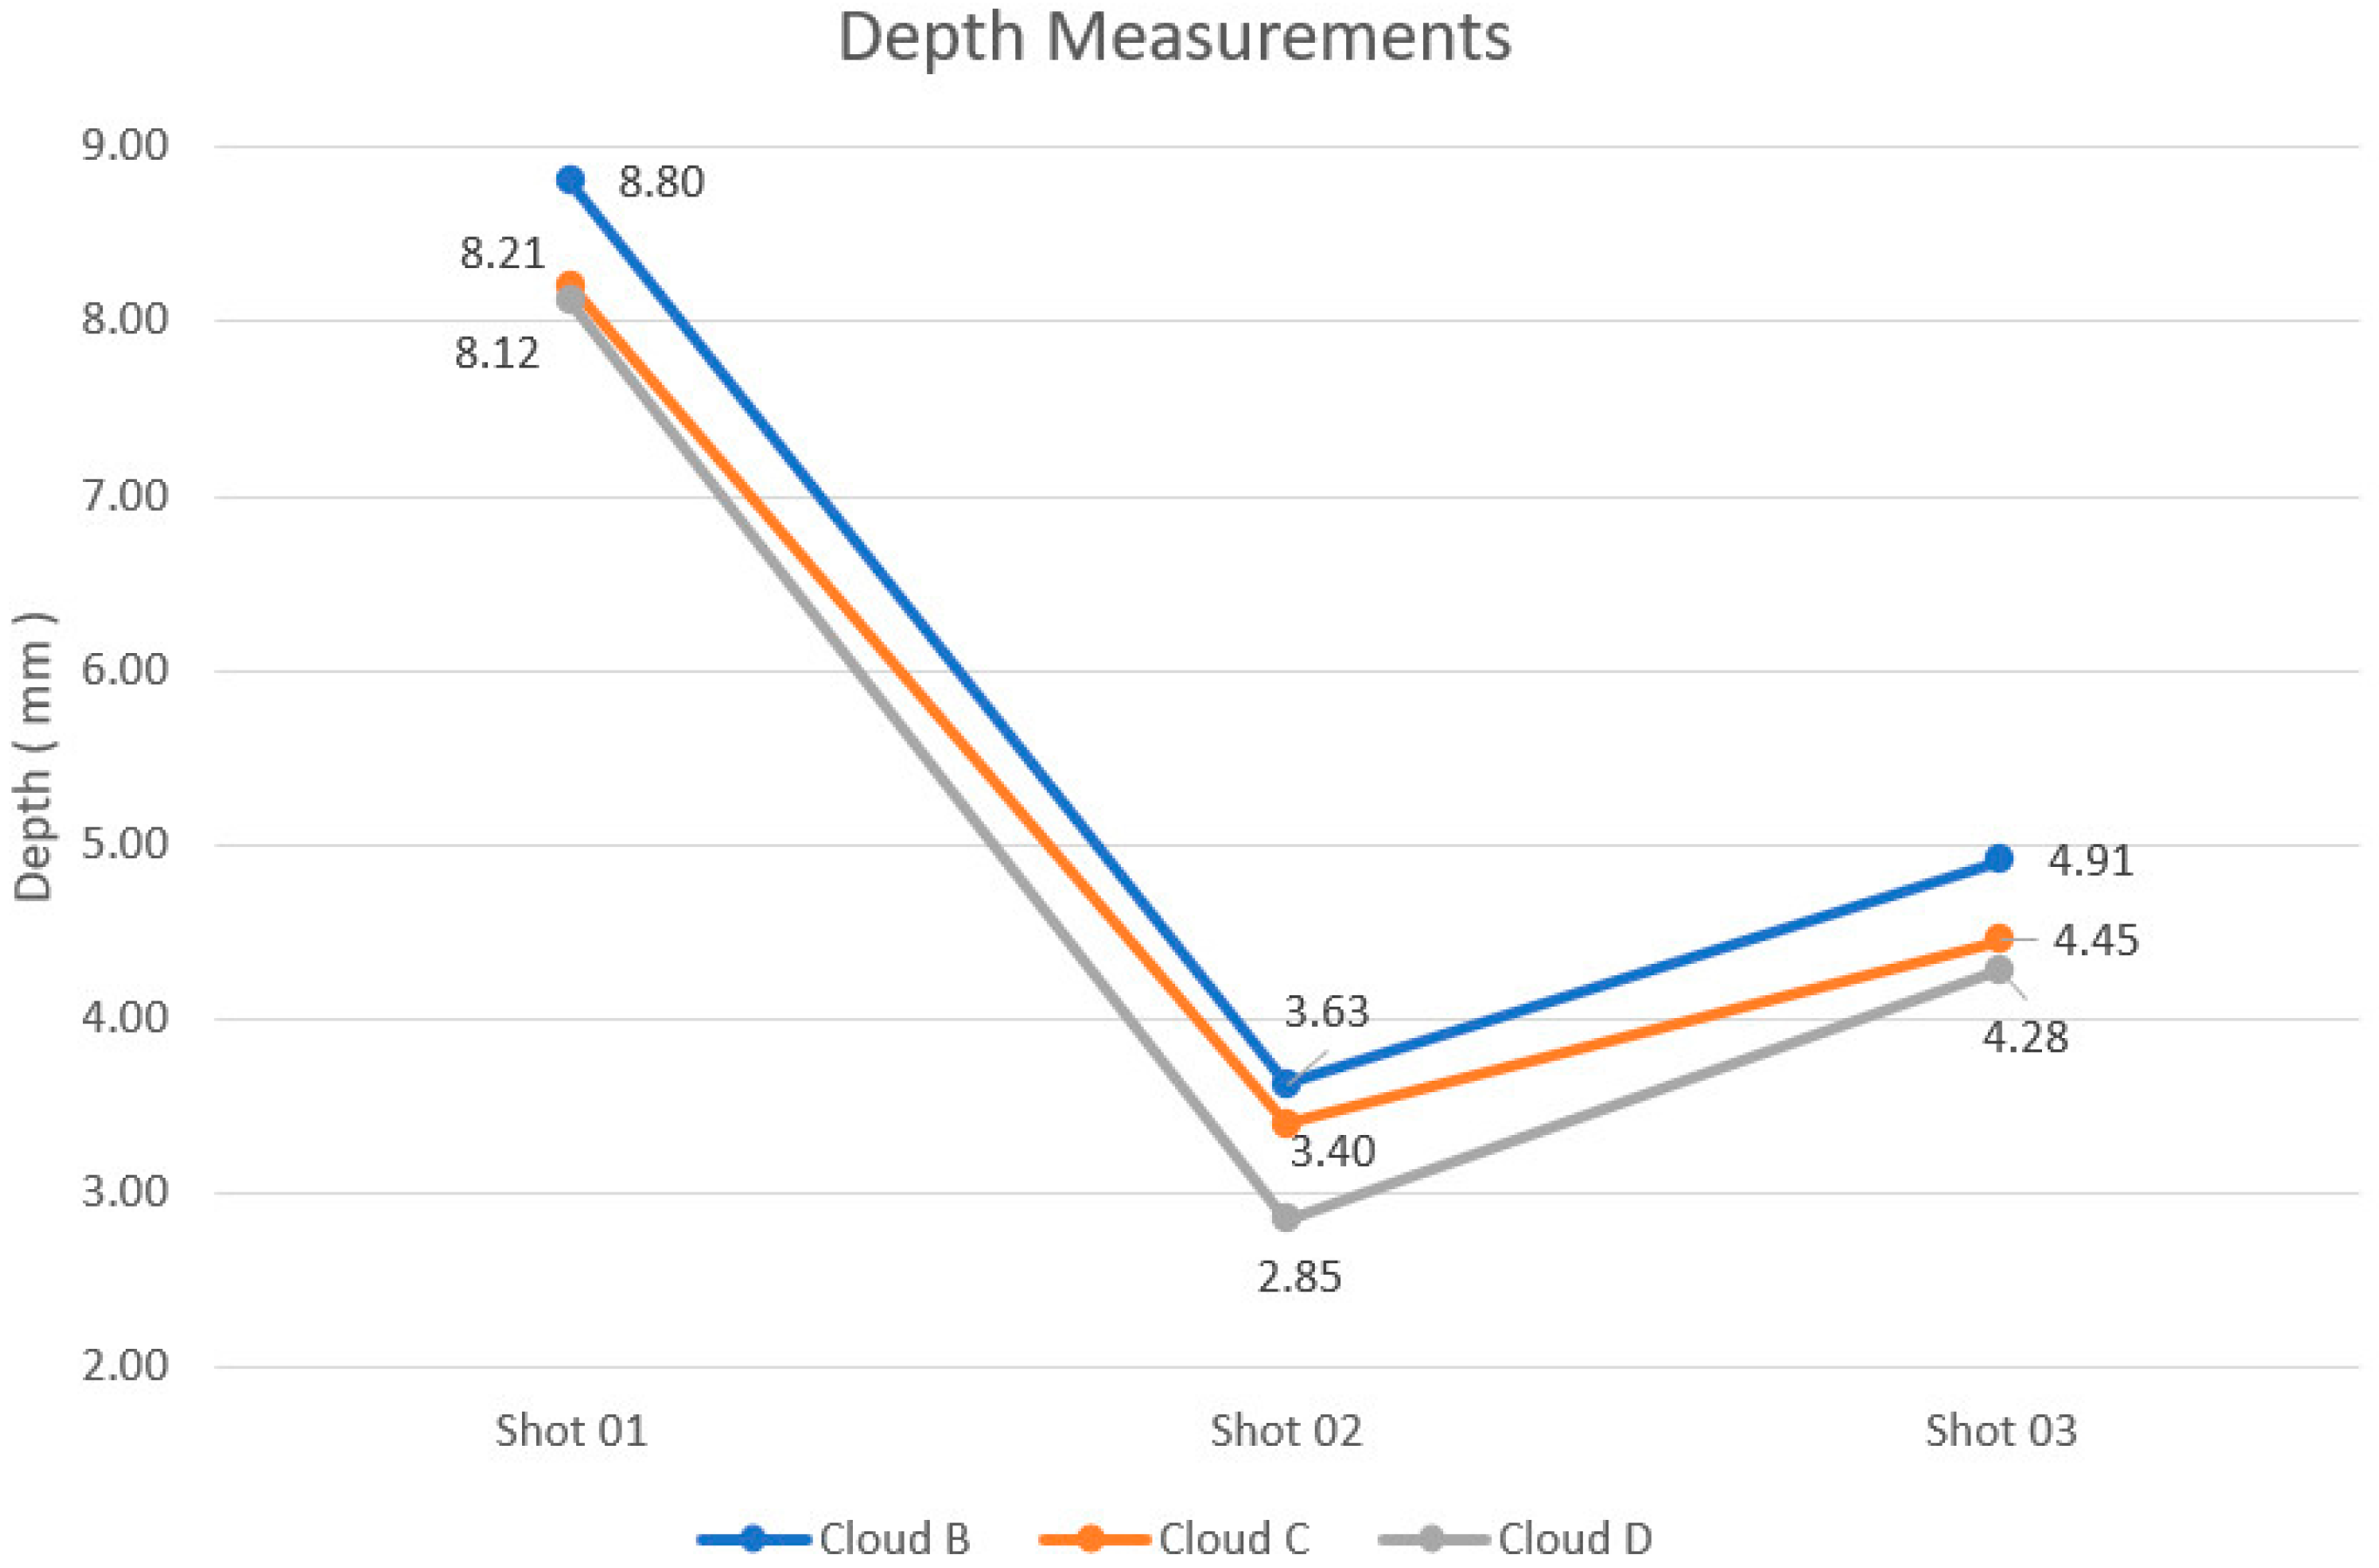
| Clouds | Depth Estimates (mm) | ||
|---|---|---|---|
| Shot 01 | Shot 02 | Shot 03 | |
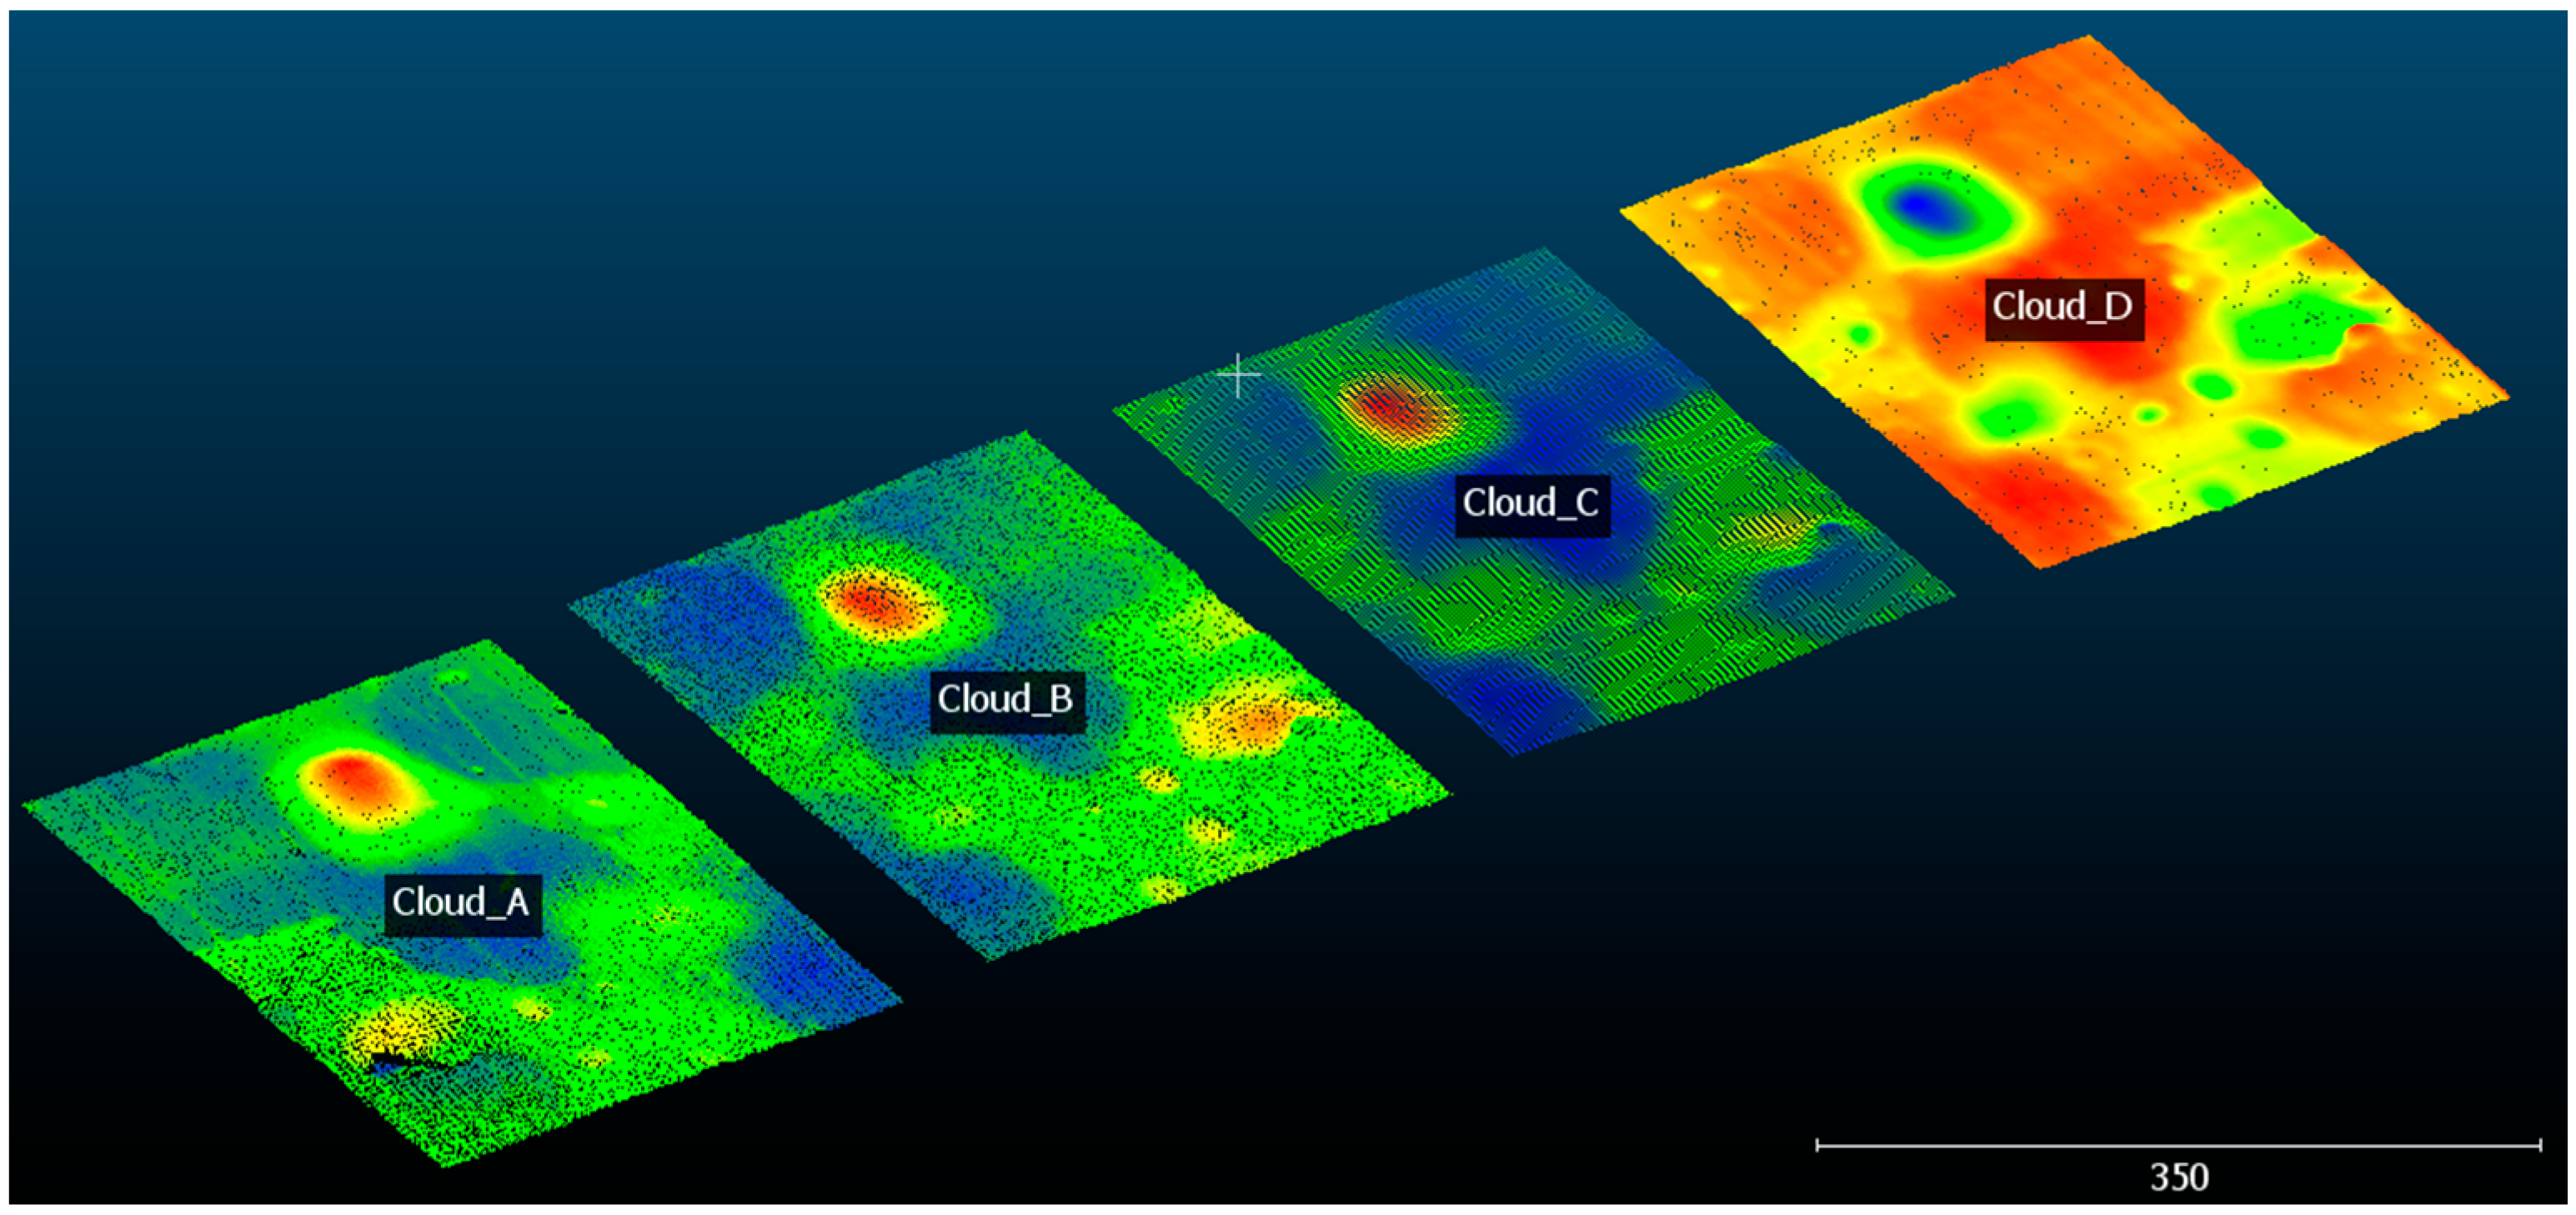
| B (Handheld Scanner—Milled Plate) | 8.80 | 3.63 | 4.91 |
| C (3D Reconstruction—Milled Plate) | 8.21 | 3.40 | 4.45 |
| D (FARO Arm Scanner—Milled Plate) | 8.12 | 2.85 | 4.28 |
| Clouds | Differences in mm | Values in mm | ||||
|---|---|---|---|---|---|---|
| Shot 01 | Shot 02 | Shot 03 | Average | Standard Deviation | Uncertainty | |
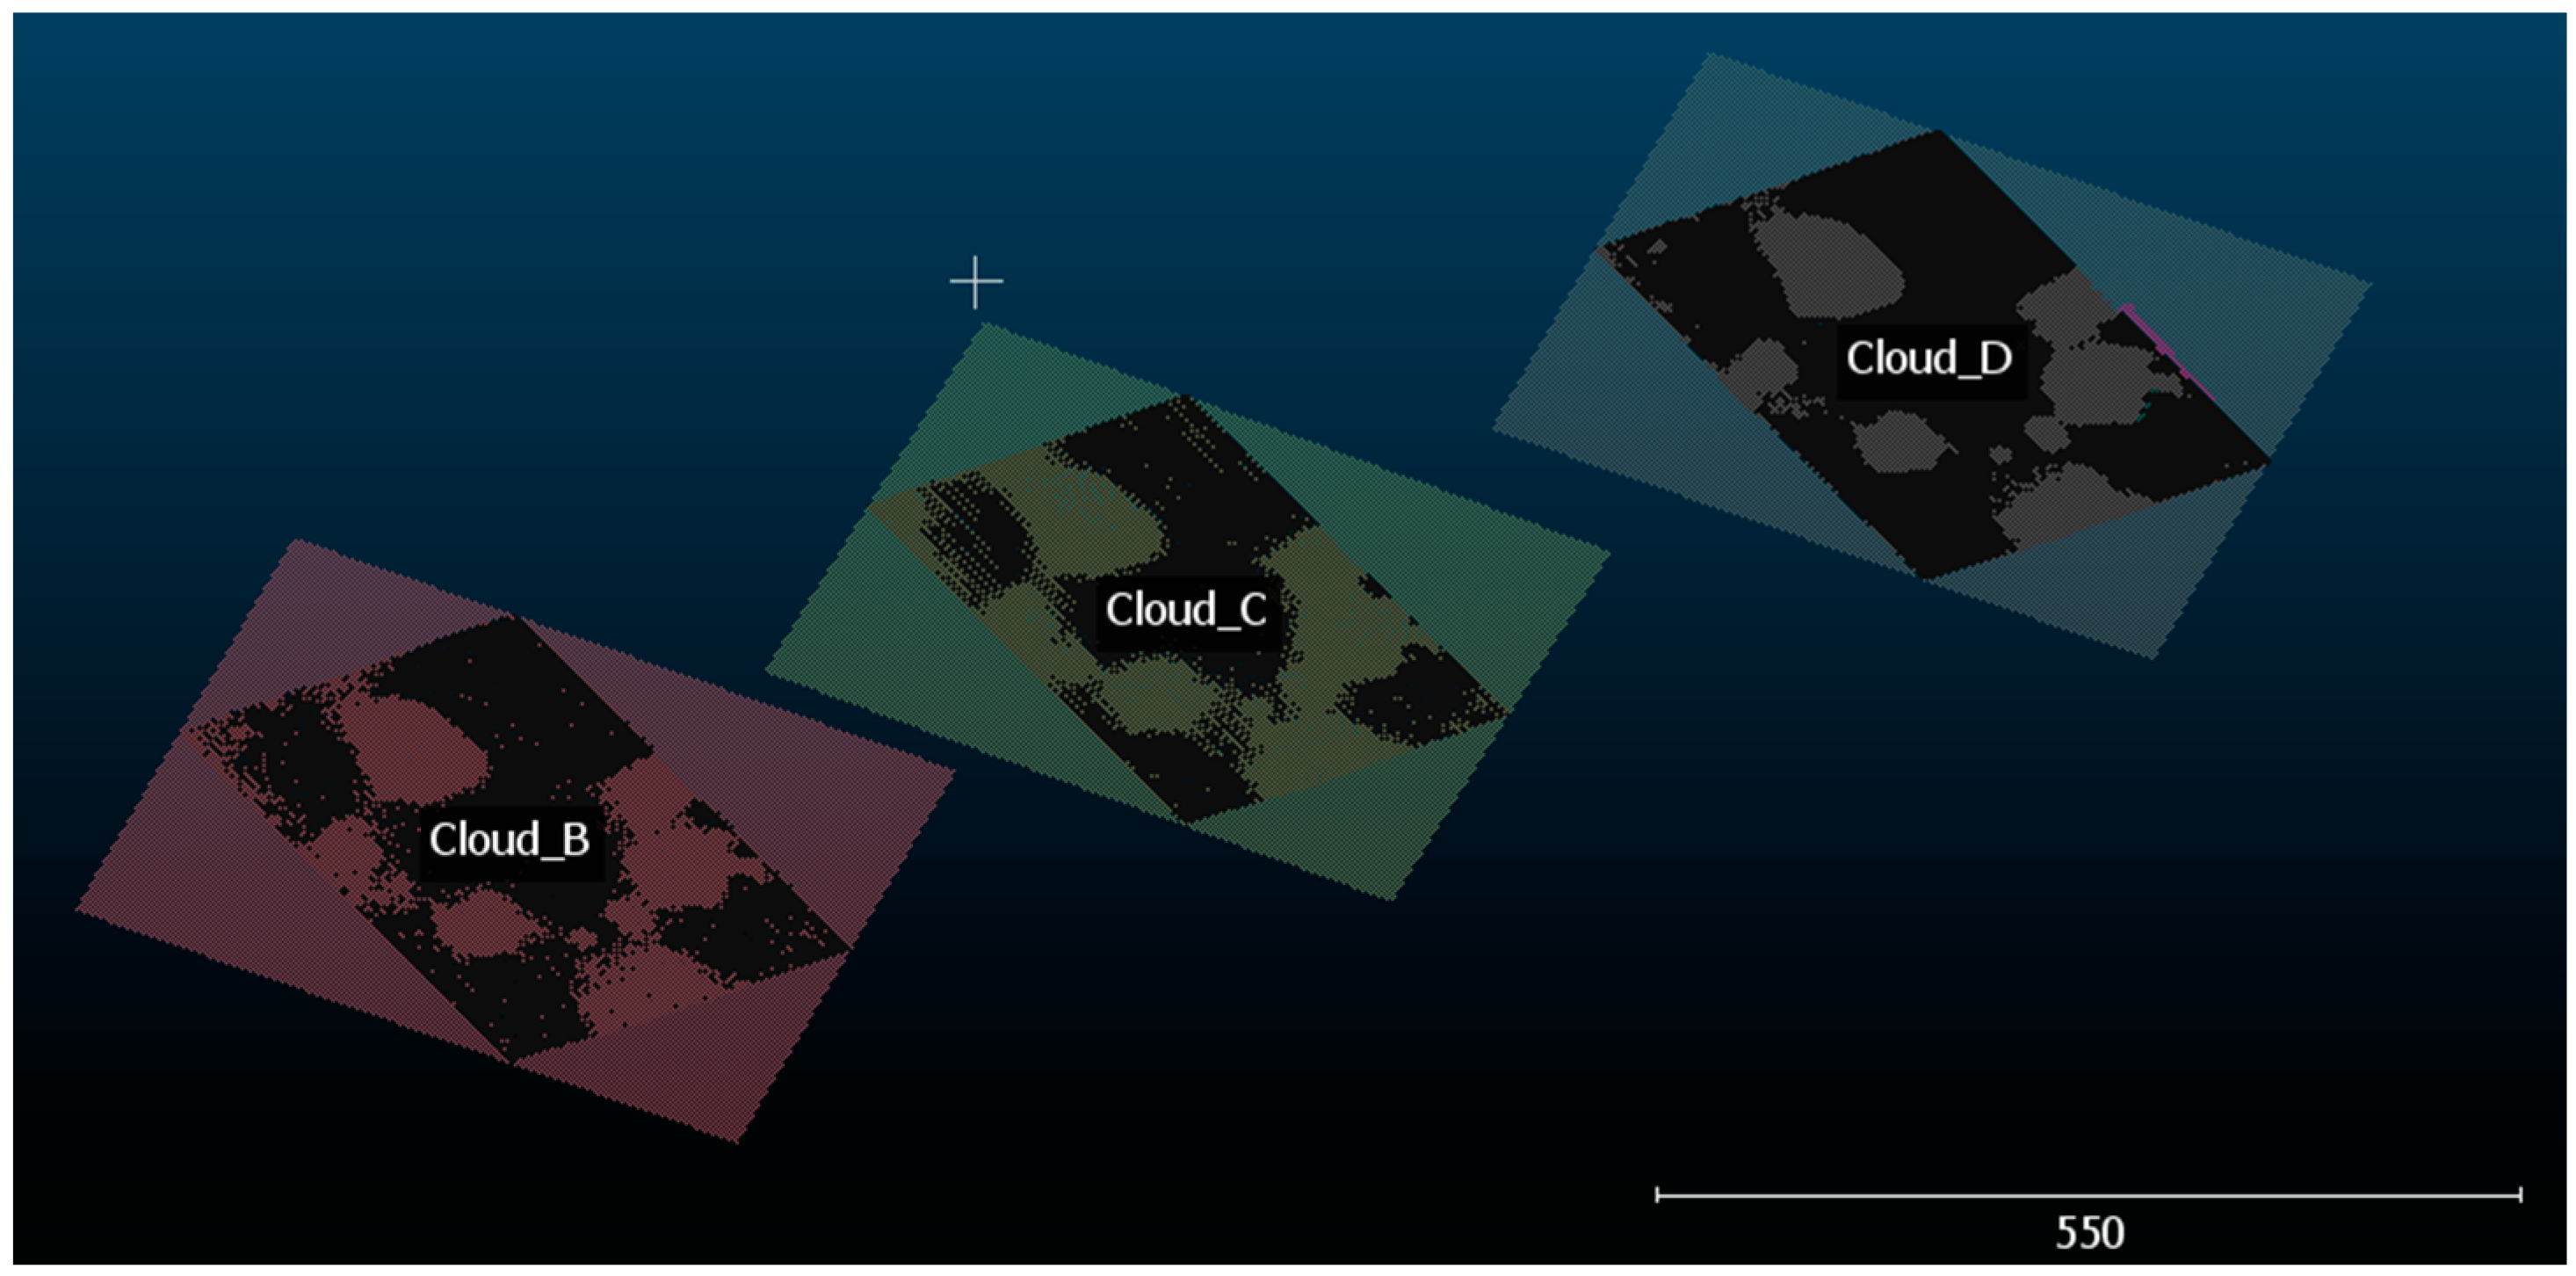
| Cloud B–Cloud D | 0.68 | 0.78 | 0.63 | 0.70 | 0.08 | 0.04 |
| Cloud C–Cloud D | 0.09 | 0.55 | 0.17 | 0.27 | 0.25 | 0.14 |
© 2020 by the authors. Licensee MDPI, Basel, Switzerland. This article is an open access article distributed under the terms and conditions of the Creative Commons Attribution (CC BY) license (http://creativecommons.org/licenses/by/4.0/).
Share and Cite
Dmengeon Pedreiro Balbino, F.; Aracélly Reis Medeiros, K.; Roberto Hall Barbosa, C. Comparative Analysis of Object Digitization Techniques Applied to the Characterization of Deformed Materials in Ballistic Tests. Sensors 2020, 20, 5017. https://doi.org/10.3390/s20185017
Dmengeon Pedreiro Balbino F, Aracélly Reis Medeiros K, Roberto Hall Barbosa C. Comparative Analysis of Object Digitization Techniques Applied to the Characterization of Deformed Materials in Ballistic Tests. Sensors. 2020; 20(18):5017. https://doi.org/10.3390/s20185017
Chicago/Turabian StyleDmengeon Pedreiro Balbino, Filipe, Khrissy Aracélly Reis Medeiros, and Carlos Roberto Hall Barbosa. 2020. "Comparative Analysis of Object Digitization Techniques Applied to the Characterization of Deformed Materials in Ballistic Tests" Sensors 20, no. 18: 5017. https://doi.org/10.3390/s20185017
APA StyleDmengeon Pedreiro Balbino, F., Aracélly Reis Medeiros, K., & Roberto Hall Barbosa, C. (2020). Comparative Analysis of Object Digitization Techniques Applied to the Characterization of Deformed Materials in Ballistic Tests. Sensors, 20(18), 5017. https://doi.org/10.3390/s20185017