Abstract
Interferon-gamma (IFN-γ) is a cytokine associated with inflammatory diseases, virus, infection, etc. The quantification of interferon-gamma concentration levels is studied to relate the immune system response to the progression of disease. In this work, we used a label-free point-of-care device based on the increase relative optical power (IROP) and a biosensor based on photonic transducers called BICELLs (Biophotonic Sensing Cells) to evaluate interferon-gamma concentrations. The BICELLs’ sensing surface size used is 100 μm in diameter. The bioreceptor is attached to the surface by streptavidin-biotin affinity. This label-free IROP-based device can work with a low concentration of reagents and a low sample volume for measurements. Furthermore, this new device was compared with an ELISA technique in the same conditions. A good correlation was achieved between both techniques. This device is easy to use, and it is a cost-effective tool for monitoring an analyte in a disease.
1. Introduction
There are millions of people affected by autoimmune diseases in the world. Diseases like lupus, multiple sclerosis, Crohn’s disease, autoimmune hepatitis, rheumatoid arthritis, etc. are autoimmune diseases that affect a lot of people; usually, women are more affected by these disorders [1,2,3,4,5]. The immune system protects the body against invaders (viruses or bacteria). In normal conditions, an immune response cannot be triggered against the cells of one´s own body. However, when immune cells attack the cells that they must protect, an autoimmune disease affects the own body. Cytokines are proteins that mediate the activation and communication of the immune system response. Interferons are secreted as a signal to viruses or pathogenic microorganisms.
Isaacs and Lindenmann discovered a protein called interferon that protects cells in vitro from viral infection [6]. Interferon is a family of proteins with antiviral activity secreted in response to stimuli. There are three types of interferons: type I, type II, and type III. Interferon gamma (IFN-γ) is a type II protein. The protein structure of this interferon is different from type I and type III [7,8,9,10].
Interferon-gamma is a cytokine secreted by T CD4+, CD8+, Tγ/δ, and NK cells [11]. The secretion of IFN-gamma is associated with inflammatory diseases, virus infection, Alzheimer´s disease, Crohn´s disease, cancer, etc. Over the years, quantification of interferon-gamma concentration levels has been studied to relate the immune response to the progression of disease. Laboratory methods like Interferon-Gamma Release Assay (IGRA) are wide used and the IFN-γ concentration is evaluated using techniques, such as Enzyme-Linked Immunosorbent Assay (ELISA) [12], Enzyme-linked immunospot assay (ELISPOT), or reverse transcriptase polymerase chain reaction (RT-PCR) [13]. These techniques are expensive and specialized technicians are needed in the laboratory. There are other techniques, such as field effect transistor-based biosensors (Bio-FETs) [14,15] or Förster Resonance Energy Transfer (FRET) [16], that are very good in IFN-gamma detection, with very low detection limits, but they are expensive in the development of biosensors and the reproducibility is not good. Additionally, aptasensors, for the rapid detection of IFN-gamma at low concentrations, have been developed (in order to picomolar concentrations), but the fabrication of these biosensors is complex and the detection in real samples decreases [17,18,19,20].
Currently, there is a need for cytokine sensors for use in clinical testing, the development of new biomarkers, and diagnosis and treatment of diseases. In this sense, the last works for interferon gamma detection have been based on electrochemical biosensors [15,19,21] and also optical detection [22,23]. One cytokine assay based on the affinity between the cytokine and their specific antibody is usually used in optical mechanisms. In addition, nanomaterials used in optical biosensors show optical properties that show improved performances in the analyses of cytokines. For this reason, the optical label-free biosensors are a kind biosensor that offer advantages, including avoiding the label process, and a simplicity in terms of assay protocols with minimum steps and a low volume of analytes [24,25,26].
Our research group has developed a point-of-care device based on optical label-free detection. The device is a compact and cost-effective point-of-care based on the “increase relative optical power” (IROP) principle and the enhancement in performance and LoD in comparison with standard high-resolution spectrometry [27,28,29,30]. The “increase relative optical power” quantifies the biomolecule accumulation or recognition in one sensing surface. The calculation is based on the reflectivity as a function of the wavenumber and wavelength for the reference interferometer and for the signal interferometric. The interferometric profile of the Fabry-Perot defines one area that it is proportional to the optical power in the situations when the biomolecule is attached on the surface.
Furthermore, the transducers used are based on Fabry-Perot interferometers called BICELLs (Biophotonic Sensing Cells) [31,32,33]. BICELLs are fabricated with two materials with a refractive index that shown an improvement of the optical interferometric profile.
In this work, we demonstrate the capability of the PoC device together with a transducer based on biophotonic sensing cells (BICELLs) to evaluate the concentration of interferon-gamma compared with the ELISA technique, where several steps are required and more reagents are used. The goal of this paper was the use of the PoC device for the evaluation of a cytokine with a low volume of reagents in a label-free detection with minimum biochemical steps.
For this proposal, an interferon-gamma detection experiment was performed on a sensor surface based on the affinity of streptavidin-biotin with the corresponding antibody using a very small volume in each biocell.
In addition, we report a very good correlation between the new technology based on label-free detection and one gold standard laboratory technique, such as the ELISA technique.
2. Materials and Methods
2.1. BICELLs Fabrication and Materials
A compact chip based on BICELLs was fabricated by two interferometric layers, SiO2 and SU8 resist (Microchem.), and another thin layer of nitrocellulose (Sigma-Aldrich). The manufacturing was carried out at the wafer level according to previous reported works [33]. The SU8 resist was overlaid on the wafer, after it was exposed to a thermal treatment, and it was cured by optical contact lithography with a mask. Finally, the wafer was developed to remove the remaining resist. The design of the mask allowed us to fabricate a chip with three BICELLs of 100 μm in diameter. The last layer of the biosensor was a nitrocellulose layer spun over the Bicells and exposed by DUV with a quartz mask inversely copied from the mask used in the lithography process. The remaining nitrocellulose was eliminated with a developer AR-600-55 (AllResist GmbH, Strausberg, Germany) diluted 1:4 with propanol. Each chip had three BICELLs to study the repeatability and reproducibility of the sensing surface, as shown in Figure 1.
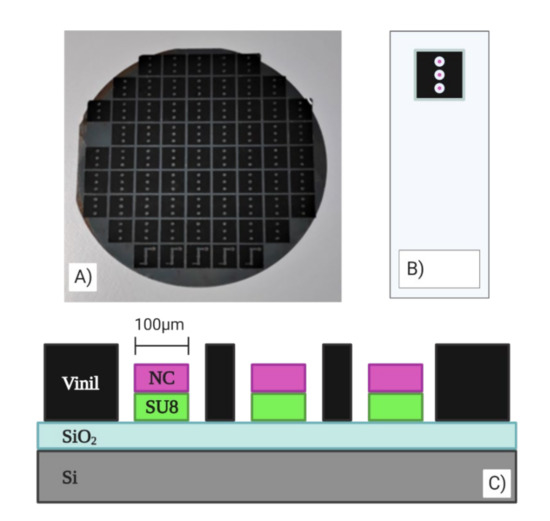
Figure 1.
(A) Chip fabricated at the wafer level. (B) 100-µm BICELLs integrated in chips with a vinyl sticker. (C) Transverse view of the transducer.
2.2. Point-Of-Car: Optical Read-Out Device
The read-out methodology for this point-of-care device is based on the increase relative optical power (IROP) value, previously introduced in several publications [27,28,30], and defined as the quotient of the optical power of two interferometers: signal (ISig) and reference (IRef) interferometers in a certain optical band, given by the light source employed (Figure 2).
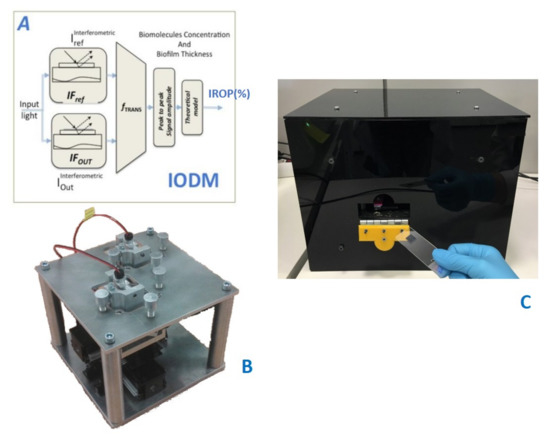
Figure 2.
(A) Read-out method. From [27] (B) Platform Design with optical channels and XY-positioning stage. (C) Point-of-care device.
Both interferometers consist of FPIs with different configurations in a way that the reference interferometer represents a minimum and the signal interferometer shows maximum slope in the emission wavelength range of the light source, aimed to achieve maximum sensibility in the measurement.
The signal interferometer is the sensing area where the biochemical interaction happens; therefore, the changes in its surface create a wavelength shift. Meanwhile, the reference interferometer remains constant. As it is represented in Figure 2, ΔIROP (%) can be defined as the subtraction of the IROP (%) value before and after the biochemical accumulation on the sensing surface.
The point-of-care device is based on an optical system and an electromechanic system. The electro-mechanic system permits the sequential measurement of several biosensing cells in a single kit to be carried out. The optical system consists of a laser and a photodiode to carry out the vertical interrogation of both the signal and the reference interferometers, with an incident angle of 10 degrees. The laser spot at the focal distance is around 60 μm in diameter, which allows the measurement of sensing areas with a diameter smaller than 100 μm to be carried out.
2.3. Assay Protocol: ELISA Technique and Point-Of-Care (IROP)
2.3.1. ELISA Technique for Interferon Gamma detection
The ELISA method was performed by the sandwich type assay (Figure 3). For this purpose, the ELISA plate was immobilized with 50 μL/well of capture antibody antiIFN-γ (from Sigma-Aldrich) during 2 h at 37 °C with a concentration of 5 μg/mL. For cleaning the wells, 5 washing steps of 200 mL/well with PBS-T 0.05% with a microplate washer were done.
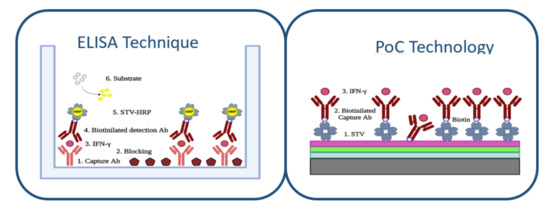
Figure 3.
ELISA technique protocol for IFN-γ detection and PoC technology protocol for IFN-γ detection.
For the ELISA technique, due to the size of the well, a blocking step was required. For this purpose, polyvinylpyrrolidone PVP10 (from Sigma-Aldrich) was incubated for 1 h at 37 °C with a 50 μL/well volume and 5 μg/mL concentration. After that, 5 washing steps were done by a microplate washer of 200 μL/well with PBS-T 0.05% (from Sigma-Aldrich).
The recognition molecule IFN-γ was detected through a 90-min incubation, 50 μL/well at 37 °C using the following concentrations 0.025, 0.05, 0.1, 0.2, 0.5, 0.75, 1, 1.5, 2, 2.5, 3, 3.5, 4, 5, and 10 μg/mL. After that, 5 washings of 200 μL/well by a microplate washer of PBS-T 0.05% (from Sigma-Aldrich) were conducted.
Biotinylated secondary antibody antiIFN-γ was incubated for 1 h at 37 °C with a concentration of 5 μg/mL and 50 μL/well of volume and was washed as the previous steps.
Finally, 50 μL in a 0.2 μg/mL concentration of STV labeled with HRP enzyme was deposited on each well for 1 h at 37 °C. Washing steps took place by 5 cycles of PBS-T 0.05% (from Sigma-Aldrich) by a microplates washer. After this, 50 mL of TMB substrate were added and kept in darkness, and were incubated for 30 min. The reaction was stopped with 50 μL of HCl 2N and reading in the ELISA plate reader.
2.3.2. Point of Care Protocol for Interferon Gamma Detection
The sensing surface of nitrocellulose allowed us to biofunctionalize the chip optimally to evaluate the IFN-γ concentration (Figure 3). Firstly, a biofilm of streptavidin STV (from Sigma-Aldrich) was bound to the sensing surface of three Bicells. To optimize the sensing surface in the assay, we evaluated the immobilization of streptavidin with different buffers: sodium carbonate buffer and deionized water buffer. We observed that the immobilization with buffer carbonate was more unstable for our sensing surface of nitrocellulose. The immobilization of streptavidin was carried out by incubation of 50 μg/mL in aqueous buffer with a volume of 4 μL for bicell. The incubation time was 1 h and the temperature was C. After, one washing step with 60 mL of distilled water was done and the chip was dried with clean and dry air. Additionally, to study the stability of the streptavidin monolayer, we studied several washing steps.
Then, a biotinylated antibody antiIFN-γ (from King Fisher) was immobilized over the streptavidin sensing surface. The incubation concentration was 5 μg/mL, with a volume of 4 μL during 1 h at C. The washing step was done with 40 mL of distilled water and dried with clean air.
The strepatividin–biotin interaction [34,35] is the stronger non-covalent biological interaction. This interaction is highly specific, rapid on-rate, and resistant to changes in temperature or pH. The Kd of streptavidin-biotin conjugate is 10−14–10−15 M. The streptavidin has four sites of binding for each biotinylated. This complex is highly stable, and the same biotinylated antibody is the blocking agent over the sensing surface.
The sensing surface obtained is specific to the interferon gamma concentration since the whole surface is covered by streptavidin and the antibody itself acts as a blocking agent since it is biotynilated and the biotin has a great affinity for the sensing surface. In addition, to be sure of this specific surface, 10 μg/mL of interferon gamma was incubated for 3 h over the sensing surface of streptavidin, without the biotinylated antibody step, as a negative control.
The interferon gamma detection was made at in a humid environment using concentrations of 0.025, 0.05, 0.1, 0.2, 0.5, 0.75, 1, 1.5, 2, 2.5, 3, 3.5, 4, 5, and 10 μg/mL with an incubation time of 90 min. Finally, a washing step was performed with 20 mL of distilled water and dried with clean air.
To obtain each one of the values of this assay, the measurement of 11 compact chips based on BICELLs was carried out. This resulted in a statistical sample of n = 33. The results obtained are shown as values obtained by repeated measurement + SEM (standard error of the mean).
3. Results and Discussion
3.1. Optimization of Sensing Surface
To optimize a monolayer of the streptavidin sensing surface, two buffers were evaluated. In Figure 4, we show the signal obtained for the water buffer and carbonate buffer in the same conditions. It can be seen that the signal for the carbonate buffer is higher than the deionized water buffer. To evaluate the stability of the streptavidin monolayer, we studied consecutive washing steps of 20 mL of distilled water (Figure 5). We can see that the stability of the streptavidin sensing surface immobilized with deionized water buffer is the same, but with the same washing steps, the signal with the carbonate buffer decreased very much and this means that the streptavidin layer was removed.
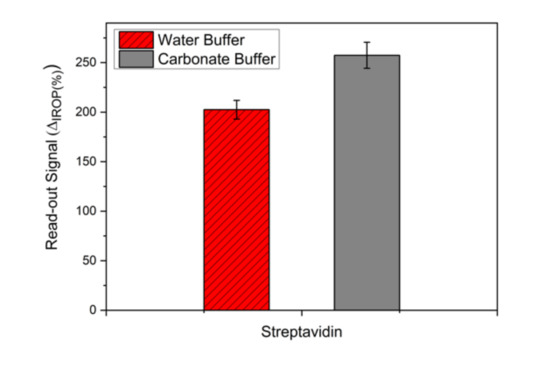
Figure 4.
Evaluation of the buffer over the sensing surface: deionized water buffer and carbonate buffer.
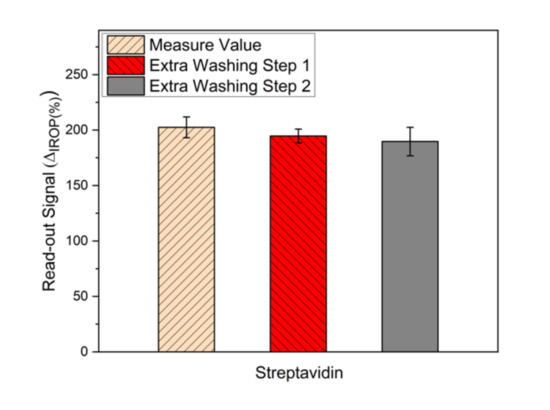
Figure 5.
Washing steps of the streptavidin monolayer.
In addition, the streptavidin dose–response curve was made to ensure surface stability and specificity. This was done by incubation of 5, 25, and 50 μg/mL during 1 h of streptavidin. Then, interferon gamma was incubated at 10 μg/mL for 3 h directly over the streptavidin layer as a negative control. The results are shown in Figure 6. It can be seen that for a streptavidin immobilization concentration of 50 μg/mL, the signal when the incubation of interferon gamma is made is the same and therefore there is no recognition of interferon-gamma over streptavidin.
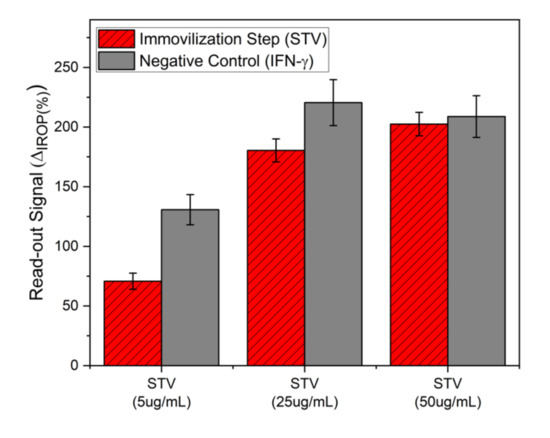
Figure 6.
Negative control by immobilization of interferon-gamma over the streptavidin sensing surface.
Finally, the biotinylated antibody was attached to streptavidin by the affinity of streptavidin-biotin. The formed complex by streptavidin and biotinylated antibody antiIFN-γ is stable and therefore, the sensing surface is very specific.
3.2. Detection of Interferon-Gamma. Comparison of ELISA and PoC Techniques
According to the conditions of the ELISA that was carried out, it is observed in Figure 7 that the minimum detectable concentration, that is to say, the limit of detection (Lod), under those conditions is 25 ng/mL and that it presents a dynamic range from 25 ng/mL to a value of approximately 200 ng/mL where saturation is reached.
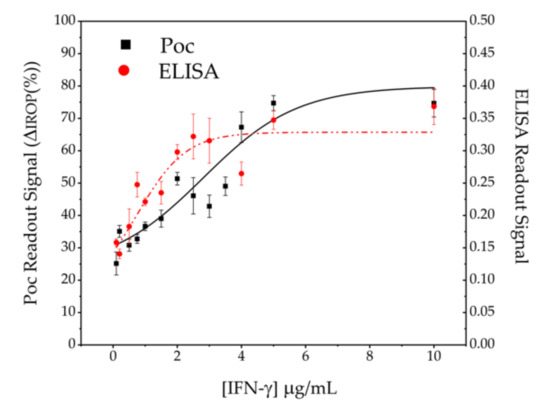
Figure 7.
IFN-γ concentration detection. The black squares correspond to the PoC technology and the red dots to the ELISA technique.
The results obtained with the interferometric optical detection method under the same conditions as the ELISA technique can be seen also in Figure 7. In the PoC technology, label-free tests were carried out and therefore, with a lower number of stages and reagents. The PoC technology presents in the test conditions an Lod of 25 ng/mL and a dynamic range around 400–500 ng/mL higher than in the case of the ELISA technology.
Lastly, a comparison between both techniques was made by making a linear adjustment in the lineal range (Figure 8) and it can be seen that it is a good fit and there is agreement between the data obtained by both techniques and it is observed that all the points fall within a linear adjustment with a 95% confidence interval.
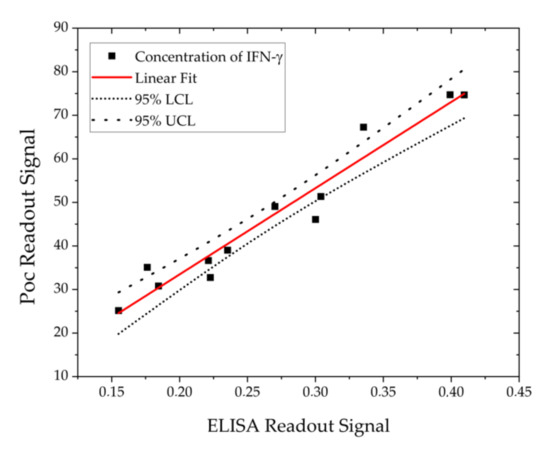
Figure 8.
Linear adjustment between the ELISA technique and PoC technology.
4. Conclusions
In this work, we used a label-free point-of-care device based on the label-free interferometric optical detection method to evaluate the interferon gamma (IFN-γ) concentration. We used a biosensor with three BICELLs (Biophotonic Sensing Cells) of 100 μm in diameter. The specific sensing surface is reached by the streptavidin-biotin affinity. The biotinylated anti-IFN-γ bioreceptor is bonded to streptavidin and at the same time, due to its small size, is used as a blocking agent on the surface. The point-of-care device can work with a low concentration of reagents and a low sample volume for measurements. In the same conditions, the detection limit of interferon gamma obtained for PoC is the same as that of the ELISA technique (25 ng/mL) using less reagents and steps in the assay. Finally, we showed a good correlation between both techniques in the lineal range studied.
Author Contributions
Conceptualization and supervision, Methodology, Writing—Review and editing, Funding acquisition, M.F.L.H.; Investigation, Methodology of the measurement system of PoC Technology, biokits and immunoassay procedure, Formal analysis, Y.R.; Methodology of the measurement system of ELISA Technique, C.F.M.; Fabrication of chip with bicells, R.L.E.; Optimization theoretical of BioPhotonic sensing cells, A.L.; Conceptualization and supervision, Methodology, Writing—Review and editing; Project administration and funding acquisition, M.H. All authors have read and agreed to the published version of the manuscript.
Funding
This project is supported by the funding agencies: Comunidad de Madrid, Convocatoria 2018 Ayudas Doctorados Industriales IND2018/BIO-9650; European Commission, under the Project AllerScreening (H2020-NMBP-768641); Spanish Government, project HERON TEC2017-84846-R.
Acknowledgments
Authors acknowledgment to BIOD for the support on the readout platform.
Conflicts of Interest
The authors declare that there is no conflict of interest.
References
- Dowlati, Y.; Herrmann, N.; Swardfager, W.; Liu, H.; Sham, L.; Reim, E.K.; Lanctot, K.L. A Meta-Analysis of Cytokines in Major Depression. Biol. Psychiatry 2010, 67, 446–457. [Google Scholar] [CrossRef] [PubMed]
- Biron, C.A.; Nguyen, K.B.; Pien, G.C.; Cousens, L.P.; Salazar-Mather, T.P. Natural killer cells in antiviral defense: Function and regulation by innate cytokines. Annu. Rev. Immunol. 1999, 17, 189–220. [Google Scholar] [CrossRef]
- Omae, T.; Saito, Y.; Tsuchie, H.; Ohno, K.; Maegaki, Y.; Sakuma, H. Cyokine/chemokine elevation during the transition phase from HSV encephalitis to autoimmune anti-NMDA receptor encephalitis. Brain Dev. 2018, 40, 361–365. [Google Scholar] [CrossRef] [PubMed]
- Jager, W.; Velthius, H.; Prakken, B.J.; Kuis, W.; Rijkers, G.T. Simultaneous Detection of 15 Human Cytokines in a Single Sample of Stimulated Peripheral Blood Mononuclear Cells. Clin. Diagn. Lab. Immunol. 2003, 10, 133–139. [Google Scholar] [CrossRef] [PubMed]
- Wang, X.; Cohen, L.; Wang, J.; Walt, D.R. Competitive Immunoassays for the Detection of Small Molecules Using Single Molecule Arrays. J. Am. Chem. Soc. 2018, 140, 18132–18139. [Google Scholar] [CrossRef] [PubMed]
- Isaacs, A.; Lindenmann, J. Virus interference. I. The interferon. Proc. R. Soc. Lond. Ser. B Biol. Sci. 1957, 147, 258–267. [Google Scholar] [CrossRef]
- Pestka, S.; Krause, C.; Walter, M. Interferons, interferon-like cytokines, and their receptors. Immunol. Rev. 2005, 202, 8–32. [Google Scholar] [CrossRef]
- Dorman, S.E.; Holland, S.M. Interferon-g and interleukin-12 pathway defects and human disease. Cytokine Growth Factor Rev. 2000, 11, 321–333. [Google Scholar] [CrossRef]
- Boehm, U.; Klamp, T.; Groot, M.; Howard, J.C. Cellular responses to interferon-γ. Annu. Rev. Immunol. 1997, 15, 749–795. [Google Scholar] [CrossRef]
- Sen, G.C. Viruses and Interferons. Annu. Rev. Microbiol. 2001, 55, 255–281. [Google Scholar] [CrossRef]
- Lavalvani, A.; Pareek, M. Interferon gamma release assays: Principles and practice. Enferm. Infecc. Microbiol. Clín. 2010, 28, 245–252. [Google Scholar] [CrossRef] [PubMed]
- Crisafulli, S.; Pandya, Y.; Moolchan, K.; Lavoie, T.B. Interferon Gamma: Activity and Elisa Detection Comparisons. Biotechniques 2008, 45, 101–102. [Google Scholar] [CrossRef]
- Favre, N.; Bordmann, G.; Rudin, W. Comparison of cytokine measurements using ELISA, ELISPOT and SemiQuantitative RT-PCR. J. Immunol. Methods 1997, 204, 57–66. [Google Scholar] [CrossRef]
- Tuleuova, N.; Jones, C.N.; Yan, J.; Ramanculov, E.; Yokobayashi, Y.; Revzin, A. Development of an Aptamer Beacon for Detection of Interferon-Gamma. Anal. Chem. 2010, 82, 1851–1857. [Google Scholar] [CrossRef] [PubMed]
- Farid, S.; Meshik, X.; Choi, M.; Mukherjee, S.; Lan, Y.; Parikh, D.; Poduri, S.; Baterdene, U.; Huang, C.E.; Wang, Y.Y.; et al. Detection of Interferon Gamma Using Graphene an Aptamer based FET-like Electrochemical Biosensor. Biosens. Bioelectron. 2015, 71, 294–299. [Google Scholar] [CrossRef]
- Ding, S.; Cargill, A.; Das, S.; Medintz, I.; Claussen, J. Biosensing with Förster Resonance Energy Transfer Coupling between fluorophores and Nanocarbon allotropes. Sensors 2015, 15, 14766–14787. [Google Scholar] [CrossRef]
- Chen, Y.; Pui, T.S.; Kongsuphol, P.; Tang, K.C.; Arya, S.K. Aptamer-Based Array Electrodes for Quantitative Interferon-gamma Detection. Biosens. Bioelectron. 2014, 53, 257–262. [Google Scholar] [CrossRef] [PubMed]
- Yang, Z.; Jian, Z.; Chenm, X.; Li, J.; Qin, P.; Zhao, J.; Jiao, X.; Hu, X. Electrochemical Impedance Immunosensor for Sub-Picogram Level Detection of Bovine Interferon Gamma Based on Cylinder-Shaped TiO2 Nanorods. Biosens. Bioelectron. 2015, 63, 190–195. [Google Scholar] [CrossRef] [PubMed]
- Ding, S.; Mosher, C.; Lee Xian, L.; Das Suprem, R.; Cargill Allison, A.; Tang, X.; Chen, B.; McLamore Eric, S.; Gomes, C.; Hostetter Jesse, M.; et al. Rapid and Label-Free Detection of Interferon Gamma via an Electrochemical Aptasensor Comprising a Ternary Surface Monolayer on a Gold Interdigitated Electrode Array. ACS Sens. 2017, 2, 210–217. [Google Scholar] [CrossRef]
- Xu, L.; Lei, S.; Liu, Z.; Ouyang, G.; Zou, L.; Ye, B. A label-free IFN-γ aptasensor based on target-triggered allosteric switching of aptamer beacon and streptavidin-inorganic hybrid composites. Anal. Chim. Acta 2019, 1087, 29–35. [Google Scholar] [CrossRef]
- Liu, M.W.; Chang, H.J.; Lee, S.S.; Lee, C.K. Cross-calibrating Interferon-gamma detection by using electrochemical impedance spectroscopy and paraboloidal mirror enabled surface plasmon resonance interferometer. In Proceedings of the SPIE 9701, 97010U, San Francisco, CA, USA, 10 March 2016. [Google Scholar] [CrossRef]
- Singh, M.; Troung, J.; Reeves, W.B.; Hahm, J.I. Emerging Cytokine Biosnsors with Optical Detection Modalities and Nanomaterial-Enabled Signal Enhancement. Sensors 2017, 17, 428. [Google Scholar] [CrossRef] [PubMed]
- Jeong, H.-H.; Erdene, N.; Park, J.-H.; Jeong, D.H.; Lee, H.-Y.; Lee, S.K. Real-time label-free immunoassay of interferon-gamma and prostate-specific antigen using a Fiber-Optic Localized Surface Plasmon Resonance sensor. Biosens. Bioelectron. 2012, 39, 346–351. [Google Scholar] [CrossRef] [PubMed]
- Deng, P.; Song, C.; Que, L. Label-free monitoring of Alzheimer´s disease biomarkers in cerebrospinal fluid. In Proceedings of the 2017 IEEE 17th International Conference on Nanotechnology (IEEE-NANO), Pittsburgh, PA, USA, 25–28 July 2017; pp. 1074–1077. [Google Scholar]
- Barozzi, M.; Manicardi, A.; Vannucci, A.; Candiani, A.; Sozzi, M.; Konstantaki, M.; Pissadakis, S.; Corradini, R.; Selleri, S.; Cucinotta, A. Optical fiber sensors for Label-free DNA Detection. J. Lightwave Technol. 2016, 35, 3461–3472. [Google Scholar] [CrossRef]
- Lei, C.; Guo, B.; Jiang, Y.; Wu, Y.; Kobayashi, H.; Ito, T.; Yasumoto, A.; Yatomi, Y.; Ozeki, Y.; Goda, K. High-throughput, label-free, multivariate cell analysis with optofluidic time-strech microscopy. In Proceedings of the 2017 Conference on Lasers and Electro-Optics Pacific Rim (CLEO-PR), Singapore, 31 July–4 August 2017. [Google Scholar] [CrossRef]
- Holgado, M.; Sanza, F.J.; Hernandez, A.L.; Lavín, A.; Casquel, R.; Laguna, M.F. Description of an advantageous optical label-free biosensing interferometric read-out method to measure biological species. Sensors 2014, 14, 3675–3689. [Google Scholar] [CrossRef]
- Holgado, M.; Maigler, M.V.; Santamaría, B.; Hernandez, A.L.; Lavín, A.; Laguna, M.F.; Sanza, F.J.; Granados, D.; Casquel, R.; Portilla, J.; et al. Towards reliable optical label-free point-of-care (PoC) biosensing devices. Sens. Actuators B Chem. 2016, 236, 765–772. [Google Scholar] [CrossRef]
- Casquel, R.; Holgado, M.; Laguna, M.F.; Hernández, A.L.; Santamaría, B.; Lavín, A.; Tramarín, L.; Herreros, P. Engineering vertically interrogated interferometric sensors for optical label-free biosensing. Anal. Bioanal. Chem. 2020, 412, 3285–3297. [Google Scholar] [CrossRef]
- Maigler, M.V.; Holgado, M.; Laguna, M.F.; Sanza, F.J.; Santamaría, B.; Lavín, A.; Espinosa, R.L. A new device based on Interferometric Optical Detection Method for Label-Free Screening of C-Reactive Protein. IEEE Trans. Instrum. Meas. 2019, 68, 3193–3199. [Google Scholar] [CrossRef]
- Espinosa, R.L.; Laguna, M.F.; Fernandez, F.; Santamaría, B.; Sanza, F.J.; Maigler, M.V.; Alvarez-Millan, J.J.; Canalejas-Tejero, V.; Holgado, M. A Proof-of-Concept of Label-Free Biosensing System for Food Allergy Diagnostics in Biophotonic Sensing Cells: Performance Comparison with ImmunoCAP. Sensors 2018, 18, 2686. [Google Scholar] [CrossRef]
- Lavin, A.; Casquel, R.; Sanza, F.J.; Laguna, M.F.; Holgado, M. Efficient design and optimization of bio-photonic sensing cells (BICELLs) for label free biosensing. Sens. Actuators B Chem. 2013, 176, 753–760. [Google Scholar] [CrossRef]
- Santamaría, B.; Laguna, M.F.; López-Romero, D.; Hernandez, A.L.; Sanza, F.J.; Lavín, A.; Casquel, R.; Maigler, M.V.; Espinosa, R.L.; Holgado, M. Development towards Compact Nitrocellulose-Based Interferometric Biochips for Dry Eye MMP9 Label-Free In-Situ Diagnosis. Sensors 2017, 17, 1158–1164. [Google Scholar] [CrossRef]
- Blankenburg, R.; Meller, P.; Ringsdorf, H.; Salesse, C. Interaction between biotin lipids and streptavidin in monolayers: Formation of oriented two-dimensional protein domains induced by surface recognition. Biochemistry 1989, 28, 8214–8221. [Google Scholar] [CrossRef] [PubMed]
- Weber, P.C.; Ohlendorf, D.H.; Wendoloski, J.J.; Salemme, F.R. Structural origins of high-affinity biotin binding of streptavidin. Science 1989, 243, 85–88. [Google Scholar] [CrossRef] [PubMed]
© 2020 by the authors. Licensee MDPI, Basel, Switzerland. This article is an open access article distributed under the terms and conditions of the Creative Commons Attribution (CC BY) license (http://creativecommons.org/licenses/by/4.0/).