Letter

A Red Emissive Fluorescent Turn-on Sensor for the Rapid Detection of Selenocysteine and Its Application in Living Cells Imaging

1
College of Chemistry and Chemical Engineering, Central South University, Changsha 410083, China
2
College of Chemical and Biological Engineering, Hunan University of Science and Engineering, Yongzhou 425199, China
*
Author to whom correspondence should be addressed.
Sensors 2020, 20(17), 4768; https://doi.org/10.3390/s20174768
Submission received: 2 August 2020 / Revised: 18 August 2020 / Accepted: 22 August 2020 / Published: 24 August 2020
(This article belongs to the Section Chemical Sensors)

Abstract

:
The content of selenocysteine in cells has an important effect on a variety of human diseases, and the detection of selenocysteine by fluorescent sensors in vivo has shown many advantages. In order to further develop fast-reaction-time, good-selectivity, and high-sensitivity long-wavelength selenocysteine fluorescent sensors, we designed and synthesized the compound YZ-A4 as a turn-on fluorescent sensor to detect the content of selenocysteine. The quantitative detection range of the sensor YZ-A4 to selenocysteine was from 0 to 32 μM, and the detection limit was as low as 11.2 nM. The sensor displayed a rapid turn-on response, good selectivity, and high sensitivity to selenocysteine. Finally, we have demonstrated that YZ-A4 could be used for fluorescence imaging of selenocysteine in living cells.

Graphical Abstract

1. Introduction

Although there are very few selenium (Se) requirements, it is essential for human health and development [1]. Insufficient or excessive intake of selenium can lead to many diseases [2,3,4]. Selenocysteine (Sec) is the main form of selenium compounds in the cell [5]. Known as the 21st amino acid in protein synthesis, Sec is an important component of selenium protein (SeP), which has high enzyme catalytic activity [6]. The SeP enzyme is involved in the body’s antioxidant defense, growth, muscle development, thyroid hormone regulation, and immune function, as well as other physiological functions of metabolism [7,8]. As the reactive site of SeP, Sec content is closely related to the high catalytic capacity of SeP and many physiological functions such as cancer, cardiovascular disease, diabetes, neurodegenerative disease, and male infertility [9,10,11]. Due to the important role of Sec in human physiological function, it is necessary to develop a fast and reliable method to detect Sec in biological systems [12].
Compared to high-performance liquid chromatography (HPLC), gas chromatography (GC), and inductively coupled plasma mass spectrometry (ICP-MS) detection methods, fluorescence sensors can avoid the efficient extraction of Sec and the destruction of the biological sample [13,14]. They are suitable for the detection of Sec in a biological system with high sensitivity and selectivity, and fast response [15]. Therefore, the detection of Sec in biological samples by the fluorescent sensor method has attracted the extensive attention of researchers [16].
Recently, several Sec fluorescent sensors including nanosensors were reported, using 2,4-dinitrophenyl ether, 2,4-dinitrobenzene sulfone amide, or 2,4-dinitrobenzene sulfonate ester as the reaction sites [17,18,19,20]. Among them, 2,4-dinitrobenzene sulfonate ester has a faster response time [19]. At the same time, based on luciferin, coumarin, hemicyanine, and xanthene dyes, many fluorescent sensors were developed to detect Sec [17,21,22,23,24]. In the design process, fluorescent sensors with long-wavelength emission are preferred to reduce phototoxicity and increase tissue penetration [12,18].
Though a few long-wavelength Sec fluorescent sensors have been reported in recent years [24,25,26], further development research is still needed to date, such as developing fast-reaction-time, good-selectivity, and high-sensitivity long-wavelength Sec fluorescent sensors. Hence, we rationally designed a novel turn-on sensor YZ-A4 based on xanthene dyes, and using a 2,4-dinitrobenzene sulfonate ester as the reaction sites of Sec. The sensor exhibited excellent optical properties, fast reaction time, good selectivity, and high sensitivity to Sec. Finally, the sensor YZ-A4 was successfully applied to detect Sec for fluorescence imaging in biological samples (Scheme 1).

2. Materials and Methods

2.1. Chemicals and Apparatus

All chemicals were acquired from Shanghai Titan Technology Co., LTD and used without further purification. 1H NMR (400 MHz) and 13C NMR (100 MHz) spectra were performed on a Bruker Advance III HD400 spectrometer. The HRMS spectra were recorded with an Agilent 6540. The HPLC spectra were measured with a SHIMADZU SPD-10ATVP. UV-visible absorption and fluorescence spectra were recorded with a SHIMADZU UV-2600 and SHIMADZU RF-6000 at room temperature, respectively.

2.2. Synthesis of Dye YZ-A3 and the Fluorescent Sensor YZ-A4

According to the literature method, the dye YZ-A3 was synthesized [27,28]. 2-(4-(Diethylamino)-2-hydroxybenzoyl)benzoic acid (313 mg, 1 mmol) and 6-hydroxy-3,4-dihydronaphthalen-1(2H)-one (162 mg, 1 mmol) were added to the stirred solution of concentrated H2SO4 (15 mL) in a flask. The mixture was heated at 90 °C for 2.5 h, cooled to room temperature, and poured into ice (100 g). After 70% HClO4 (1 mL) was added to the solution, the red precipitate gradually generated, which was filtered off and washed with ice water (4 × 5 mL). The precipitate was purified through the a silica gel chromatography column with v(CH2Cl2)/v(CH3OH) (18:1) as the eluent, and YZ-A3 was obtained as a brown solid (388 mg, 72%). 1H NMR (400 MHz, DMSO-d6) δ 13.31 (s, 1H), 11.40 (s, 1H), 8.27 (s, 1H), 8.11–8.13 (m, 1H), 7.83 (t, J = 7.5 Hz, 1H), 7.73 (t, J = 7.6 Hz, 1H), 7.38 (d, J = 7.4 Hz, 1H), 7.26–6.95 (m, 2H), 6.79–6.84 (m, 2H), 3.52–3.63 (m, 4H), 2.74–2.83 (m, 2H), 2.21–2.31 (m, 2H), 1.22–1.11 (m, 6H). 13C NMR (100 MHz, DMSO-d6) δ 198.75, 167.44, 166.94, 165.10, 164.65, 157.64, 154.74, 153.96, 145.50, 140.43, 134.70, 133.58, 132.51, 131.40, 130.33, 130.11, 128.12, 118.03, 116.20, 109.66, 104.47, 96.71, 45.64, 44.49, 26.69, 23.59, 12.90. HRMS (ESI): m/z calculated for (C28H26NO4)+: 440.1856, found: 440.1854.
The fluorescent sensor YZ-A4 was synthesized according to the literature [29]. Compound YZ-A3 (0.162 g, 0.3 mmol) and 2,4-dinitrobenzene sulfonyl chloride (0.080 g, 0.3 mmol) were stirred in dry dichloromethane (10 mL) at room temperature under N2 for 4 h. After the solution was condensed and purified by a silica gel chromatography column with CH2Cl2/EtOH (20:1) as the eluent, a purple solid (0.157 g, 68%) was obtained. 1H NMR (400 MHz, DMSO-d6) δ 9.13 (d, J = 2 Hz, 1H), 8.61 (dd, J = 9, 2 Hz, 1H), 8.28 (d, J = 9 Hz, 1H), 7.96 (d, J = 8 Hz, 1H), 7.89 (d, J = 9 Hz, 1H), 7.78 (t, J = 7 Hz, 1H), 7.68 (t, J = 7 Hz, 1H), 7.34 (d, J = 8 Hz, 1H), 7.19–7.09 (m, 2H), 6.59–6.41 (m, 3H), 3.31–3.36 (m, 4H), 2.75 (dd, J = 15, 8 Hz, 2H), 2.03–1.92 (m, 1H), 1.80–1.67 (m, 1H), 1.09 (t, J = 7 Hz, 6H). 13C NMR (100 MHz, DMSO-d6) δ 169.42, 151.99, 149.12, 148.57, 139.80, 135.85, 134.12, 131.15, 130.51, 128.90 127.95, 127.06, 124.95, 124.76, 124.59, 124.17, 121.64, 120.48, 109.84, 97.31, 44.23, 27.04, 20.78, 12.78. HRMS (ESI): m/z calculated for (C34H28N3O10S)+: 670.1490, found: 670.1485.

2.3. Imaging Application of the Fluorescent Sensor YZ-A4 in A549 Cells

A549 cells (human lung cancer cells) were incubated in 35 mm cell culture dishes in the 1640 culture medium with 10% fetal bovine serum, 1% penicillin, and 1% streptomycin, under the atmosphere of 5% CO2 at 37 °C in a carbon dioxide incubator for 24 h. L-Selenocystine (Sec)2 (final concentration: 10 μM) was added as a source of Sec from a 1 mM stock in PBS (10 mM, pH 7.40). After sensor YZ-A4 (final concentration: 10 μM, containing 1% DMSO) was added from a 1 mM stock in DMSO, cells were incubated for different times and subsequently washed with PBS (pH = 7.4) three times. Imaging application of the fluorescent sensor YZ-A4 was completed with a Nikon Ni-U fluorescence microscope (red channel, excitation from 540 to 565 nm and emission from 605 to 655 nm).

3. Results

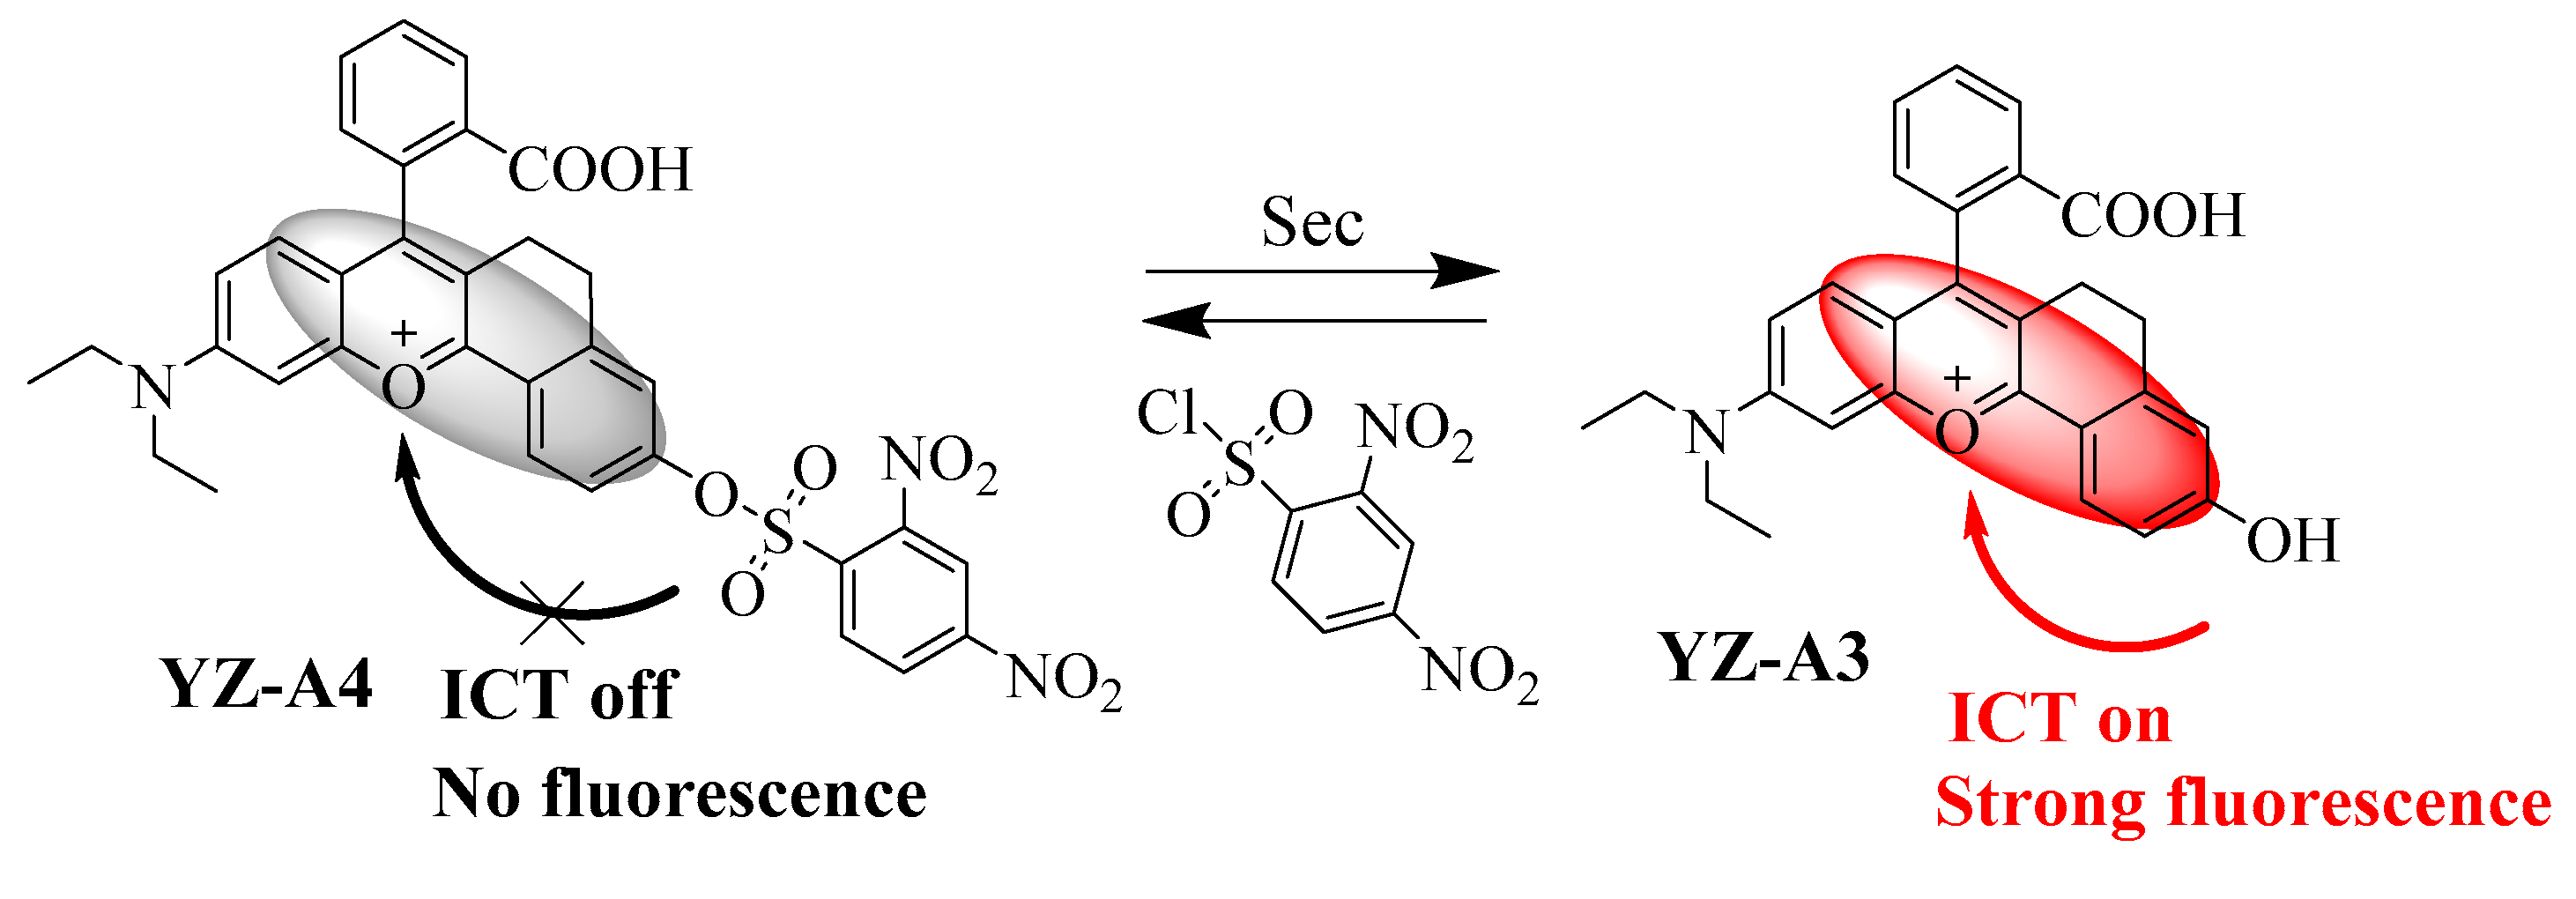
3.1. Design and Synthesis of the Fluorescent Sensor YZ-A4

Based on the previous studies [24], we modified the fluorophore structure by attaching a benzene ring to the xanthene fluorophore to stabilize the positive ions. Then, the 2,4-dinitrobenzene sulfonate ester group with a fast reaction rate was selected to detect Sec as the reaction sites. Due to the 2,4-dinitrobenzene sulfonate ester group truncating the intramolecular charge transfer (ICT) effect [22,30], the fluorescence of YZ-A4 quenched. When reacted with Sec, the ICT effect of the generated YZ-A3 was restored. Therefore, YZ-A4 can be theoretically used to detect Sec rapidly by the "turn-on" fluorescence reaction under simulated physiological conditions.
A fluorescent sensor YZ-A4 was synthesized as shown in Scheme 2. First, YZ-A3 dye was synthesized by a cyclization reaction of YZ-A1 with YZ-A2 in concentrated H2SO4 at 90 °C. Next, the YZ-A3 dye reacted with 2,4-dinitrobenzenesulfonyl chloride under room temperature conditions to give the fluorescent sensor YZ-A4. The structure of YZ-A3 dye and fluorescent sensor YZ-A4 was characterized by 1H NMR, 13C NMR, and HRMS spectra in Figures S1–S6 in the Supplementary Materials.

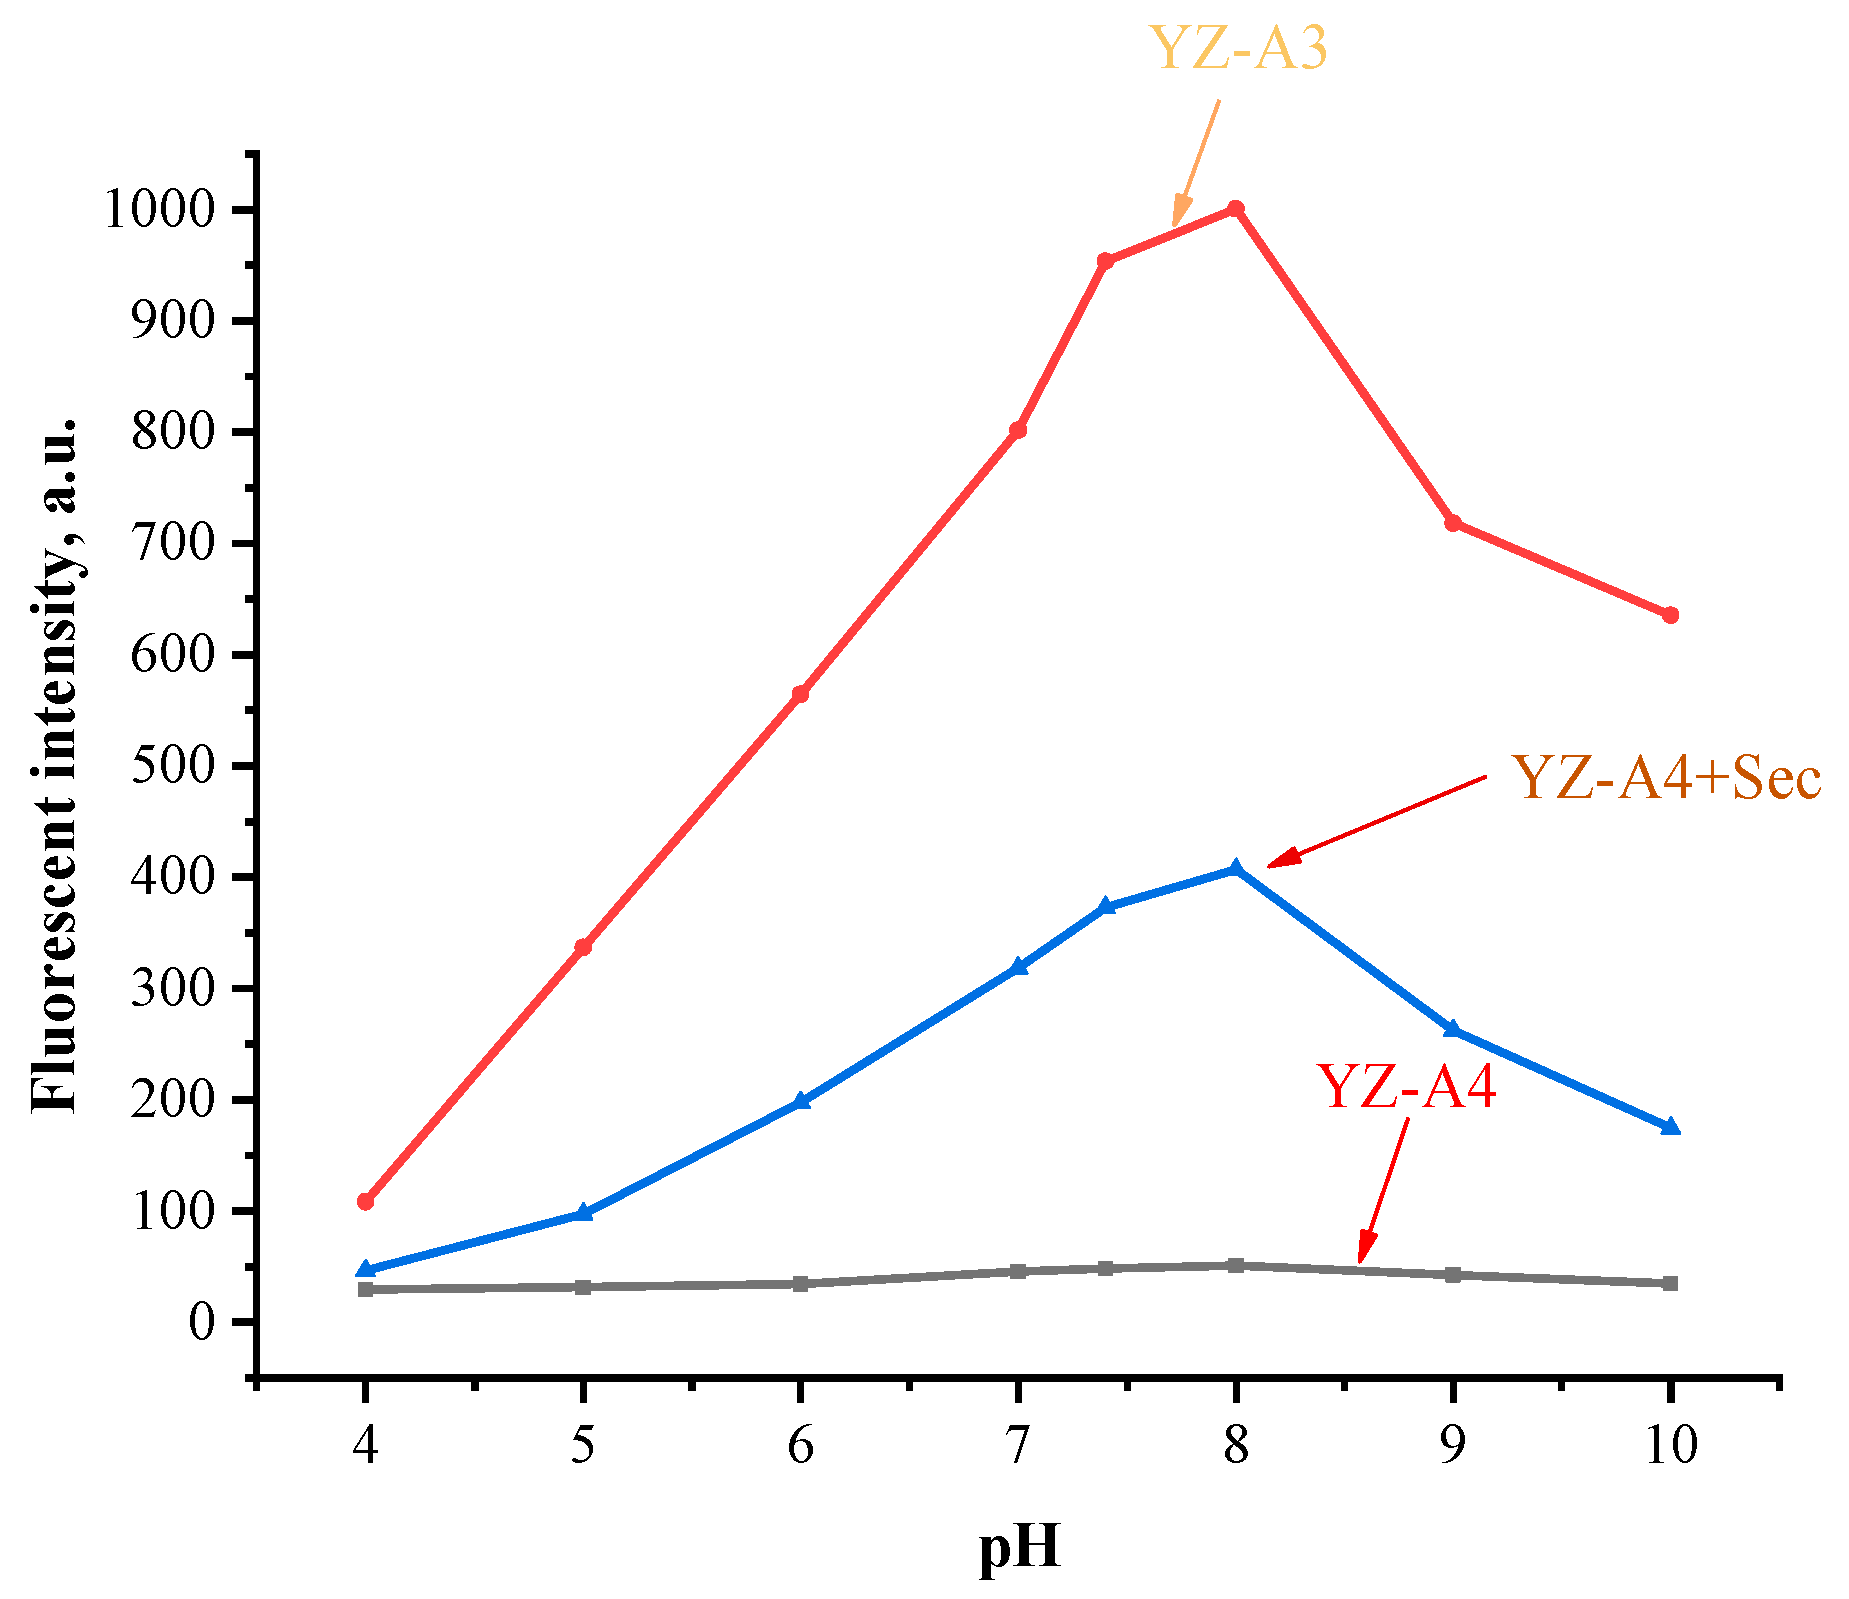
3.2. Optical Properties of Dye YZ-A3 and the Fluorescent Sensor YZ-A4

To determine the optical properties of the fluorescent sensor YZ-A4, the UV-visible absorption and fluorescence spectrum of the YZ-A3 dye (10 μM) and sensor YZ-A4 (10 μM) were examined under the PBS buffer (10 mM, pH 7.4, containing 1% DMSO). The YZ-A3 dye and sensor YZ-A4 both display a maximum absorption peak at around 550 nm, but the YZ-A3 dye displays a maximum absorption peak at 365 nm (black), which can be used to distinguish them in Figure 1. At the same time, after treating YZ-A4 with Sec (10 μM), a new maximum absorption peak appeared at 365 nm, too (yellow). When excited at 550 nm, the YZ-A3 dye displays strong fluorescence at 614 nm (red), while YZ-A4 displays almost no fluorescence (pink). However, after treating YZ-A4 with Sec (10 μM), a new fluorescence peak arose at 614 nm (blue). The spectrogram indicated that YZ-A4 had reacted with Sec, which resulted in the fracture of the sulfonate ester group and the formation of the YZ-A3 fluorophore, recovering the ICT effect of YZ-A3 and producing strong fluorescence. HPLC analysis showed that after treating YZ-A4 with Sec (10 μM), a new chromatographic peak was generated with the same retention time as YZ-A3 (5.106 min, blue) in Figure S7 in the Supplementary Materials, which proved that the reaction mechanism can induce the production of YZ-A3.
In order to determine the optimal reaction time, we studied the effect of reaction time on the fluorescence intensity of YZ-A4 reacted with Sec. Due to the instability, Sec was freshly prepared by mixing L-selenocysteine with dithiothreitol each time [29]. The response of YZ-A4 (10 μM) to fresh Sec (100 μM) was very rapid and completed within about 3 min and the fluorescence enhancement was 20-fold (Figure 2). As cysteine (Cys) and Sec are very similar in structure, the reactivity of YZ-A4 with Cys (100 μM) within 7 min was determined. Fluorescence enhancement was not obvious after YZ-A4 reacted with Cys within 3 min.
To further determine the appropriate reaction pH value of YZ-A4 and Sec, we studied the fluorescence intensity changes of the YZ-A4 sensor, treating YZ-A4 with Sec and the YZ-A3 dye under different pH conditions. As shown in Figure 3, under different pH conditions, there is almost no fluorescence with YZ-A4. However, the fluorescence intensity enhanced after YZ-A4 reacted with Sec. Moreover, with the increase in pH value from 4.0 to 8.0, the fluorescence intensity of YZ-A4 reacted with Sec also increased, but slightly decreased after a pH value more than 8.0. These changes are consistent with the YZ-A3 dye, which suggested that YZ-A4 reacted with Sec had a turn-on response.
The detection range of YZ-A4 to Sec concentration was studied. With the increase in Sec concentrations (0–100 μM), the fluorescence intensity of YZ-A4 reacted with Sec considerably increased, as shown in Figure 4. A good linearity response was observed for Sec in the concentration range 0–32 µM, and the regression equation was F/F0 = 0.55704 [Sec] μM + 1.33763 with R2 = 0.99413. Based on the regression equation of the response of YZ-A4 to Sec and standard deviation of blank parallel determination, the limit of detection was calculated as 11.2 nM.

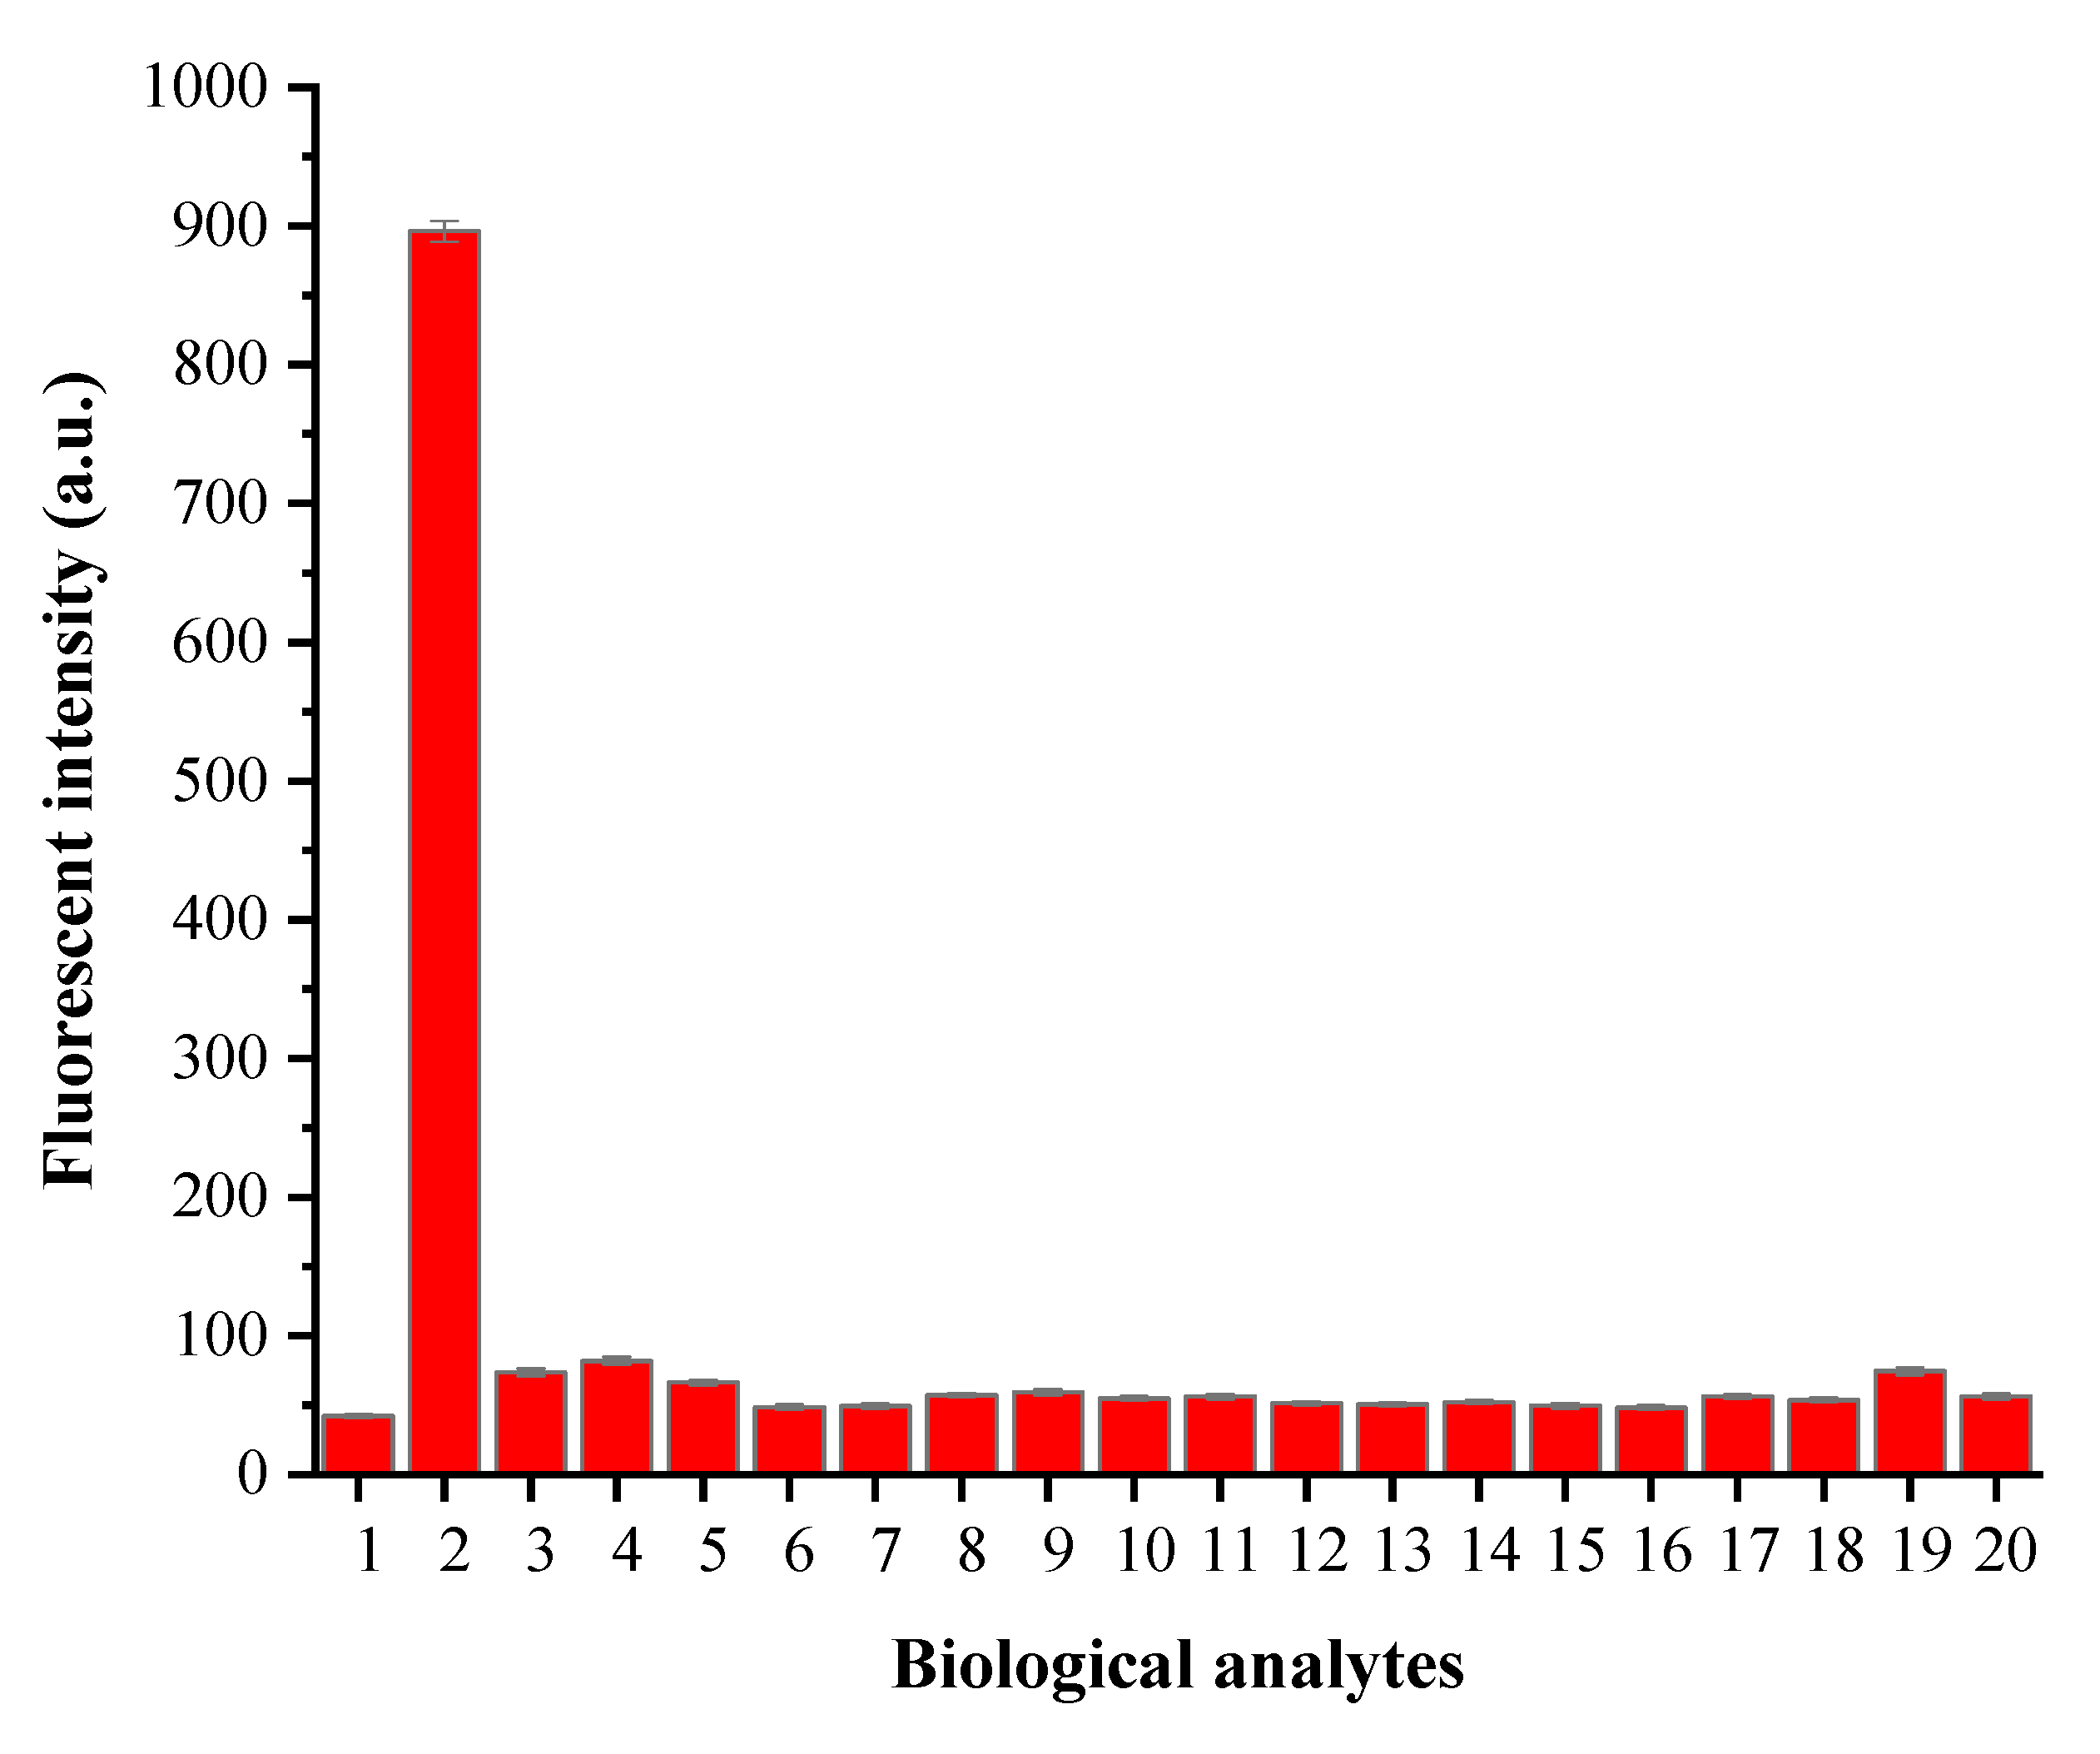
3.3. The Anti-Interference Ability and Selectivity of YZ-A4 toward Sec
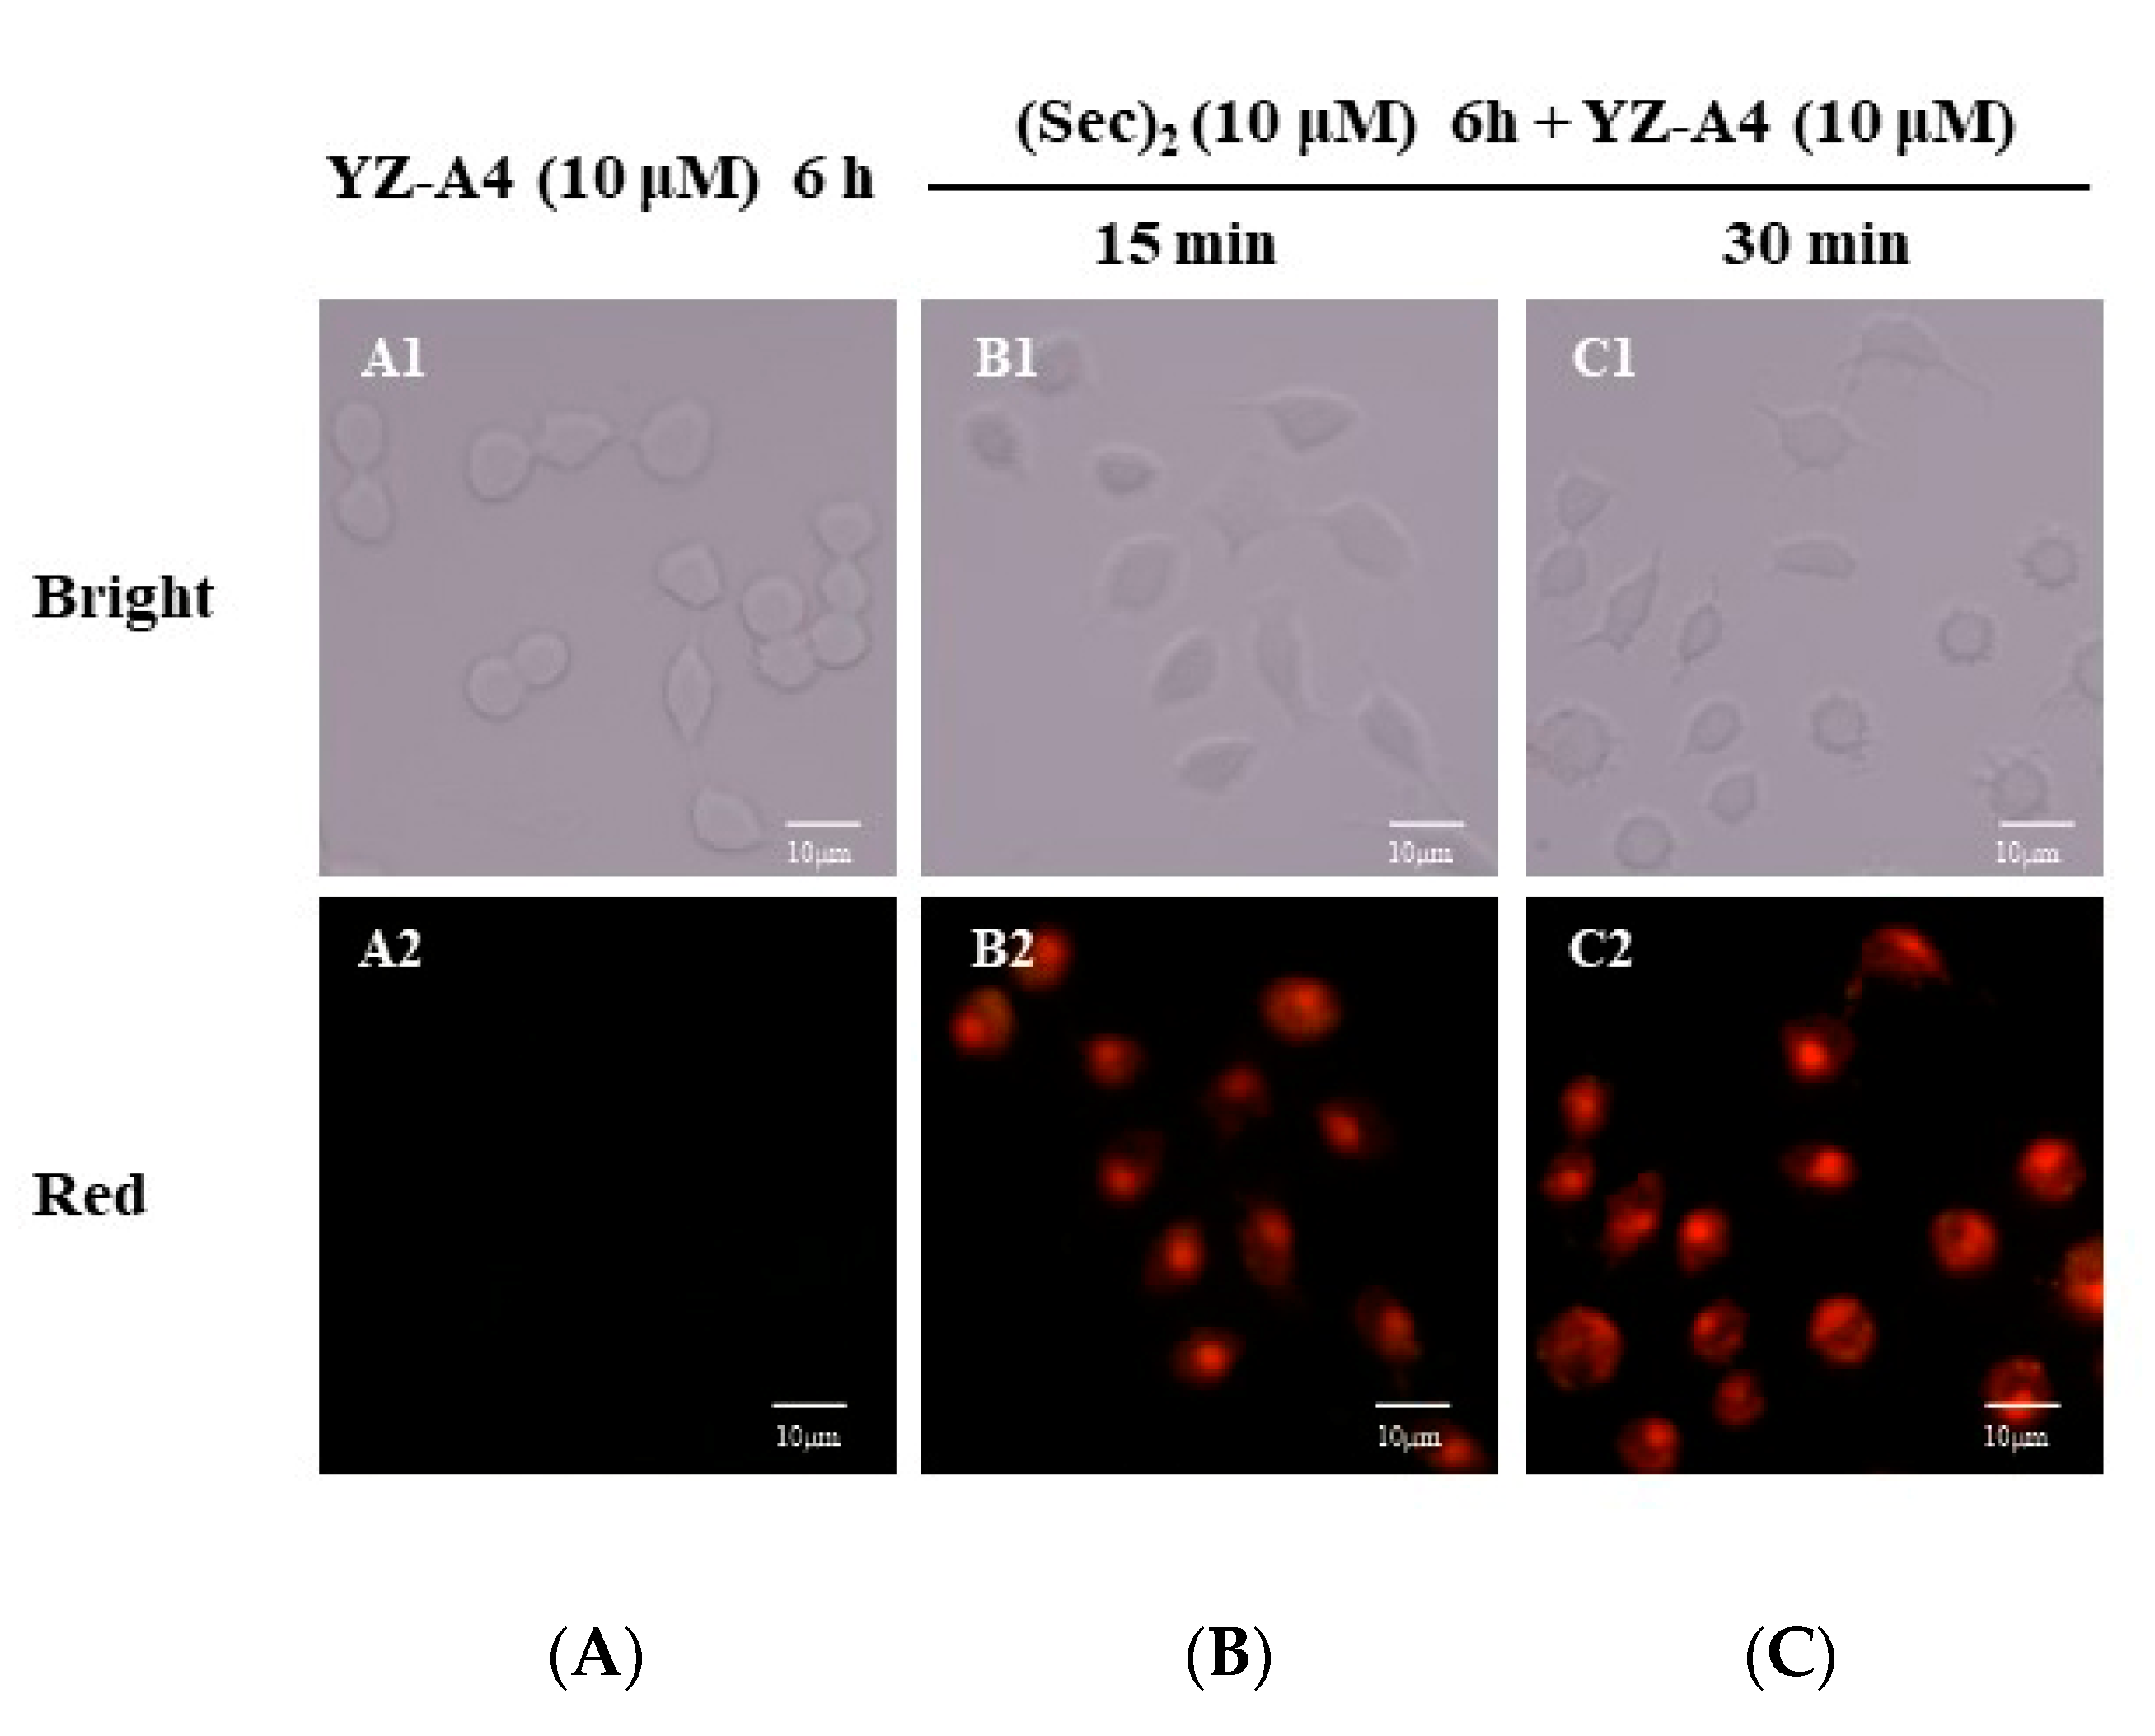
The selectivity of YZ-A4 toward Sec was evaluated in the physiological pH value environment. Due to the difference in reaction rate, biothiols (Cys, Hcy and GSH) could not distinctly enhance the fluorescence intensity of YZ-A4 within 3 min, showing a certain selectivity, which is consistent with the reported sensor by Zhang et al. [29]. At the same time, the sensor shows better selectivity to Sec than many amino acids (Glu, Asp, Val, Phe, Pro, Thr, Arg, Lso, Leu, His, Lys, Try, and Ser) and other selenocompounds (Na2Se and Na2SeO3) in Figure 5. The results indicated that the sensor YZ-A4 could particularly recognize Sec under physiological pH value conditions. In addition, the anti-interference ability of YZ-A4 to the biological analytes was evaluated. In the presence of other bioactive substances, the fluorescence intensity of the YZ-A4 sensor to Sec changed little, which demonstrated that other bioactive substances had no interference when the YZ-A4 sensor detected Sec, as shown in Figure S8 in the Supplementary Materials.

3.4. Cell Imaging

We selected A549 cells as a test model to test the recognition capability of YZ-A4 toward Sec in living cells. The Sec inside cells can be produced by the reaction of (Sec)2 with intracellular biothiols [29]. As shown in Figure 6, A549 cells incubated with the sensor YZ-A4 (10 μM) showed hardly any fluorescence emission after 6 h, which suggested that YZ-A4 was not responsive to the biothiols in cells. (Figure 6, panel A2). However, when cells were incubated with (Sec)2 (10 μM) for 6 h and the sensor YZ-A4 (10 μM) was then added for 15 min, red fluorescence appeared (Figure 6, panel B2). After the sensor YZ-A4 was added for 30 min, strong fluorescence was significantly produced and no longer enhanced (Figure 6, panel C2). These results suggest that the biothiols species did not exhibit interference to the detection of Sec, and YZ-A4 is a suitable tool for detecting Sec in living cells. At the same time, the concentration of Sec in normal cells is very low. However, when there are some physiological abnormalities, such as thyroid disease, the concentration of Sec will increase significantly, and the fluorescence sensors can detect the Sec concentration [23,26]. Therefore, YZ-A4 can be used to detect Sec concentration in abnormal cells of simulated physiological diseases.

4. Conclusions

In summary, a novel red emissive fluorescent sensor YZ-A4 was designed and synthesized for the fast, accurate, and highly selective detection of Sec in living cells. The response of YZ-A4 to Sec was completed to produce red fluorescence within about 3 min, and the fluorescence enhancement at 614 nm was 20 fold under simulated physiological conditions. The quantitative detection range of the sensor YZ-A4 to Sec was from 0 to 32 μM, and the detection limit was as low as 11.2 nM, whose detection limit was lower and the response time was faster than those of the reported sensors [12,31]. The sensor YZ-A4 exhibited good selectivity to Sec, whereas the biothiols and other amino acids hardly exhibited interference. The sensor YZ-A4 could be used for fluorescence imaging of Sec in living A549 cells. The performance of the fluorescent sensor indicated that the sensor can be used as a fast and accurate detection tool in detecting Sec in living cells samples.

Supplementary Materials

The following are available online at https://www.mdpi.com/1424-8220/20/17/4768/s1, Figure S1: 1H NMR spectrum of compound YZ-A3 (DMSO-d6), Figure S2: 13C NMR spectrum of compound YZ-A3 (DMSO-d6), Figure S3: HRMS spectrum of compound YZ-A3, Figure S4: 1H NMR spectrum of compound YZ-A4 (DMSO-d6), Figure S5: 13C NMR spectrum of compound YZ-A4 (DMSO-d6), Figure S6: HRMS spectrum of compound YZ-A4, Figure S7: HPLC spectrum of compound YZ-A3 (black) and YZ-A4 (pink), and treating YZ-A4 with Sec (blue), Figure S8: Fluorescent intensity responses of 10 μM YZ-A4 at 614 nm to Sec (100 μM) in the presence of various biological analytes (100 μM) in PBS (10 mM, pH 7.40, containing 1% DMSO as cosolvent). Legend: (1) Blank; (2) Cys; (3) Hcy; (4) GSH; (5) Glu; (6) Asp; (7) Val; (8) Phe; (9) Pro; (10) Thr; (11) Arg; (12) Lso; (13) Leu; (14) His; (15) Lys; (16) Try; (17) Ser; (18) Na2Se; (19) Na2SeO3. Excitation at 550 nm. Each piece of data was obtained 3 min after mixing. Table S1: The performance parameters of some reported Sec fluorescent sensors.

Author Contributions

Z.W. and Y.J. conceived and designed the work. Z.W., H.Z. and C.Z. carried out the synthetic work. Z.W., D.T. and Q.W. performed the fluorescence properties assay. Z.W., W.D. and Y.J. wrote the paper. All authors read and approved the final manuscript.

Funding

This work was financially supported by the National Natural Science Foundation of China (20876180), the Natural Science Foundation of Hunan Province (2018JJ3196), and the Scientific Research Project of Education Department of Hunan Province (19A192).

Conflicts of Interest

The authors declare no conflict of interest.

References

  1. Roman, M.; Jitaru, P.; Barbante, C. Selenium biochemistry and its role for human health. Metallomics 2013, 6, 25–54. [Google Scholar] [CrossRef]
  2. Rayman, M.P. The importance of selenium to human health. Lancet 2000, 356, 233–241. [Google Scholar] [CrossRef] [Green Version]
  3. Wrobel, J.K.; Power, R.; Toborek, M. Biological activity of selenium: Revisited. Iubmb Life 2016, 68, 97–105. [Google Scholar] [CrossRef]
  4. Rayman, M.P. Selenium and human health. Lancet 2012, 379, 1256–1268. [Google Scholar] [CrossRef]
  5. Johansson, L.; Gafvelin, G.; Arnér, E.S.J. Selenocysteine in proteinsproperties and biotechnological use. Bioch. Bioph. Acta 2005, 1726, 1–13. [Google Scholar] [CrossRef] [Green Version]
  6. Lu, J.; Holmgren, A. Selenoproteins. J. Biol. Chem. 2008, 284, 723–727. [Google Scholar] [CrossRef] [Green Version]
  7. Papp, L.V.; Jun, L.U.; Holmgren, A.; Khanna, K.K. From selenium to selenoproteins: Synthesis, identity, and their role in human health. Antioxid. Redox Sign. 2007, 9, 775–806. [Google Scholar] [CrossRef]
  8. Seale, L.A. Selenocysteine-lyase: Biochemistry, regulation and physiological role of the selenocysteine decomposition enzyme. Antioxidants 2019, 8, 357. [Google Scholar] [CrossRef] [Green Version]
  9. Zhong, L.W.; Holmgren, A. Essential role of selenium in the catalytic activities of mammalian thioredoxin reductase revealed by characterization of recombinant enzymes with selenocysteine mutations. J. Biol. Chem. 2000, 275, 18121–18128. [Google Scholar] [CrossRef] [Green Version]
  10. Avery, J.C.; Hoffmann, P.R. Selenium, Selenoproteins, and Immunity. Nutrients 2018, 10, 1203. [Google Scholar] [CrossRef] [Green Version]
  11. Hatfield, D.L.; Tsuji, P.A.; Carlson, B.A.; Gladyshev, V.N. Selenium and selenocysteine: Roles in cancer, health, and development. Trends Biochem. Sci. 2014, 39, 112–120. [Google Scholar] [CrossRef] [Green Version]
  12. Li, M.X.; Feng, W.Y.; Zhai, Q.S.; Feng, G.Q. Selenocysteine detection and bioimaging in living cells by a colorimetric and near-infrared fluorescent turn-on probe with a large stokes shift. Biosens. Bioelectron. 2017, 87, 894–900. [Google Scholar] [CrossRef]
  13. Jagtap, R.; Maher, W.; Krikowa, F.; Ellwood, M.J.; Foster, S. Measurement of selenomethionine and selenocysteine in fish tissues using HPLC-ICP-MS. Microchem. J. 2016, 128, 248–257. [Google Scholar] [CrossRef]
  14. Li, H.M.; Luo, Y.C.; Li, Z.X.; Yang, L.M.; Wang, Q.Q. Nanosemiconductor-based photocatalytic vapor generation systems for subsequent selenium determination and speciation with atomic fluorescence spectrometry and inductively coupled plasma mass spectrometry. Anal. Chem. 2012, 84, 2974–2981. [Google Scholar] [CrossRef]
  15. Han, X.Y.; Song, X.Y.; Yu, F.B.; Chen, L.X. A ratiometric near-infrared fluorescent probe for quantification and evaluation of selenocysteine-protective effects in acute inflammation. Adv. Funct. Mater. 2017, 27, 1700769. [Google Scholar] [CrossRef]
  16. Liu, Y.N.; Feng, X.H.; Yu, Y.N.; Zhao, Q.Y.; Tang, C.H.; Zhang, J.M. A review of bioselenol-specific fluorescent probes: Synthesis, properties, and imaging applications. Anal. Chim. Acta 2020, 1110, 141–150. [Google Scholar] [CrossRef]
  17. Zhang, L.; Shi, Y.F.; Sheng, Z.J.; Zhang, Y.R.; Kai, X.N.; Li, M.Y.; Yin, X.X. Bioluminescence imaging of selenocysteine in vivo with a highly sensitive probe. ACS Sensors 2019, 4, 3147–3155. [Google Scholar] [CrossRef]
  18. Chen, H.; Dong, B.L.; Tang, Y.H.; Lin, W.Y. Construction of a near-infrared fluorescent turn-on probe for selenol and its bioimaging application in living animals. Chem. Eur. J. 2015, 21, 11696–11700. [Google Scholar] [CrossRef]
  19. Maeda, H.; Katayama, K.; Matsuno, H.; Uno, T. 3’-(2,4-Dinitirobenzenesulfonyl)-2’,7’-dimethyl-fluorescein as a fluorescent probe for selenols. Angew. Chem. Int. Edit. 2006, 45, 1810–1813. [Google Scholar] [CrossRef]
  20. Zhang, D.L.; Hu, M.M.; Yuan, X.; Wu, Y.X.; Hu, X.X.; Xu, S.; Liu, H.W.; Zhang, X.B.; Liu, Y.L.; Tan, W.H. Engineering self-calibrating nanoprobes with two-photon-activated fluorescence resonance energy transfer for ratiometric imaging of biological selenocysteine. ACS appl. Mater. Inter. 2019, 11, 17722–17729. [Google Scholar] [CrossRef] [PubMed]
  21. Zhang, B.X.; Ge, C.P.; Yao, J.; Liu, Y.P.; Xie, C.H.; Fang, J.G. Selective selenol fluorescent probes: Design, synthesis, structural determinants, and biological applications. J. Am. Chem. Soc. 2015, 137, 757–769. [Google Scholar] [CrossRef]
  22. Zhao, X.J.; Yuan, G.Q.; Ding, H.Y.; Zhou, L.Y.; Lin, Q.L. A TP-FRET-based fluorescent sensor for ratiometric visualization of selenocysteine derivatives in living cells, tissues and zebrafish. J. Hazard. Mater. 2020, 381, 120918. [Google Scholar] [CrossRef]
  23. Kong, F.P.; Hu, B.; Gao, Y.; Xu, K.H.; Pan, X.H.; Huang, F.; Zheng, Q.L.; Chen, H.; Tang, B. Fluorescence imaging of selenol in HepG2 cell apoptosis induced by Na2SeO3. Chem. Commun. 2015, 51, 3102–3105. [Google Scholar] [CrossRef]
  24. Zhang, P.P.; Ding, Y.; Liu, W.M.; Niu, G.L.; Zhang, H.Y.; Ge, J.C.; Wu, J.S.; Li, Y.Q.; Wang, P.F. Red emissive fluorescent probe for the rapid detection of selenocysteine. Sens. Actuators B Chem. 2018, 264, 234–239. [Google Scholar] [CrossRef]
  25. Dai, C.G.; Wang, J.L.; Song, Q.H. Red fluorescent probes based on a bodipy analogue for selective and sensitive detection of selenols in solutions and in living systems. J. Mater. Chem. B 2016, 4, 6726–6733. [Google Scholar] [CrossRef]
  26. Luo, X.Z.; Wang, R.; Lv, C.Z.; Chen, G.; You, J.M.; Yu, F.B. Detection of selenocysteine with a ratiometric near-infrared fluorescent probe in cells and in mice thyroid diseases model. Anal. Chem. 2020, 92, 1589–1597. [Google Scholar] [CrossRef]
  27. Zhao, X.J.; Li, Y.T.; Jiang, Y.R.; Yang, B.Q.; Liu, C.; Liu, Z.H. A novel “turn-on” mitochondria-targeting near-infrared fluorescent probe for H2S detection and in living cells imaging. Talanta 2019, 197, 326–333. [Google Scholar] [CrossRef]
  28. Zhao, X.J.; Jiang, Y.R.; Li, Y.T.; Yang, B.Q.; Liu, C.; Liu, Z.H. A novel “turn-on” mitochondria-targeting near-infrared fluorescent probe for determination and bioimaging cellular hydrogen sulfide. Spectroch. Acta A 2019, 212, 71–77. [Google Scholar] [CrossRef]
  29. Zhang, H.Y.; Li, M.X.; Feng, W.Y.; Feng, G.Q. Rapid and selective detection of selenocysteine with a known readily available colorimetric and fluorescent turn-on probe. Dyes Pigment. 2018, 149, 475–480. [Google Scholar] [CrossRef]
  30. Zhao, X.J.; Wang, C.; Yuan, G.Q.; Ding, H.Y.; Zhou, L.Y.; Liu, X.G.; Lin, Q.L. A dual-site modulated FRET-based two-photon ratiometric fluorescent probe for tracking lysosomal pH changes in living cells, tissues and zebrafish. Sens. Actuators B Chem. 2019, 290, 79–86. [Google Scholar] [CrossRef]
  31. Sun, Q.; Yang, S.H.; Wu, L.; Dong, Q.J.; Yang, W.C.; Yang, G.F. Detection of intracellular selenol-containing molecules using a fluorescent probe with near-zero background signal. Anal. Chem. 2016, 88, 6084–6091. [Google Scholar] [CrossRef]
Scheme 1. The detection process of YZ-A4 toward selenocysteine (Sec).
Sensors 20 04768 sch001
Scheme 2. Synthesis of YZ-A4.
Sensors 20 04768 sch002
Figure 1. Absorption spectra of 10 μM YZ-A3 (black) and YZ-A4 (green), and treating YZ-A4 with 10 μM Sec (yellow) in PBS (10 mM, pH 7.40, containing 1% DMSO as cosolvent). Fluorescence spectra of 10 μM YZ-A3 (red), and YZ-A4 before (pink) and after (blue) reaction with 10 μM Sec in PBS (10 mM, pH 7.40, containing 1% DMSO as cosolvent), excited at 550 nm.
Sensors 20 04768 g001
Figure 2. Time-dependent fluorescent intensity of 10 µM YZ-A4 at 614 nm in the absence (black) and presence of 100 μM Sec (red), and presence of 100 μM Cys (blue) in PBS (10 mM, pH 7.40, containing 1% DMSO as cosolvent), excited at 550 nm.
Sensors 20 04768 g002
Figure 3. Fluorescent intensity of 10 μM YZ-A3 (red), and YZ-A4 before (black) and after (blue) reaction with 10 μM Sec in different PBS (pH 4–10, 10 mM, containing 1% DMSO as cosolvent). Excitation at 550 nm and emission at 614 nm.
Sensors 20 04768 g003
Figure 4. Fluorescence responses of 10 µM YZ-A4 to different Sec concentrations (0, 1, 2, 4, 8, 12, 16, 20, 24, 28, 32, 40, 50, 75, 100 µM) in PBS (10 mM, pH 7.40, containing 1% DMSO as cosolvent). The inset displays the linear relationship of the fluorescent intensity at 614 nm, excited at 550 nm.
Sensors 20 04768 g004
Figure 5. Fluorescent intensity responses of 10 μM YZ-A4 at 614 nm to biological analytes (100 μM) in PBS (10 mM, pH 7.40, containing 1% DMSO as cosolvent). Legend: (1) Blank; (2) Sec; (3) Cys; (4) Hcy; (5) GSH; (6) Glu; (7) Asp; (8) Val; (9) Phe; (10) Pro; (11) Thr; (12) Arg; (13) Lso; (14) Leu; (15) His; (16) Lys; (17) Try; (18) Ser; (19) Na2Se; (20) Na2SeO3. Excitation at 550 nm. Each piece of data was obtained 3 min after mixing.
Sensors 20 04768 g005
Figure 6. Fluorescence images of living A549 cells. The fluorescence was measured at a red channel. (A) 10 μM YZ-A4 for 6 h, (B) 10 μM (Sec)2 for 6 h + 10 μM YZ-A4 for 15 min, (C) 10 μM (Sec)2 for 6 h + 10 μM YZ-A4 for 30 min. The scale bar is 10 μm. Red channel, excitation from 540 to 565 nm and emission from 605 to 655 nm.
Sensors 20 04768 g006

