WiGId: Indoor Group Identification with CSI-Based Random Forest


Abstract
1. Introduction
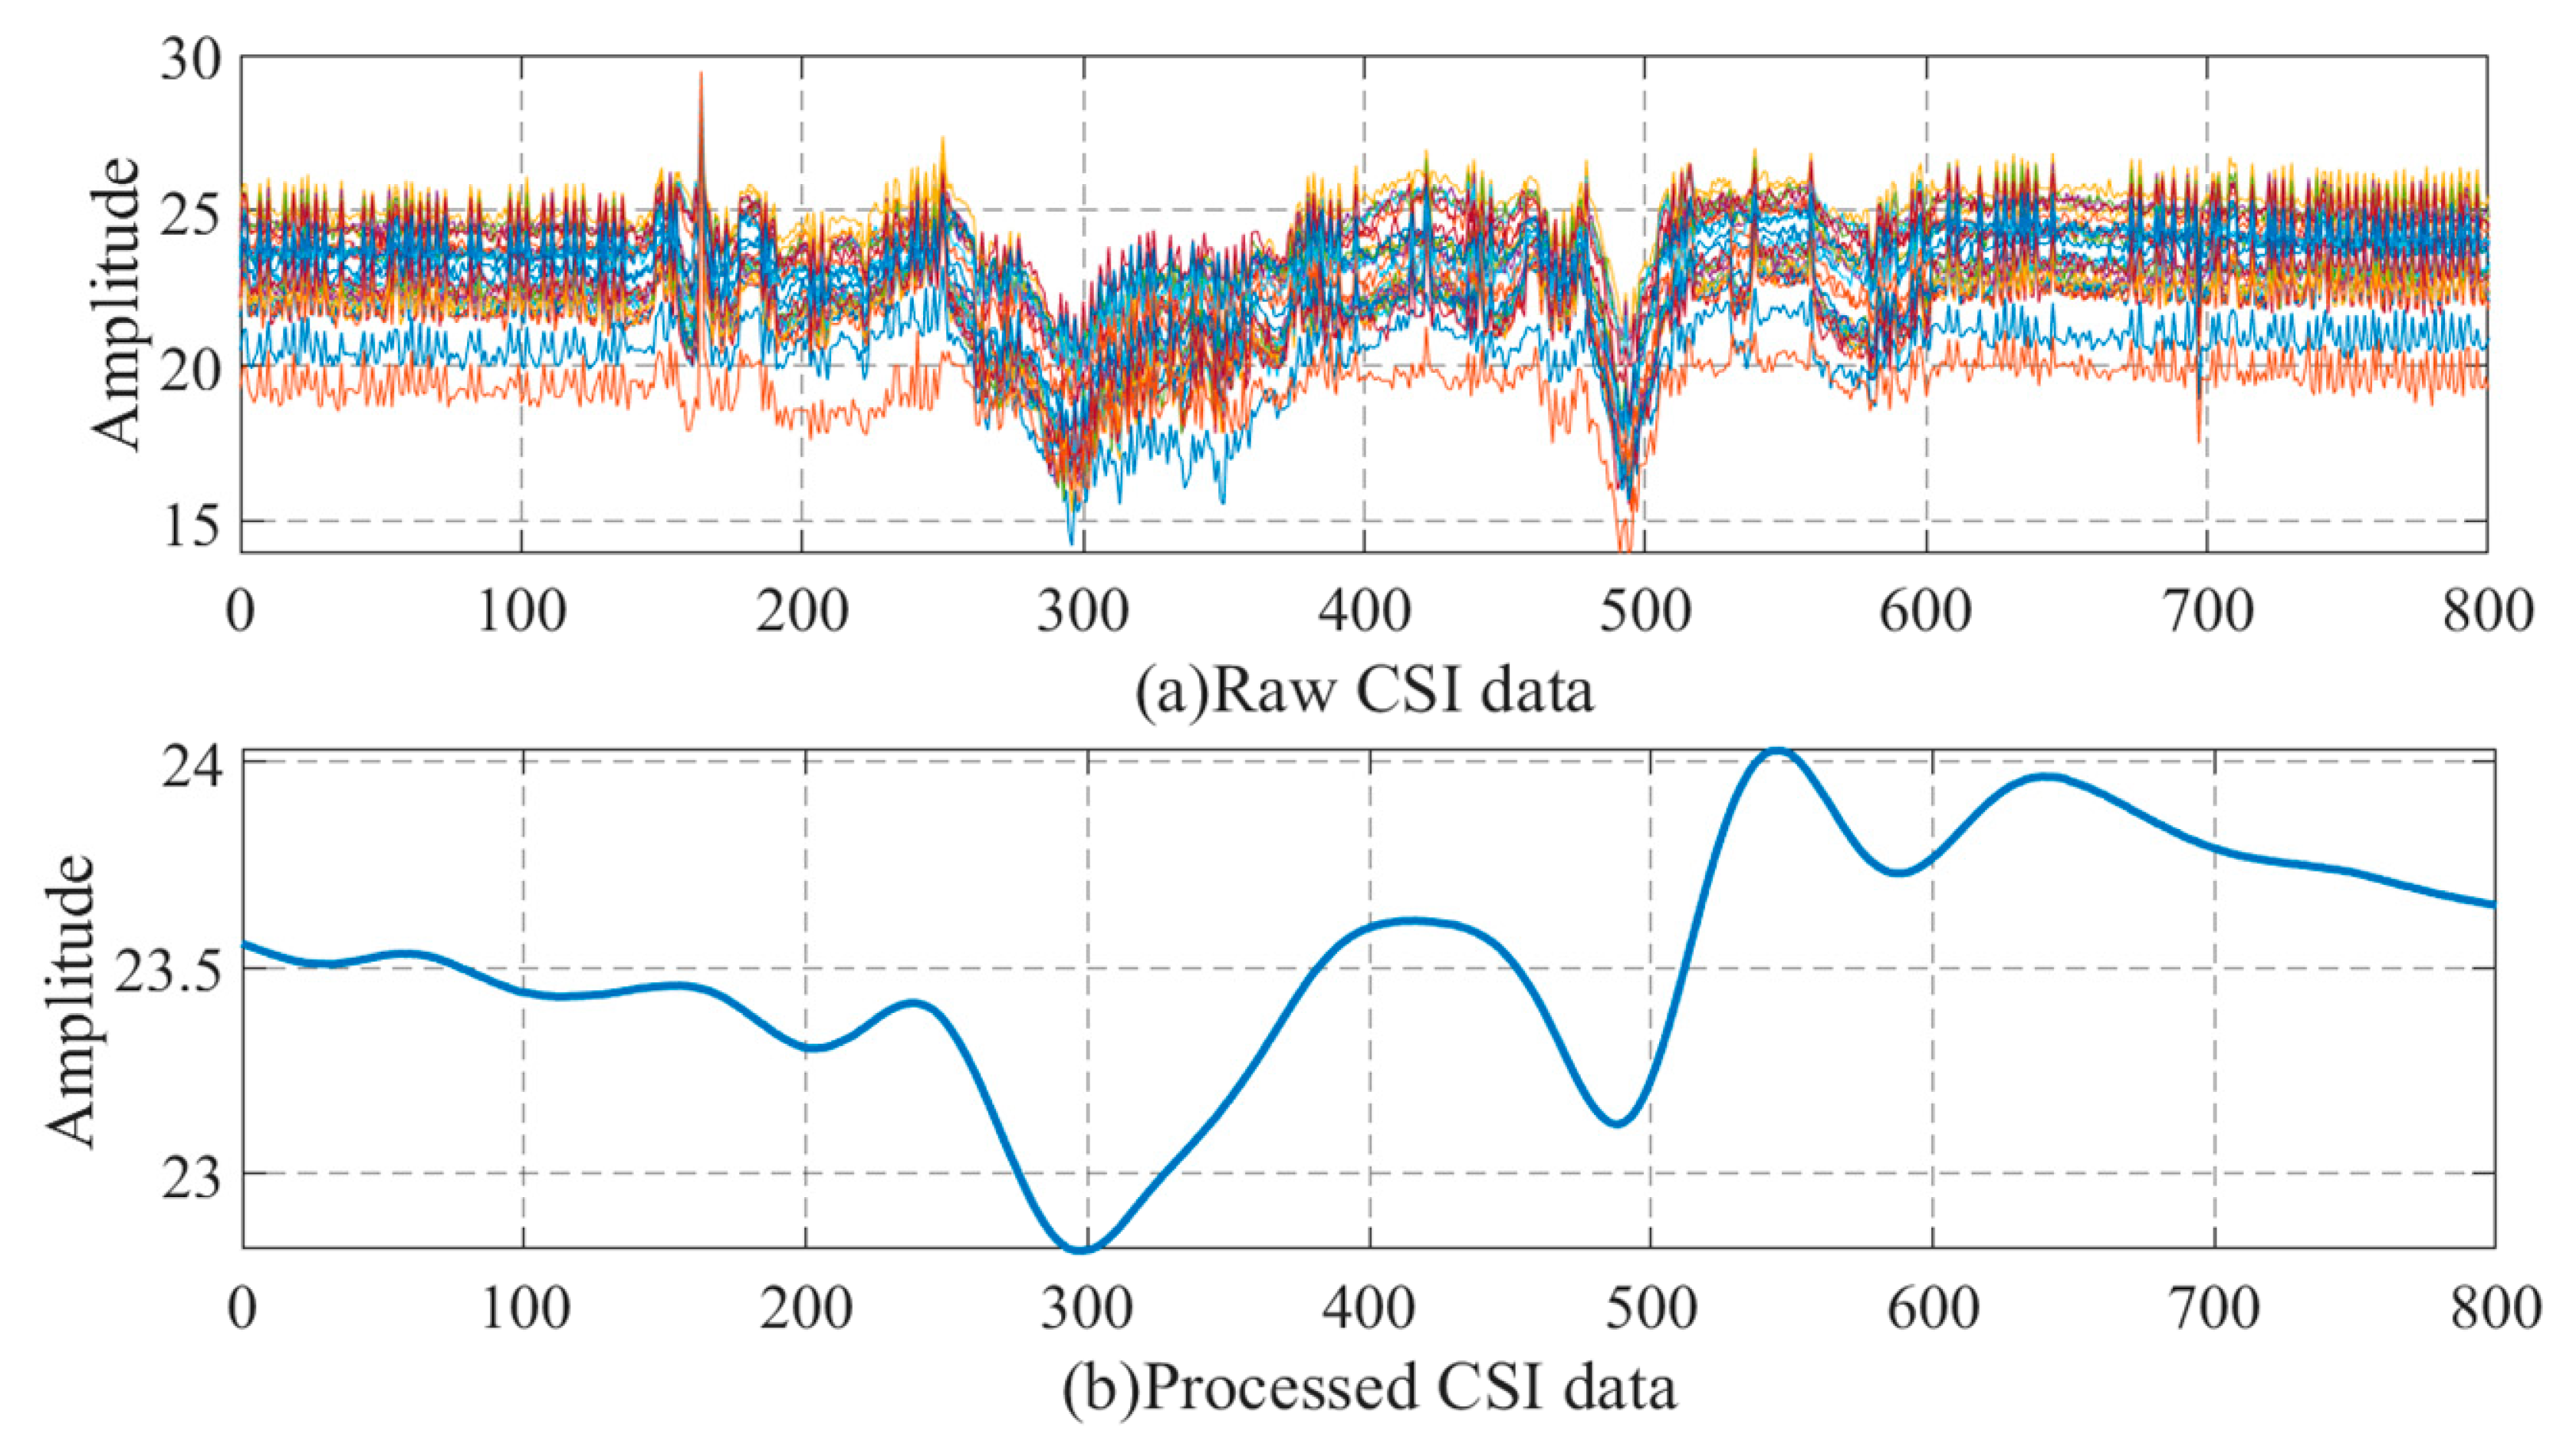
- In the data preprocessing stage, this paper used a combination of PCA filtering and low-pass filtering, which can effectively remove the noise of CSI data and retain effective features. Subsequent experiments also showed that this method is effective.
- Using the random forest as a classifier, in the experimental environment of this paper, it is verified that the method based on random forest fingerprint has certain accuracy in identity recognition and compared with other algorithms.
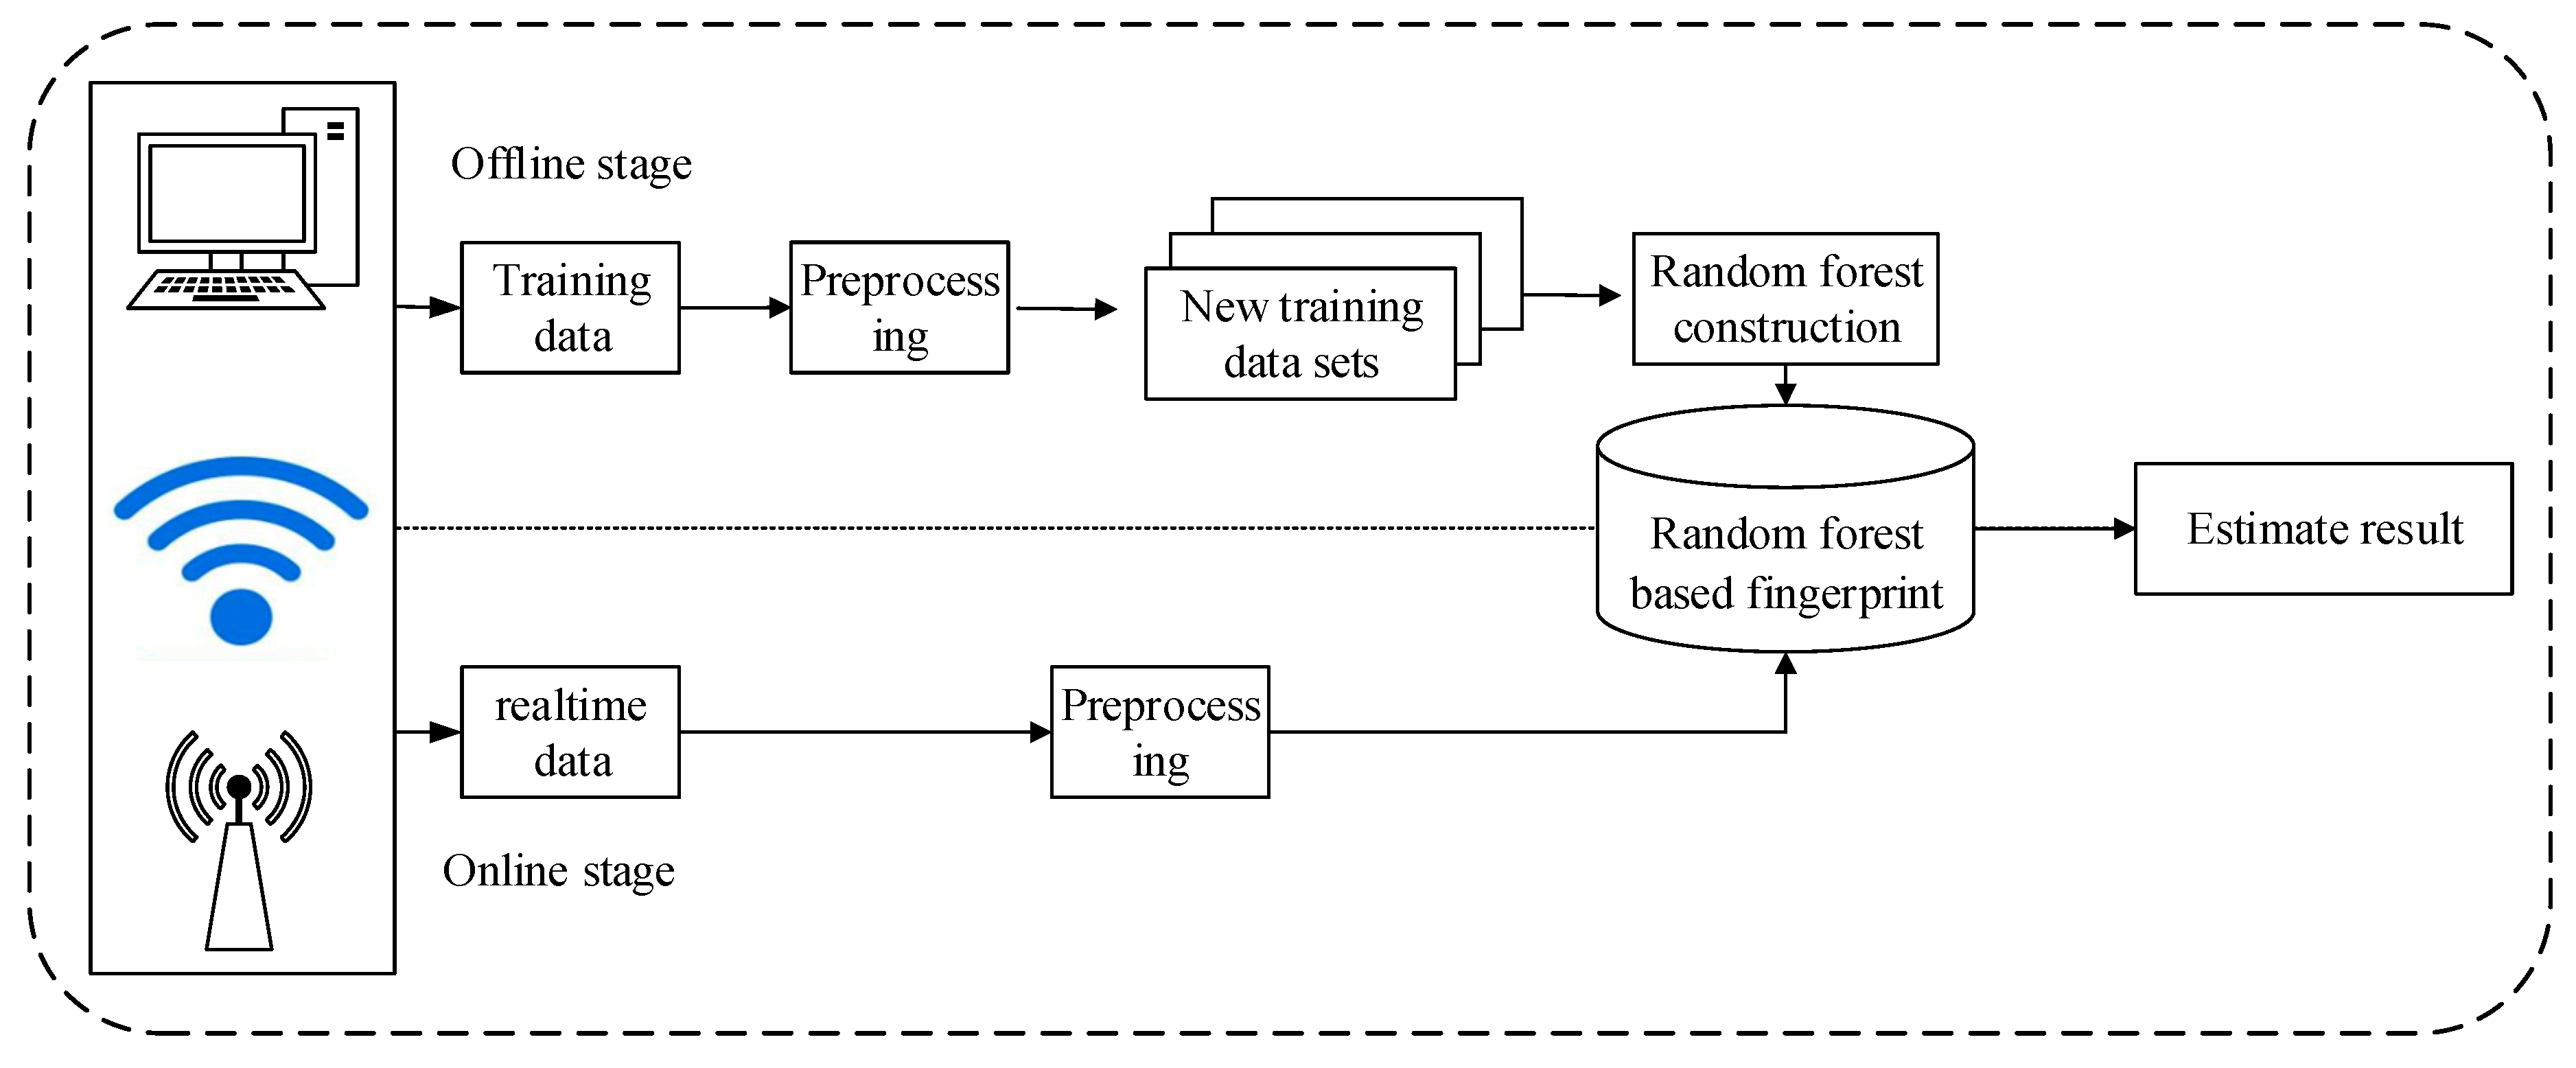
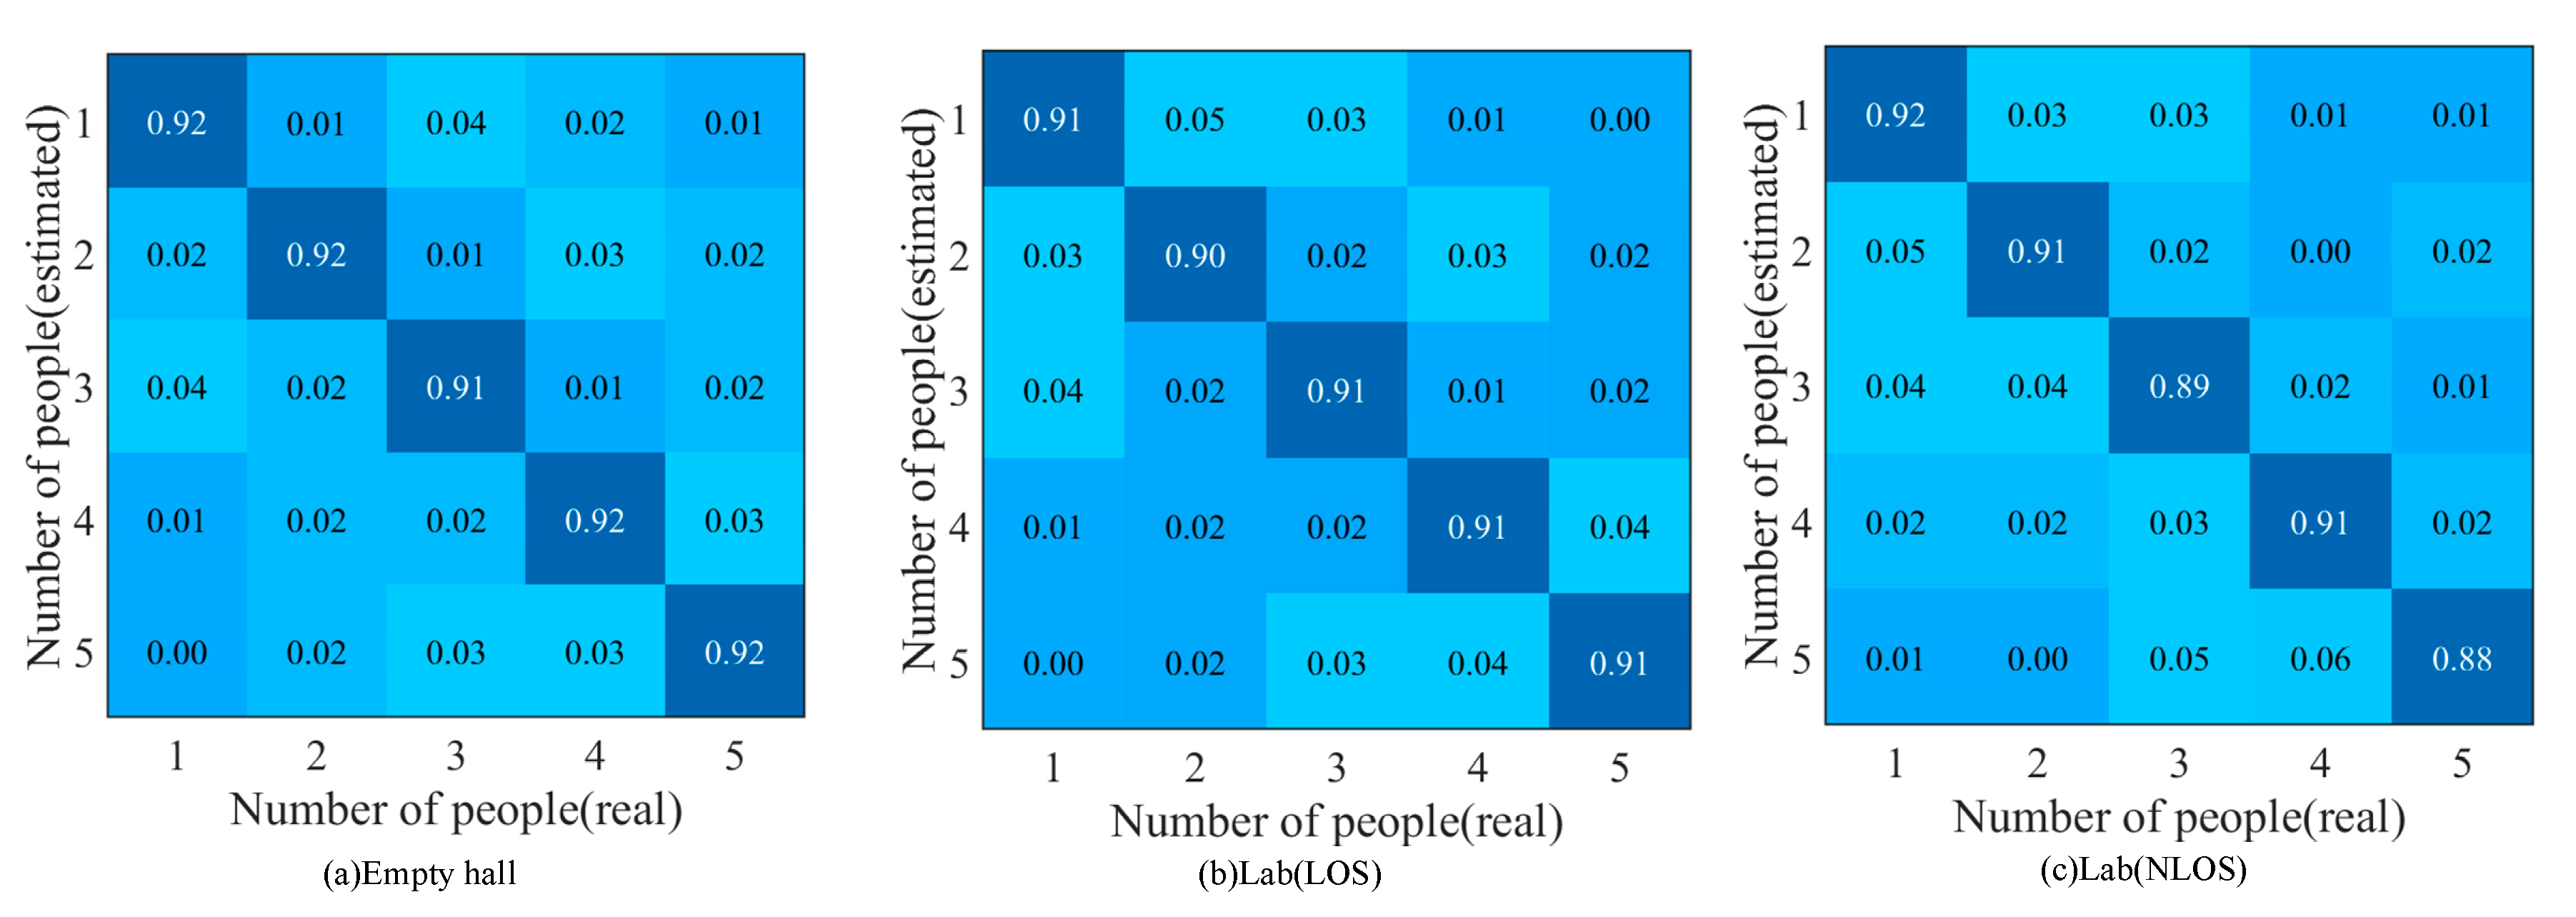
- The performance of the proposed method is verified in three different environments, and the setting of the experimental environment takes into account the complexity of the multipath effect (the multipath effect in the laboratory is more complex than that in the open hall). The effects of LOS and NLOS environments on the performance of the method are also considered. The rest of the paper is organized as follows: Section 2 describes the preliminary. Section 3 describes in detail how to design the system. Section 4 introduces the experimental environment and analyzes the performance of this method through experiments and compares it with other methods. Finally, we have concluded the work in Section 5.
2. Preliminary
2.1. CSI Data Analysis
2.2. Data Preprocessing
3. WiGId Method
3.1. Decision Tree
| Algorithm 1. Training Decision Tree |
| Input: dataset |
| Output: the decision tree |
| 1. Initialize an empty tree |
| 2. Generate processed training dataset |
| 3. repeat |
| 4. For each attribute |
| 5. Compute the gain_ratio of |
| 6. End |
| 7. choose the best split attribute based above computed criteria |
| 8. create a decision node and attach this node to the corresponding branch of the tree T |
| 9. partition the dataset to subdatasets based on |
| 10. for each subdatasets |
| 11. Repeat same operation from 3 to 12. |
| 12. End |
| 13. until is pure or size of less than minimum or the algorithm reaches enough iterations |
| 14. return . |
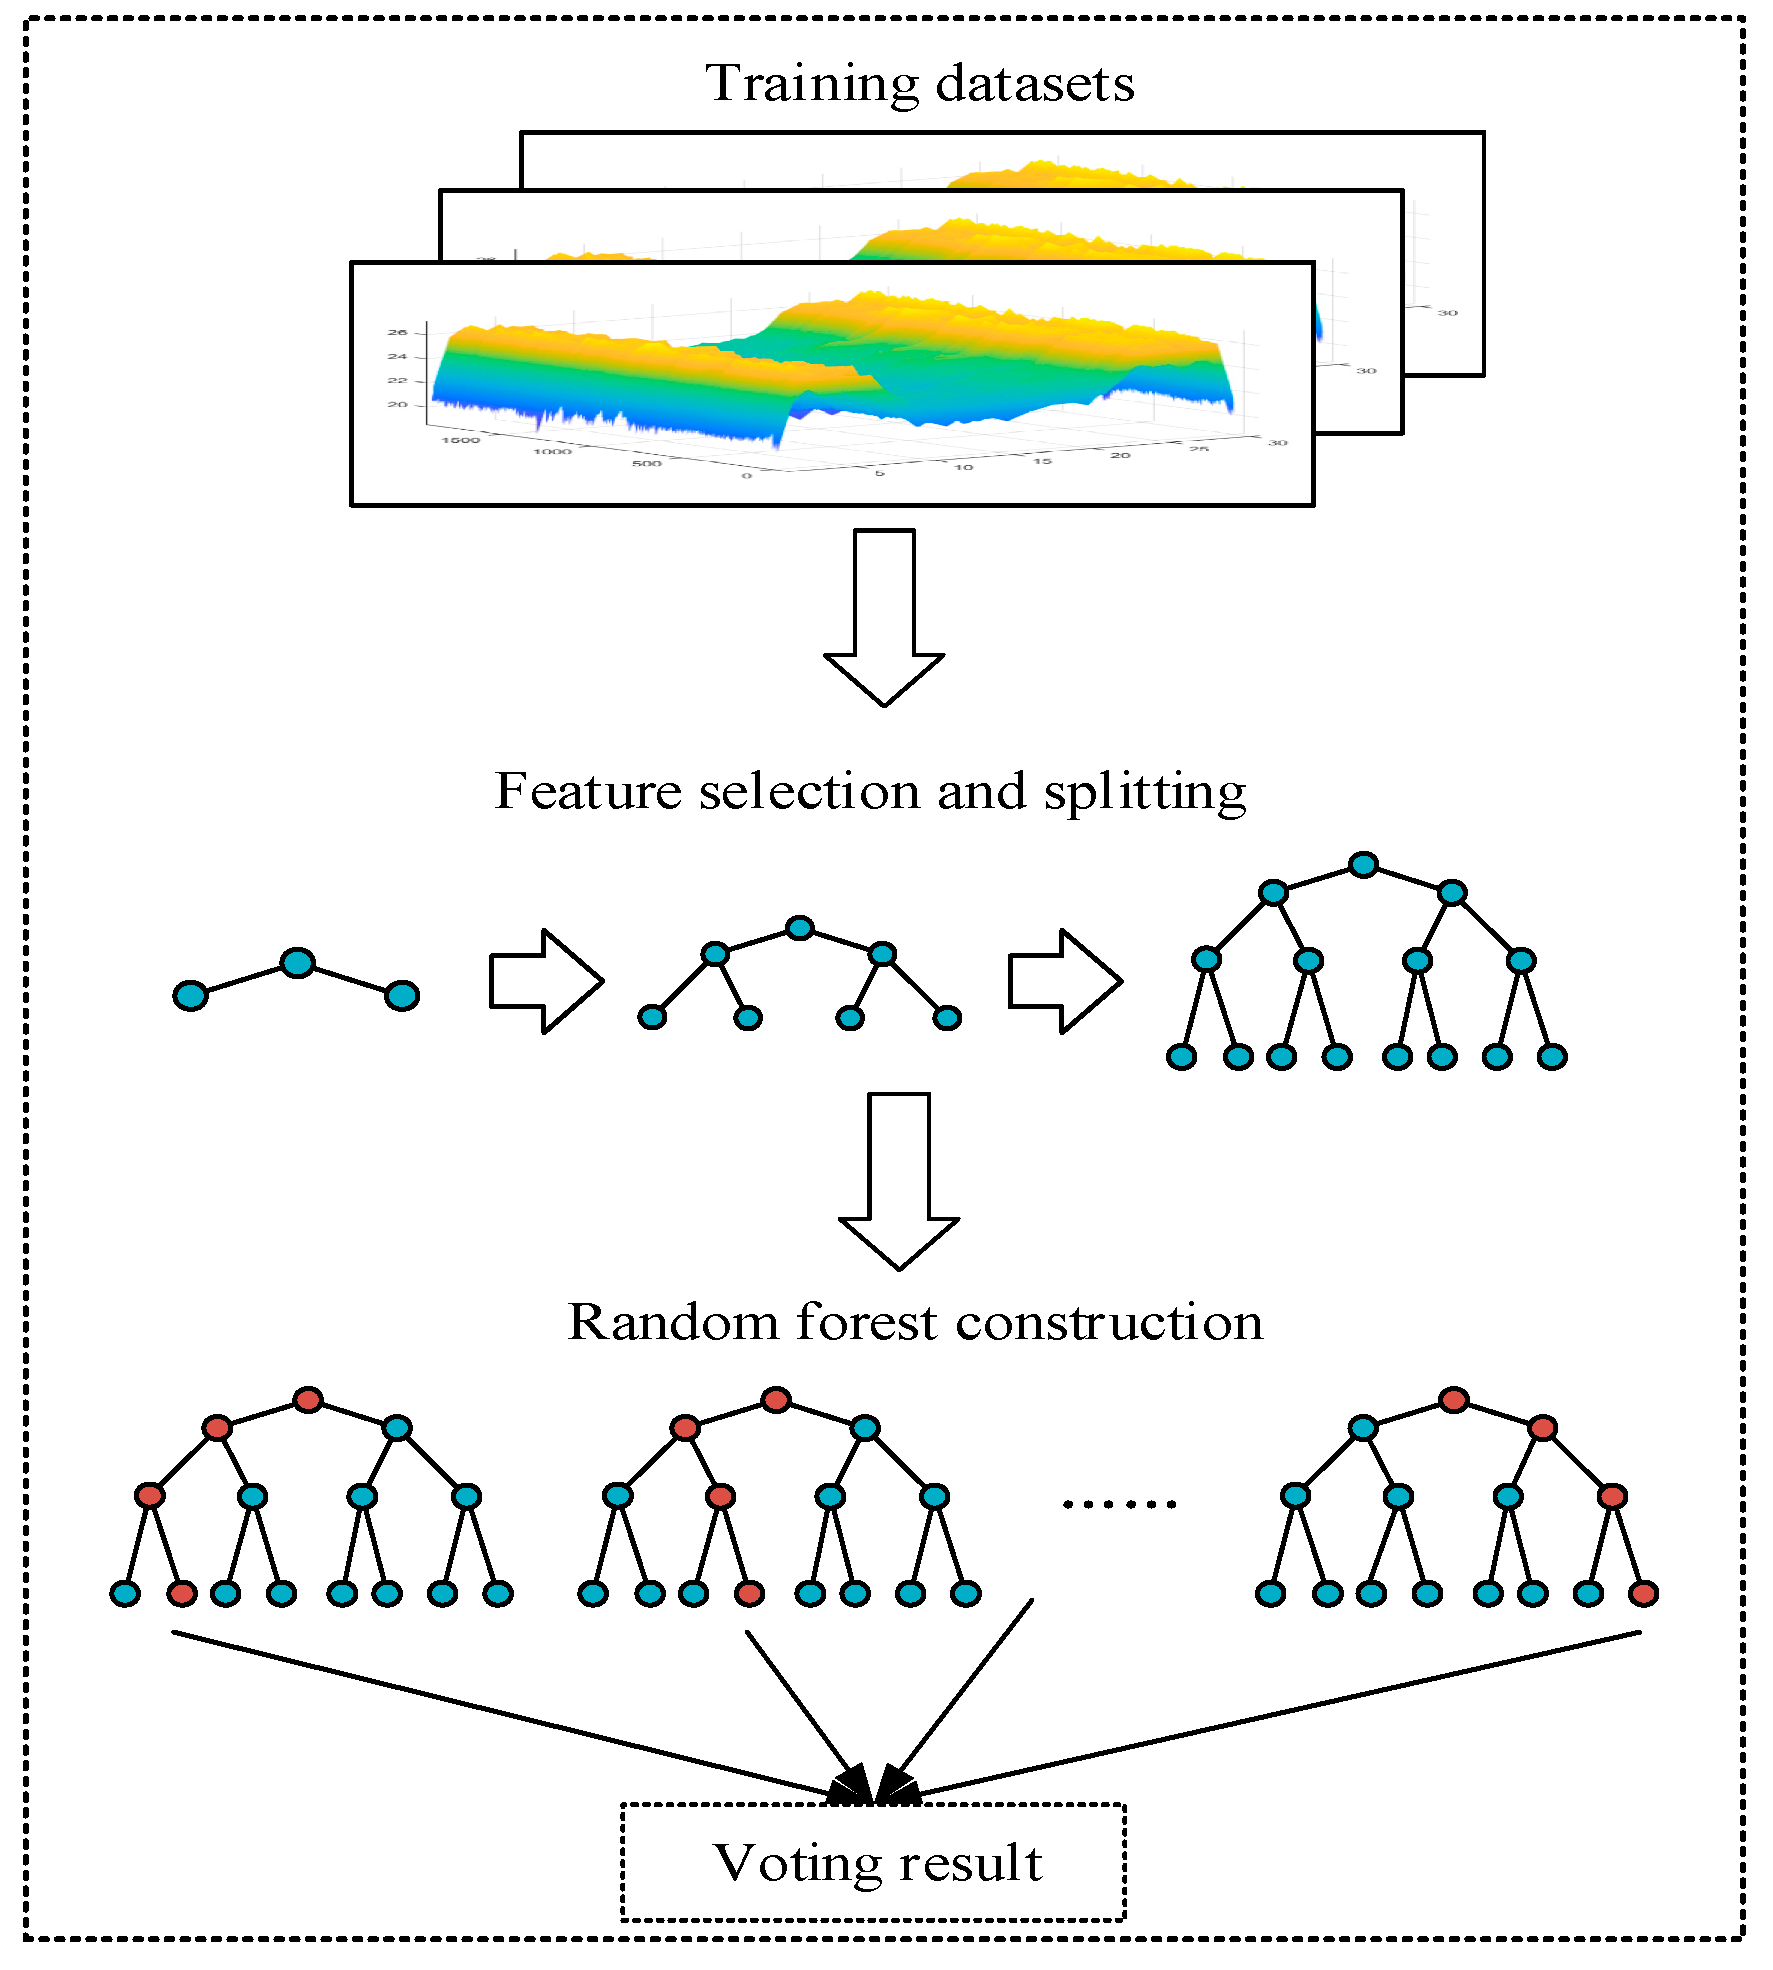
3.2. Random Forest
| Algorithm 2. Construction of Random Forest |
| Input: Originally collected CSI data packet, each data packet containsdata for test cases |
| Input: the size of the forest: s |
| Output: random forest: F |
| 1. generate training dataset by Wavelet transform |
| 2. for = 1 to s do |
| 3. Generate new training dataset by bootstrap aggregating |
| 4. set |
| 5. randomly select m attributes from |
| 6. use train the based Algorithm1 |
| 7. end |
| 8. combine the s Decision Trees on the basic thought of voting method. |
| 9. return |
3.3. The Framework of WiGId
4. Experiment and Analysis
4.1. Experimental Environment
4.2. Accuracy Standard
4.3. Performance Analysis of the Method
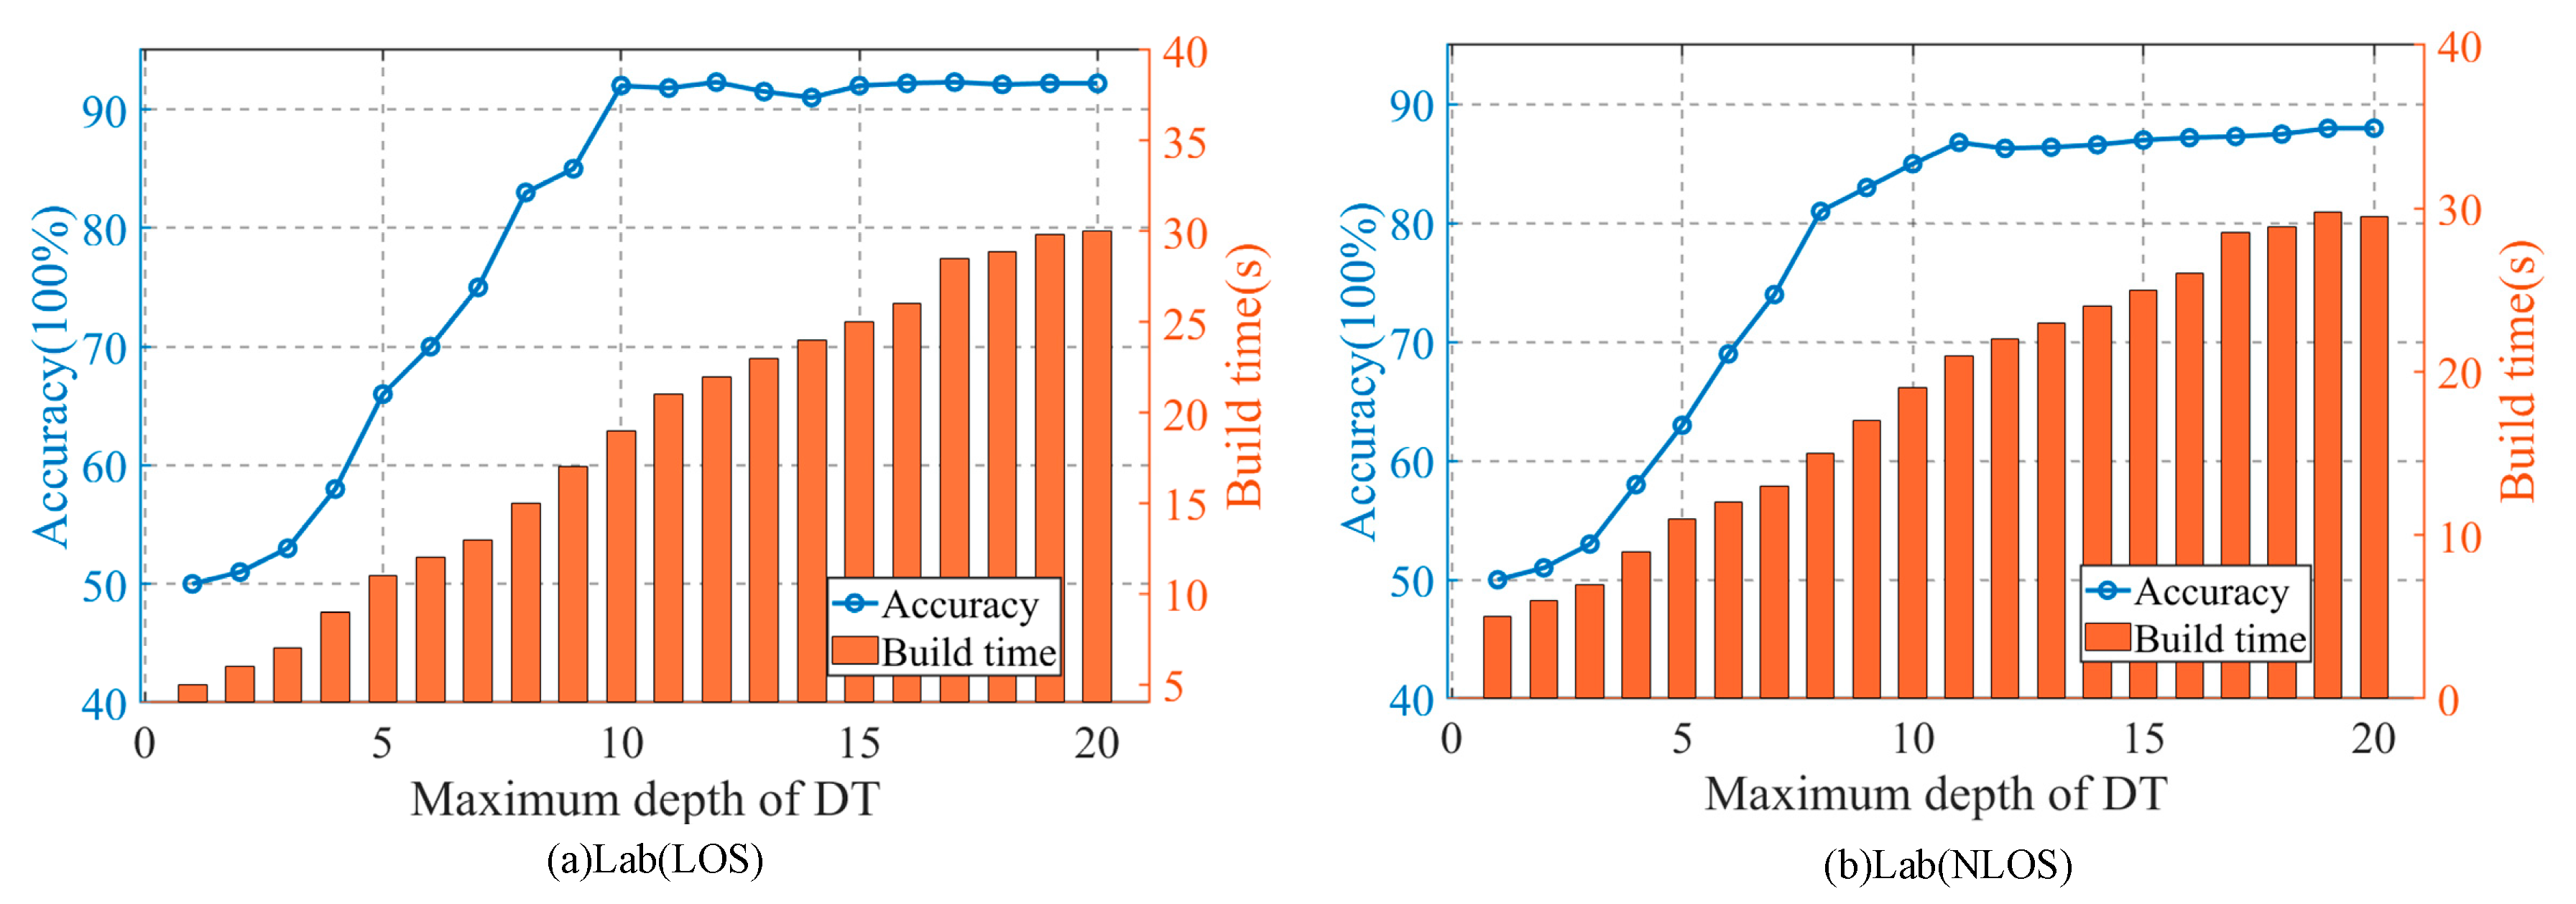
4.4. The Impact of the Depth of Decision Tree on the Accuracy of the Method
4.5. The Impact of the Random Forest Size on the Accuracy of the Method
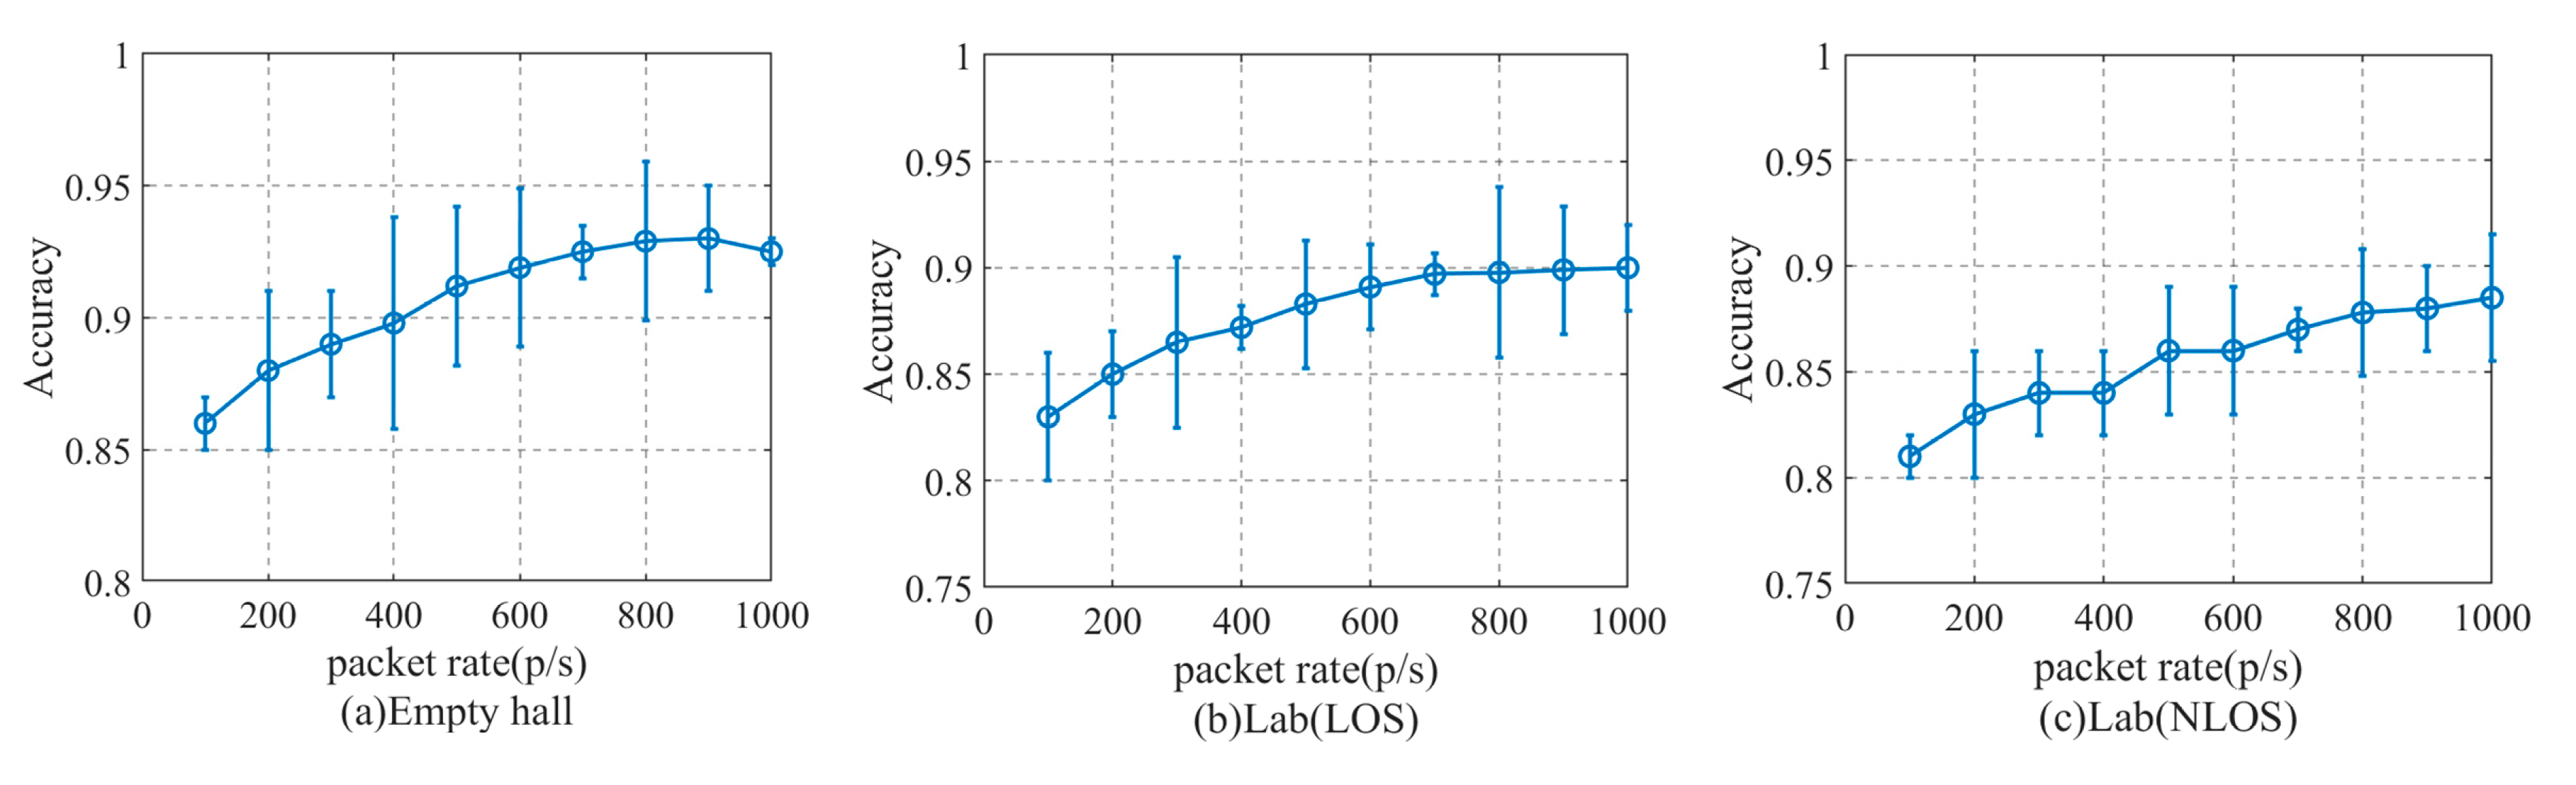
4.6. The Impact of Equipment Height and Packet Sending Rate on the Performance of Method Recognition
4.7. The Impact of the Number of People on the Performance of Method Recognition
5. Conclusions
Author Contributions
Funding
Conflicts of Interest
References
- Yang, Z.; Zhou, Z.; Liu, Y. From RSSI to CSI: Indoor Localization via Channel Response. ACM Comput. Surv. 2013, 46, 1–32. [Google Scholar] [CrossRef]
- Zhang, J.; Wei, B.; Hu, W.; Kanhere, S.S. Wifi-id: Human identification using wifi signal. In Proceedings of the 2016 International Conference on Distributed Computing in Sensor Systems (DCOSS), Washington, DC, USA, 26–28 May 2016; pp. 75–82. [Google Scholar]
- Zeng, Y.; Pathak, P.H.; Mohapatra, P. WiWho: Wifi-based person identification in smart spaces. In Proceedings of the 2016 15th ACM/IEEE International Conference on Information Processing in Sensor Networks (IPSN), Vienna, Austria, 11–14 April 2016; pp. 1–12. [Google Scholar]
- Wang, W.; Liu, A.X.; Shahzad, M. Gait recognition using wifi signals. In Proceedings of the 2016 ACM International Joint Conference on Pervasive and Ubiquitous Computing, Heidelberg Germany, 12–16 September 2016; pp. 363–373. [Google Scholar]
- Hong, F.; Wang, X.; Yang, Y.; Zong, Y.; Zhang, Y.; Guo, Z. WFID: Passive device-free human identification using WiFi signal. In Proceedings of the 13th International Conference on Mobile and Ubiquitous Systems: Computing, Networking and Services, Hiroshima, Japan, 28 November–1 December 2016; pp. 47–56. [Google Scholar]
- Zou, H.; Zhou, Y.; Yang, J.; Gu, W.; Xie, L.; Spanos, C.J. Wifi-based human identification via convex tensor shapelet learning. In Proceedings of the Thirty-Second AAAI Conference on Artificial Intelligence, New Orleans, LA, USA, 2–7 February 2018. [Google Scholar]
- Lv, J.; Yang, W.; Man, D. Device-free passive identity identification via WiFi signals. Sensors 2017, 17, 2520. [Google Scholar] [CrossRef]
- Shahzad, M.; Zhang, S. Augmenting user identification with WiFi based gesture recognition. Proc. ACM Interact. Mob. Wearable Ubiquitous Technol. 2018, 2, 1–27. [Google Scholar] [CrossRef]
- Pokkunuru, A.; Jakkala, K.; Bhuyan, A.; Wang, P.; Sun, Z. NeuralWave: Gait-based user identification through commodity WiFi and deep learning. In Proceedings of the IECON 2018-44th Annual Conference of the IEEE Industrial Electronics Society, Washington, DC, USA, 21–23 October 2018; pp. 758–765. [Google Scholar]
- Nipu, M.N.A.; Talukder, S.; Islam, M.S.; Chakrabarty, A. Human identification using wifi signal. In Proceedings of the 2018 Joint 7th International Conference on Informatics, Electronics & Vision (ICIEV) and 2018 2nd International Conference on Imaging, Vision & Pattern Recognition (icIVPR), Kitakyushu, Japan, 25–29 June 2018; pp. 300–304. [Google Scholar]
- Wang, Y.; Wu, K.; Ni, L.M. Wifall: Device-free fall detection by wireless networks. IEEE Trans. Mob. Comput. 2016, 16, 281–594. [Google Scholar] [CrossRef]
- Zhang, D.; Wang, H.; Wang, Y.; Ma, J. Anti-fall: A non-intrusive and real-time fall detector leveraging CSI from commodity WiFi devices. In Proceedings of the International Conference on Smart Homes and Health Telematics, Geneva, Switzerland, 10–12 June 2015; pp. 181–193. [Google Scholar]
- Wang, H.; Zhang, D.; Ma, J.; Wang, Y.; Wang, Y.; Wu, D.; Gu, T.; Xie, B. Human respiration detection with commodity wifi devices: Do user location and body orientation matter? In Proceedings of the 2016 ACM International Joint Conference on Pervasive and Ubiquitous Computing, Heidelberg Germany, 12–16 September 2016; pp. 25–36. [Google Scholar]
- Dang, X.; Huang, Y.; Hao, Z.; Si, X. PCA-Kalman: Device-free indoor human behavior detection with commodity Wi-Fi. EURASIP J. Wirel. Commun. Netw. 2018, 2018, 214. [Google Scholar] [CrossRef]
- Kim, S.C. Device-free activity recognition using CSI & big data analysis: A survey. In Proceedings of the 2017 Ninth International Conference on Ubiquitous and Future Networks (ICUFN), Milan, Italy, 4–7 July 2017; pp. 539–541. [Google Scholar]
- Xin, T.; Guo, B.; Wang, Z.; Wang, P.; Lam, J.C.K.; Li, V.; Yu, Z. Freesense: A robust approach for indoor human detection using wi-fi signals. Proc. ACM Interact. Mob. Wearable Ubiquitous Technol. 2018, 2, 143. [Google Scholar] [CrossRef]
- Li, J.; Tu, P.; Wang, H.; Wang, K.; Yu, L. A Novel Device-Free Counting Method Based on Channel Status Information. Sensors 2018, 18, 3981. [Google Scholar] [CrossRef] [PubMed]
- Li, X.; Zhang, D.; Xiong, J.; Zhang, Y.; Li, S.; Wang, Y.; Mei, H. Training-Free Human Vitality Monitoring Using Commodity Wi-Fi Devices. Proc. ACM Interact. Mob. Wearable Ubiquitous Technol. 2018, 2, 121. [Google Scholar] [CrossRef]
- Guo, L.; Wang, L.; Liu, J.; Zhou, W. A survey on motion detection using WiFi signals. In Proceedings of the 2016 12th International Conference on Mobile Ad-Hoc and Sensor Networks (MSN), Hefei, China, 16–18 December 2016; pp. 202–206. [Google Scholar]
- Liu, Z.; Wang, L.; Liu, W.; Li, B. Human Movement Detection and Gait Periodicity Analysis Using Channel State Information. In Proceedings of the 2016 12th International Conference on Mobile Ad-Hoc and Sensor Networks (MSN), Hefei, China, 16–18 December 2016; pp. 167–174. [Google Scholar]
- Zhu, D.; Pang, N.; Li, G.; Liu, S. Wisefi: Activity localization and recognition on commodity off-the-shelf wifi devices. In Proceedings of the 2016 IEEE 18th International Conference on High Performance Computing and Communications; IEEE 14th International Conference on Smart City; IEEE 2nd International conference on Data Science and Systems (HPCC/SmartCity/DSS), Sydney, Australia, 12–14 December 2016; pp. 562–569. [Google Scholar]
- Wu, C.; Yang, Z.; Zhou, Z.; Liu, X.; Liu, Y.; Cao, J. Non-invasive detection of moving and stationary human with wifi. IEEE J. Sel. Areas Commun. 2015, 33, 2329–2342. [Google Scholar] [CrossRef]
- Wang, W.; Liu, A.X.; Shahzad, M.; Ling, K.; Lu, S. Understanding and modeling of wifi signal based human activity recognition. In Proceedings of the 21st annual international conference on mobile computing and networking, Paris, France, 7–11 September 2015; pp. 65–76. [Google Scholar]
- Xi, W.; Huang, D.; Zhao, K.; Yan, Y.; Cai, Y.; Ma, R.; Chen, D. Device-free human activity recognition using CSI. In Proceedings of the 1st Workshop on Context Sensing and Activity Recognition, Seoul, Korea, 1–4 November 2015; pp. 31–36. [Google Scholar]
- Wu, D.; Zhang, D.; Xu, C.; Wang, H.; Li, X. Device-free WiFi human sensing: From pattern-based to model-based approaches. IEEE Commun. Mag. 2017, 55, 91–97. [Google Scholar] [CrossRef]
- Cao, H.; Nguyen, M.N.; Phua, C.; Krishnaswamy, S.; Li, X. An integrated framework for human activity classification. In Proceedings of the 14th International Conference on Ubiquitous Computing (UbiComp 2012), Pittsburgh, PA, USA, 5–8 September 2012; pp. 331–340. [Google Scholar]
- Jiang, W.; Miao, C.; Ma, F.; Yao, S.; Wang, Y.; Yuan, Y.; Xue, H.; Song, C.; Ma, X.; Koutsonikolas, D.; et al. Towards environment independent device free human activity recognition. In Proceedings of the 24th Annual International Conference on Mobile Computing and Networking, New Delhi, India, 29 October–2 November 2018; pp. 289–304. [Google Scholar]
- Jo, H.J.; Kim, S. Indoor smartphone localization based on LOS and NLOS identification. Sensors 2018, 18, 3987. [Google Scholar] [CrossRef] [PubMed]
- Hoang, M.T.; Yuen, B.; Dong, X.; Lu, T.; Westendorp, R.; Reddy, K. Recurrent Neural Networks for Accurate RSSI Indoor Localization. IEEE Internet Things J. 2019, 6, 10639–10651. [Google Scholar] [CrossRef]
- Di Domenico, S.; De Sanctis, M.; Cianca, E.; Giuliano, F.; Bianchi, G. Exploring training options for RF sensing using CSI. IEEE Commun. Mag. 2018, 56, 116–123. [Google Scholar] [CrossRef]
- Abbas, M.; Elhamshary, M.; Rizk, H.; Torki, M.; Youssef, M. WiDeep: WiFi-based accurate and robust indoor localization system using deep learning. In Proceedings of the 2019 IEEE International Conference on Pervasive Computing and Communications (PerCom), Kyoto, Japan, 11–15 March 2019; pp. 1–10. [Google Scholar]
- Adege, A.B.; Lin, H.P.; Tarekegn, G.B.; Munaye, Y.Y.; Yen, L. An Indoor and Outdoor Positioning Using a Hybrid of Support Vector Machine and Deep Neural Network Algorithms. J. Sens. 2018, 2018, 1–12. [Google Scholar] [CrossRef]
- De Sanctis, M.; Cianca, E.; Di Domenico, S.; Provenziani, D.; Bianchi, G.; Ruggieri, M. Wibecam: Device free human activity recognition through wifi beacon-enabled camera. In Proceedings of the 2nd workshop on Workshop on Physical Analytics, Florence, Italy, 19–22 May 2015; pp. 7–12. [Google Scholar]


| Different Experimental Scenarios and Methods | Accuracy of the Method (%) | |||||
|---|---|---|---|---|---|---|
| One-Person | Two-Person | Three-Person | Four-Person | Five-Person | ||
| Empty hall | SVM (RBF) | 80.25 | 81.92 | 83.78 | 82.25 | 80.96 |
| WFID | 85.20 | 83.69 | 84.32 | 81.36 | 80.12 | |
| WiGId | 92.05 | 92.08 | 91.03 | 91.95 | 92.36 | |
| Lab (LOS) | SVM (RBF) | 78.95 | 79.65 | 76.33 | 78.02 | 76.94 |
| WFID | 80.16 | 84.01 | 82.21 | 85.69 | 84.78 | |
| WiGId | 91.96 | 89.94 | 89.61 | 90.76 | 91.15 | |
| Lab (NLOS) | SVM (RBF) | 75.32 | 72.36 | 70.66 | 73.65 | 71.32 |
| WFID | 80.08 | 78.17 | 78.33 | 75.25 | 72.56 | |
| WiGId | 91.63 | 89.60 | 89.33 | 89.57 | 88.21 | |
© 2020 by the authors. Licensee MDPI, Basel, Switzerland. This article is an open access article distributed under the terms and conditions of the Creative Commons Attribution (CC BY) license (http://creativecommons.org/licenses/by/4.0/).
Share and Cite
Dang, X.; Cao, Y.; Hao, Z.; Liu, Y. WiGId: Indoor Group Identification with CSI-Based Random Forest. Sensors 2020, 20, 4607. https://doi.org/10.3390/s20164607
Dang X, Cao Y, Hao Z, Liu Y. WiGId: Indoor Group Identification with CSI-Based Random Forest. Sensors. 2020; 20(16):4607. https://doi.org/10.3390/s20164607
Chicago/Turabian StyleDang, Xiaochao, Yuan Cao, Zhanjun Hao, and Yang Liu. 2020. "WiGId: Indoor Group Identification with CSI-Based Random Forest" Sensors 20, no. 16: 4607. https://doi.org/10.3390/s20164607
APA StyleDang, X., Cao, Y., Hao, Z., & Liu, Y. (2020). WiGId: Indoor Group Identification with CSI-Based Random Forest. Sensors, 20(16), 4607. https://doi.org/10.3390/s20164607