1. Introduction
In recent decades there has been a considerable increase in intelligent electronic systems applied to vehicles and infrastructure. The evolution of Intelligent Transportation Systems (ITS) has introduced a wide range of systems and software applications [
1] with the aim of improving safety and efficiency in road transport. These systems obtain information from the different elements of the roads and process it and are used to improve driver safety, traffic and travel comfort.
Among others, ITSs are present in the development of:
In so-called “smart cities” and “smart roads” [
10], it is currently of great interest to know the quantities and categories of vehicles that are circulating in “real time”. For this reason, within the scientific technology of electronic instrumentation and measurement and control systems, there are different lines of work [
1,
2,
3,
4,
5,
6] focused on meeting this demand.
This line of research pursues synergy between the data provided by the installed instrumentation equipment and the existing infrastructure to achieve more sustainable and environmentally friendly mobility. The ITSs in large cities obtain information from the vehicles that circulate in them, and this is where virtual instrumentation plays an essential role.
Although many types of sensors are used to meet this technological need, the most widely used on the market today are magnetic (inductive loops or inductive sensors) or based on the digital processing of images captured by cameras or fiber optic sensors. Cameras, magnetics and inductive systems are the most used in the city of Madrid, where the virtual instrument described and tested in this paper was developed.
In the case of inductive sensors, the main problems are, firstly, the uncertainty in the results of the classification. These devices do not allow the classification of multi-axle vehicles by themselves and require other elements to count them, such as photocells, fiber optic sensors, laser sensors or axle-counting stands. The inductive sensors are based on the variation of the mutual inductance (L) during the passage of the vehicle [
9]. The mutual inductance L can vary depending on whether the vehicle is loaded with additional metal mass. The second problem is that the installation of sensors is usually intrusive, i.e., when the sensors are placed under the pavement so that the vehicles pass over them. This makes the cost of installation high.
Classification systems based on image processing have some basic problems: The first is the need to place the camera on an elevated support, such as a pole or a gantry. The second problem is the large volume of data to be processed, which makes the detection and classification slow. Another problem is that the location of the camera directly influences the calculation parameters in the detection algorithm [
11], and this makes the settings required in each installation variable. In short, the installation of this type of system and the processing of information are complex.
Fiber optic-based systems [
12] analyze the vibration produced by the vehicle and require complex signal processing and analysis algorithms. The success rate is less than 80%.
Consequently, the motivation of the authors is to create an alternative system that can minimize the problems described.
The objectives established when designing and building the virtual instrument described in this paper can be summarized as follows:
Sensors should be easy to install, preferably with non-invasive installation.
When sensors are to be installed under the pavement, it should be possible to do so with little impact on the road (in terms of road works or service interruption).
Data processing should be fast, with low computational costs.
It should be possible to extend the functionalities to the system without the need to increase the number or type of sensors.
Measurements should be sufficiently accurate to reduce the probability of error in the vehicle category classification.
Signal conditioning and data acquisition hardware should have low costs and low power consumption.
The system must be able to catalog multi-axle vehicles.
The system must store the collected data for later use in a back-office process.
The description of the designed and built system has been organized as follows:
System blocks: The system blocks are described, and their nature, hardware or software is specified. The virtual instrument and its blocks are defined. The installation of the measuring system designed for the road is described.
System hardware: All hardware elements of the measurement system are described: transducers, signal conditioners, data acquisition (DAQ) systems (DAQ module) and camera.
System software: The software architecture (pattern design) of the developed application is described. The application developed and the calculation methodology used to achieve the results are described.
Experimental results: The results obtained are shown and the results are discussed.
Error estimation: An analysis of the sources of error is carried out and the estimate of the maximum error is calculated.
Conclusions: The final conclusions of the designed system are shown after being tested with real traffic.
2. Built Measurement System Blocks
The system was conceived as a virtual instrument consisting of a hardware part and a software part running on a computerized system (PC), so that changes in the software can make the virtual instrument expandable in its functionalities and maintainable.
A virtual instrument consists of an industry-standard computer or workstation equipped with powerful application software, cost-effective hardware such as plug-in boards, and driver software, which together perform the functions of a measurement instrument [
13].
Virtual instruments represent a fundamental shift from traditional hardware-centered instrumentation systems to software-centered systems that exploit the computing power, productivity, display and connectivity capabilities of popular desktop computers and workstations.
In the virtual instrumentation, the “software is the instrument” [
14]. The software, using the appropriated hardware, defines the functions of the instrument.
In the
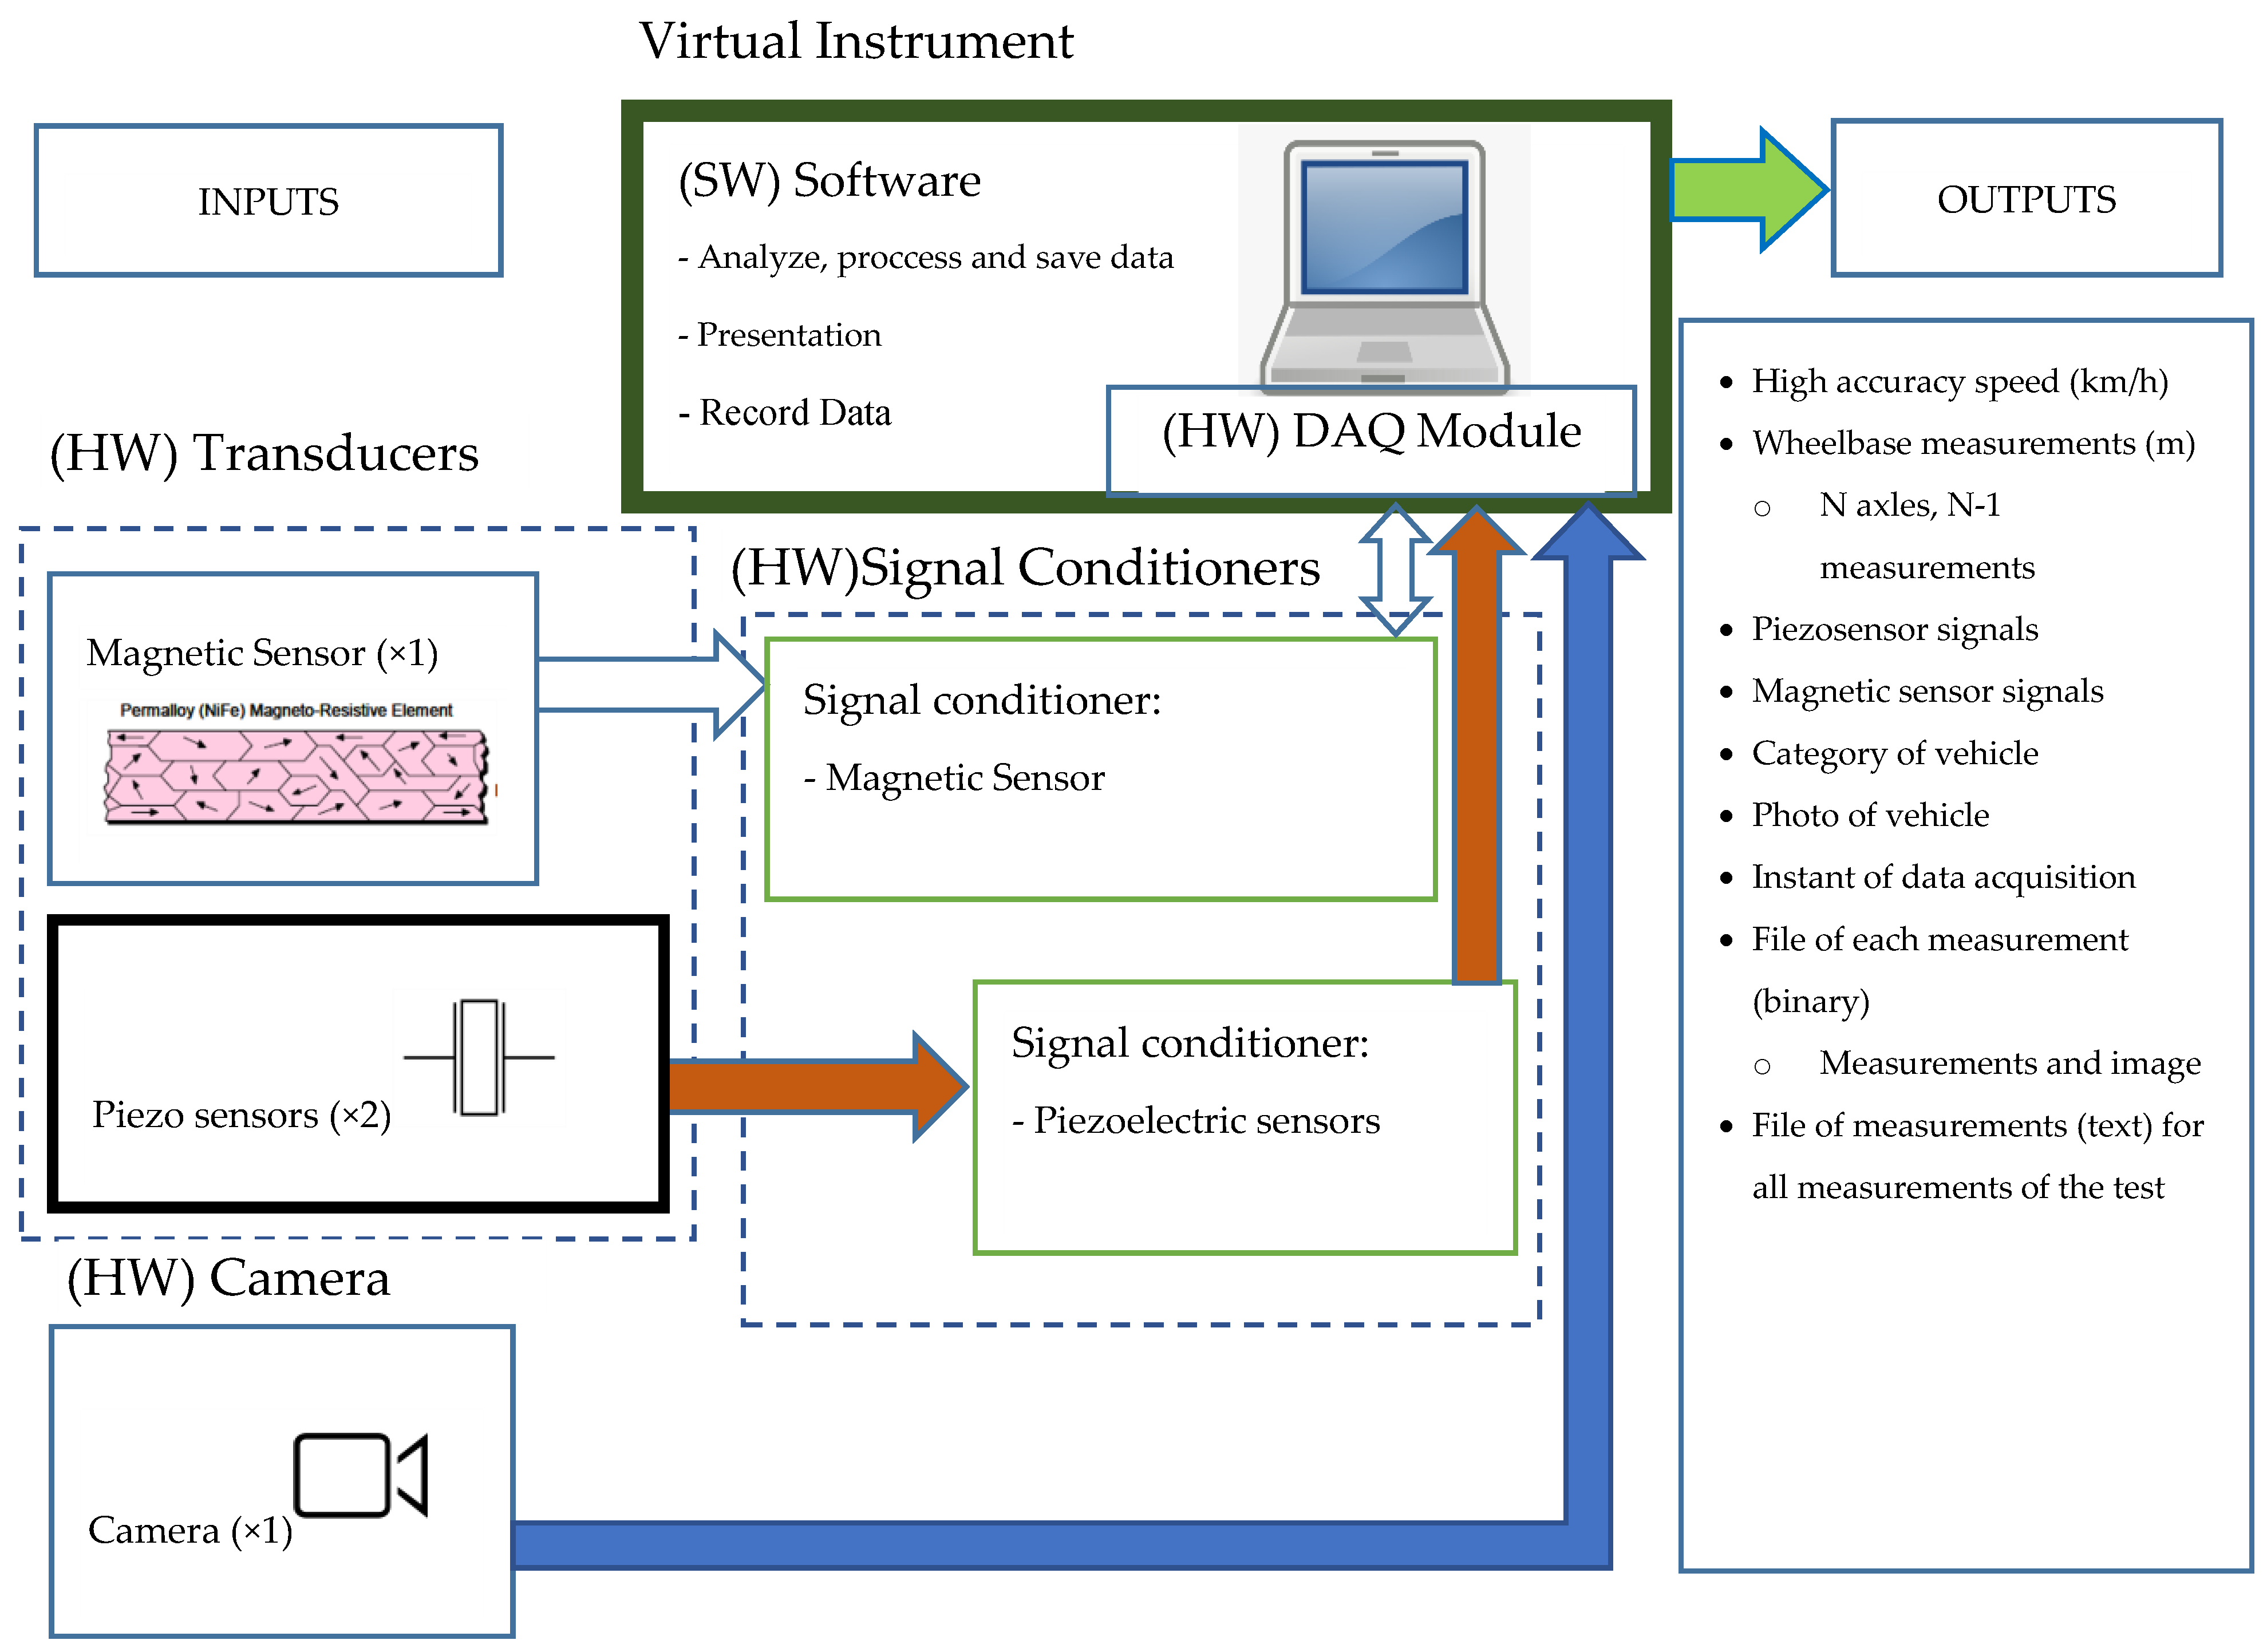
Figure 1, the virtual instrument block is formed by the developed software and a National Instruments general purpose multi-function DAQ module. Obviously, signal conditioners for the transducers are also necessary. The system block diagram is shown in
Figure 1.
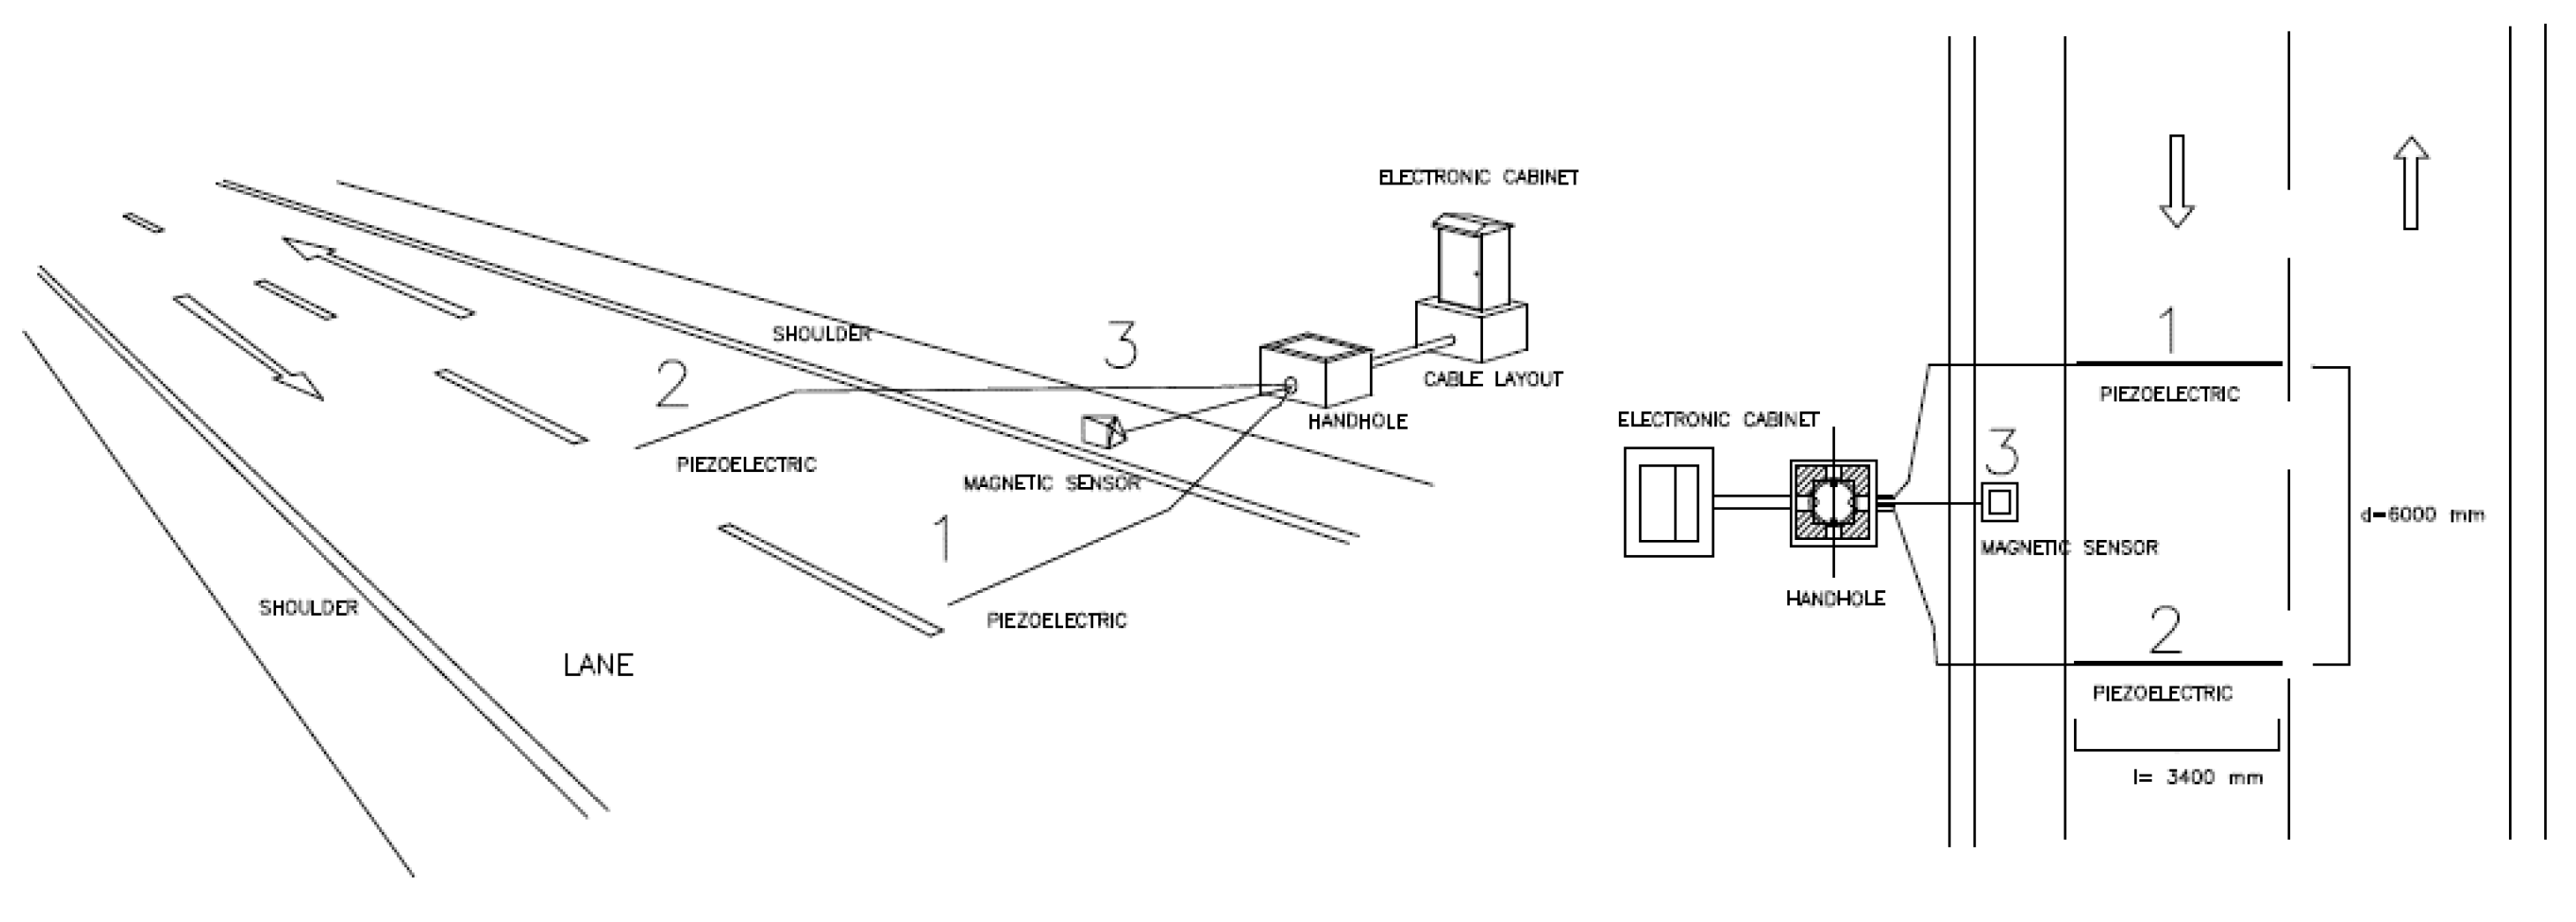
Figure 2 shows an example of installation. Piezo sensors can be installed above the pavement (non-intrusive) or below the pavement (intrusive).
3. System Hardware
The following describes the transducers used, their signal conditioners, the data acquisition (DAQ) board used and the camera used to capture the images.
3.1. Transducers
3.1.1. Piezo Sensors
The piezoelectric transducers used are piezoelectric cables. These piezoelectric devices are commonly used in traffic management and have, in recent years, also been used in the development of road traffic infrastructure [
15,
16,
17,
18,
19,
20,
21]. This type of transducer is usually used in electronic instrumentation dedicated to traffic management for vehicle counting and weighing (only if the vehicle is traveling at low speed). However, they are used in a new way in this design to measure the speed of the vehicle with high accuracy. The procedure for obtaining the speed and wheelbase measurements is described in
Section 5.
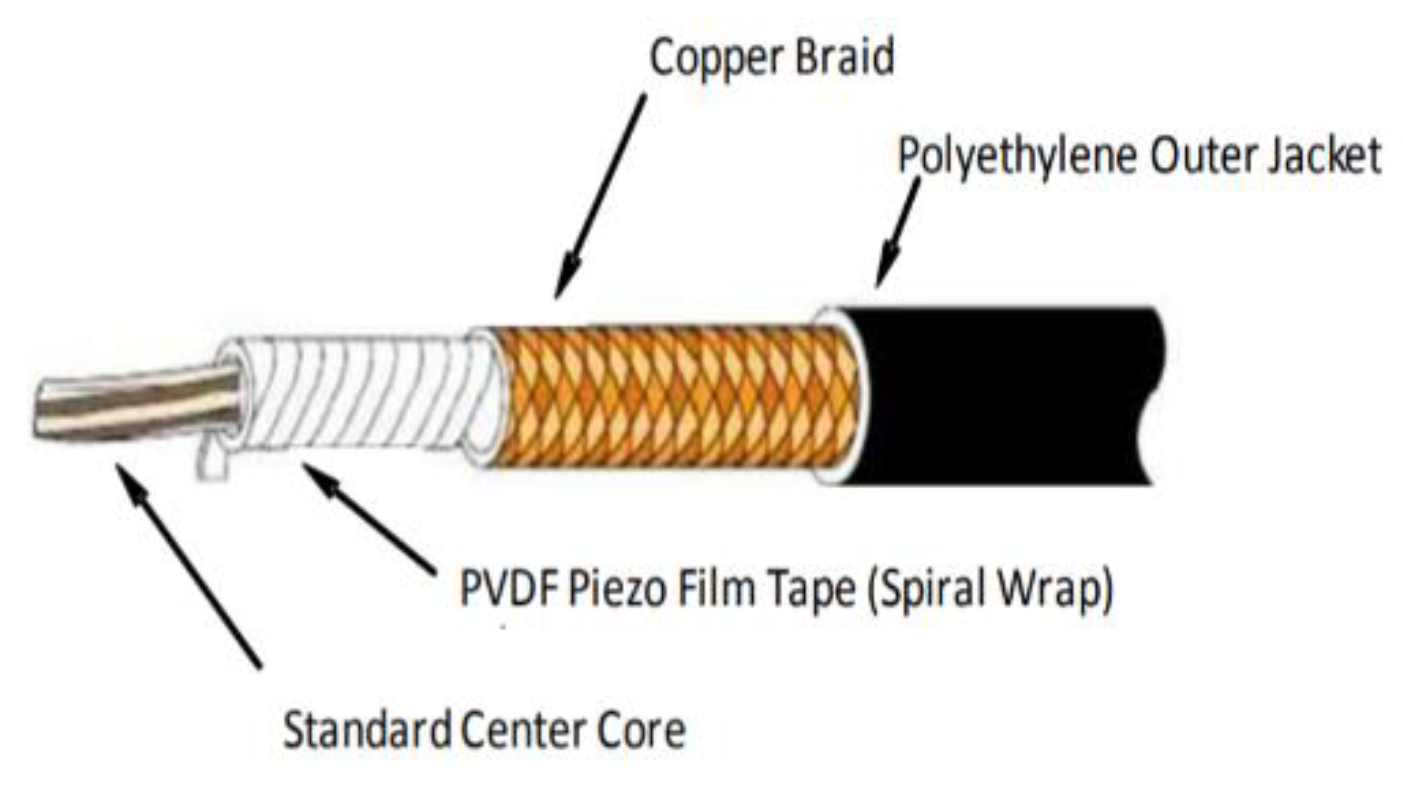
Piezoelectric cables [
22,
23] are coaxial with 20 AWG stranding in which the cable insulation is a PVDF film. The most important characteristics are shown in
Figure 3 and
Table 1. Piezoelectric performance specifications.
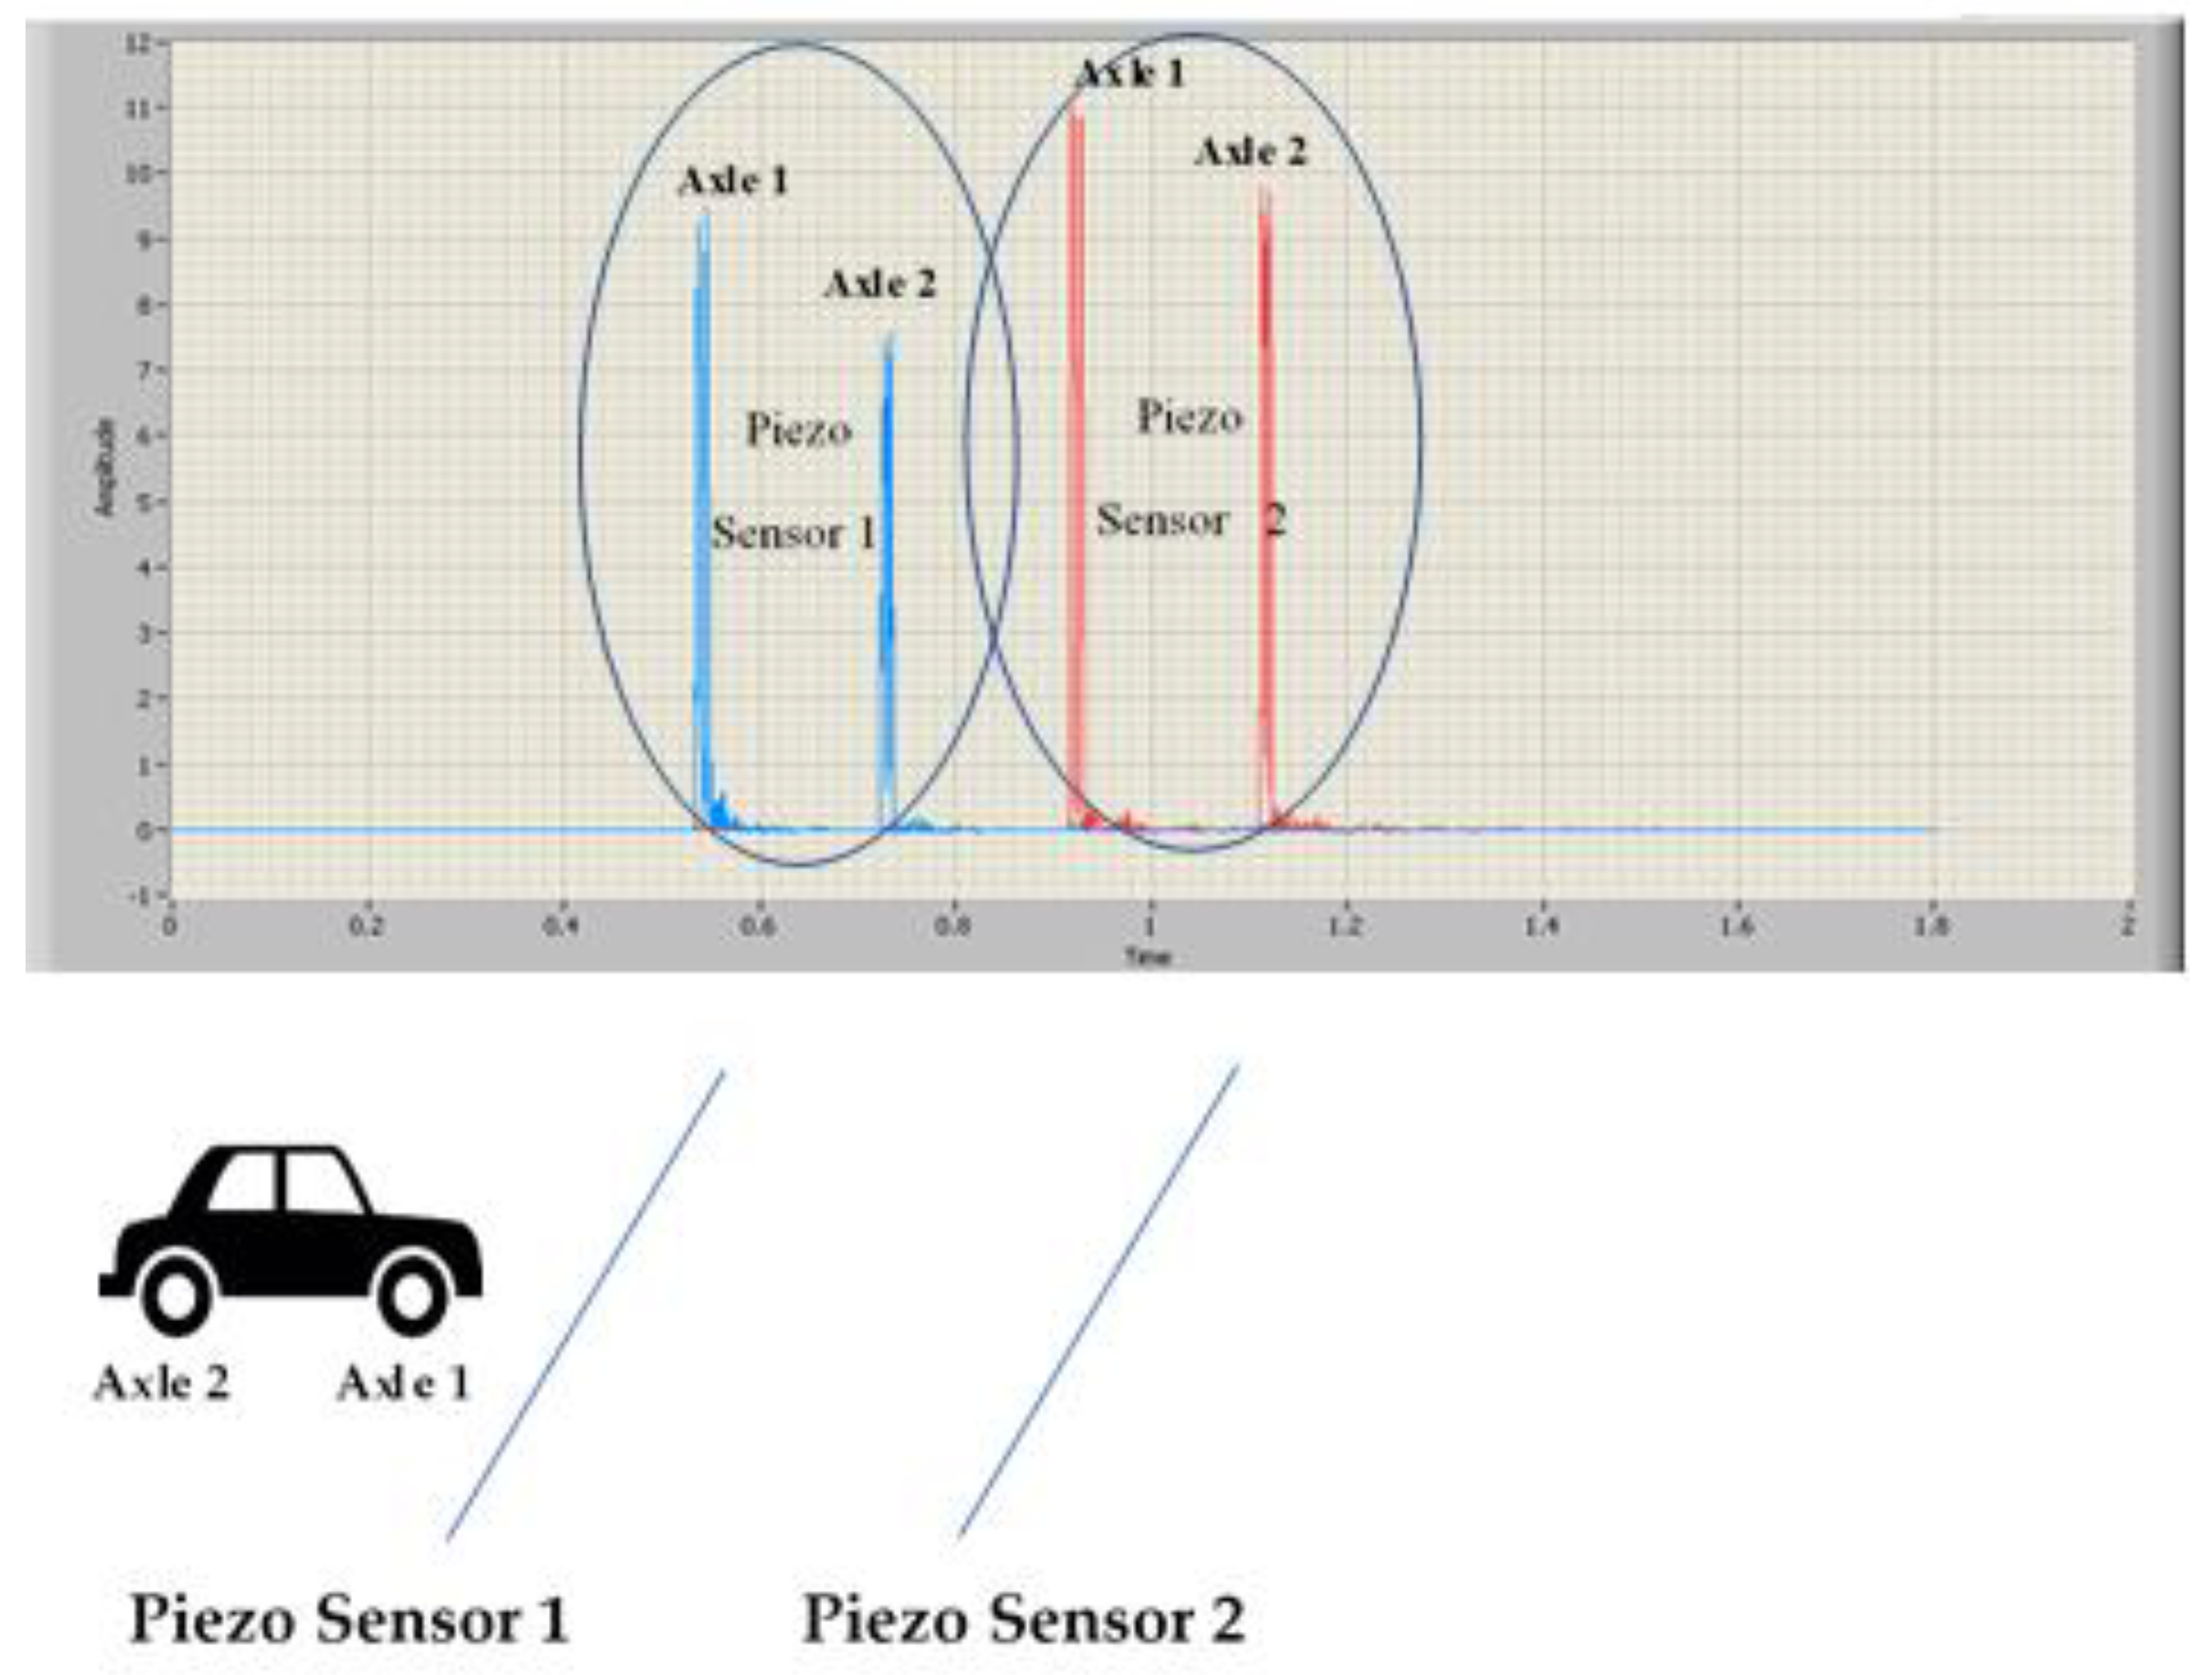
Piezo sensors, due to the direct piezoelectric effect of the PVDF piezo film tape, respond with an analog voltage. The peak values when the vehicle passes over them depend on whether the cable is on or under the pavement. The margins are 20~40 V when the installation is on the pavement and 2~4 V when the installation is under the pavement, at a 2 cm distance. It is necessary to attenuate and adapt this value so that the signal is within the input range of the DAQ module.
Figure 4 shows a typical response signal from the piezo sensors when they are driven over by the vehicle.
3.1.2. Magnetic Sensor
A magnetoresistive transducer [
24,
25], the HMC2003 transducer of the HMC series of Honeywell, is used. It is able to determine the variations in the magnetic field of the Earth induced by the approach and presence of metallic masses in the three axles—X, Y, Z.
Figure 5 shows a block diagram of the magnetic sensor, and some of the specifications are shown in
Table 2.
These three axles use permalloy magnetoresistive sensors. These sensors produce an imbalance in the Wheatstone bridge (see
Figure 6. HMC2003 set–reset.) when the magnetic dipoles are oriented to the passage of the metal mass. Two control actions are required to achieve the maximum sensitivity and input range from these sensors. The first is the establishment of a set–reset command (introducing SR+ and SR− pulses) [
24,
25] to disorientate the magnetic dipoles and thus “erase” the memory of the last measurement (the dipoles tend to remain oriented). The second is the correction of the offset voltage to approximately 2.5 V when there is no metal mass to unbalance the Wheatstone bridge. The control actions are dictated by the software through the DAQ module. Digital set–reset control signals are applied to a driver made up of MOSFET transistors that introduce two SR+ and SR− pulses. An analog voltage is generated, which is subtracted from the output voltage in the absence of metal mass.
Figure 7 shows the signals of a vehicle of three axles: magnetic sensor, piezo sensor 1 and piezo sensor 2 after its conditioning. The shape and area under the magnetic sensor graph provide additional information for distinguishing between doubtful cases in the category classification, although this procedure is still being developed.
3.1.3. DAQ Module
A National Instruments general purpose multi-function DAQ module is used [
26], NI USB 6211 [
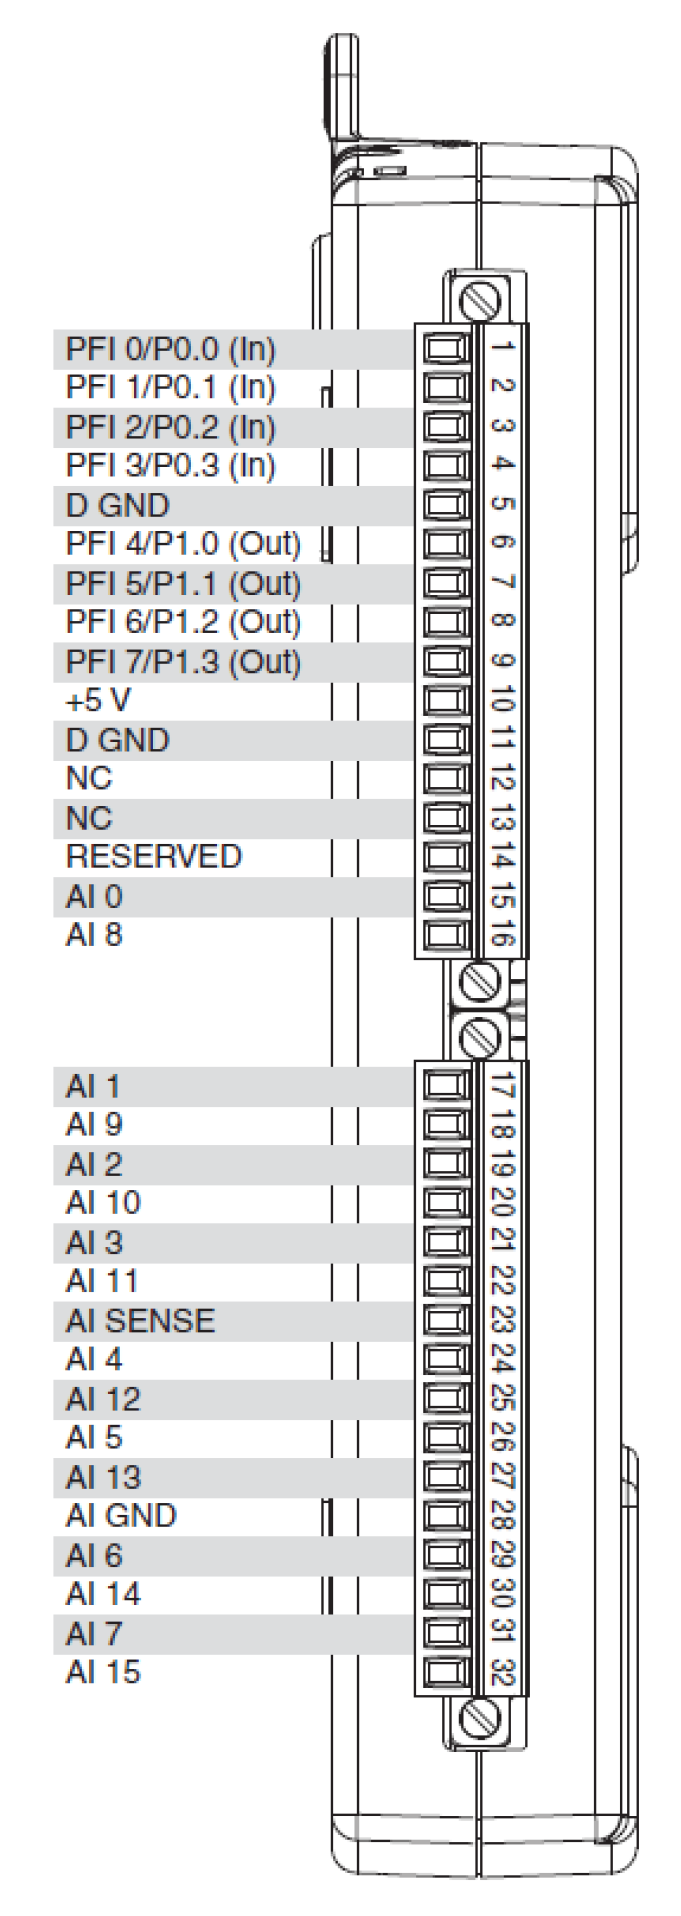
27]. Some of its features are shown in
Table 3 and
Figure 8.
3.1.4. Camera
The system has a camera that takes an image of the vehicle. This image is associated with the measurements taken. The initial objective is to verify that the classification method implemented in the IV works correctly. A Logitech C920 HD 1080P USB camera connected to the PC is used.
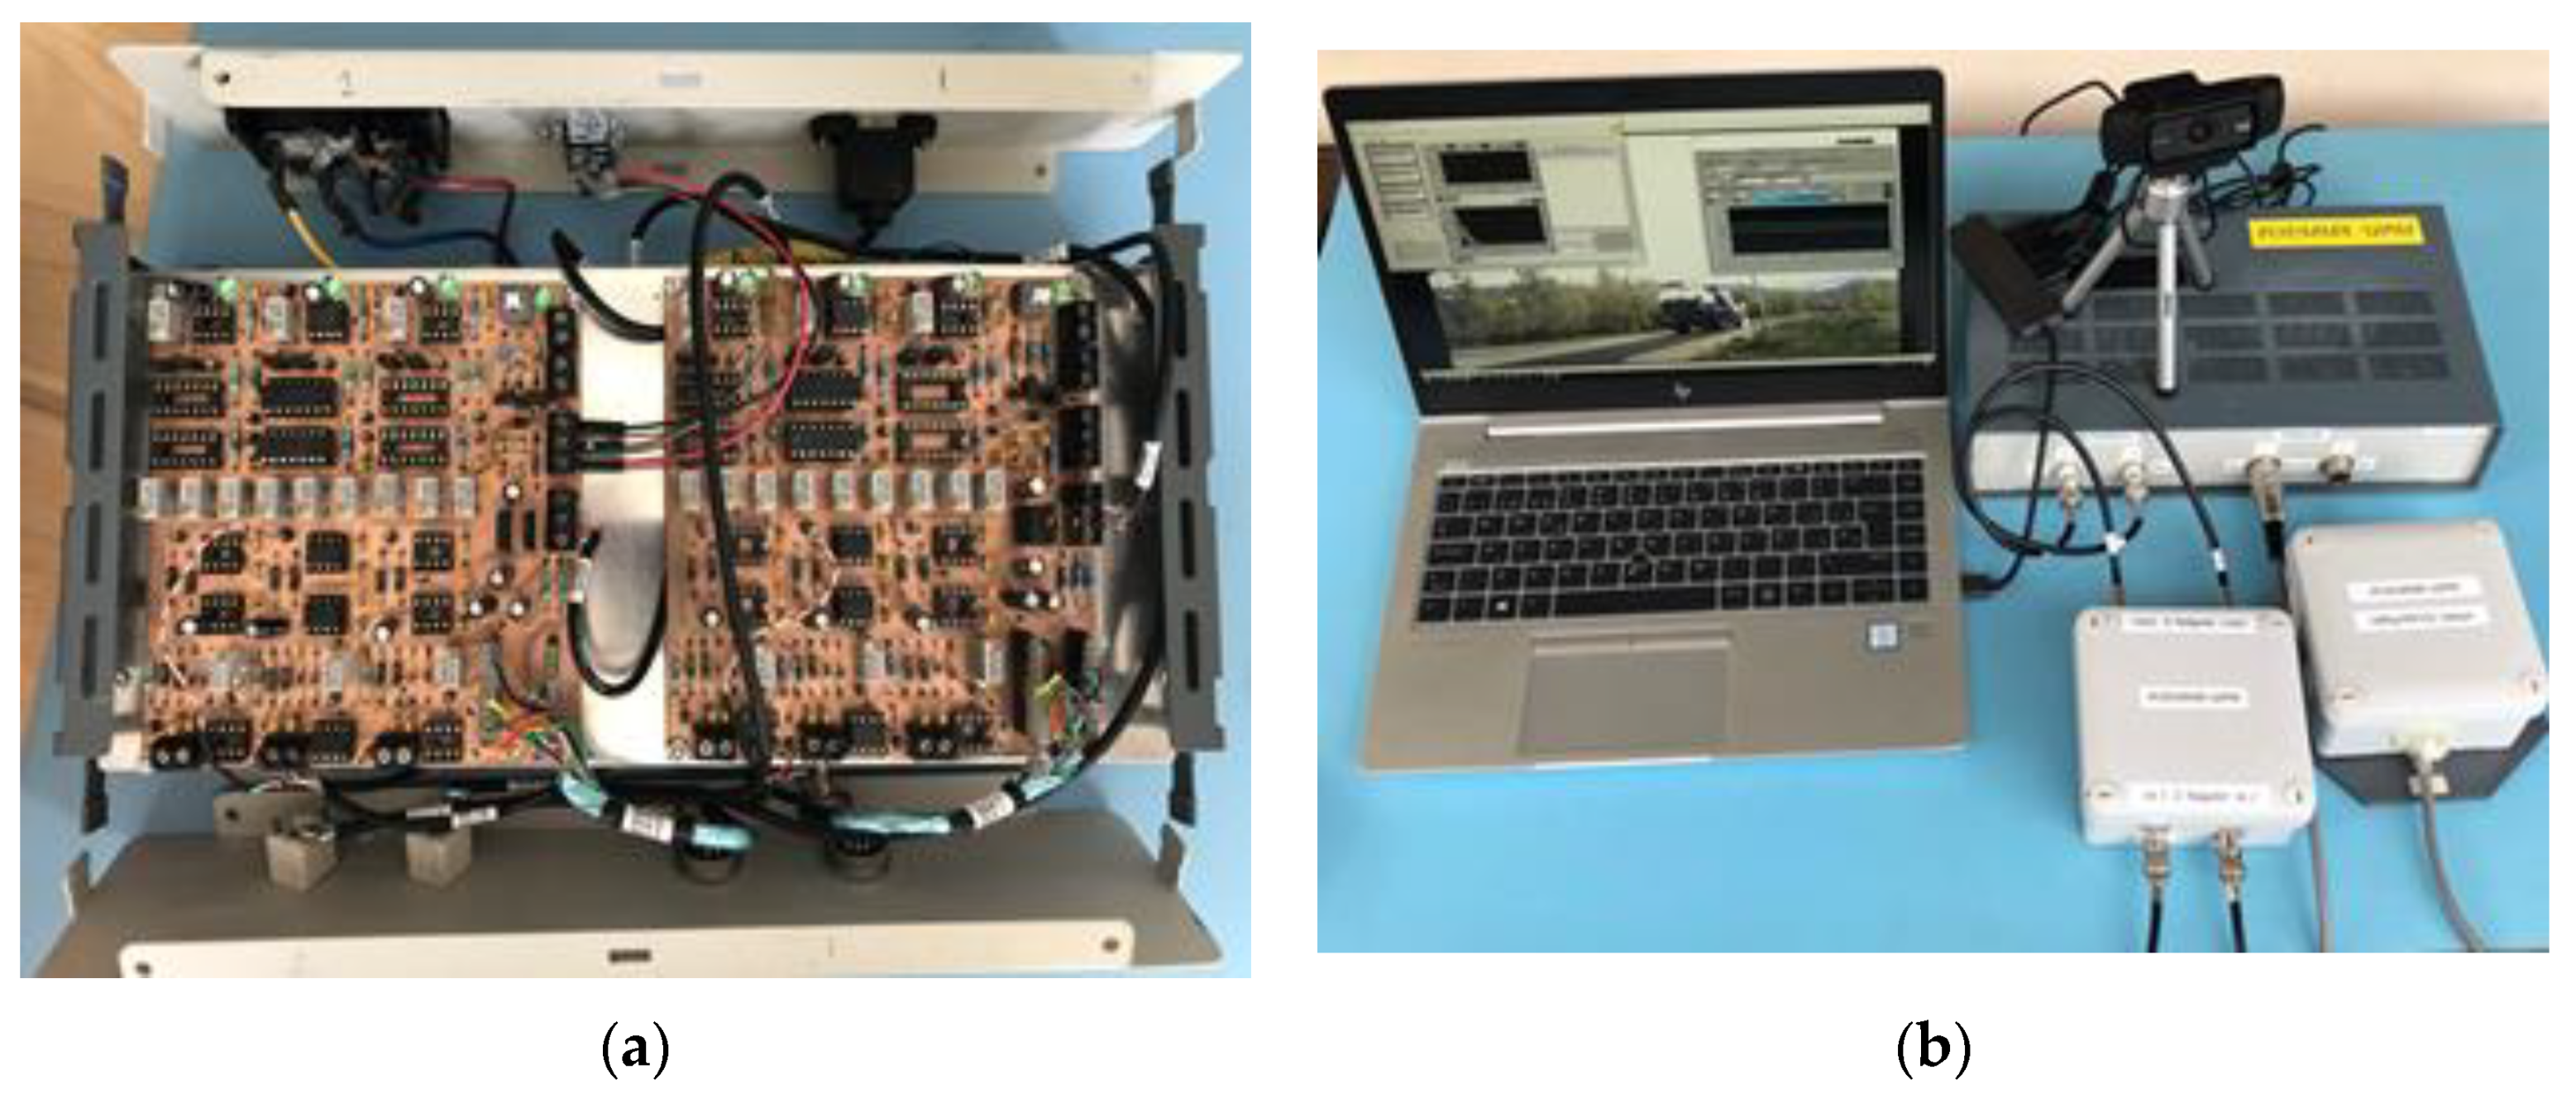
Figure 9 shows images of the built equipment.
The sensor signal conditioners (for piezo sensors and magnetic sensor) were designed by the authors. For each piezo sensor, an active attenuator was designed and for the magnetic sensor, an amplifier, MOSFET drivers to set–reset the signal and a circuit to adjust the zero level in the magnetic sensor response were designed.
4. Software System
The system’s software was written with LabVIEW
® (National Instruments, Austin (Texas) USA), a graphical programming language that is the most widely used language in virtual instrumentation. The LabVIEW
® program consists of two main windows, the front panel (user interface) and the block diagram (program code). The programming is modular, and each module is built with one or more files called “SubVIs” [
28].
The virtual instrument for measurement and control was designed with a state machine architecture. This design pattern is indicated for the design of complex measurement equipment that is required to have different functionalities. A state is a situation in which the machine can be found. Usually, in a state, the actions or operations associated with it are carried out. There is also a decision code, which determines the next state to which the machine must evolve. A state machine is described graphically with a state diagram in [
29]. The LabVIEW
® programming language allows for the implementation of a state machine with a simple design pattern, which allows for the development of complex programs, making the virtual instrument scalable, maintainable and readable.
Figure 10 shows the skeleton of a state machine where the strategy described in the previous paragraph can be clearly seen.
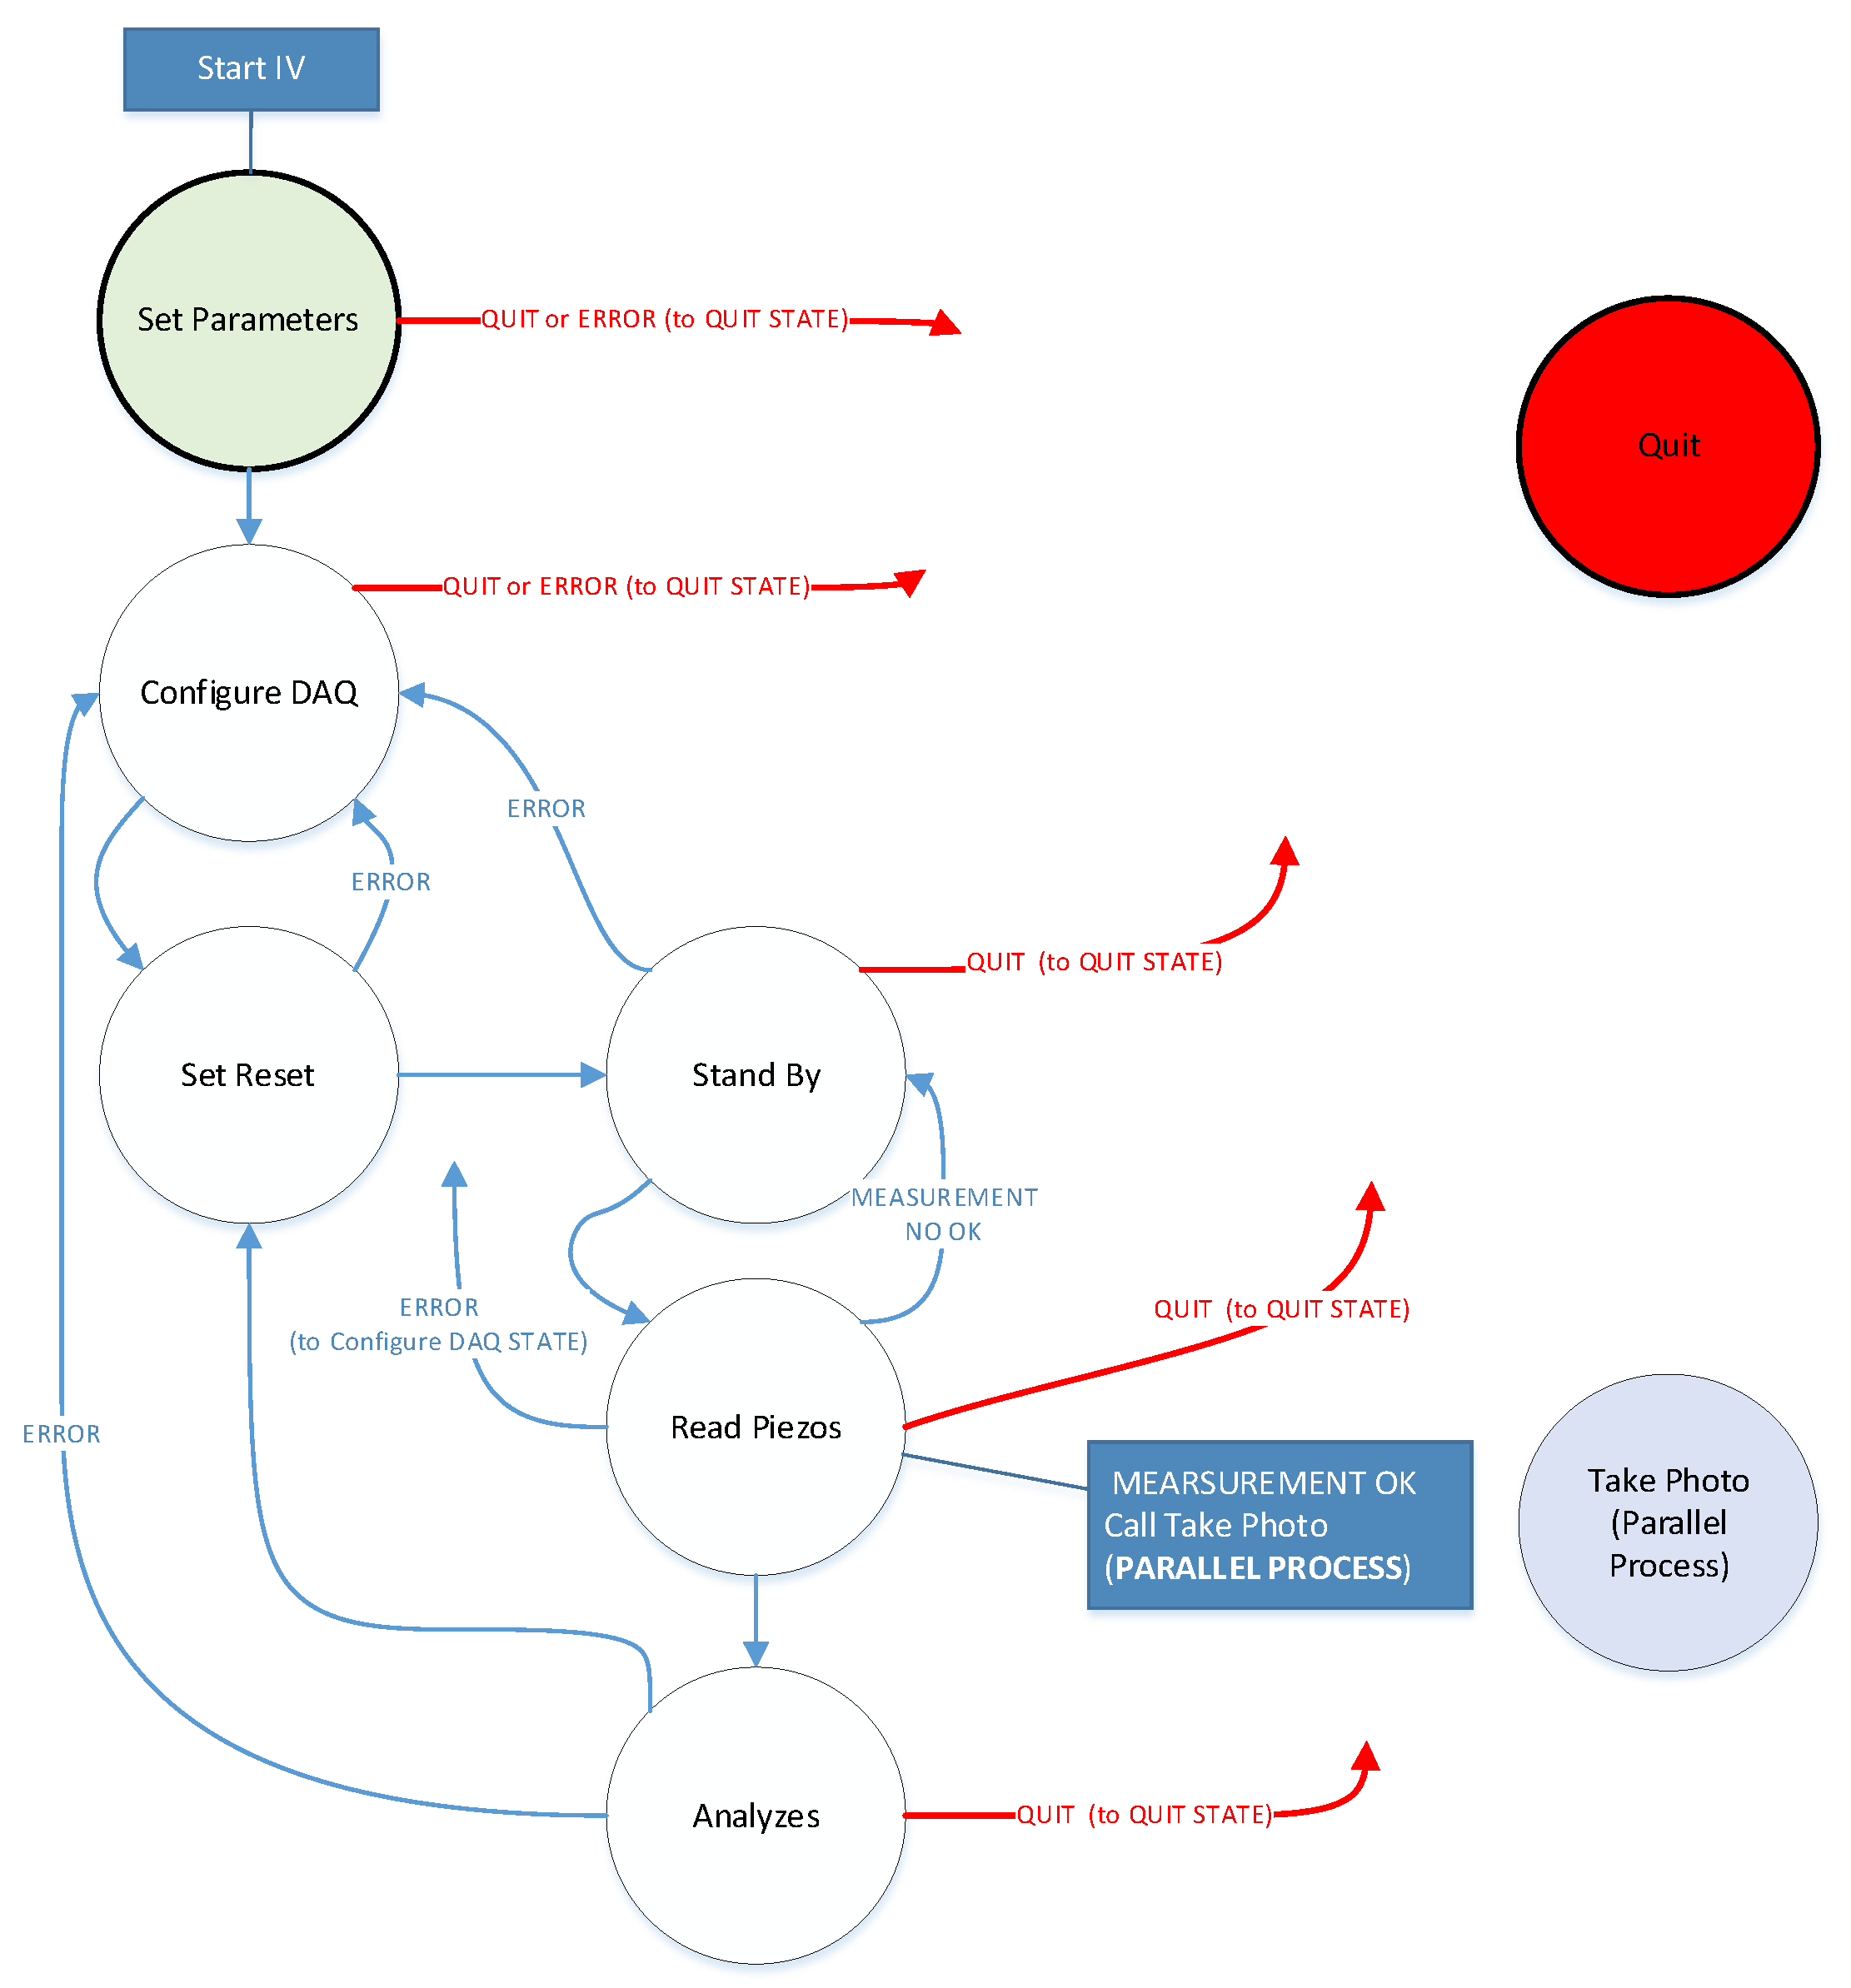
Figure 11 shows the state diagram of the built virtual instrument.
The states of the virtual instrument are described below and shown in
Table 4. Virtual instrument states.
4.1. Speed Vehicle Calculation
The designed virtual instrument has two keys that ensure a reliable measurement with a high degree of accuracy:
- -
Acquisition of the signal from the piezoelectric sensors at an acceptable level.
- -
Highly accurate calculation of vehicle speed.
Speed,
v, is calculated using Equation (1):
where
v is the speed, expressed in km/h;
d is the distance between the piezoelectric sensors, expressed in meters (m);
Delay2,1 s the time from the vehicle passing over piezo sensor 1 to the vehicle passing over piezo sensor 2, expressed in seconds (s).
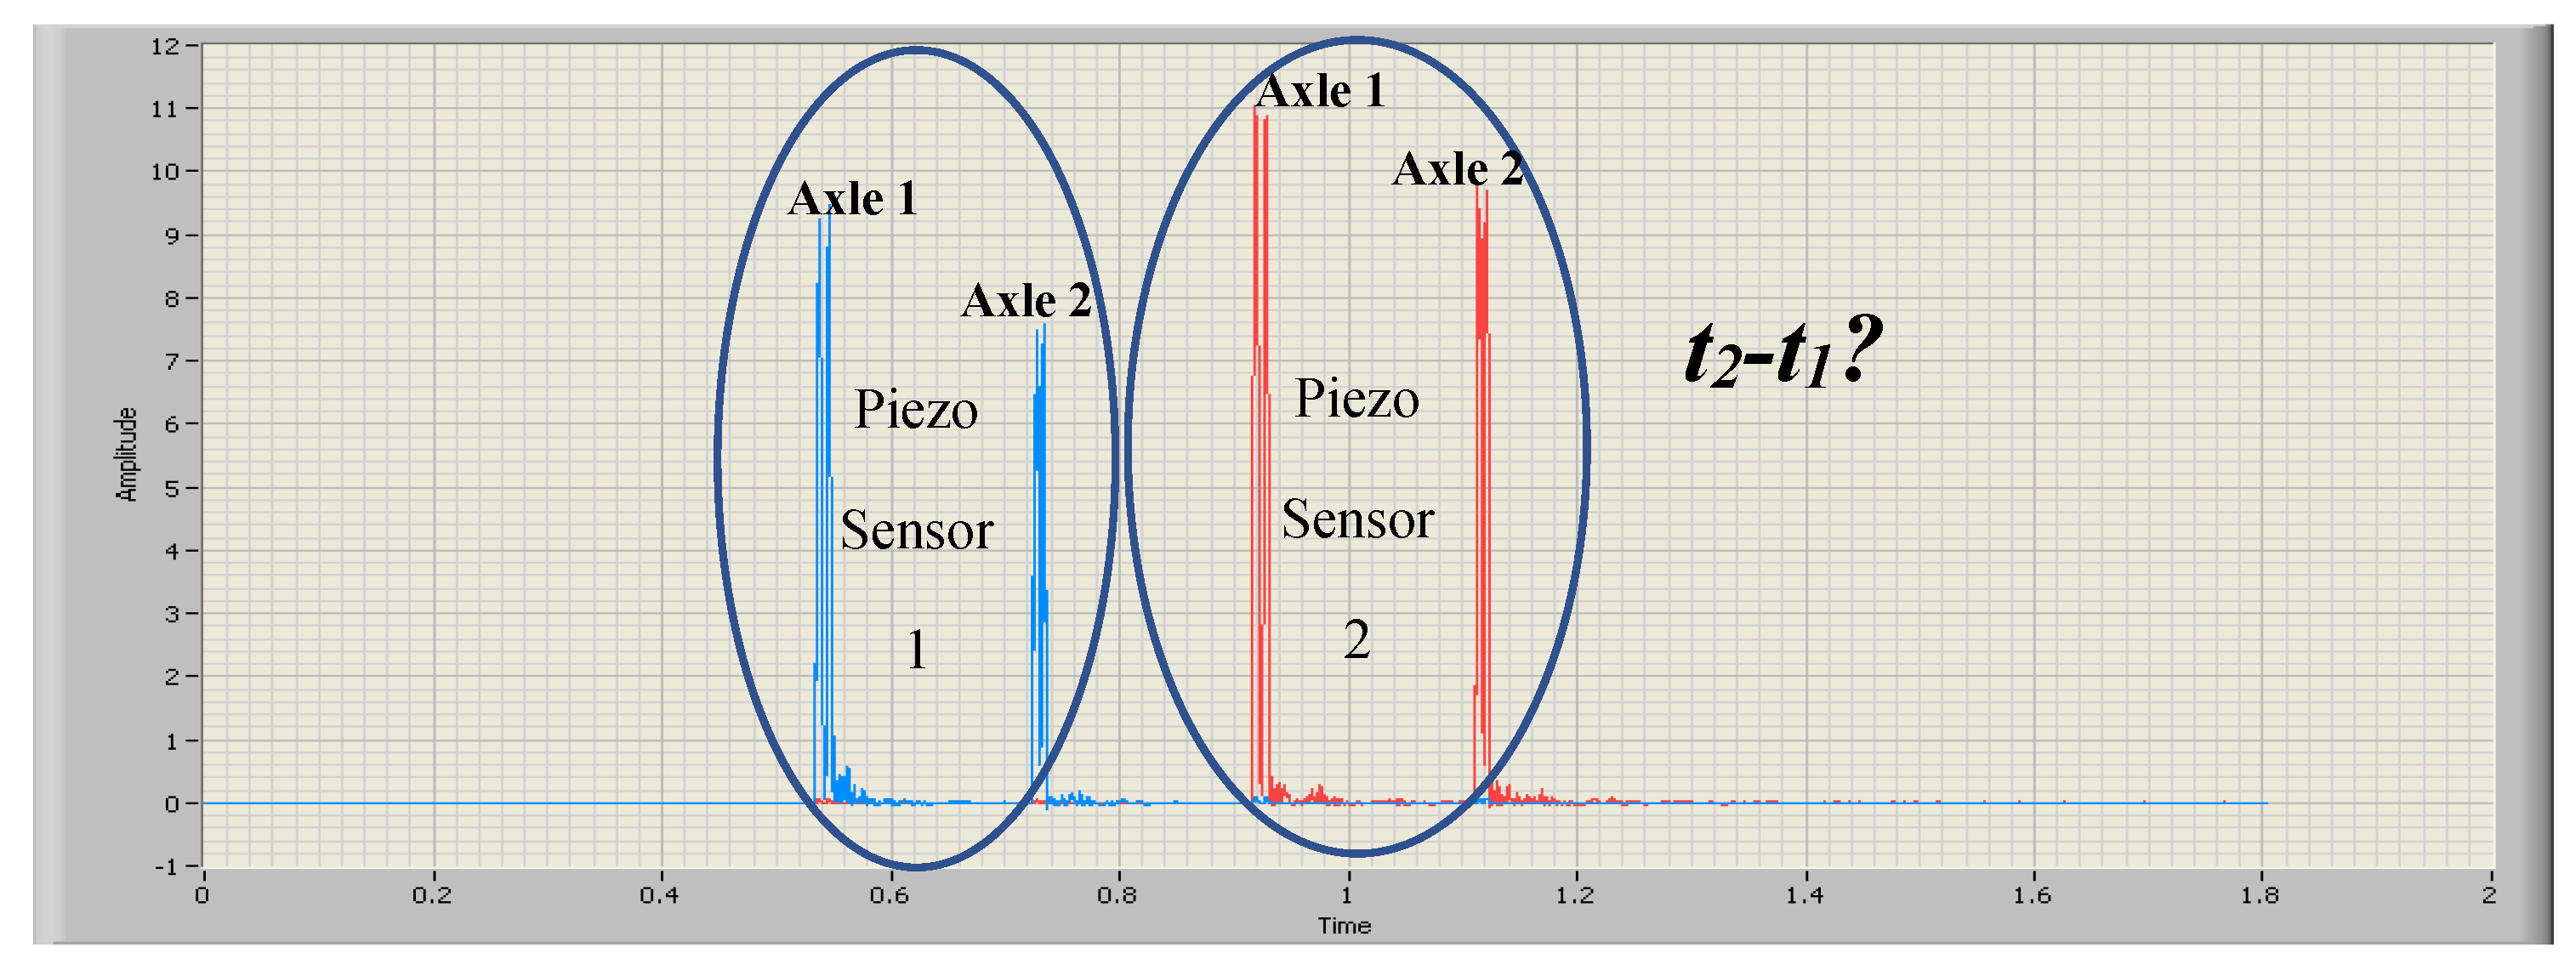
Figure 12 shows the signals captured by piezoelectric sensors 1 and 2, respectively. As can be seen, the signals are similar but vary in shape and amplitude. These factors make the uncertainty in the estimation of the Delay
2,1 quite high (in the order of ms). Therefore, the need arises to perform the Delay
2,1 estimation by a method that provides a lower error [
30].
The estimation method used is cross correlation, which considerably reduces the error rates in the estimation of the delay between signals [
31,
32]. This has been implemented in SubVI Cross correlation.vi.
Figure 13 shows the code extract from Cross correlation.vi. This SubVI has input data (signals) acquired from piezoelectric sensors 1 and 2 and the distance between them. The SubVI provides a graph of the cross correlation and the estimated speed (in km/h).
Although the signals from the piezo sensors were conditioned beforehand, the sensitivity of each piezo cable does not match; in the same way, the acquired signal levels also do not match. The solution implemented to make the acquired signals from the sensors valid is the standardization of these signals.
The next step is to determine the cross correlation of both signals, which is calculated according to Equation (2):
where x(t) is signal piezo 1 (normalized) and y(t) is signal piezo 2 (normalized). However, since the signals are discrete, Equation (3) is implemented.
The implementation of this equation provides the sequence of expression (4):
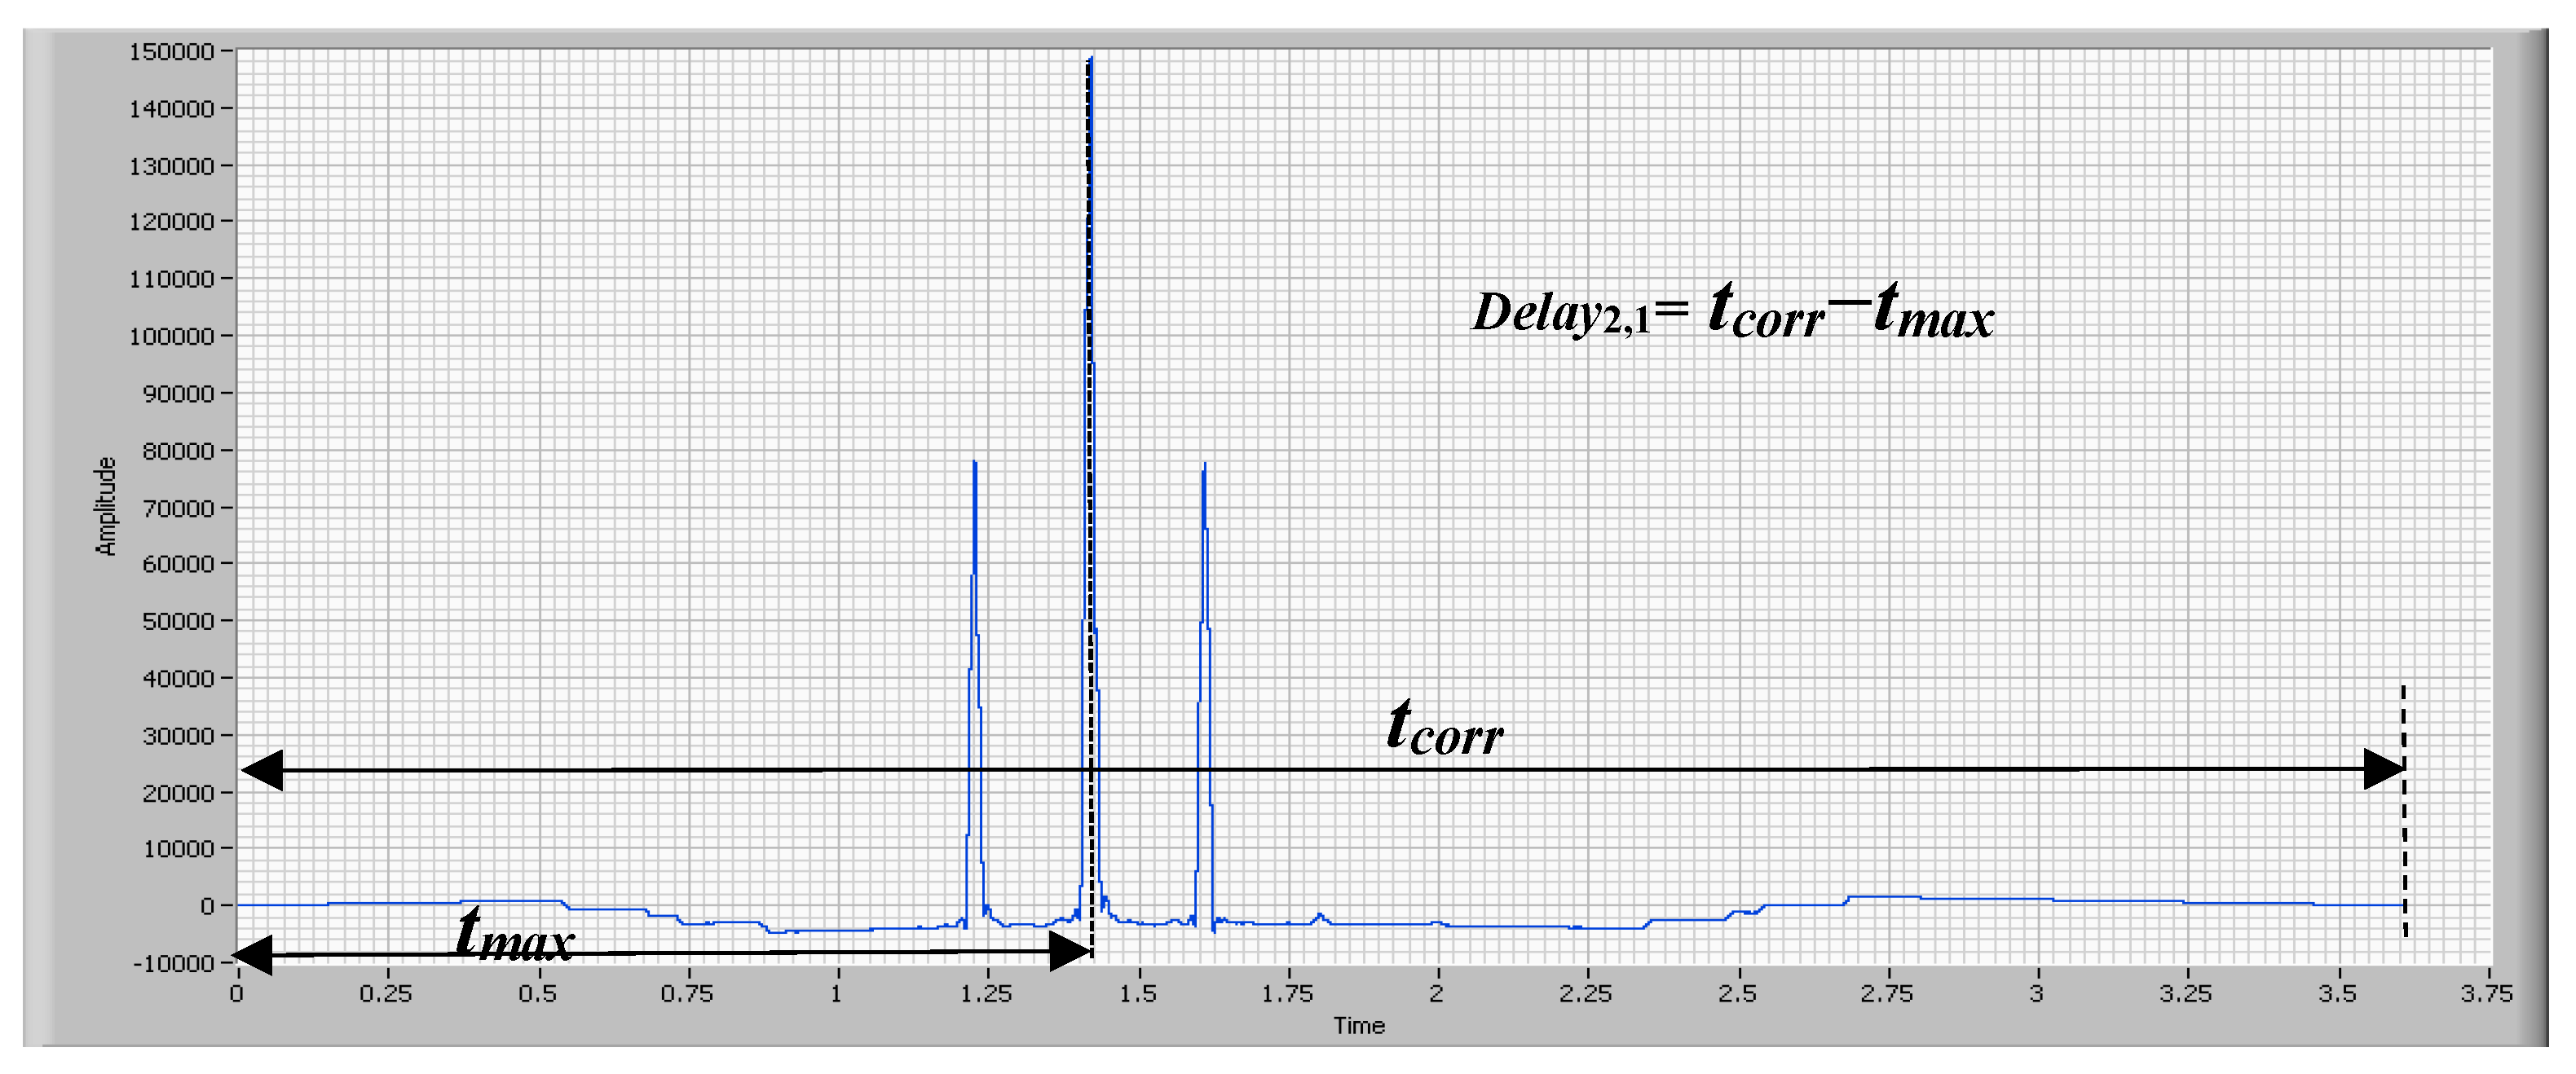
The result of cross correlation for signal piezo sensor 1 and signal piezo sensor 2 is shown in
Figure 14. Therefore, the delay between the vehicle steps according to the piezoelectric sensors is calculated using Equation (5).
where
t1 and t2 are the moments of time at which the vehicle moves over piezoelectric sensors 1 and 2, respectively.
tcorr is the waveform duration of the cross correlation result;
tmax is the moment in time at which the cross correlation reaches the maximum value.
4.2. Vehicle Category Determination
The automatic classification of the vehicle category is done by estimating the number of axles of the vehicle and the wheelbase or the distance between axles. The category is then assigned as shown in
Table 5. This strategy is novel compared to other methods for the classification of vehicles used by other authors [
33].
The classification shown in
Table 5 is based on a classification made according to the size of the vehicle and published in Traffic Detector Handbook Vol. 1 [
7].
The wheelbase categorization strategy is one of the key factors for achieving a high probability of success regarding the system’s automatic classification.
The calculation of the distance between two axles of the same vehicle is done via Equation (6):
where
daxles is the distance between two consecutive axles, expressed in meters (m);
v is the speed, expressed in km/h;
Delayi,i+1 is the time from when the i axle of the vehicle drives over a piezoelectric sensor until the i + 1 (next) axle drives over the same sensor, expressed in seconds (s);
Delay
i,i+1 is estimated by measuring the time instants of the signal from one of the sensors when a certain threshold value is exceeded. In this case, Delay
i,i+1 is not calculated using the cross correlation method. This would necessitate adding another sensor to establish the signal start trigger. The classification of the vehicle is done based on ranges of the vehicle wheelbase, as shown in
Table 3. These calculations are performed in the SubVI Axles distance.vi.
Figure 15 shows a code extract from Axles distance.vi. This SubVI has, as interesting input data, the signals acquired from the piezoelectric sensors 1 and 2, the selection of the observed sensor (piezo sensors 1 or 2) and the estimated speed in (km/h) calculated by the SubVI Cross correlation.vi, described in the previous section. The data of interest provided by Axles distance.vi are the value of the number of axles of the vehicle (#founds), an array with the instants of the time of step (locations) and the array with the distance between the axles of the vehicle (distance axles array (m)).
The data for the distance axles array (m) and #founds are used to determine the vehicle category.
Regarding the vehicle category, a study was performed of the wheelbase of common vehicles circulating in Spain. The authors added the typical wheelbase and the result is the information shown in
Table 5.
The subVI in charge of performing the automatic classification is called Category.vi.
Figure 16 shows the flowchart of this subVI.
When Category.vi returns the value unknown, a sensor measurement error exists, or the measured values are not included in the values of
Table 5. Remember that the values in
Table 5 are written in the file Categories.ini (ASCII file). In any case, the measured values of the number of axles (#founds), the distance between axles (distance axles array (m)) and the photograph of the vehicle are always recorded. This allows the user to check, at a later stage, if there are errors in the sensors or if the sensor measurements recorded a vehicle not covered by the categories in
Table 5. If you want to add new vehicle categories, just edit the file Categories.ini.
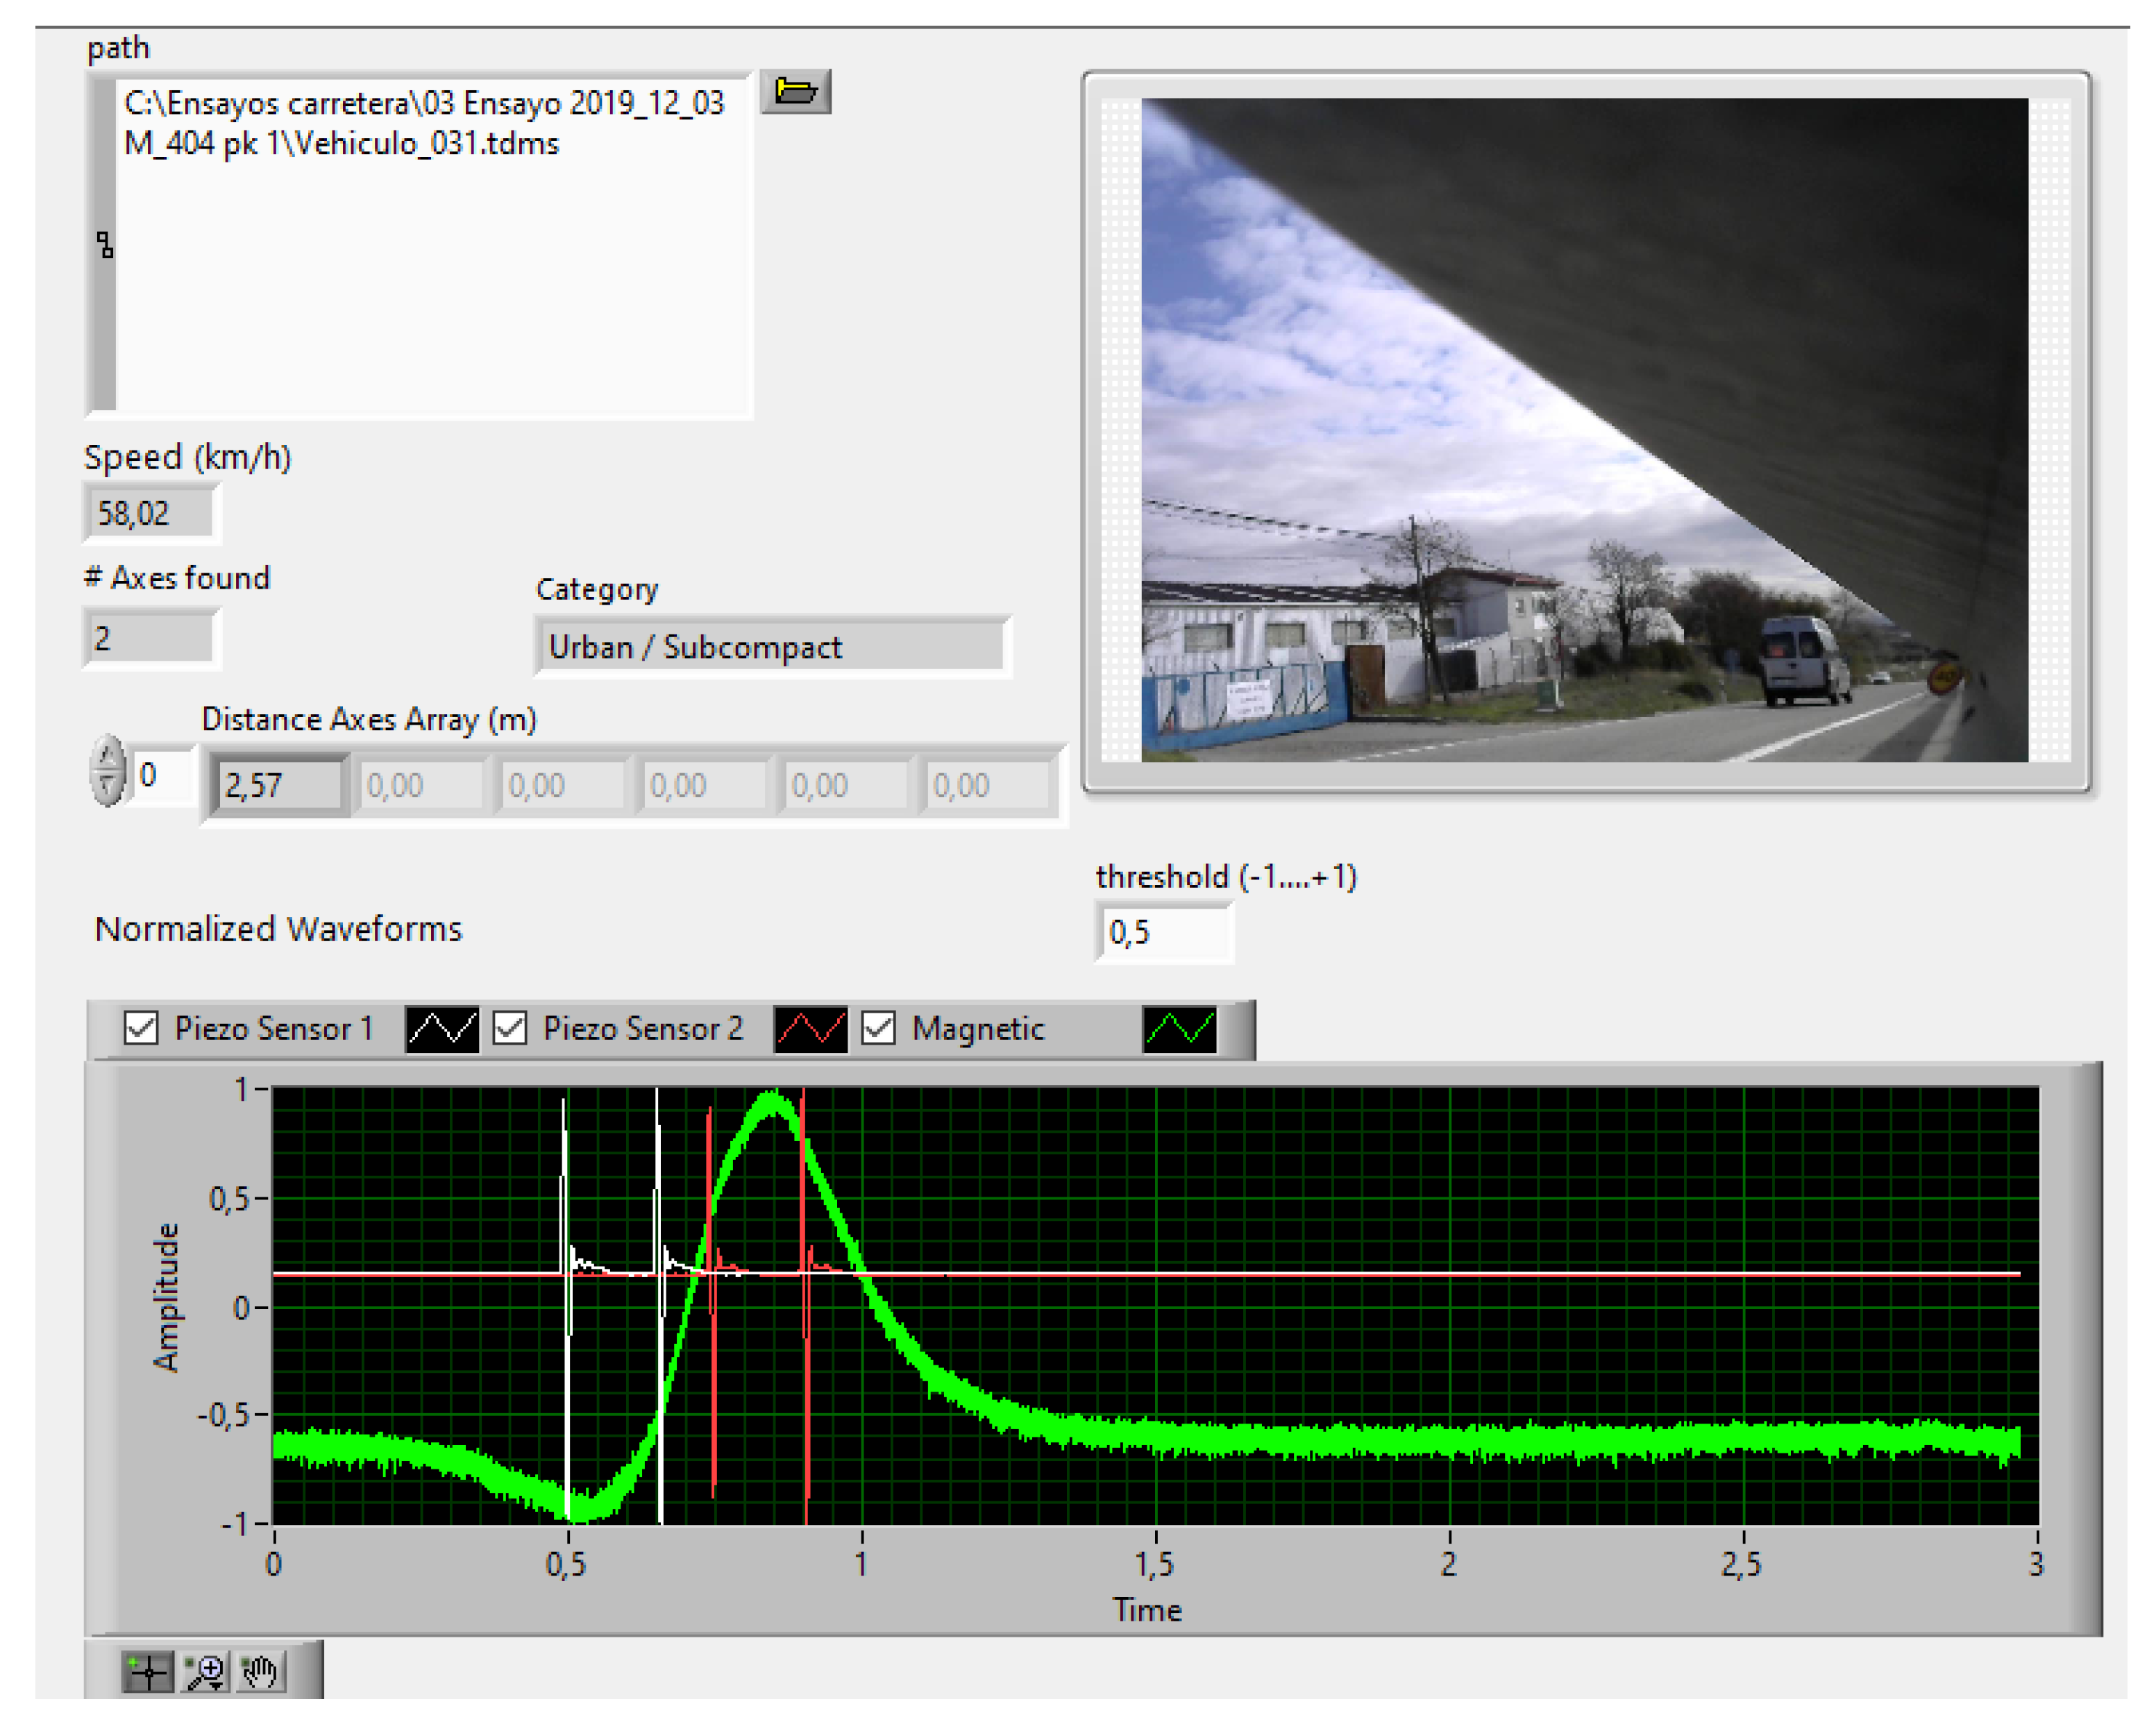
Figure 17 shows a vehicle with a wheelbase of approximately 2.57 m, corresponding to the urban/subcompact category.
5. Experimental Results
5.1. Test Conditions on Road
Tests were conducted with actual road traffic according to the recommendations given in ASTM 1318-09 regarding geometric design and pavement conditions [
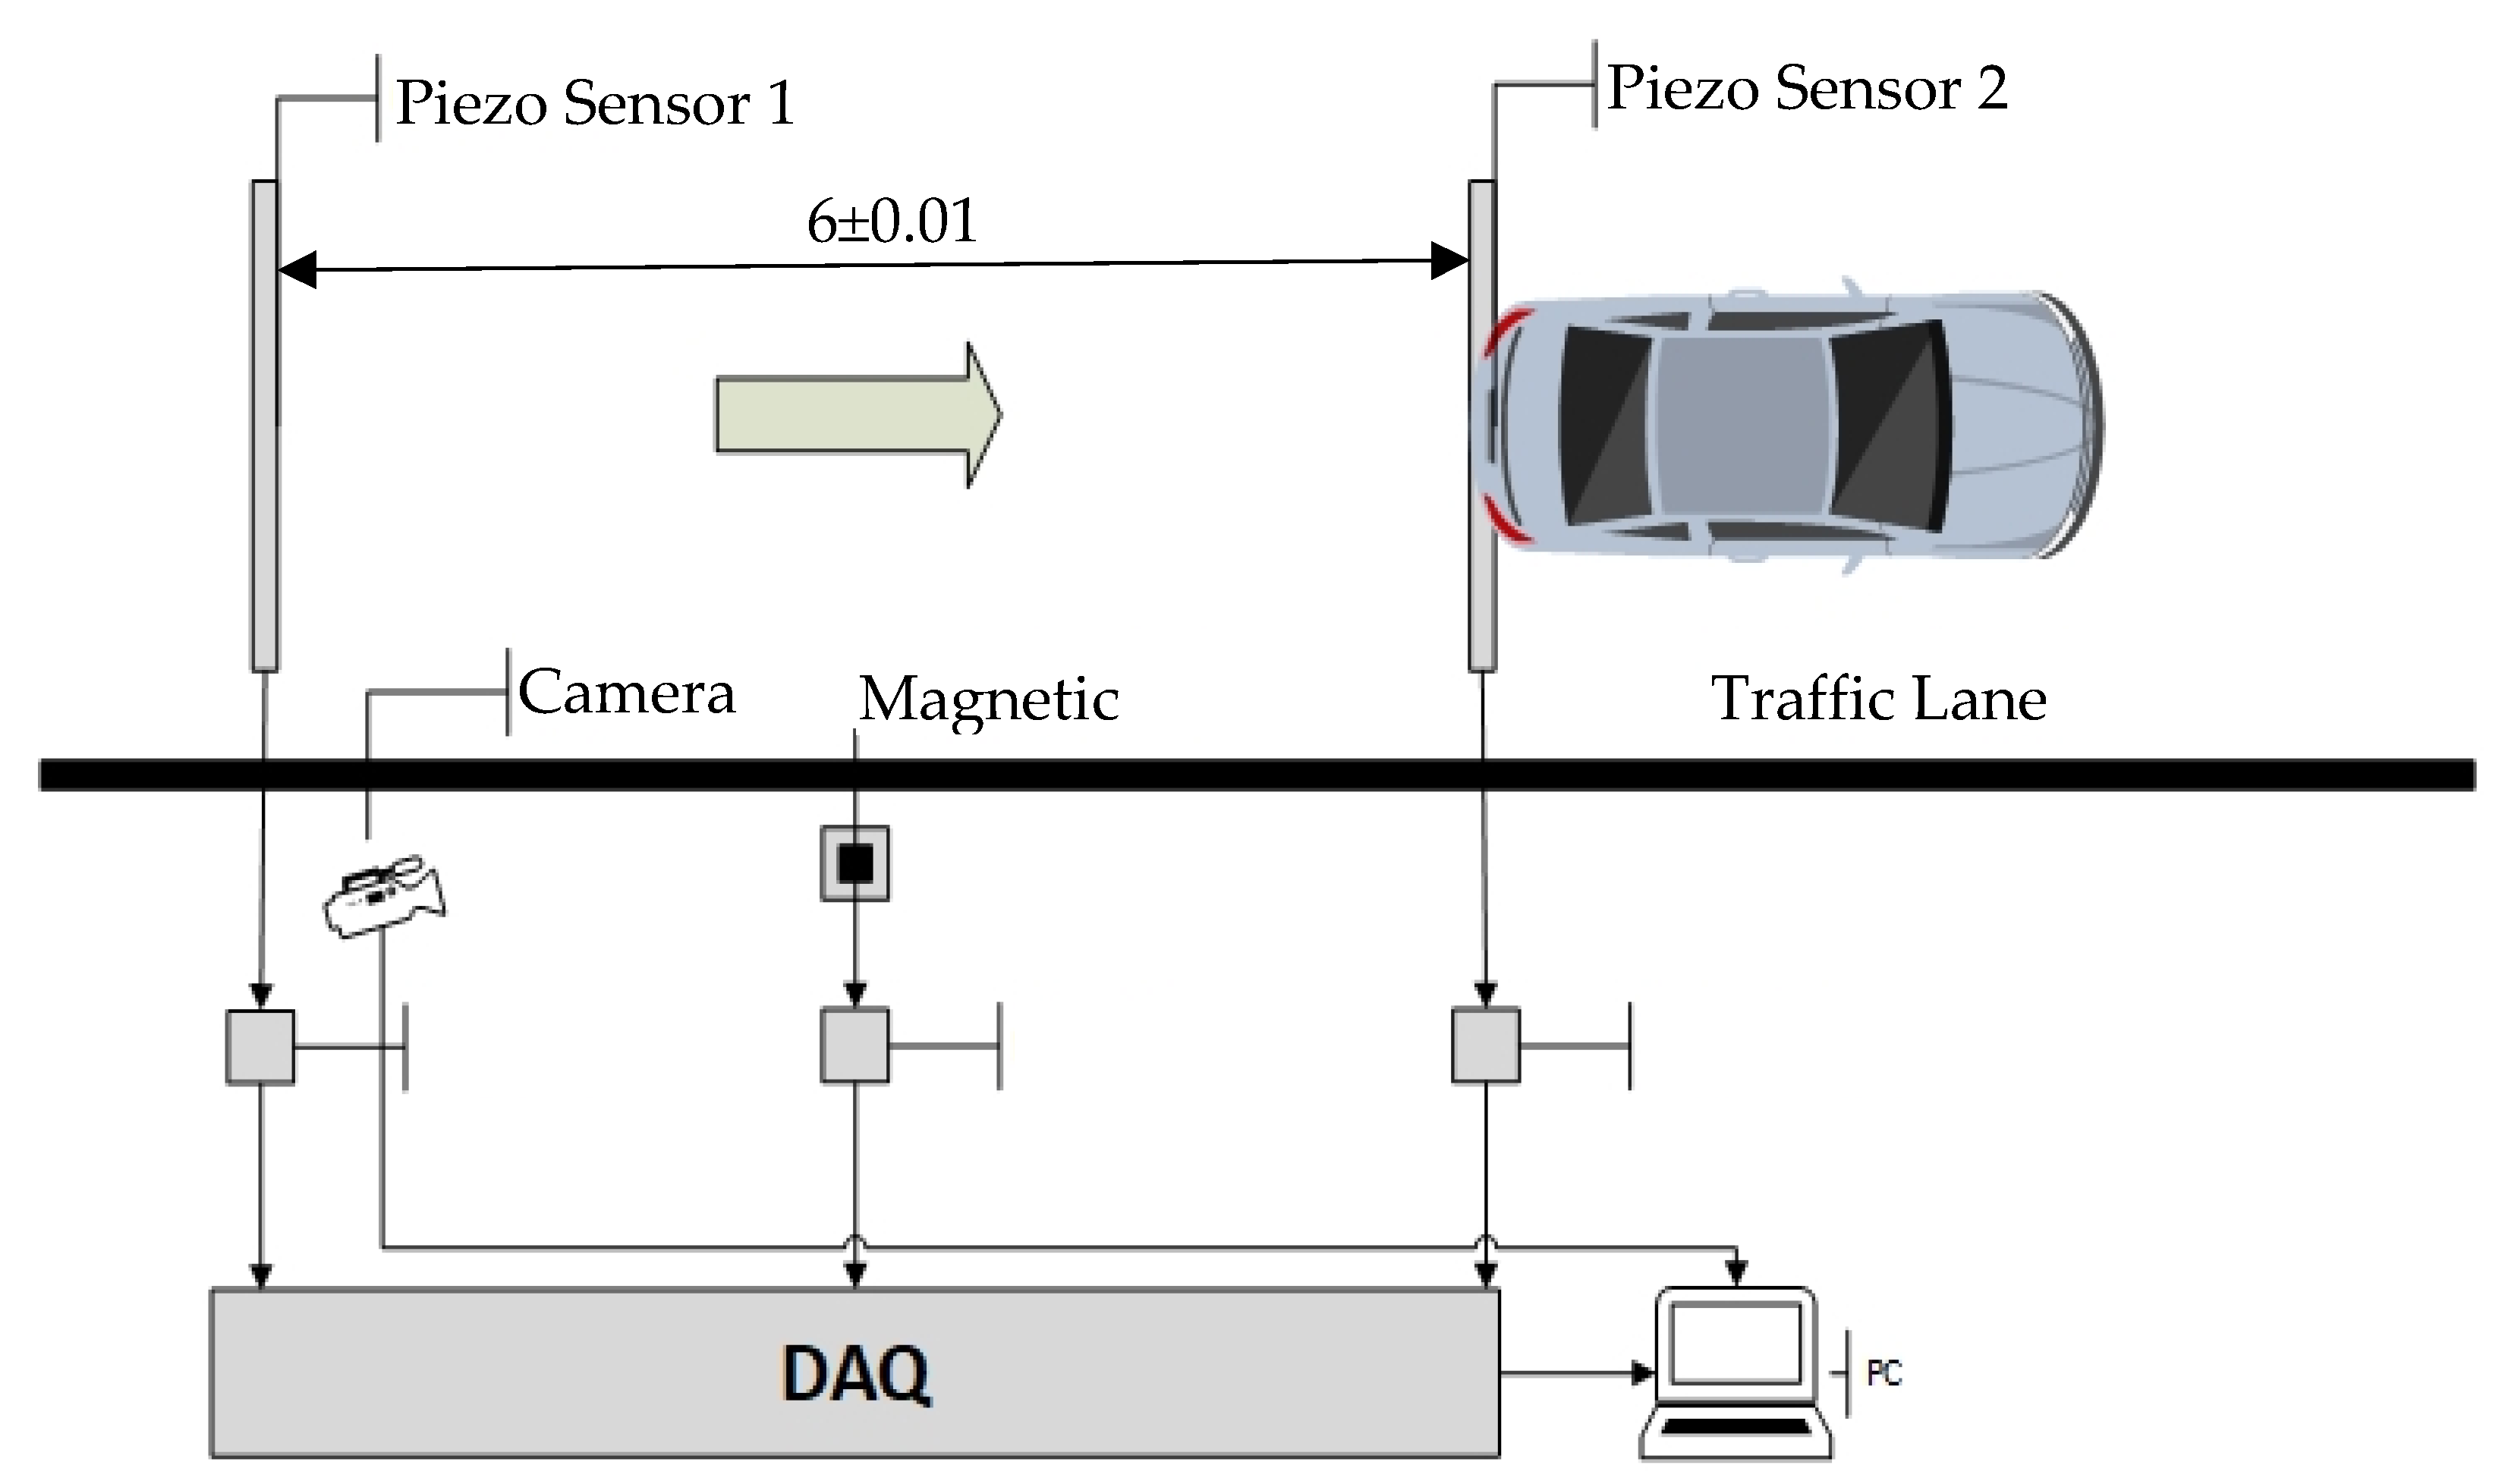
34]. To ensure the alignment of the different elements on the road, two laser levels and their signal receivers were used, ensuring an error of ± 0.01 m in the measurement of the distance between piezo sensors 1 and 2.
The test was carried out as shown in
Figure 18.
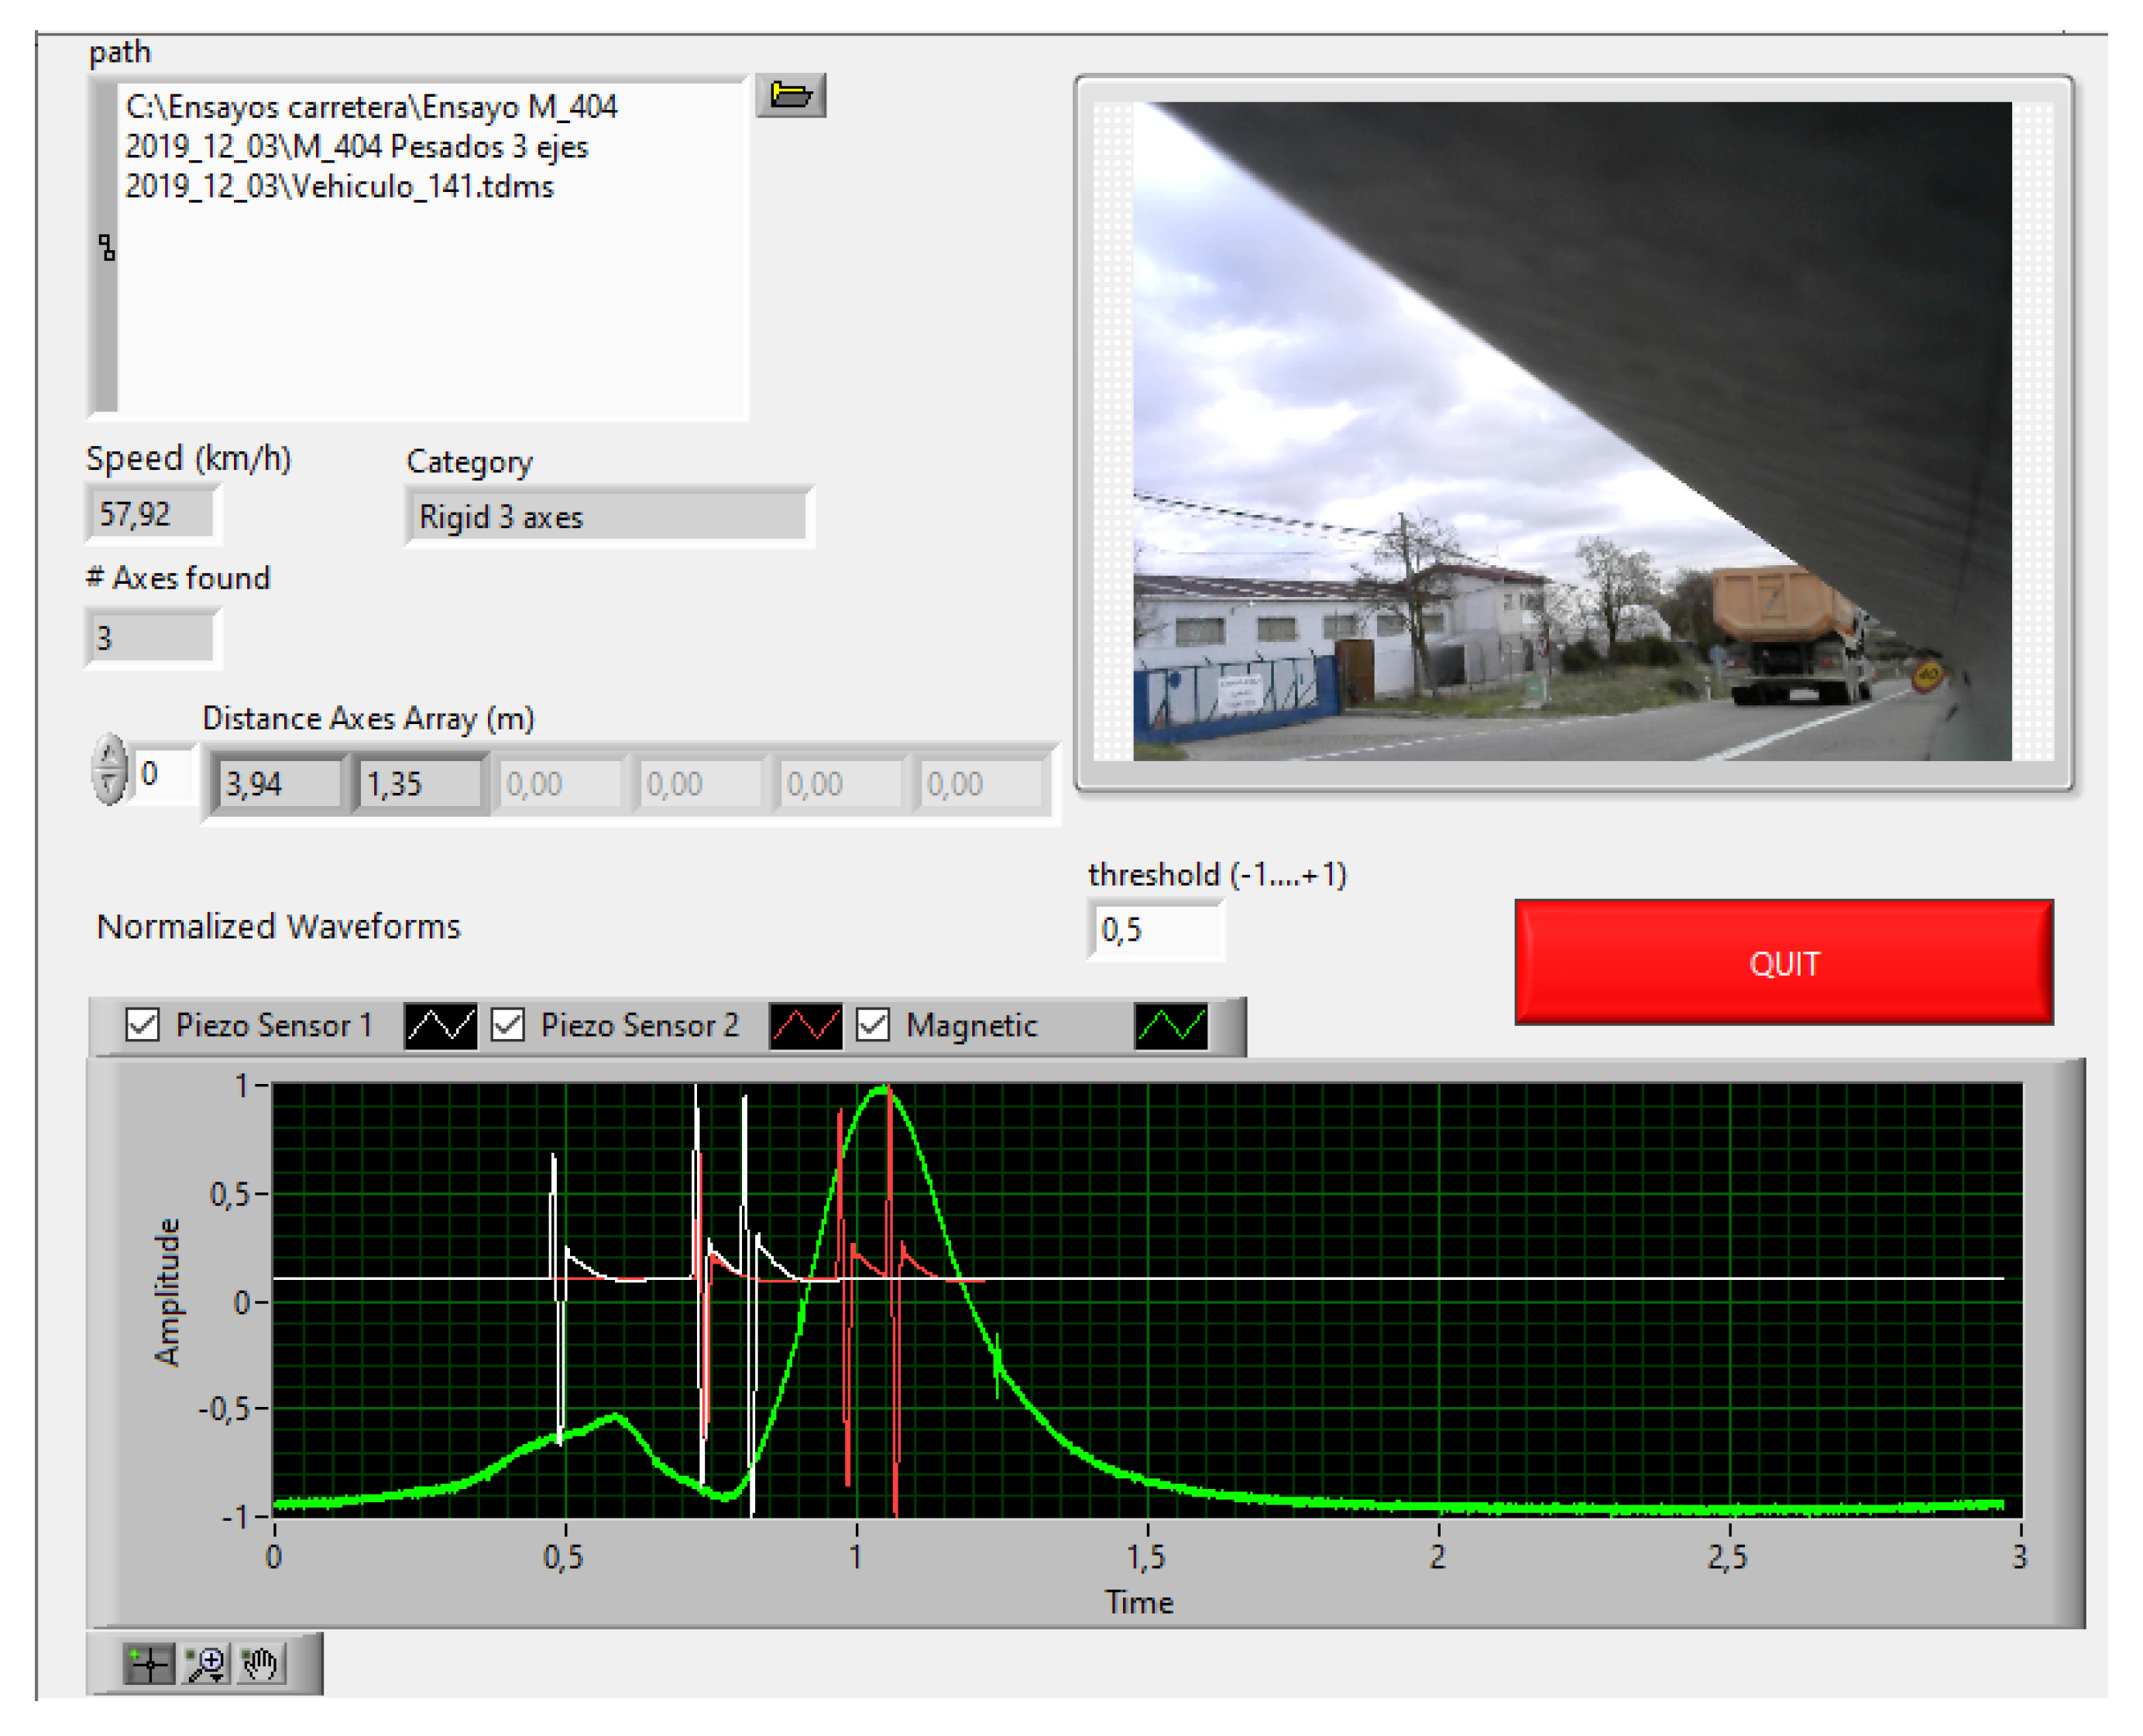
The piezo sensors were mounted non-intrusively (on the floor), and the piezo cable was covered with a ProTech-branded cable protector for the floor. Below is an example (
Figure 19) of a vehicle measurement, resulting in a “rigid truck (three axles)” classification.
5.2. Proccessing/Compute Time
LabVIEW
® profile performance [
35] was used to quantify the software processing time when performing the measurements.
In the measurement process, the execution times of the subVIS involved in the machine states were quantified when carrying out the measurement (see
Table 6). Ten runs were done to estimate the processing time.
Stand by status is a waiting status and does not affect the processing time to present the measurement.
Configure DAQ status is a state prior to reading the sensors and therefore does not affect processing.
Set–reset status is executed every time a measurement is made and has a fixed execution time of 25 ms, this is the time programmed for the digital pulse applied to the magnetic sensor.
The time between average measurements can be estimated as Tbetween measurements (ms) = 655 + 7.9 + 25 = 687.9
6. Error Estimation
This section concerns the estimation of the error in the measurements, speed and distances between the axles provided by the virtual instrument.
The sources of error were estimated based on the characteristics of the equipment used and tests carried out in the laboratory.
In terms of the speed measurement, three significant sources of error were determined:
Inaccuracy in the measurements between wires, db.
The different waveforms in the received signals, which can cause a maximum shift in the calculation of the cross correlation.
The error due to the signal sampling instant that can cause the maximum point of the cross correlation to be shifted by Ts = 1/fs, where fs is the sampling frequency for the acquisition of the analog signals from piezo sensor 1 and piezo sensor 2.
Regarding the wheelbase measurement, two significant sources of error were determined:
Table 7 and
Table 8 show the estimated errors for a two-axle vehicle with wheelbase 1 = 1.375 m and wheelbase 2 = 4375 m, respectively, for speeds between 25 km/h and 175 km/h. Loose error values are estimated for the above error sources, and these are as follows:
Distance between piezo sensors, db = 6 m. Errordb = ±0.01 m.
Error due to signal waveform, Errorwave = ±100 µs.
Error due to instant sampling, fs = 20 kHz. Two-sample error: Errorfs = ±100 µs.
The uncertainty in the calculation of Delayi,i + 1, ErrorDelayi,i + 1 = ±1 ms.
In order to estimate the errors due to unrecognized categories or wrong measurements (“Unknown” in
Figure 16. Category.vi.) the data from the road tests were analyzed. Two tests were carried out at road M-404 milestone 1 in Madrid (Spain) and two tests at road N-232 milestone 492 in Castilla-León. A total of 457 measurements were taken and the results are shown in
Table 9.
“Unknown measurement NO OK” is the set of vehicles that drove over only one of the piezo sensors (piezo sensor 1 or piezo sensor 2) or there was a wrong connection at the beginning of the test that was later resolved. Only three vehicles were detected that were not assigned to any category in
Table 5.
7. Conclusions
The designed and built virtual instrument is capable of performing the quasi-instantaneous classification of vehicles circulating on real traffic roads.
The installation can be performed in an intrusive way with a simple intervention on the pavement. A non-intrusive installation can also be carried out, as described in
Section 5.
The system is capable of taking measurements with a low level of error in speed measurements and an acceptable level of error in wheelbase measurements.
A classification strategy based on the vehicle wheelbase and number of axles was implemented, allowing for the rapid classification of the most common vehicle types.
A magnetic sensor was included, which generates a magnetic “footprint” that provides information about the type of vehicle. We are developing a line of research regarding this footprint, which complements the classification of the vehicles by category. The magnetic “footprint” can be used to elucidate doubtful cases that may arise in the analysis of the data measured with piezo sensors.
The built hardware and the commercial hardware used are basic performance equipment, so their prices are not high.
The design of the virtual instrument has a defined software architecture. A state machine was used and care was taken in the programming style so that the software is readable, expandable and maintainable. In fact, it would be easy to expand the software to replicate the system in all lanes of a road.
The virtual instrument’s user interface is user friendly and simple, making it easy for the system operator to use. The test results are exportable since the data are also saved in text format (ASCII).
Author Contributions
Conceptualization, F.J.J. and B.G.; methodology, F.J.J.; software, F.J.J.; validation, B.G., F.J.J. and J.D.F.; formal analysis, B.G.; investigation, B.G., F.J.J. and J.D.F.; resources, J.D.F., F.J.J. and B.G.; writing—original draft preparation, B.G. and F.J.J.; writing—review and editing, J.D.F.; visualization, B.G., F.J.J. and J.D.F. All authors have read and agreed to the published version of the manuscript.
Funding
This research received no external funding.
Conflicts of Interest
The authors declare no conflict of interest.
References
- Yin, J.; Chen, B.; Lai, K.R. Driver danger-level monitoring system using multi-sourced big driving data. IEEE Trans. Intell. Transp. Syst. 2019, 1–12. [Google Scholar] [CrossRef]
- Chen, J.; Zhou, H.; Zhang, N.; Xu, W.; Yu, Q.; Gui, L.; Shen, X. Service-oriented dynamic connection management for software-defined internet of vehicles. IEEE Trans. Intell. Transp. Syst. 2017, 18, 2826–2837. [Google Scholar] [CrossRef]
- Li, Y.; Qiao, Y.; Ruichek, Y. Multiframe-Based High Dynamic Range Monocular Vision System for Advanced Driver Assistance Systems. IEEE Sens. J. 2015, 15, 5433–5441. [Google Scholar] [CrossRef]
- Yin, J.; Chen, B.; Li, K.R.; Li, Y. Automatic Dangerous Driving Intensity Analysis for Advanced Driver Assistance Systems from Multimodal Driving Signals. IEEE Sens. J. 2018, 18, 4785–4794. [Google Scholar] [CrossRef]
- Zhang, W.; Wang, Q.; Suo, C. A Novel Vehicle Classification Using Embedded Strain Gauge Sensors. Sensors 2008, 8, 6952–6971. [Google Scholar] [CrossRef] [PubMed]
- Huang, Y.; Zheng, J.; Sun, S.; Yang, C.; Liu, J. Optimized YOLOv3 Algorithm and Its Application in Traffic Flow Detections. Appl. Sci. 2020, 10, 3079. [Google Scholar] [CrossRef]
- Klein, L.A.; Mills, M.K.; Gibson, D.R.P.; Federal Highway Administration and TFHRC. Traffic Detector Handbook Vol I and Vol II; Federal Highway Administration and TFHRC: McLean, VA, USA, 2006.
- Ramanathan, A.; Chen, M. Spatiotemporal vehicle tracking, counting and classification. In Proceedings of the 2017 IEEE Third International Conference on Multimedia Big Data, Laguna Hills, CA, USA, 19–21 April 2017. [Google Scholar]
- Kaewkamnerd, S.; Chinrungrueng, J.; Jaruchart, C. Vehicle classification with low computation magnetic sensor. In Proceedings of the 8th International Conference on ITS Telecommunication, Phuket, Thailand, 24 October 2008; pp. 164–169. [Google Scholar]
- Mone, G. The New Smart Cities. Commun. ACM. 2015, 58, 20–21. [Google Scholar] [CrossRef]
- Peña-González, R.H.; Nuño-Maganda, M.A. Computer vision based real-time vehicle tracking and classification system. In Proceedings of the IEEE 57th International Midwest Symposium on Circuits and Systems (MWSCAS), College Station, TX, USA, 3–6 August 2014. [Google Scholar]
- Liu, H.; Ma, J.; Xu, T.; Yan, W.; Ma, L.; Zhang, X. Vehicle detection and classification using distributed fiber optic acoustic sensing. IEEE Trans. Veh. Technol. 2020, 69, 1363–1374. [Google Scholar] [CrossRef]
- Available online: https://www.ni.com/es-es/innovations/white-papers/06/virtual-instrumentation.html. (accessed on 13 August 2020).
- NIWeek 2003, The Worldwide Conference on Virtual Instrumentation. Show Daily, 14 August 2003.
- Markevicius, V.; Navikas, D.; Zilys, M.; Andriukaitis, D.; Valinevicius, A.; Cepenas, M. Dynamic vehicle detection via the use of magnetic field sensors. Sensors 2016, 16, 78. [Google Scholar] [CrossRef] [PubMed]
- Markevicius, V.; Navikas, D.; Idzkowski, A.; Miklusis, D.; Andriukaitis, D.; Valinevicius, A.; Zilys, M.; Cepenas, M.; Walendziuk, W. Vehicle speed and length estimation errors using the intelligent transportation system with a set of anisotropic magneto-resistive (AMR) sensors. Sensors 2019, 19, 5234. [Google Scholar] [CrossRef] [PubMed]
- Nedoma, J.; Fajkus, M.; Martinek, R.; Vanus, J.; Kepak, S.; Kahankova, R.; Jaros, R.; Cvejn, D.; Prauzek, M. Analysis of the use of fiber-optic sensors in the road traffic. IFAC-PapersOnLine 2018, 51, 420–425. [Google Scholar] [CrossRef]
- Vázquez-Rodríguez, M. Contribución al Estudio de la Generación de Energía Eléctrica a Partir de Materiales Piezoeléctricos. Ph.D. Thesis, Universidad Politécnica de Madrid, Madrid, Spain, 2019. [Google Scholar]
- Vázquez-Rodríguez, M.; Jiménez, F.J.; de Frutos, J.; Alonso, D. Piezoelectric energy harvesting computer-controlled test bench. Rev. Sci. Instrum. 2016, 87, 095004. [Google Scholar] [CrossRef] [PubMed]
- Vázquez-Rodríguez, M.; Jiménez, F.J.; de Frutos, J. Virtual instrument to obtain electrical models of piezoelectric elements used in energy harvesting. Adv. Appl. Ceram. 2018, 117, 201–211. [Google Scholar] [CrossRef]
- Vázquez-Rodríguez, M.; Jiménez, F.; Pardo, L.; Ochoa, P.; González, A.; de Frutos, J. A New Prospect in Road Traffic Energy Harvesting Using Lead-Free Piezoceramics. Materials 2019, 12, 3725. [Google Scholar] [CrossRef] [PubMed]
- Available online: https://www.te.com/usa-en/product-1005801-1.html (accessed on 13 August 2020).
- Zhou, G.; Zhao, Y.; Guo, F.; Xu, W. A Smart High Accuracy Silicon Piezoresistive Pressure Sensor Temperature Compensation System. Sensors 2014, 14, 12174–12190. [Google Scholar] [CrossRef] [PubMed]
- Honeywell. 3-Axis Magnetic Sensor Hybrid Datasheet HMC2003; Honeywell: Charlotte, NC, USA, 2011. [Google Scholar]
- Honeywell. Application Note AN213; Honeywell: Charlotte, NC, USA, 2011. [Google Scholar]
- Available online: https://www.ni.com/es-es/innovations/white-papers/09/ni-data-acquisition--the-accuracy-and-performance-difference.html (accessed on 13 August 2020).
- Available online: https://www.ni.com/pdf/manuals/375195d.pdf (accessed on 13 August 2020).
- Travis, J.; Kring, J. LabVIEW for Everyone: Graphical Programming Made Easy and Fun, 3rd ed.; Prentice Hall: Upper Saddle River, NJ, USA, 2006; Chapter 1 What is the world is LabVIEW? pp. 27–33. ISBN 0131856723. [Google Scholar]
- Application Design Patterns: State Machines. Available online: http://www.ni.com/white-paper/3024/en/ (accessed on 13 August 2020).
- Markevicius, V.; Navikas, D.; Idzkowski, A.; Andriukaitis, D.; Valinevicius, A.; Zilys, M. Practical methods for vehicle speed estimation using a microprocessor-embedded system with AMR sensors. Sensors 2018, 18, 2225. [Google Scholar] [CrossRef] [PubMed]
- Jacovitti, G.; Scarano, G. Discrete time techniques for time delay estimation. IEEE Trans. Signal Process 1993, 41, 525–533. [Google Scholar] [CrossRef]
- Zhu, H.; Yu, F. A Cross-Correlation Technique for Vehicle Detections in Wireless Magnetic Sensor Network. IEEE Sens. J. 2016, 16, 4484–4494. [Google Scholar] [CrossRef]
- Wang, H.; He, S.; Yu, J.; Wang, L.; Liu, T. Research and Implementation of Vehicle Target Detection and Information Recognition Technology Based on NI myRIO. Sensors 2020, 20, 1765. [Google Scholar] [CrossRef] [PubMed]
- American Society for Testing and Materials. ASTM E1318-09; American Society for Testing and Materials: West Conshohocken, PA, USA, 2017. [Google Scholar]
- Available online: https://zone.ni.com/reference/en-XX/help/371361R-01/lvconcepts/using_profile_window/ (accessed on 13 August 2020).
Figure 1.
Block diagram of the measurement system. Software (SW): Virtual instrument software. Hardware (HW): Transducer, Data Acquisition (DAQ) module, signal conditioners, camera.
Figure 1.
Block diagram of the measurement system. Software (SW): Virtual instrument software. Hardware (HW): Transducer, Data Acquisition (DAQ) module, signal conditioners, camera.
Figure 2.
Installation model for the measuring system.
Figure 2.
Installation model for the measuring system.
Figure 3.
20 AWG Cable—Spiral wrap.
Figure 3.
20 AWG Cable—Spiral wrap.
Figure 4.
Sensor response signal (V) when sensors are driven over by a vehicle.
Figure 4.
Sensor response signal (V) when sensors are driven over by a vehicle.
Figure 5.
HMC2003 block diagram.
Figure 5.
HMC2003 block diagram.
Figure 6.
HMC2003 set–reset.
Figure 6.
HMC2003 set–reset.
Figure 7.
Magnetic sensor signal (V) and piezo sensors (V) in a three axles vehicle.
Figure 7.
Magnetic sensor signal (V) and piezo sensors (V) in a three axles vehicle.
Figure 8.
Data acquisition (DAQ) module National Instruments USB 6211 specifications.
Figure 8.
Data acquisition (DAQ) module National Instruments USB 6211 specifications.
Figure 9.
Hardware system: (a) sensor signal conditioning and Data Acquisition (DAQ) modules; (b) piezo sensor attenuators, magnetic sensor connections, camera and PC.
Figure 9.
Hardware system: (a) sensor signal conditioning and Data Acquisition (DAQ) modules; (b) piezo sensor attenuators, magnetic sensor connections, camera and PC.
Figure 10.
(a) State machine LabVIEW pattern. (b) Typical example of a state diagram.
Figure 10.
(a) State machine LabVIEW pattern. (b) Typical example of a state diagram.
Figure 11.
State diagram of virtual instrument.
Figure 11.
State diagram of virtual instrument.
Figure 12.
Signal of piezo sensor 1 and signal of piezo sensor 2. Two-axis vehicle.
Figure 12.
Signal of piezo sensor 1 and signal of piezo sensor 2. Two-axis vehicle.
Figure 13.
High-accuracy speed measurement, Cross correlation.vi.
Figure 13.
High-accuracy speed measurement, Cross correlation.vi.
Figure 14.
Cross correlation for signal piezo sensor 1 and signal piezo sensor 2.
Figure 14.
Cross correlation for signal piezo sensor 1 and signal piezo sensor 2.
Figure 15.
Axles distance.vi.
Figure 15.
Axles distance.vi.
Figure 17.
Urban/subcompact. Front panel of the virtual instrument. Amplitude signals normalized to ±1.
Figure 17.
Urban/subcompact. Front panel of the virtual instrument. Amplitude signals normalized to ±1.
Figure 18.
Testing system installed on road.
Figure 18.
Testing system installed on road.
Figure 19.
Three rigid axles. Front panel of virtual instrument. Amplitude signals normalized to ± 1.
Figure 19.
Three rigid axles. Front panel of virtual instrument. Amplitude signals normalized to ± 1.
Table 1.
Piezoelectric performance specifications.
Table 1.
Piezoelectric performance specifications.
| Properties | Value | Units |
|---|
| Outside Diameter | 2.69 | mm |
| Center Core | 1.02 | mm |
| Capacitance @ 1 kHz | 950 | pF/m |
| Resistance (shield) | 47 | Ω/km |
| Hydrostatic Piezo Coefficient | 20 | pC/N |
| Resistance (Center Core) | 31 | Ω/km |
Table 2.
HMC2003 performance specifications.
Table 2.
HMC2003 performance specifications.
| Properties | Min | Typ | Max | Units |
|---|
| Sensitivity | 0.98 | | | V/Gauss |
| Null Field Output | 2.3 | 2.5 | 2.7 | V |
| Resolution | 40 | μGauss |
| Field Range | −2 | | 2 | Gauss |
| Output Voltage | 0.5 | | 4.5 | V |
| Bandwidth | 1 | kHz |
Table 3.
National Instruments USB 6211 specifications.
Table 3.
National Instruments USB 6211 specifications.
| I/O | Value | Units |
|---|
| Analog Inputs | Eight differential or 16 single-ended | - |
| Analog Input Resolution | 16 | bits |
| Input Range | ±10 | V |
| Maximum Input Rate | 250 | KS/s |
| Analog Outputs | 2 | |
| Maximum Output Rate | 250 | KS/s |
| Maximum Output Range Rate | 10 | V |
| Digital Inputs | 4 | |
| Digital Outputs | 4 | |
Table 4.
Virtual instrument states.
Table 4.
Virtual instrument states.
| Name | Description/Function | Next State |
|---|
| Set Parameters | Set configuration and test parameters | No Error: Configure DAQ
Error: Quit |
| Configure DAQ | Configure the hardware system | No Error: Set–Reset
Error: Quit |
| Set–Reset | Set a pulse signal to magnetize the magnetic sensor | No Error: Stand by
Error: Configure DAQ |
| Stand by | Wait for vehicle detection | No Error: Read Barriers (if vehicle detected)
Error: Configure DAQ |
| Read Piezo | Measure the piezo sensors
These signals will be used in the next state to calculate the vehicle speed
Give order to take photo | No Error: Analysis
Error: Configure DAQ |
| Analyze | Calculate the vehicle speed (high accuracy)
Calculate the axis distance and vehicle category
Present and save data measurement | No Error: Set–Reset
Error: Configure DAQ |
| Take Photo | Parallel process execution so as not to interfere with the rest of the actions in the IV | Waiting for next order to take photo |
| Quit | Release resources in an orderly manner and finish the IV
There is a quit “button” on the front panel of the IV | No Error: Read Barriers (if vehicle detected)
Error: Configure DAQ |
Table 5.
Axle distance category table (wheelbase).
Table 5.
Axle distance category table (wheelbase).
| Vehicle Type | Wheelbase 1 (mm) | Wheelbase 2 (mm) | Wheelbase 3 (mm) | Wheelbase 4 (mm) | Wheelbase 5 (mm) |
|---|
| Motorcycle | 1305–1695 | | | | |
| Urban/subcompact tourism | 2425–2563 | | | | |
| Hatchback/sedan | 2636–2770 | | | | |
| Big sedan | 2820–2924 | | | | |
| Bus (two axles) | 5770–6080 | | | | |
| Bus (three axles) | 6090–7140 | 1350–1600 | | | |
| Articulated bus (two axles) | 5980–6028 | 6480–6540 | | | |
| Industrial VAN | 3000–4750 | | | | |
| Rigid truck (two axles) | 4200–5950 | | | | |
| Rigid truck (three axles) | 4200–4500 | 1250–1500 | | | |
| Rigid truck (four axles) | 1700–1900 | 2500–3000 | 1250–1500 | | |
| Articulated truck (four axles) | 2990–3900 | 4250–6250 | 1200–1350 | | |
| Articulated truck (five axles) | 2990–3900 | 4250–6250 | 1200–1350 | 1200–1350 | |
| Articulated truck (six axles) | 2990–3900 | 4250–6250 | 1200–1350 | 1200–1350 | 1200–1350 |
Table 6.
Profile performance.
Table 6.
Profile performance.
| State | #Runs | Average
(ms) | Shortest
(ms) | Longest
(ms) |
|---|
| Read Piezos | It depends on the speed of the vehicle, stop when piezo sensor 2 is driven over |
| Analyze | 10 | 7.9 | 7.4 | 8.3 |
| Take photo | 10 | 655 | 621 | 680 |
Table 7.
Speed measurement error estimation.
Table 7.
Speed measurement error estimation.
| Vehicle Speed (km/h) | Errordb (%) | Errorwave (%) | Errorfs (%) | Errorspeed (%) | Errorspeed (km/h) |
|---|
| 25 | 0.013 | 0.012 | 0.012 | 0.024 | 0.006 |
| 50 | 0.013 | 0.023 | 0.023 | 0.036 | 0.018 |
| 75 | 0.013 | 0.035 | 0.035 | 0.048 | 0.036 |
| 100 | 0.013 | 0.046 | 0.046 | 0.059 | 0.059 |
| 125 | 0.013 | 0.058 | 0.058 | 0.071 | 0.088 |
| 150 | 0.013 | 0.069 | 0.069 | 0.082 | 0.123 |
| 175 | 0.013 | 0.081 | 0.081 | 0.094 | 0.164 |
Table 8.
Wheelbase measurement error estimation.
Table 8.
Wheelbase measurement error estimation.
| Vehicle Speed (km/h) | Errorspeed (%) | ErrorDelay1,2 (%) | ErrorWheelbase 1 (%) | ErrorWheelbase 1 (m) | ErrorDelay2,3 (%) | ErrorWheelbase 2 (%) | ErrorWheelbase 2 (m) |
|---|
| 25 | 0.024 | 0.505 | 0.529 | 0.007 | 0.159 | 0.183 | 0.003 |
| 50 | 0.036 | 1.010 | 1.046 | 0.014 | 0.317 | 0.353 | 0.005 |
| 75 | 0.048 | 1.515 | 1.563 | 0.021 | 0476 | 0.524 | 0.007 |
| 100 | 0.059 | 2.020 | 2.079 | 0.029 | 0.635 | 0.694 | 0.010 |
| 125 | 0.071 | 2.525 | 2.596 | 0.036 | 0.794 | 0.864 | 0.012 |
| 150 | 0.082 | 3.030 | 3.113 | 0.043 | 0.952 | 1.035 | 0.014 |
| 175 | 0.094 | 3.535 | 3.629 | 0.050 | 1.111 | 1.205 | 0.017 |
Table 9.
Classification results with real traffic.
Table 9.
Classification results with real traffic.
| | #Vehicles | Category “In Range” | Category “Unknown” Measurement OK | Category “Unknown” Measurement NO OK | Unknown
(%) | Successful
(%) |
|---|
| Test 1 | 42 | 38 | 0 | 4 | 10% | 90% |
| Test 2 | 214 | 201 | 2 | 11 | 6% | 94% |
| Test 3 | 61 | 60 | 0 | 1 | 2% | 98% |
| Test 4 | 140 | 138 | 1 | 2 | 2% | 98% |
© 2020 by the authors. Licensee MDPI, Basel, Switzerland. This article is an open access article distributed under the terms and conditions of the Creative Commons Attribution (CC BY) license (http://creativecommons.org/licenses/by/4.0/).
