6.1. Personalization of Training Session
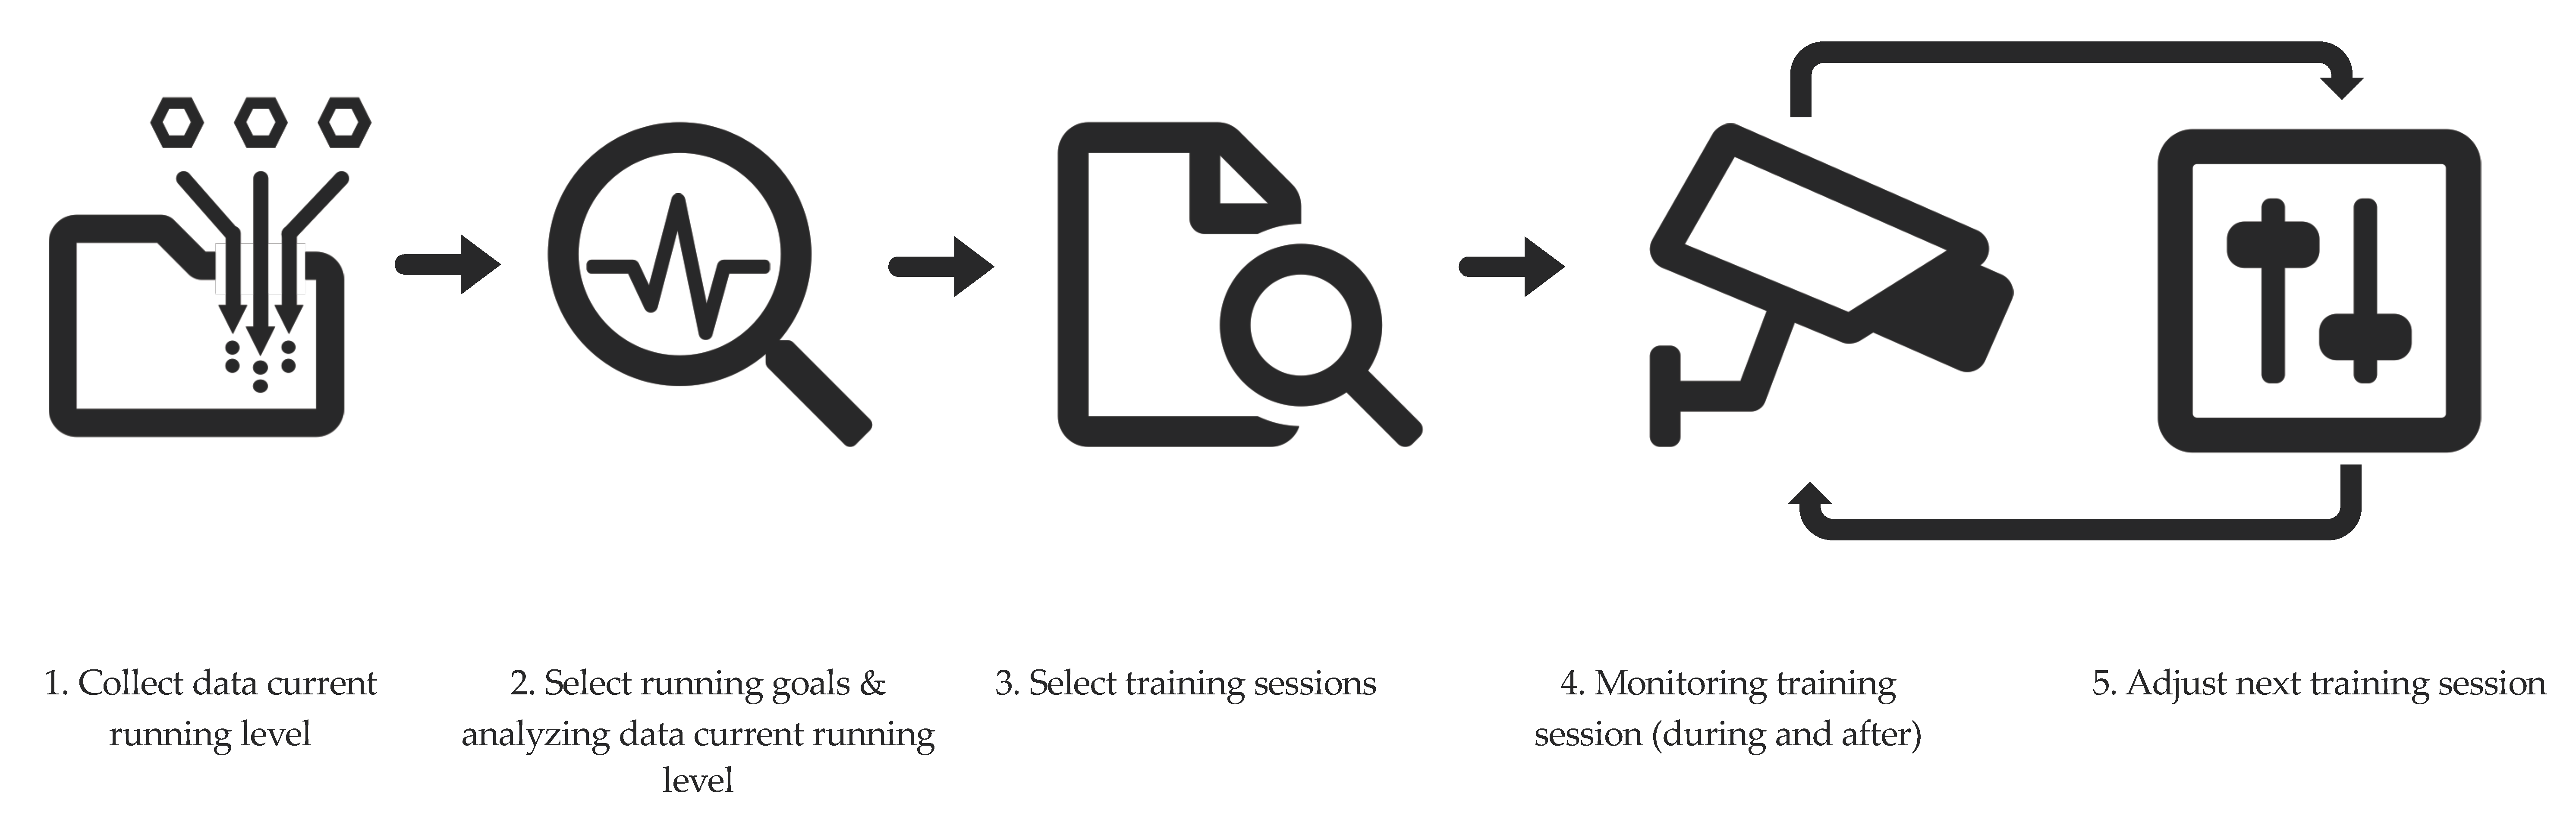
Inspirun was designed to provide personalized training schemes based on biofeedback, GPS-data, and RPE. The present paper gave a detailed description of the working mechanism; the personalized coaching approach with the automatic adaptation of training schemes based on biofeedback and GPS-data, and aimed to give insight into how end-users experience this working.
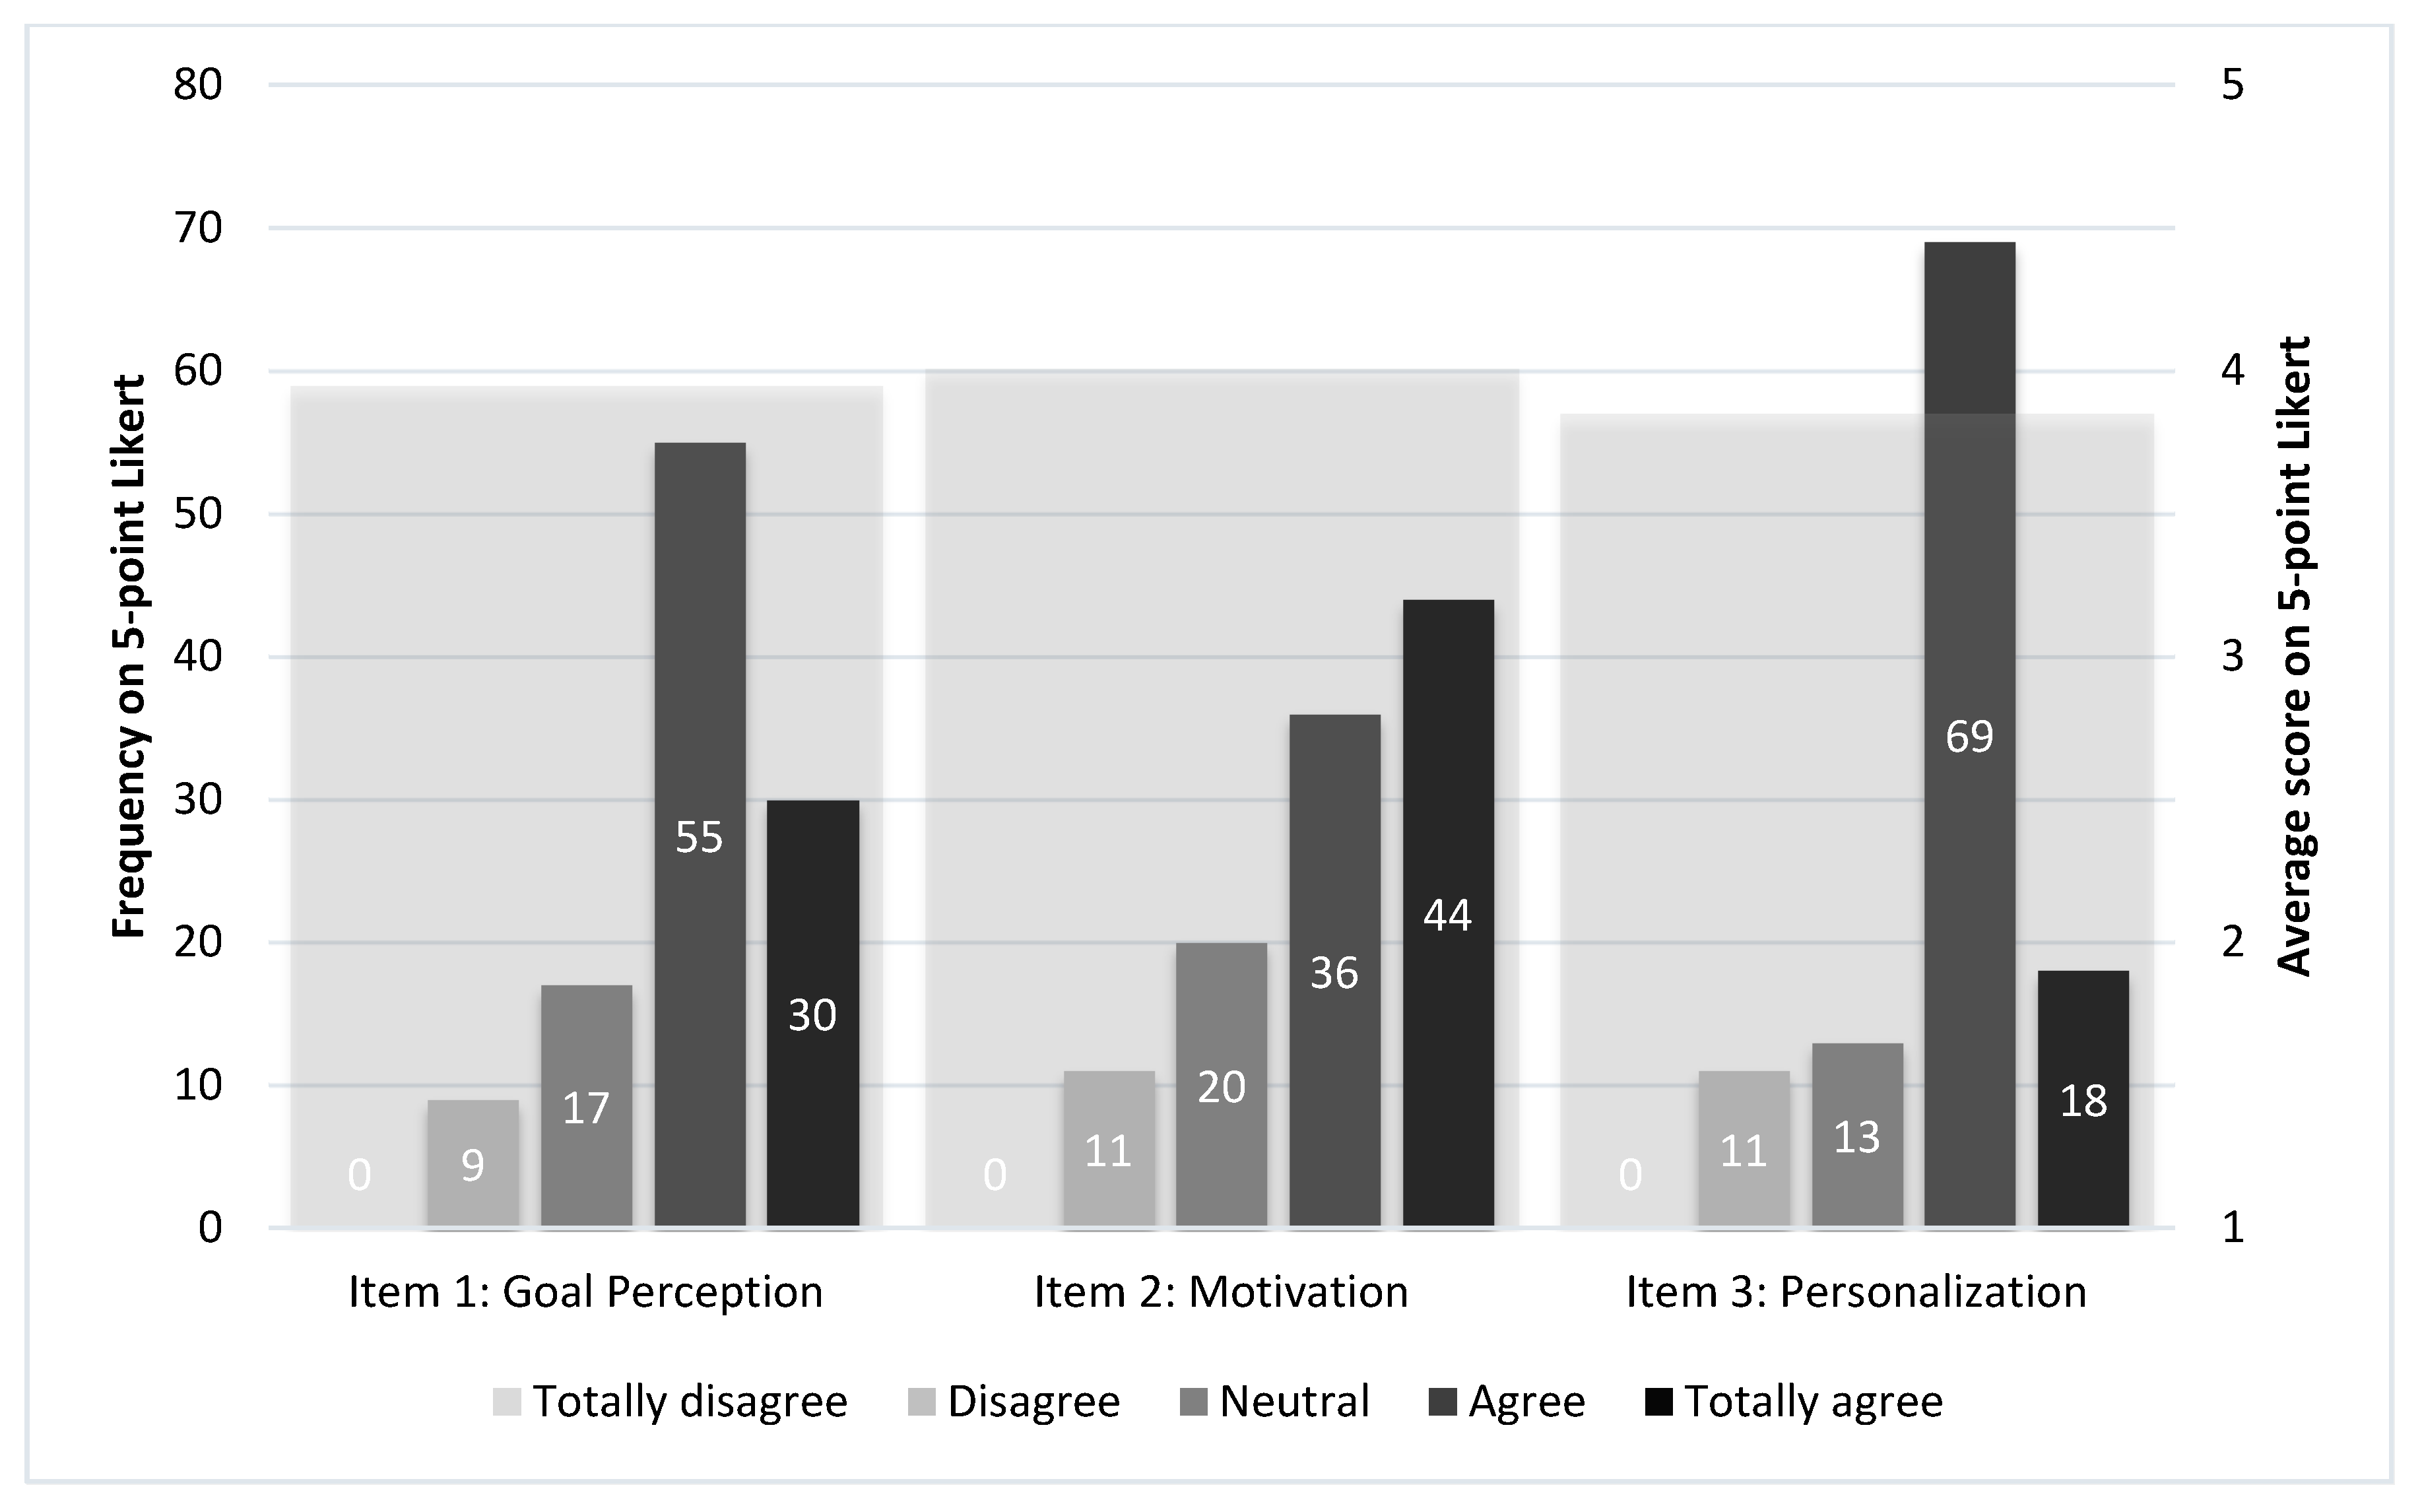
The primary conclusion of this study is that the working mechanism (if provided with accurate data) automatically adapts training sessions to the runners’ physical workload and stimulates runners’ goal perception, motivation, and experienced personalization.
Our user study revealed that in general, the personalization of the intensity of the training sessions was experienced as personalized by the participants. Participants, whose data collected with the app was complete and without flaws and gaps, found that the sessions were accurate, and experienced them as personalized. We expected that using generally accepted training principles (i.e., individualization, progression, overload, variation, and objective and subjective monitoring) to personalize and adjust the session would works. In line with Van Hooren et al. [
11] who stated that workload can be used as characteristics to personalize. Indeed, our findings confirm that building a feature that personalizes the workload (PRP) on both subjective (RPE) and objective (HR and Speed) aspects of intensity seems to be a good combination to develop a mechanism that is sensible for change and is robust enough to deal with fluctuation between sessions. We used personalization as a persuasive feature derived from the Persuasive Systems Design (PSD) model [
13], in which personalization is a feature that is not often used in persuasive design, despite its potential [
12].
For runners whose data collected by the app was incomplete or inaccurate, the mechanism was not perceived as personalized. This is in line with challenges described in previous research, for example, Seshadri et al. [
35] showed that when developing sensor technology we should design robust and easy-to-wear systems with improved signal to noise ratios. Wan an et al. [
36] stated that there are still many challenges before the actual implementation of technology in practical applications, they also refer to noisy signals and challenging issues regarding the power source. Specht et al. [
37] investigated satellite-based solutions to identify positioning (time, distance, and speed) and found that the existing systems (e.g., GPS) are not accurate. Especially when more intense activities are performed, the processing of raw data needs to improve in order to provide accurate and meaningful feedback [
38]. In our case, running can be classified as intense activity-gaps in heart rate data caused problems in the automatic calculation of the next session.
For example, some runners had problems with the Bluetooth connection between the heart rate monitor and their phone. While running, the Bluetooth connection was lost, and the app did not collect heart rate data. Instead it writes zeros in the dataset. In most cases, this caused a much lower average heart rate over a training block (due to many zeros). Consequently, making the app think that the automatically generated heart rates were too high in relation to running speed and RPE. The same goes for inaccuracies in running speed. Runners experienced some problems when running in wooded and hilly areas, resulting in mostly lower speeds than expected, making the app think that the session was too challenging to complete when this was actually due to the environment (i.e., sandy surfaces, altimeters) accuracy of the GPS signal (i.e., cutting corners, densely vegetated areas). The mechanism of creating automatically and personalized training sessions thus seems to work when provided with complete and accurate data, although the robustness of the mechanism, especially how it deals with flaws in the dataset needs improvements. In future work, first of all, the Bluetooth connection must be improved. Second, to make the mechanism more robust, the algorithm must be adjusted so that incomplete datasets (e.g., with too many zeros) are not used or used differently in the PRP.
6.2. Motivation to Keep Running
On average, the participants were quite positive about the influence on the app on their motivation to keep running. The open-ended question revealed that the reasons for scoring lower on motivation are essentially the same as the reasons that lowered the experienced personalization. In both cases, the bug that caused disconnection of the heart rate monitor and the resulting incomplete and inaccurate data were mentioned. Therefore, we expected that personalization and motivation influenced each other, both negatively as positively. Based on the Self Determination Theory [
39] and the Fogg Behavior Model [
40], we argue that sessions that match with the physical capacity of the runner are more fun to complete, giving the runner a sense of achievement, and increasing the motivation to keep running and challenging themselves. While sessions that are too easy or too hard are not fun to complete and negatively influence the intentions to keep running.
A correlation revealed a relation between experience personalization (item 3) and motivation (item 2). If scores on experience personalization increased, in 32% of the cases the score on motivation increased too (or the other way around). As this only explained one-third of the variance, there must be more underlying reasons and variables that explain variances in the scores. We did not include items on injuries, yet we know from literature (e.g., [
41]) that having an injury (i.e., being not fit) negatively influences the motivation. Finally, in future work, we see many opportunities to further improve the app by exploring features that could increase the autonomy of the runner or enhance social cohesion. Since for now the app strongly focusses on enhancing the (self) competence of the runner.
6.3. Limitations and Future Work
In this study, we faced some technical challenges, like the inaccuracy of the data, due to Bluetooth disconnections. A solution here might be technical improvements. We logged all data with the app, so hopefully, future analysis on that data can find the causes of the random disconnections. Another solution might be implementing a warning signal when data is inaccurate and that the runner must reconnect otherwise the app stops recording the training session. Or allowing the user to remove flawed data, using a more user-centered approach. Therefore, we could make the mechanism more robust, and the algorithm must be adjusted so that incomplete datasets (e.g., with too many zeros) are not used or used differently in the PRP. New ‘rules’ should be constructed and programmed before further testing among runners so time gaps between sessions should be taken into consideration. The Inspirun does not detect time gaps between sessions (e.g., four weeks of no training between session 5 and 6) and therefore it does not take into account potential detraining effects. Furthermore, in line with the third guideline ‘how to design for runners’ described by Knaving et al. [
24], who advised building systems that strengthen the runners’ intrinsic motivations, which is the most autonomous form of motivation within the Self Determination Theory [
39], we see a lot of opportunities to improve the personalization of the app by giving more autonomy to the runner or stimulate social-support. For example, the option to choose different types of training sessions, or choosing between two sessions that are preselected by the app or sharing sessions with others. Finally, in the current version, an average of six sessions is used to calculate the PRP, given the feedback of several runners that they thought that Inspirun was adjusting in a slightly too conservative (too slow) way, in future iterations the possibility to personalize how the Inspirun adjusts, especially for those runners who adapt better or faster to the stimuli could be explored. A solution here might be technical (improving the technology) or user-centered (giving control to a user to remove flawed data).
Besides the above mentioned technical limitations and future work recommendations, there are also methodological recommendation for future work. In this study we aimed to give insight into how end-users experience the working mechanism of Inspirun. In future work it could be interesting to look into the effect of Inspirun on aspects such as performance, motivation, and injury-free running, compared to other interventions (such as other apps or standardized training schemes).
6.4. Conclusions
Inspirun was designed to provide personalized training schemes based on biofeedback, GPS-data, and RPE. The primary conclusion of this study is that the working mechanism (if provided with accurate data) automatically adapts training sessions to the runners’ physical workload and stimulates runners’ goal perception, motivation, and experienced personalization.
With our work, we attempted to make optimal use of the potential of wearable technology to support runners. In particular, the large group of novice or less experienced runners who lack guidance. This work also contributes to the emerging area of designing for running and wearable technology trends by providing working mechanisms that are applicable to other technologies, wearables, and types of sports. Consequently, we hope that runners profit from technologies like the Inspirun to run injury-free and keep motivated.

 ,
, 


