Enabling Older Adults’ Health Self-Management through Self-Report and Visualization—A Systematic Literature Review †


Abstract
1. Introduction
2. Research Methods
2.1. Literature Search Strategy
- RQ1 Which health information about older adults is usually monitored?
- RQ2 What type of mobile technology is used by older adults to record and display health information?
- -
- Do mobile health technologies for older adults include self-reporting?
- -
- Do mobile health technologies for older adults include data visualization?
- RQ3 How are mobile health technologies for older adults evaluated?
2.2. Search Terms
2.3. Study Selection
2.4. Data Extraction
3. Results
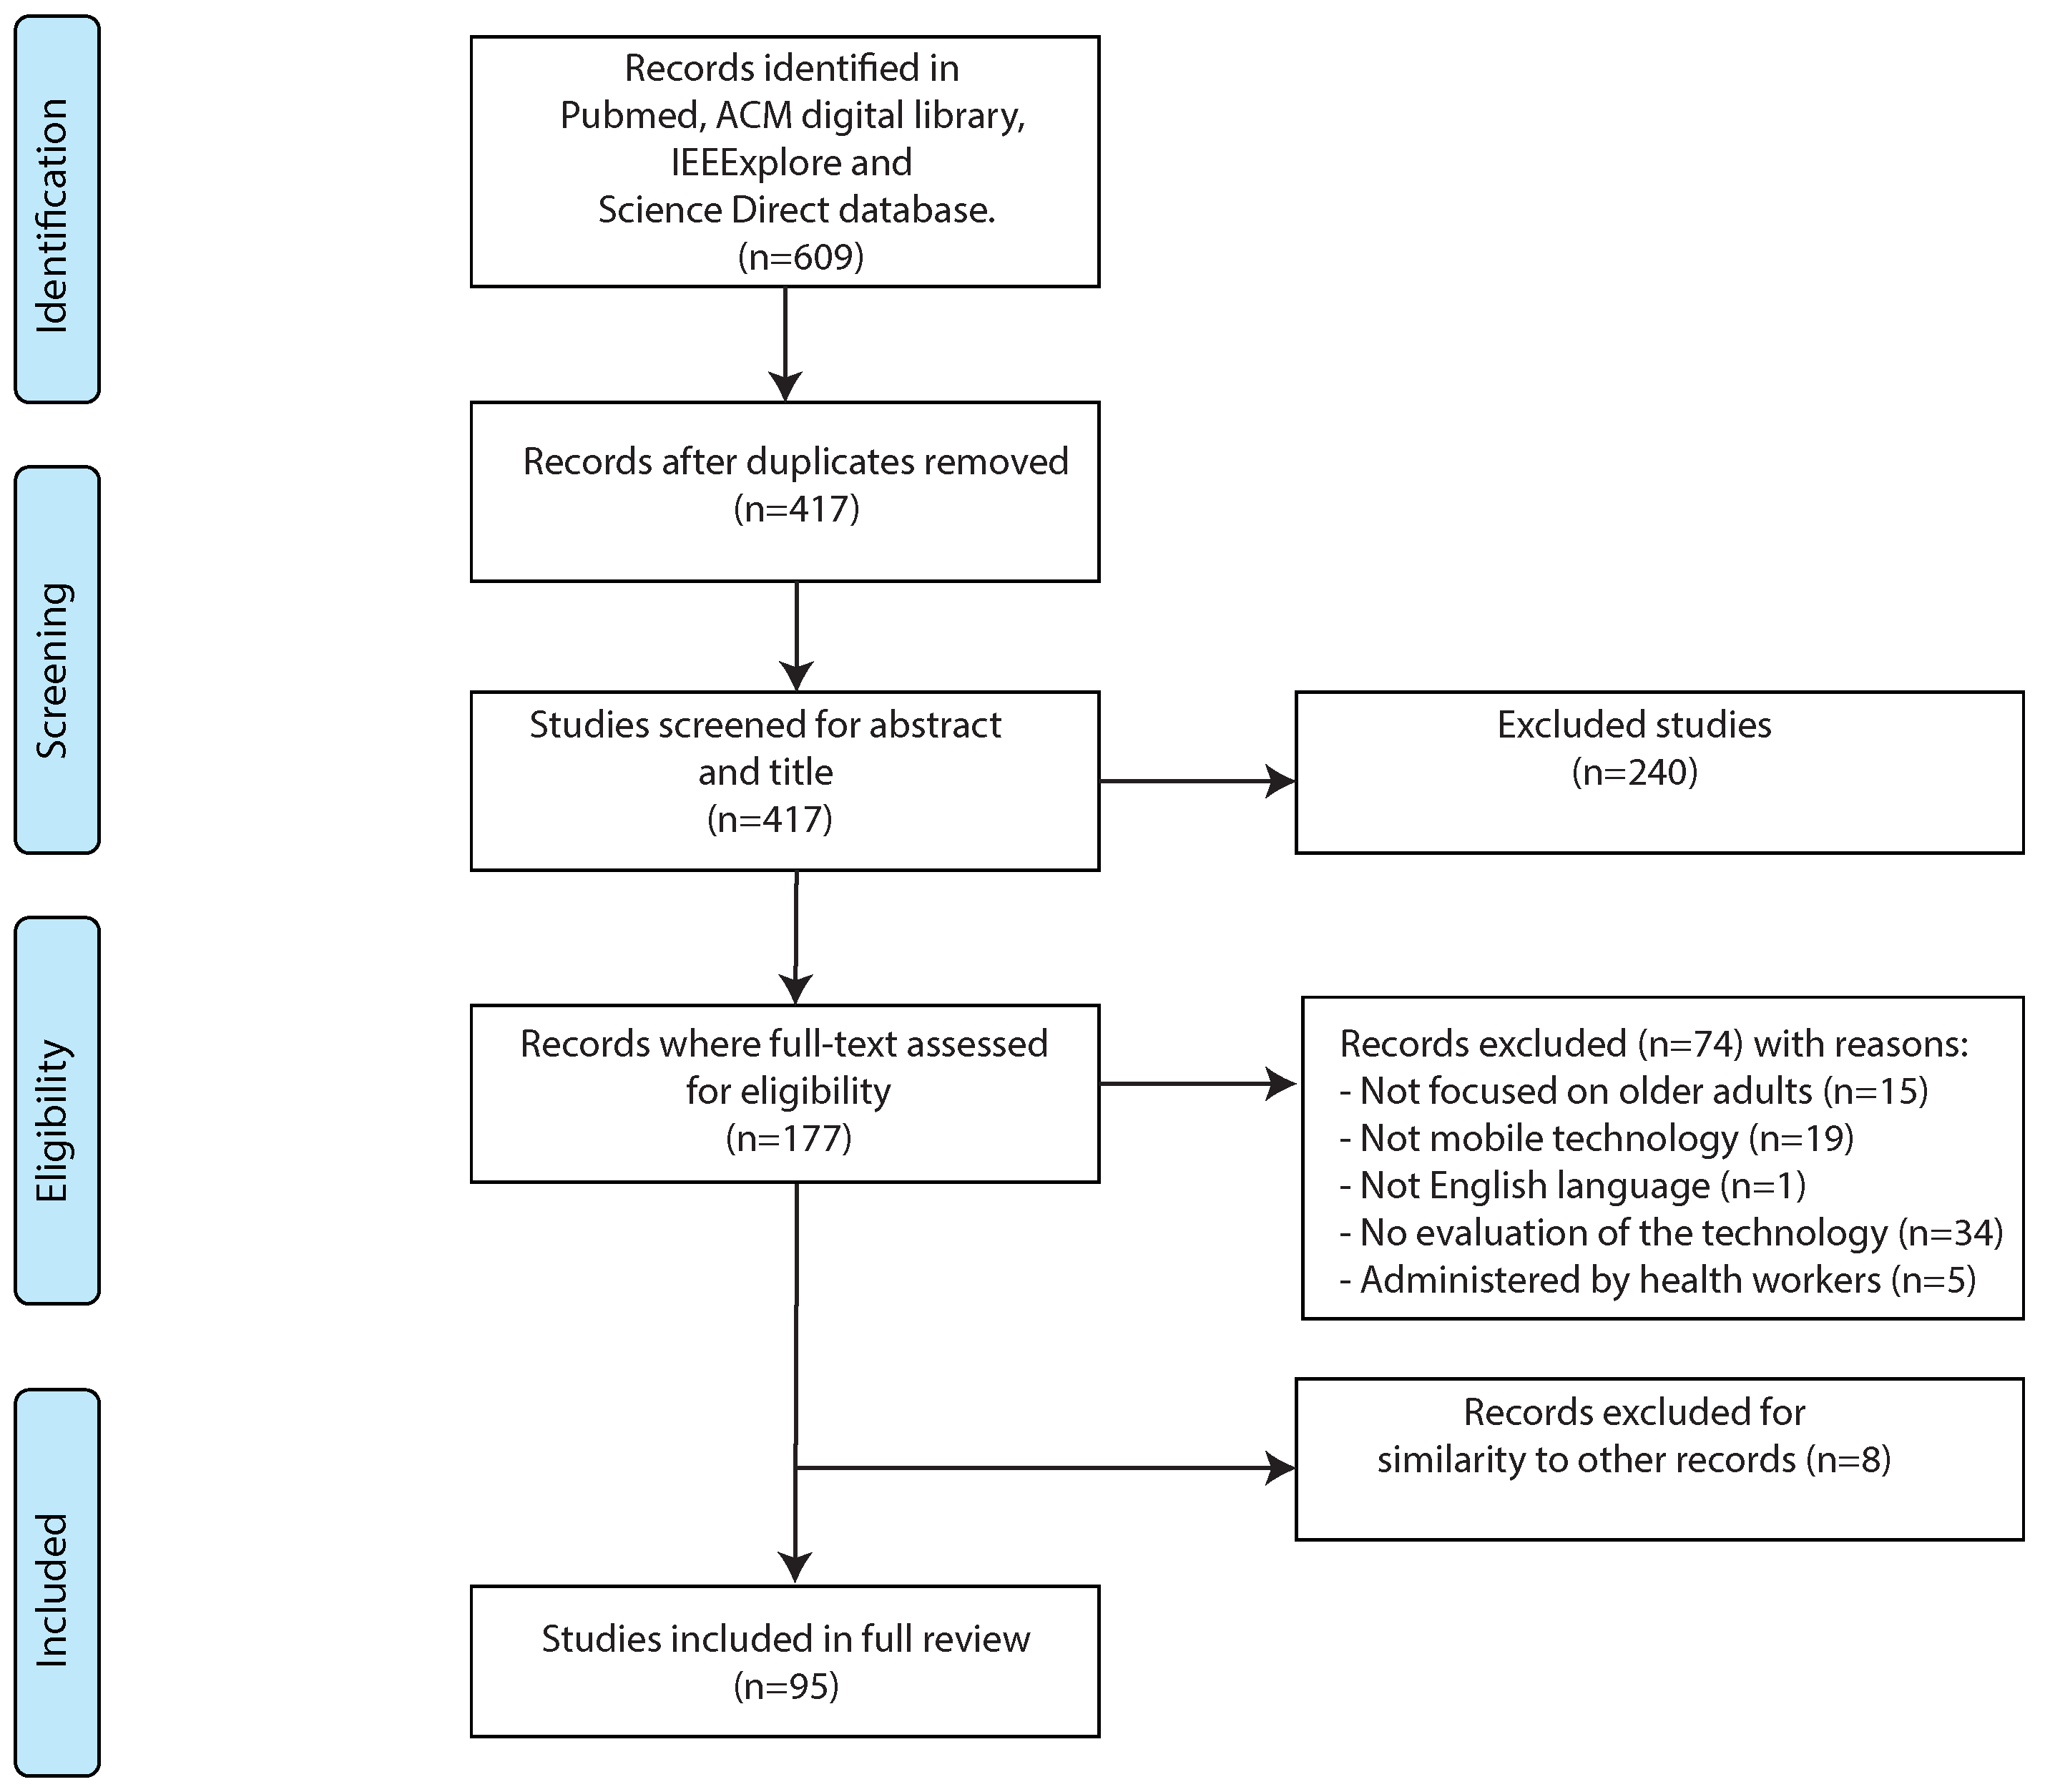
3.1. Reviewing Process
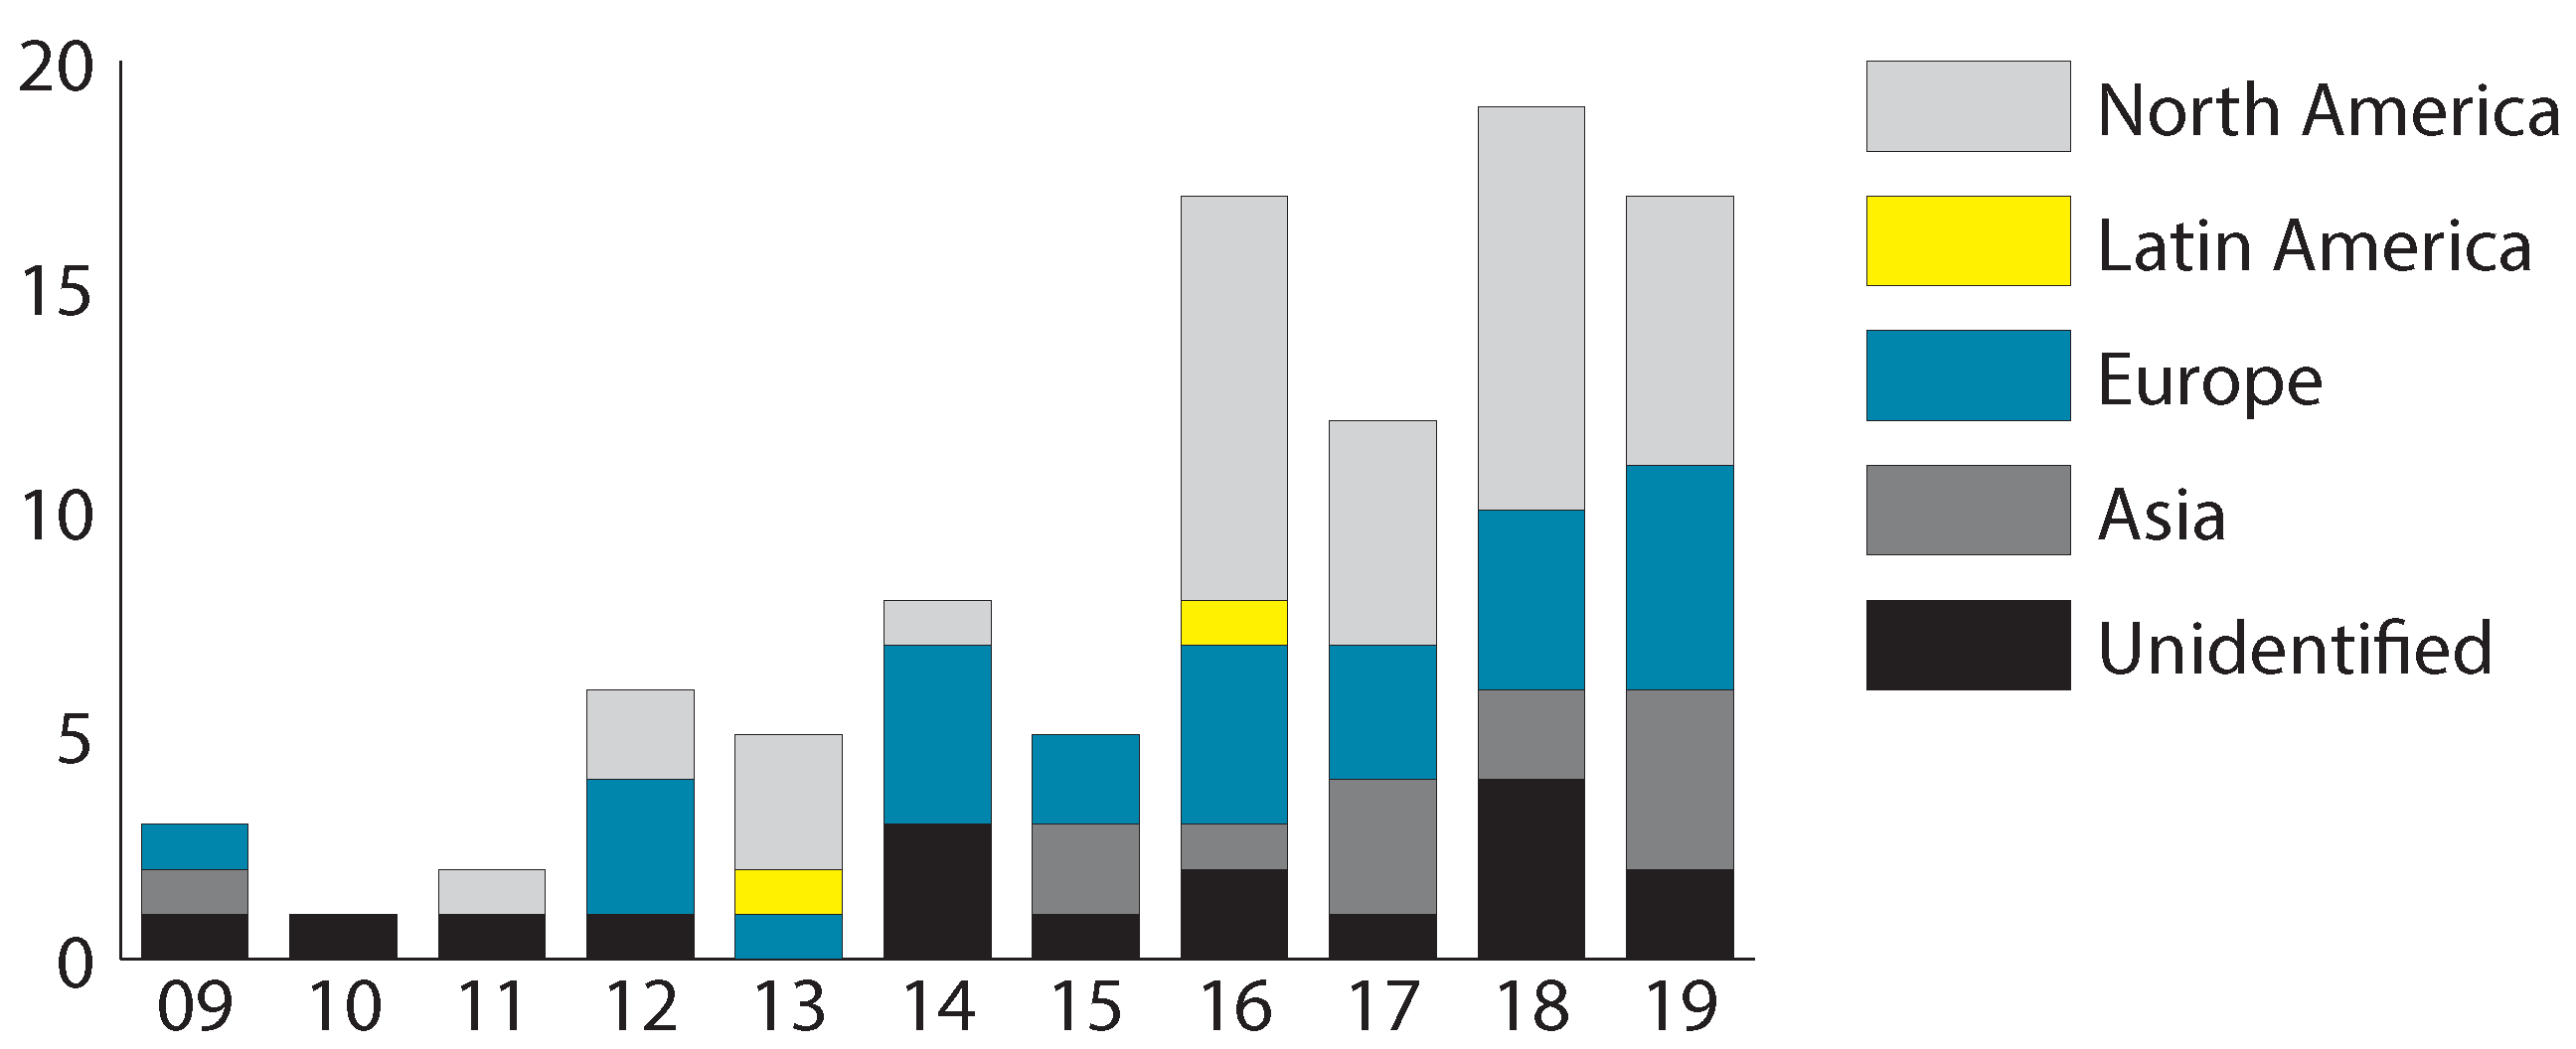
3.2. General Study Characteristics
3.3. Which Health Information about Older Adults Is Usually Monitored (RQ1)?
3.4. What Type of Mobile Technology Is Used by Older Adults to Record and Display Health Information (RQ2)?
3.4.1. Do Mobile Health Technologies for Older Adults Include Self-Reporting?
3.4.2. Do Mobile Health Technologies for Older Adults Include Data Visualization?
3.5. How are Mobile Health Technologies for Older Adults Evaluated (RQ3)?
4. Discussion
5. Conclusions
Author Contributions
Funding
Conflicts of Interest
References
- Sanderson, W.C.; Scherbov, S.; Gerland, P. Probabilistic population aging. PLoS ONE 2017, 12, e0179171. [Google Scholar] [CrossRef] [PubMed]
- Matthies, D.J.; Haescher, M.; Nanayakkara, S.; Bieber, G. Step Detection for Rollator Users with Smartwatches. In Proceedings of the Symposium on Spatial User Interaction, Berlin, Germany, 13–14 October 2018; pp. 163–167. [Google Scholar]
- Redfern, J. Can Older Adults Benefit from Smart Devices, Wearables, and Other Digital Health Options to Enhance Cardiac Rehabilitation? Clin. Geriatr. Med. 2019, 35, 489–497. [Google Scholar] [CrossRef] [PubMed]
- Boateng, G.; Batsis, J.A.; Proctor, P.; Halter, R.; Kotz, D. GeriActive: Wearable app for monitoring and encouraging physical activity among older adults. In Proceedings of the 15th International Conference on Wearable and Implantable Body Sensor Networks (BSN), Las Vegas, NV, USA, 4–7 March 2018; pp. 46–49. [Google Scholar]
- Loprinzi, P.D.; Cardinal, B.J. Association between objectively-measured physical activity and sleep, NHANES 2005–2006. Ment. Health Phys. Act. 2011, 4, 65–69. [Google Scholar] [CrossRef]
- Ginis, P.; Heremans, E.; Ferrari, A.; Dockx, K.; Canning, C.G.; Nieuwboer, A. Prolonged walking with a wearable system providing intelligent auditory input in people with Parkinson’s disease. Front. Neurol. 2017, 8, 128. [Google Scholar] [CrossRef] [PubMed]
- Isaković, M.; Sedlar, U.; Volk, M.; Bešter, J. Usability pitfalls of diabetes mHealth apps for the elderly. J. Diabetes Res. 2016, 2016. [Google Scholar] [CrossRef] [PubMed]
- Koceski, S.; Koceska, N. Evaluation of an assistive telepresence robot for elderly healthcare. J. Med. Syst. 2016, 40, 121. [Google Scholar] [CrossRef]
- Boz, H.; Karatas, S.E. A Review on Internet Use and Quality of Life of the Elderly. Cypriot J. Educ. Sci. 2015, 10, 182–191. [Google Scholar] [CrossRef]
- King, A.C.; Hekler, E.B.; Grieco, L.A.; Winter, S.J.; Sheats, J.L.; Buman, M.P.; Banerjee, B.; Robinson, T.N.; Cirimele, J. Effects of three motivationally targeted mobile device applications on initial physical activity and sedentary behavior change in midlife and older adults: A randomized trial. PLoS ONE 2016, 11, e0156370. [Google Scholar] [CrossRef]
- Liu, Y.C.; Chen, C.H.; Tsou, Y.C.; Lin, Y.S.; Chen, H.Y.; Yeh, J.Y.; Chiu, S.Y.H. Evaluating mobile health apps for customized dietary recording for young adults and seniors: Randomized controlled trial. JMIR Mhealth Uhealth 2019, 7, e10931. [Google Scholar] [CrossRef]
- Tangtisanon, P. Real time Human Emotion Monitoring based on Bio-signals. In Proceedings of the 18th International Conference on Control, Automation and Systems (ICCAS), Daegwallyeong, Korea, 17–20 October 2018; pp. 513–517. [Google Scholar]
- Mitzner, T.L.; Boron, J.B.; Fausset, C.B.; Adams, A.E.; Charness, N.; Czaja, S.J.; Dijkstra, K.; Fisk, A.D.; Rogers, W.A.; Sharit, J. Older adults talk technology: Technology usage and attitudes. Comput. Hum. Behav. 2010, 26, 1710–1721. [Google Scholar] [CrossRef]
- Hargittai, E.; Piper, A.M.; Morris, M.R. From internet access to internet skills: Digital inequality among older adults. Univers. Access Inf. Soc. 2019, 18, 881–890. [Google Scholar] [CrossRef]
- Holgersson, J.; Söderström, E. Bridging the gap: Exploring elderly citizens’ perceptions of digital exclusion. In Proceedings of the 27th European Conference on Information Systems (ECIS), Association for Information Systems, Stockholm & Uppsala, Sweden, 8–14 June 2019. [Google Scholar]
- Li, Q.; Luximon, Y. Older Adults and Digital Technology: A Study of User Perception and Usage Behavior. In Proceedings of the AHFE 2016 International Conference on Physical Ergonomics and Human Factors, Walt Disney World®, Orlando, FL, USA, 27–31 July 2016; pp. 155–163. [Google Scholar]
- Bhattarai, P.; Phillips, J.L. The role of digital health technologies in management of pain in older people: An integrative review. Arch. Gerontol. Geriatr. 2017, 68, 14–24. [Google Scholar] [CrossRef] [PubMed]
- Li, J.; Ma, Q.; Chan, A.H.; Man, S. Health monitoring through wearable technologies for older adults: Smart wearables acceptance model. Appl. Ergon. 2019, 75, 162–169. [Google Scholar] [CrossRef] [PubMed]
- Larson, R.; Csikszentmihalyi, M. The experience sampling method. New Dir. Methodol. Soc. Behav. Sci. 1983, 15, 41–56. [Google Scholar]
- Rodriguez, I.; Herskovic, V.; Fuentes, C.; Campos, M. B-ePain: A wearable interface to self-report pain and emotions. In Proceedings of the ACM International Joint Conference on Pervasive and Ubiquitous Computing: Adjunct, Heidelberg, Germany, 12–16 September 2016; pp. 1120–1125. [Google Scholar]
- Pham, T.; Mejía, S.; Metoyer, R.A.; Hooker, K. The Effects of Visualization Feedback on Promoting Health Goal Progress in Older Adults. In Proceedings of the Eurographics Conference on Visualizatoin (EuroVis), Bergen, Norway, 31 May–3 June 2012. [Google Scholar]
- Roeing, K.L.; Hsieh, K.L.; Sosnoff, J.J. A systematic review of balance and fall risk assessments with mobile phone technology. Arch. Gerontol. Geriatr. 2017, 73, 222–226. [Google Scholar] [CrossRef]
- Liu, L.; Stroulia, E.; Nikolaidis, I.; Miguel-Cruz, A.; Rincon, A.R. Smart homes and home health monitoring technologies for older adults: A systematic review. Int. J. Med. Inf. 2016, 91, 44–59. [Google Scholar] [CrossRef]
- Searcy, R.P.; Summapund, J.; Estrin, D.; Pollak, J.P.; Schoenthaler, A.; Troxel, A.B.; Dodson, J.A. Mobile health technologies for older adults with cardiovascular disease: Current evidence and future directions. Curr. Geriatr. Rep. 2019, 8, 31–42. [Google Scholar] [CrossRef]
- Harerimana, B.; Forchuk, C.; O’Regan, T. The use of technology for mental healthcare delivery among older adults with depressive symptoms: A systematic literature review. Int. J. Ment. Health Nurs. 2019, 28, 657–670. [Google Scholar] [CrossRef]
- Koo, B.M.; Vizer, L.M. Examining Mobile Technologies to Support Older Adults With Dementia Through the Lens of Personhood and Human Needs: Scoping Review. JMIR Mhealth Uhealth 2019, 7, e15122. [Google Scholar] [CrossRef]
- Moher, D.; Liberati, A.; Tetzlaff, J.; Altman, D.G. Preferred reporting items for systematic reviews and meta-analyses: The PRISMA statement. Ann. Intern. Med. 2009, 151, 264–269. [Google Scholar] [CrossRef]
- Huang, K.C.; Chiang, I.J.; Xiao, F.; Liao, C.C.; Liu, C.C.H.; Wong, J.M. PICO element detection in medical text without metadata: Are first sentences enough? J. Biomed. Inf. 2013, 46, 940–946. [Google Scholar] [CrossRef] [PubMed]
- World Health Organization. Definition of an Older or Elderly Person; World Health Organization: Geneva, Switzerland, 2014. [Google Scholar]
- Bhattacharjya, S.; Stafford, M.C.; Cavuoto, L.A.; Yang, Z.; Song, C.; Subryan, H.; Xu, W.; Langan, J. Harnessing smartphone technology and three dimensional printing to create a mobile rehabilitation system, mRehab: Assessment of usability and consistency in measurement. J. Neuroeng. Rehabil. 2019, 16, 127. [Google Scholar] [CrossRef] [PubMed]
- Hill, N.L.; Mogle, J.; Colancecco, E.; Dick, R.; Hannan, J.; Lin, F.V. Feasibility study of an attention training application for older adults. Int. J. Older People Nurs. 2015, 10, 241–249. [Google Scholar] [CrossRef] [PubMed]
- Hill, N.L.; Mogle, J.; Wion, R.; Kitt-Lewis, E.; Hannan, J.; Dick, R.; McDermott, C. App-based attention training: Incorporating older adults’ feedback to facilitate home-based use. Int. J. Older People Nurs. 2018, 13, e12163. [Google Scholar] [CrossRef] [PubMed]
- Mehra, S.; Visser, B.; Cila, N.; van den Helder, J.; Engelbert, R.H.; Weijs, P.J.; Kröse, B.J. Supporting older adults in exercising with a tablet: A usability study. JMIR Hum. Factors 2019, 6, e11598. [Google Scholar] [CrossRef] [PubMed]
- Lim, S.B.; Horslen, B.C.; Davis, J.R.; Allum, J.H.; Carpenter, M.G. Benefits of multi-session balance and gait training with multi-modal biofeedback in healthy older adults. Gait Posture 2016, 47, 10–17. [Google Scholar] [CrossRef]
- Geraedts, H.A.; Zijlstra, W.; Zhang, W.; Bulstra, S.; Stevens, M. Adherence to and effectiveness of an individually tailored home-based exercise program for frail older adults, driven by mobility monitoring: Design of a prospective cohort study. BMC Public Health 2014, 14, 570. [Google Scholar] [CrossRef]
- Shimada, H.; Lee, S.; Doi, T.; Bae, S.; Makino, K.; Chiba, I.; Arai, H. Study protocol of the self-monitoring activity program: Effects of activity on incident dementia. Alzheimer’s Dement. Trans. Res. Clin. Interv. 2019, 5, 303–307. [Google Scholar] [CrossRef]
- Bieber, G.; Haescher, M.; Hanschmann, P.; Matthies, D.J. Exploring Accelerometer-based Step Detection By using a Wheeled Walking Frame. In Proceedings of the 5th international Workshop on Sensor-based Activity Recognition and Interaction, Berlin, Germany, 20–21 September 2018; pp. 1–6. [Google Scholar]
- Zhang, M.; Sawchuk, A.A. Context-aware fall detection using a bayesian network. In Proceedings of the 5th ACM International Workshop on Context-Awareness for Self-Managing Systems, Beijing, China, 17 September 2011; pp. 10–16. [Google Scholar]
- Chu, C.T.; Mao, W.L.; Hung, C.W.; Liao, J.X. Rotation memory neural network identify elders fall situation. In Proceedings of the 7th International Symposium on Next Generation Electronics (ISNE2018), Taipei, Taiwan, 7–9 May 2018; pp. 1–4. [Google Scholar]
- Chu, C.T.; Chang, C.H.; Chang, T.J.; Li, H.W. A dynamic gray model prediction fall detection signal analysis. In Proceedings of the 6th International Symposium on Next Generation Electronics (ISNE2017), Keelung, Taiwan, 23–25 May 2017; pp. 1–4. [Google Scholar]
- Shen, J.; Chen, Y.; Shen, Z.; Liu, S. A Two-Stage Incremental Update Method for Fall Detection with Wearable Device. In Proceedings of the IEEE SmartWorld, Ubiquitous Intelligence & Computing, Advanced & Trusted Computing, Scalable Computing & Communications, Cloud & Big Data Computing, Internet of People and Smart City Innovation (SmartWorld/SCALCOM/UIC/ATC/CBDCom/IOP/SCI), Guangzhou, China, 8–12 October 2018; pp. 364–371. [Google Scholar]
- Chu, C.T.; Mao, W.L.; Hung, C.W.; Liao, J.X. A Laypunov base fuzzy expert knowledge model identify elders fall signal. In Proceedings of the 7th International Symposium on Next Generation Electronics (ISNE2018), Taipei, Taiwan, 7–9 May 2018; pp. 1–4. [Google Scholar]
- Han, M.; Chen, J.; Lei, Y.; Duan, X.; Jiao, B. An Intelligence Security Alarming System With Fall Detection Algorithm. In Proceedings of the 3rd Information Technology, Networking, Electronic and Automation Control Conference (ITNEC2019), Chengdu, China, 15–17 March 2019; pp. 2180–2184. [Google Scholar]
- Kuramoto, N.; Jayatilake, D.; Hidaka, K.; Suzuki, K. Smartphone-based swallowing monitoring and feedback device for mealtime assistance in nursing homes. In Proceedings of the 38th Annual International Conference of the IEEE Engineering in Medicine and Biology Society (EMBC), Orlando, FL, USA, 16–20 August 2016; pp. 5781–5784. [Google Scholar]
- Jie, L.J.; Jamin, G.; Smit, K.; Beurskens, A.; Braun, S. Design of the user interface for “Stappy”, A sensor-feedback system to facilitate walking in people after stroke: A user-centred approach. Disabil. Rehabil. Assist. Technol. 2019. [Google Scholar] [CrossRef]
- Cao, H.; Wu, S.; Zhou, Z.; Lin, C.C.; Yang, C.Y.; Lee, S.T.; Wu, C.T. A fall detection method based on acceleration data and hidden Markov model. In Proceedings of the International Conference on Signal and Image Processing (ICSIP), Beijing, China, 13–15 August 2016; pp. 684–689. [Google Scholar]
- Merilahti, J.; Ermes, M. 3D accelerometer features’ differences between young and older people, and between lower back and neck band sensor placements. In Proceedings of the Annual International Conference of the IEEE Engineering in Medicine and Biology Society, Boston, MA, USA, 30 August–3 September 2011; pp. 7885–7887. [Google Scholar]
- Liu, S.H.; Chang, Y.J. Using accelerometers for physical actions recognition by a neural fuzzy network. Telemed. -Health 2009, 15, 867–876. [Google Scholar] [CrossRef]
- Sunwoo, J.; Yuen, W.; Lutteroth, C.; Wünsche, B. Mobile games for elderly healthcare. In Proceedings of the 11th International Conference of the NZ Chapter of the ACM Special Interest Group on Human-Computer Interaction, Auckland, New Zealand, 8–9 July 2010; pp. 73–76. [Google Scholar]
- Similä, H.; Immonen, M.; Niemirepo, T. Mobile fall risk assessment solution for daily-life settings. In Proceedings of the 40th Annual International Conference of the IEEE Engineering in Medicine and Biology Society (EMBC), Honolulu, HI, USA, 18–21 July 2018; pp. 1530–1533. [Google Scholar]
- Vankipuram, M.; McMahon, S.; Fleury, J. ReadySteady: App for accelerometer-based activity monitoring and wellness-motivation feedback system for older adults. In Proceedings of the American Medical Informatics Association Annual Symposium. American Medical Informatics Association, Chicago, IL, USA, 3–7 November 2012; Volume 2012, p. 931. [Google Scholar]
- McMahon, S.; Vankipuram, M.; Hekler, E.B.; Fleury, J. Design and evaluation of theory-informed technology to augment a wellness motivation intervention. Transl. Behav. Med. 2014, 4, 95–107. [Google Scholar] [CrossRef] [PubMed]
- Schließmann, D.; Nisser, M.; Schuld, C.; Gladow, T.; Derlien, S.; Heutehaus, L.; Weidner, N.; Smolenski, U.; Rupp, R. Trainer in a pocket-proof-of-concept of mobile, real-time, foot kinematics feedback for gait pattern normalization in individuals after stroke, incomplete spinal cord injury and elderly patients. J. Neuroeng. Rehabil. 2018, 15, 44. [Google Scholar] [CrossRef] [PubMed]
- Xu, J.; Bao, T.; Lee, U.H.; Kinnaird, C.; Carender, W.; Huang, Y.; Sienko, K.H.; Shull, P.B. Configurable, wearable sensing and vibrotactile feedback system for real-time postural balance and gait training: Proof-of-concept. J. Neuroeng. Rehabil. 2017, 14, 102. [Google Scholar] [CrossRef] [PubMed]
- Zhang, Y.; Beenakker, K.G.; Butala, P.M.; Lin, C.C.; Little, T.D.; Maier, A.B.; Stijntjes, M.; Vartanian, R.; Wagenaar, R.C. Monitoring walking and cycling of middle-aged to older community dwellers using wireless wearable accelerometers. In Proceedings of the Annual International Conference of the IEEE Engineering in Medicine and Biology Society, San Diego, CA, USA, 28 August – 1 September 2012; pp. 158–161. [Google Scholar]
- Dehzangi, O.; Zhao, Z.; Bidmeshki, M.M.; Biggan, J.; Ray, C.; Jafari, R. The impact of vibrotactile biofeedback on the excessive walking sway and the postural control in elderly. In Proceedings of the 4th Conference on Wireless Health, Baltimore, MD, USA, 4–6 November 2013; pp. 1–7. [Google Scholar]
- Demiris, G.; Chaudhuri, S.; Thompson, H.J. Older adults’ experience with a novel fall detection device. Telemed. -Health 2016, 22, 726–732. [Google Scholar] [CrossRef]
- Veeravelli, S.; Najafi, B.; Marin, I.; Blumenkron, F.; Smith, S.; Klotz, S.A. Exergaming in older people living with HIV improves balance, mobility and ameliorates some aspects of frailty. J. Vis. Exp. 2016, 116, e54275. [Google Scholar] [CrossRef]
- Antos, S.A.; Danilovich, M.K.; Eisenstein, A.R.; Gordon, K.E.; Kording, K.P. Smartwatches Can Detect Walker and Cane Use in Older Adults. Innov. Aging 2019, 3, igz008. [Google Scholar] [CrossRef]
- España-Romero, V.; Golubic, R.; Martin, K.R.; Hardy, R.; Ekelund, U.; Kuh, D.; Wareham, N.J.; Cooper, R.; Brage, S.; NSHD Scientific and Data Collection Teams. Comparison of the EPIC Physical Activity Questionnaire with combined heart rate and movement sensing in a nationally representative sample of older British adults. PLoS ONE 2014, 9, e87085. [Google Scholar] [CrossRef]
- Iluz, T.; Gazit, E.; Herman, T.; Sprecher, E.; Brozgol, M.; Giladi, N.; Mirelman, A.; Hausdorff, J.M. Automated detection of missteps during community ambulation in patients with Parkinson’s disease: A new approach for quantifying fall risk in the community setting. J. Neuroeng. Rehabil. 2014, 11, 48. [Google Scholar] [CrossRef]
- Isho, T.; Tashiro, H.; Usuda, S. Accelerometry-based gait characteristics evaluated using a smartphone and their association with fall risk in people with chronic stroke. J. Stroke Cerebrovasc. Dis. 2015, 24, 1305–1311. [Google Scholar] [CrossRef]
- Aziz, O.; Park, E.J.; Mori, G.; Robinovitch, S.N. Distinguishing the causes of falls in humans using an array of wearable tri-axial accelerometers. Gait Posture 2014, 39, 506–512. [Google Scholar] [CrossRef]
- Lyons, E.J.; Swartz, M.C.; Lewis, Z.H.; Martinez, E.; Jennings, K. Feasibility and acceptability of a wearable technology physical activity intervention with telephone counseling for mid-aged and older adults: A randomized controlled pilot trial. JMIR Mhealth Uhealth 2017, 5, e28. [Google Scholar] [CrossRef] [PubMed]
- Finkelstein, J.; Jeong, I.C. Feasibility of interactive biking exercise system for telemanagement in elderly. Stud. Health Technol. Inf. 2013, 192, 642–646. [Google Scholar]
- Howcroft, J.; Kofman, J.; Lemaire, E.D. Feature selection for elderly faller classification based on wearable sensors. J. Neuroeng. Rehabil. 2017, 14, 47. [Google Scholar] [CrossRef] [PubMed]
- Joosen, P.; Piette, D.; Buekers, J.; Taelman, J.; Berckmans, D.; De Boever, P. A smartphone-based solution to monitor daily physical activity in a care home. J. Telemed. Telecare 2019, 25, 611–622. [Google Scholar] [CrossRef] [PubMed]
- Vermeulen, J.; Neyens, J.C.; Spreeuwenberg, M.D.; van Rossum, E.; Sipers, W.; Habets, H.; Hewson, D.J.; De Witte, L.P. User-centered development and testing of a monitoring system that provides feedback regarding physical functioning to elderly people. Patient Prefer. Adherence 2013, 7, 843. [Google Scholar] [CrossRef]
- Moufawad El Achkar, C.; Lenoble-Hoskovec, C.; Paraschiv-Ionescu, A.; Major, K.; Büla, C.; Aminian, K. Physical behavior in older persons during daily life: Insights from instrumented shoes. Sensors 2016, 16, 1225. [Google Scholar] [CrossRef]
- Roberts, L.M.; Jaeger, B.C.; Baptista, L.C.; Harper, S.A.; Gardner, A.K.; Jackson, E.A.; Pekmezi, D.; Sandesara, B.; Manini, T.M.; Anton, S.D.; et al. Wearable Technology To Reduce Sedentary Behavior And CVD Risk In Older Adults: A Pilot Randomized Clinical Trial. Clin. Interv. Aging 2019, 14, 1817. [Google Scholar] [CrossRef]
- Huisingh-Scheetz, M.J.; Kocherginsky, M.; Magett, E.; Rush, P.; Dale, W.; Waite, L. Relating wrist accelerometry measures to disability in older adults. Arch. Gerontol. Geriatr. 2016, 62, 68–74. [Google Scholar] [CrossRef]
- Gamecho, B.; Silva, H.; Guerreiro, J.; Gardeazabal, L.; Abascal, J. A context-aware application to increase elderly users compliance with physical rehabilitation exercises at home via animatronic biofeedback. J. Med. Syst. 2015, 39, 135. [Google Scholar] [CrossRef]
- Toosizadeh, N.; Mohler, J.; Wendel, C.; Najafi, B. Influences of frailty syndrome on open-loop and closed-loop postural control strategy. Gerontology 2015, 61, 51–60. [Google Scholar] [CrossRef]
- Bao, T.; Carender, W.J.; Kinnaird, C.; Barone, V.J.; Peethambaran, G.; Whitney, S.L.; Kabeto, M.; Seidler, R.D.; Sienko, K.H. Effects of long-term balance training with vibrotactile sensory augmentation among community-dwelling healthy older adults: A randomized preliminary study. J. Neuroeng. Rehabil. 2018, 15, 5. [Google Scholar] [CrossRef] [PubMed]
- Schwenk, M.; Sabbagh, M.; Lin, I.; Morgan, P.; Grewal, G.S.; Mohler, J.; Coon, D.W.; Najafi, B. Sensor-based balance training with motion feedback in people with mild cognitive impairment. J. Rehabil. Res. Dev. 2016, 53, 945. [Google Scholar] [CrossRef] [PubMed]
- Nakagawa, E.; Moriya, K.; Suwa, H.; Fujimoto, M.; Arakawa, Y.; Hatta, T.; Miwa, S.; Yasumoto, K. Investigating recognition accuracy improvement by adding user’s acceleration data to location and power consumption-based in-home activity recognition system. In Proceedings of the 13th International Conference on Mobile and Ubiquitous Systems: Computing Networking and Services, Hiroshima, Japan, 28 November–1 December 2016; pp. 100–105. [Google Scholar]
- Fritz, H.; Tarraf, W.; Saleh, D.J.; Cutchin, M.P. Using a smartphone-based ecological momentary assessment protocol with community dwelling older African Americans. J. Gerontol. Ser. Psychol. Sci. Soc. Sci. 2017, 72, 876–887. [Google Scholar] [CrossRef] [PubMed]
- Louza, J.; Rösel, C.; Gürkov, R.; Krause, E.; Ihler, F. Influence of cochlear implantation on postural control and risk of falls. Audiol. Neurotol. 2019, 24, 245–252. [Google Scholar] [CrossRef] [PubMed]
- Gualtieri, L.; Rosenbluth, S.; Phillips, J. Can a free wearable activity tracker change behavior? The impact of trackers on adults in a physician-led wellness group. JMIR Res. Protoc. 2016, 5, e237. [Google Scholar] [CrossRef]
- Mate, K.; Abou-Sharkh, A.; Morais, J.; Mayo, N. Putting the best foot forward: Relationships between indicators of step quality and cadence in three gait vulnerable populations. NeuroRehabilitation 2019, 44, 295–301. [Google Scholar] [CrossRef]
- Jeong, J.N.; Kim, S.H.; Park, K.N. Relationship between objectively measured lifestyle factors and health factors in patients with knee osteoarthritis: The STROBE Study. Medicine 2019, 98, e16060. [Google Scholar] [CrossRef]
- Kimura, N.; Aso, Y.; Yabuuchi, K.; Ishibashi, M.; Hori, D.; Sasaki, Y.; Nakamichi, A.; Uesugi, S.; Fujioka, H.; Iwao, S.; et al. Modifiable lifestyle factors and cognitive function in older people: A cross-sectional observational study. Front. Neurol. 2019, 10, 401. [Google Scholar] [CrossRef]
- Hassan, L.; Swarbrick, C.; Sanders, C.; Parker, A.; Machin, M.; Tully, M.P.; Ainsworth, J. Tea, talk and technology: Patient and public involvement to improve connected health ‘wearables’ research in dementia. Res. Involv. Engagem. 2017, 3, 12. [Google Scholar] [CrossRef]
- Li, K.; Warren, S. A wireless reflectance pulse oximeter with digital baseline control for unfiltered photoplethysmograms. IEEE Trans. Biomed. Circuits Syst. 2011, 6, 269–278. [Google Scholar] [CrossRef]
- Rodrigues, D.F.; Horta, E.T.; Silva, B.M.; Guedes, F.D.; Rodrigues, J.J. A mobile healthcare solution for ambient assisted living environments. In Proceedings of the 16th International Conference on e-Health Networking, Applications and Services (Healthcom), Natal-RN, Brazil, 15–18 October 2014; pp. 170–175. [Google Scholar]
- Selvaraj, N. Long-term remote monitoring of vital signs using a wireless patch sensor. In Proceedings of the IEEE Healthcare Innovation Conference (HIC), Seattle, WA, USA, 8–10 October 2014; pp. 83–86. [Google Scholar]
- Chau, J.P.C.; Lee, D.T.F.; Yu, D.S.F.; Chow, A.Y.M.; Yu, W.C.; Chair, S.Y.; Lai, A.S.; Chick, Y.L. A feasibility study to investigate the acceptability and potential effectiveness of a telecare service for older people with chronic obstructive pulmonary disease. Int. J. Med. Inform. 2012, 81, 674–682. [Google Scholar] [CrossRef] [PubMed]
- Cornet, V.P.; Daley, C.N.; Srinivas, P.; Holden, R.J. User-centered evaluations with older adults: Testing the usability of a mobile health system for heart failure self-management. Proc. Hum. Factors Ergon. Soc. Annu. Meet. 2017, 61, 6–10. [Google Scholar] [CrossRef] [PubMed]
- Portz, J.D.; Vehovec, A.; Dolansky, M.A.; Levin, J.B.; Bull, S.; Boxer, R. The development and acceptability of a mobile application for tracking symptoms of heart failure among older adults. Telemed. -Health 2018, 24, 161–165. [Google Scholar] [CrossRef] [PubMed]
- Lim, S.; Kang, S.M.; Kim, K.M.; Moon, J.H.; Choi, S.H.; Hwang, H.; Jung, H.S.; Park, K.S.; Ryu, J.O.; Jang, H.C. Multifactorial intervention in diabetes care using real-time monitoring and tailored feedback in type 2 diabetes. Acta Diabetol. 2016, 53, 189–198. [Google Scholar] [CrossRef]
- Mena, L.J.; Felix, V.G.; Ostos, R.; Gonzalez, J.A.; Cervantes, A.; Ochoa, A.; Ruiz, C.; Ramos, R.; Maestre, G.E. Mobile personal health system for ambulatory blood pressure monitoring. Comput. Math. Methods Med. 2013, 2013. [Google Scholar] [CrossRef]
- Batsis, J.A.; Naslund, J.A.; Gill, L.E.; Masutani, R.K.; Agarwal, N.; Bartels, S.J. Use of a wearable activity device in rural older obese adults: A pilot study. Gerontol. Geriatr. Med. 2016, 2, 2333721416678076. [Google Scholar] [CrossRef]
- Merilahti, J.; Pärkkä, J.; Antila, K.; Paavilainen, P.; Mattila, E.; Malm, E.J.; Saarinen, A.; Korhonen, I. Compliance and technical feasibility of long-term health monitoring with wearable and ambient technologies. J. Telemed. Telecare 2009, 15, 302–309. [Google Scholar] [CrossRef]
- Fanning, J.; Brooks, A.K.; Ip, E.; Nicklas, B.J.; Rejeski, W.J. A mobile health intervention to reduce pain and improve health (MORPH) in older adults with obesity: Protocol for the MORPH trial. JMIR Res. Protoc. 2018, 7, e128. [Google Scholar] [CrossRef]
- Yasuda, K.; Saichi, K.; Iwata, H. Design and initial validity study of perception-empathy biofeedback system for gait training in older adults. In Proceedings of the International Conference on Systems, Man, and Cybernetics (SMC), Miyazaki, Japan, 7–10 October 2018; pp. 1530–1534. [Google Scholar]
- Harte, R.; Quinlan, L.R.; Glynn, L.; Rodriguez-Molinero, A.; Scharf, T.; Carenas, C.; Reixach, E.; Garcia, J.; Carrabina, J.; ÓLaighin, G. A multi-stage human factors and comfort assessment of instrumented insoles designed for use in a connected health infrastructure. J. Pers. Med. 2015, 5, 487–508. [Google Scholar] [CrossRef]
- Ma, C.Z.H.; Wan, A.H.P.; Wong, D.W.C.; Zheng, Y.P.; Lee, W.C.C. A vibrotactile and plantar force measurement-based biofeedback system: Paving the way towards wearable balance-improving devices. Sensors 2015, 15, 31709–31722. [Google Scholar] [CrossRef]
- Pagan-Ortiz, M.E.; Goulet, P.; Kogelman, L.; Levkoff, S.E.; Weitzman, P.F. Feasibility of a Texting Intervention to Improve Medication Adherence Among Older HIV+ African Americans: A Mixed-Method Pilot Study. Gerontol. Geriatr. Med. 2019, 5, 2333721419855662. [Google Scholar] [CrossRef] [PubMed]
- Bowen, P.G.; Clay, O.J.; Lee, L.T.; Browning, W.; Schoenberger, Y.M.; Martin, M.Y. Texting Older Sisters to Step: The TOSS Study. West. J. Nurs. Res. 2019, 41, 388–408. [Google Scholar] [CrossRef] [PubMed]
- Masumoto, K.; Yaguchi, T.; Matsuda, H.; Tani, H.; Tozuka, K.; Kondo, N.; Okada, S. Measurement and visualization of face-to-face interaction among community-dwelling older adults using wearable sensors. Geriatr. Gerontol. Int. 2017, 17, 1752–1758. [Google Scholar] [CrossRef] [PubMed]
- Njie-Carr, V.P.; Jones-Parker, H.; Massey, C.; Baker, D.; Nganga-Good, C. Leveraging community engagement to develop a mobile health application for older women with HIV infection. J. Obstet. Gynecol. Neonatal Nurs. 2018, 47, 833–843. [Google Scholar] [CrossRef] [PubMed]
- Dasgupta, D.; Reeves, K.G.; Chaudhry, B.; Duarte, M.; Chawla, N.V. eseniorcare: Technology for promoting well-being of older adults in independent living facilities. In Proceedings of the International Conference on Healthcare Informatics (ICHI), New York, NY, USA, 4–7 June 2016; pp. 461–472. [Google Scholar]
- Gelonch, O.; Ribera, M.; Codern-Bové, N.; Ramos, S.; Quintana, M.; Chico, G.; Cerulla, N.; Lafarga, P.; Radeva, P.; Garolera, M. Acceptability of a lifelogging wearable camera in older adults with mild cognitive impairment: A mixed-method study. BMC Geriatr. 2019, 19, 110. [Google Scholar] [CrossRef] [PubMed]
- Lopez-Samaniego, L.; Garcia-Zapirain, B.; Mendez-Zorrilla, A. Memory and accurate processing brain rehabilitation for the elderly: LEGO robot and iPad case study. Bio-Med Mater. Eng. 2014, 24, 3549–3556. [Google Scholar] [CrossRef]
- Oh, S.J.; Seo, S.; Lee, J.H.; Song, M.J.; Shin, M.S. Effects of smartphone-based memory training for older adults with subjective memory complaints: A randomized controlled trial. Aging Ment. Health 2018, 22, 526–534. [Google Scholar] [CrossRef]
- Holden, R.J.; Campbell, N.L.; Abebe, E.; Clark, D.O.; Ferguson, D.; Bodke, K.; Boustani, M.A.; Callahan, C.M.; The Brain Health Patient Safety Laboratory. Usability and feasibility of consumer-facing technology to reduce unsafe medication use by older adults. Res. Soc. Adm. Pharm. 2020, 16, 54–61. [Google Scholar] [CrossRef]
- Shima, K.; Tsuji, T.; Kandori, A.; Yokoe, M.; Sakoda, S. Measurement and evaluation of finger tapping movements using log-linearized Gaussian mixture networks. Sensors 2009, 9, 2187–2201. [Google Scholar] [CrossRef]
- Wilson, M.; Doyle, J.; McTaggart, G. Designing stress management interventions for older adults to improve wellbeing. In Proceedings of the British HCI Conference, Lincoln, Lincolnshire, UK, 13–17 July 2015; pp. 307–308. [Google Scholar]
- Lazarou, I.; Karakostas, A.; Stavropoulos, T.G.; Tsompanidis, T.; Meditskos, G.; Kompatsiaris, I.; Tsolaki, M. A novel and intelligent home monitoring system for care support of elders with cognitive impairment. J. Alzheimer’s Dis. 2016, 54, 1561–1591. [Google Scholar] [CrossRef]
- Berndt, R.D.; Takenga, M.C.; Kuehn, S.; Preik, P.; Dubbermann, D.; Juenger, M. Development of a mobile teledermatology system. Telemed. -Health 2012, 18, 668–673. [Google Scholar] [CrossRef] [PubMed]
- Danilovich, M.K.; Diaz, L.; Saberbein, G.; Healey, W.E.; Huber, G.; Corcos, D.M. Design and development of a mobile exercise application for home care aides and older adult medicaid home and community-based clients. Home Health Care Serv. Q. 2017, 36, 196–210. [Google Scholar] [CrossRef] [PubMed]
- De Backere, F.; Van den Bergh, J.; Coppers, S.; Elprama, S.; Nelis, J.; Verstichel, S.; Jacobs, A.; Coninx, K.; Ongenae, F.; De Turck, F. Social-aware event handling within the FallRisk project. Methods Inf. Med. 2017, 56, 63–73. [Google Scholar] [PubMed]
- Adams, A.T.; Murnane, E.L.; Adams, P.; Elfenbein, M.; Chang, P.F.; Sannon, S.; Gay, G.; Choudhury, T. Keppi: A tangible user interface for self-reporting pain. In Proceedings of the CHI Conference on Human Factors in Computing Systems, Montreal QC, Canada, 21–26 April 2018; pp. 1–13. [Google Scholar]
- Matson, T.E.; Anderson, M.L.; Renz, A.D.; Greenwood-Hickman, M.A.; McClure, J.B.; Rosenberg, D.E. Changes in Self-Reported Health and Psychosocial Outcomes in Older Adults Enrolled in Sedentary Behavior Intervention Study. Am. J. Health Promot. 2019, 33, 1053–1057. [Google Scholar] [CrossRef]
- Burridge, J.H.; Lee, A.C.W.; Turk, R.; Stokes, M.; Whitall, J.; Vaidyanathan, R.; Clatworthy, P.; Hughes, A.M.; Meagher, C.; Franco, E.; et al. Telehealth, wearable sensors, and the internet: Will they improve stroke outcomes through increased intensity of therapy, motivation, and adherence to rehabilitation programs? J. Neurol. Phys. Ther. 2017, 41, S32–S38. [Google Scholar] [CrossRef]
- Kuerbis, A.; Mulliken, A.; Muench, F.; Moore, A.A.; Gardner, D. Older adults and mobile technology: Factors that enhance and inhibit utilization in the context of behavioral health. Ment. Health Addict. Res. 2017, 2, 1–11. [Google Scholar] [CrossRef]
- Bartels, S.L.; van Knippenberg, R.J.; Dassen, F.C.; Asaba, E.; Patomella, A.H.; Malinowsky, C.; Verhey, F.R.; de Vugt, M.E. A narrative synthesis systematic review of digital self-monitoring interventions for middle-aged and older adults. Internet Interv. 2019, 18, 100283. [Google Scholar] [CrossRef]
- Prince, S.A.; Cardilli, L.; Reed, J.L.; Saunders, T.J.; Kite, C.; Douillette, K.; Fournier, K.; Buckley, J.P. A comparison of self-reported and device measured sedentary behaviour in adults: A systematic review and meta-analysis. Int. J. Behav. Nutr. Phys. Act. 2020, 17, 1–17. [Google Scholar] [CrossRef]
- Kanis, M.; Robben, S.; Kröse, B. How Are You Doing? Enabling Older Adults to Enrich Sensor Data with Subjective Input. In Proceedings of the 6th International Workshop on Human Behavior Understanding (HBU), Osaka, Japan, 8 September 2015; pp. 39–51. [Google Scholar]
- Le, T.; Reeder, B.; Thompson, H.; Demiris, G. Health Providers’ Perceptions of Novel Approaches to Visualizing Integrated Health Information. Methods Inf. Med. 2013, 52, 250–258. [Google Scholar]
- Hawthorn, D. Possible implications of aging for interface designers. Interact. Comput. 2000, 12, 507–528. [Google Scholar] [CrossRef]
- Chang, F.; Östlund, B. Perspectives of older adults and informal caregivers on information visualization for smart home monitoring systems: A critical review. In Proceedings of the 20th Congress of the International Ergonomics Association (IEA), Florence, Italy, 26–30 August 2018; pp. 681–690. [Google Scholar]
- Zeagler, C. Where to wear it: Functional, technical, and social considerations in on-body location for wearable technology 20 years of designing for wearability. In Proceedings of the 2017 ACM International Symposium on Wearable Computers (ISWC’17), Maui, HI, USA, 11–15 September 2017; pp. 150–157. [Google Scholar]
- Fang, Y.M.; Chang, C.C. Users’ psychological perception and perceived readability of wearable devices for elderly people. Behav. Inf. Technol. 2016, 35, 225–232. [Google Scholar] [CrossRef]


| Variable | Description | Search Keywords |
|---|---|---|
| Population | Older adults | (older OR senior OR elder *) AND |
| Intervention | Mobile technology for health information | (mobile OR wearable OR sensor) AND health * AND |
| Outcome | Self-reporting and displaying | (feedback OR visualization OR self-report OR input) |
| Studies | Count | |
|---|---|---|
| Type of data | ||
| Acceleration | [2,4,6,10,30,31,32,33,34,35,36,37,38,39,40,41,42,43,44,45,46,47,48,49,50,51,52,53,54,55,56,57,58,59,60,61,62,63,64,65,66,67,68,69,70,71,72,73,74,75,76,77,78,79,80,81,82,83] | 58 |
| Physiological parameters | [5,7,11,65,66,67,68,69,70,79,81,83,84,85,86,87,88,89,90,91,92,93,94,95,96,97] | 26 |
| Process indicators | [98,99,100,101,102,103,104,105,106,107] | 10 |
| Sleep | [5,71,79,82,83,94,108,109] | 8 |
| Emotions | [12,20,110,111,112] | 5 |
| Position | [75,76,77,78] | 4 |
| Pain | [20,111,112,113] | 4 |
| Time | [106,109,114,115] | 4 |
| Self-report | Studies | Health Data |
|---|---|---|
| On device | [7,10,11,20,30,33,35,47,65,74,76,77,86,87,88,89,90,93,94,96,102,104,106,108,110,111,112,113,115] | Sleep quality, pain level, comfort, activity time, breathing rate, glucose level, stress level, activities attainment, pulses, weight, shortness of breath, feeling sad, vital signals, mood level, medication adherence, math tasks, falling number, fitness progress. |
| On paper | [5,6,35,36,57,60,62,64,70,71,74,81,82,83,93,94,98,99,103,105,109,114] | Physical activities, domestic tasks, physical activities, food quantity, activity energy, depression, memory, feeding speed, sleep quality, working time, fatigue level, perceived effort, talk time, domestic activities, free time, falling number, text message reply. |
| Type of Technology | Self-Report on Device | Visualization on Device |
|---|---|---|
| Smartphone | [7,11,30,74,80,106,112] | [7,11,30,44,49,51,74,77,98,99,105,106,112] |
| Sensors | [35,47,65,86,90,96] | [4,34,50,53,56,65,79,90,91,95,107] |
| Smart bracelet | [20,93,94] | [2,20,81,83,92,94,109,114] |
| Tablet | [33,88,89,102,104,110,111] | [31,32,33,64,88,89,102,104,110,111] |
| Tangible | [113] | NA |
| Sensor + Smartphone | [10,87] | [10,45,52,62,68,87] |
| Smart bracelet + Sensor | NA | [70] |
| Tablet + Sensor | [108,115] | [108,115] |
| Smart bracelet + Smartphone | NA | [59] |
| Smart bracelet + Sensor + Smartphone | [76] | [76,85] |
| Visualization | Specifics | Studies | Count |
|---|---|---|---|
| On device | [2,4,7,10,11,20,30,31,32,33,34,44,45,49,50,51,52,53,56,59,62,64,65,68,70,74,76,77,79,81,83,85,87,88,89,90,91,92,94,95,98,99,102,104,105,106,107,108,109,110,111,112,114,115] | 54 | |
| Is it for older adults? | [2,4,7,10,11,20,30,31,32,33,34,45,49,50,51,52,53,56,59,64,65,68,70,74,76,77,79,81,83,87,88,89,90,91,92,94,95,98,99,102,104,105,106,107,108,109,110,111,112,114,115] | 51 | |
| Was it evaluated? | [4,7,11,30,31,33,51,52,68,89,102,106] | 12 | |
| External | [5,6,12,35,36,38,39,40,41,42,43,47,48,55,57,58,61,63,67,69,72,73,75,78,80,82,84,86,93,96,97,100,103,113] | 34 | |
| Is it for older adults? | [35,58,72,113] | 4 | |
| Was it evaluated? | [72,113] | 2 |
© 2020 by the authors. Licensee MDPI, Basel, Switzerland. This article is an open access article distributed under the terms and conditions of the Creative Commons Attribution (CC BY) license (http://creativecommons.org/licenses/by/4.0/).
Share and Cite
Cajamarca, G.; Herskovic, V.; Rossel, P.O. Enabling Older Adults’ Health Self-Management through Self-Report and Visualization—A Systematic Literature Review. Sensors 2020, 20, 4348. https://doi.org/10.3390/s20154348
Cajamarca G, Herskovic V, Rossel PO. Enabling Older Adults’ Health Self-Management through Self-Report and Visualization—A Systematic Literature Review. Sensors. 2020; 20(15):4348. https://doi.org/10.3390/s20154348
Chicago/Turabian StyleCajamarca, Gabriela, Valeria Herskovic, and Pedro O. Rossel. 2020. "Enabling Older Adults’ Health Self-Management through Self-Report and Visualization—A Systematic Literature Review" Sensors 20, no. 15: 4348. https://doi.org/10.3390/s20154348
APA StyleCajamarca, G., Herskovic, V., & Rossel, P. O. (2020). Enabling Older Adults’ Health Self-Management through Self-Report and Visualization—A Systematic Literature Review. Sensors, 20(15), 4348. https://doi.org/10.3390/s20154348