The Impact of the Improved Search Object Detection on the SAR Action Success Probability in Maritime Transport

 ,
,
Abstract
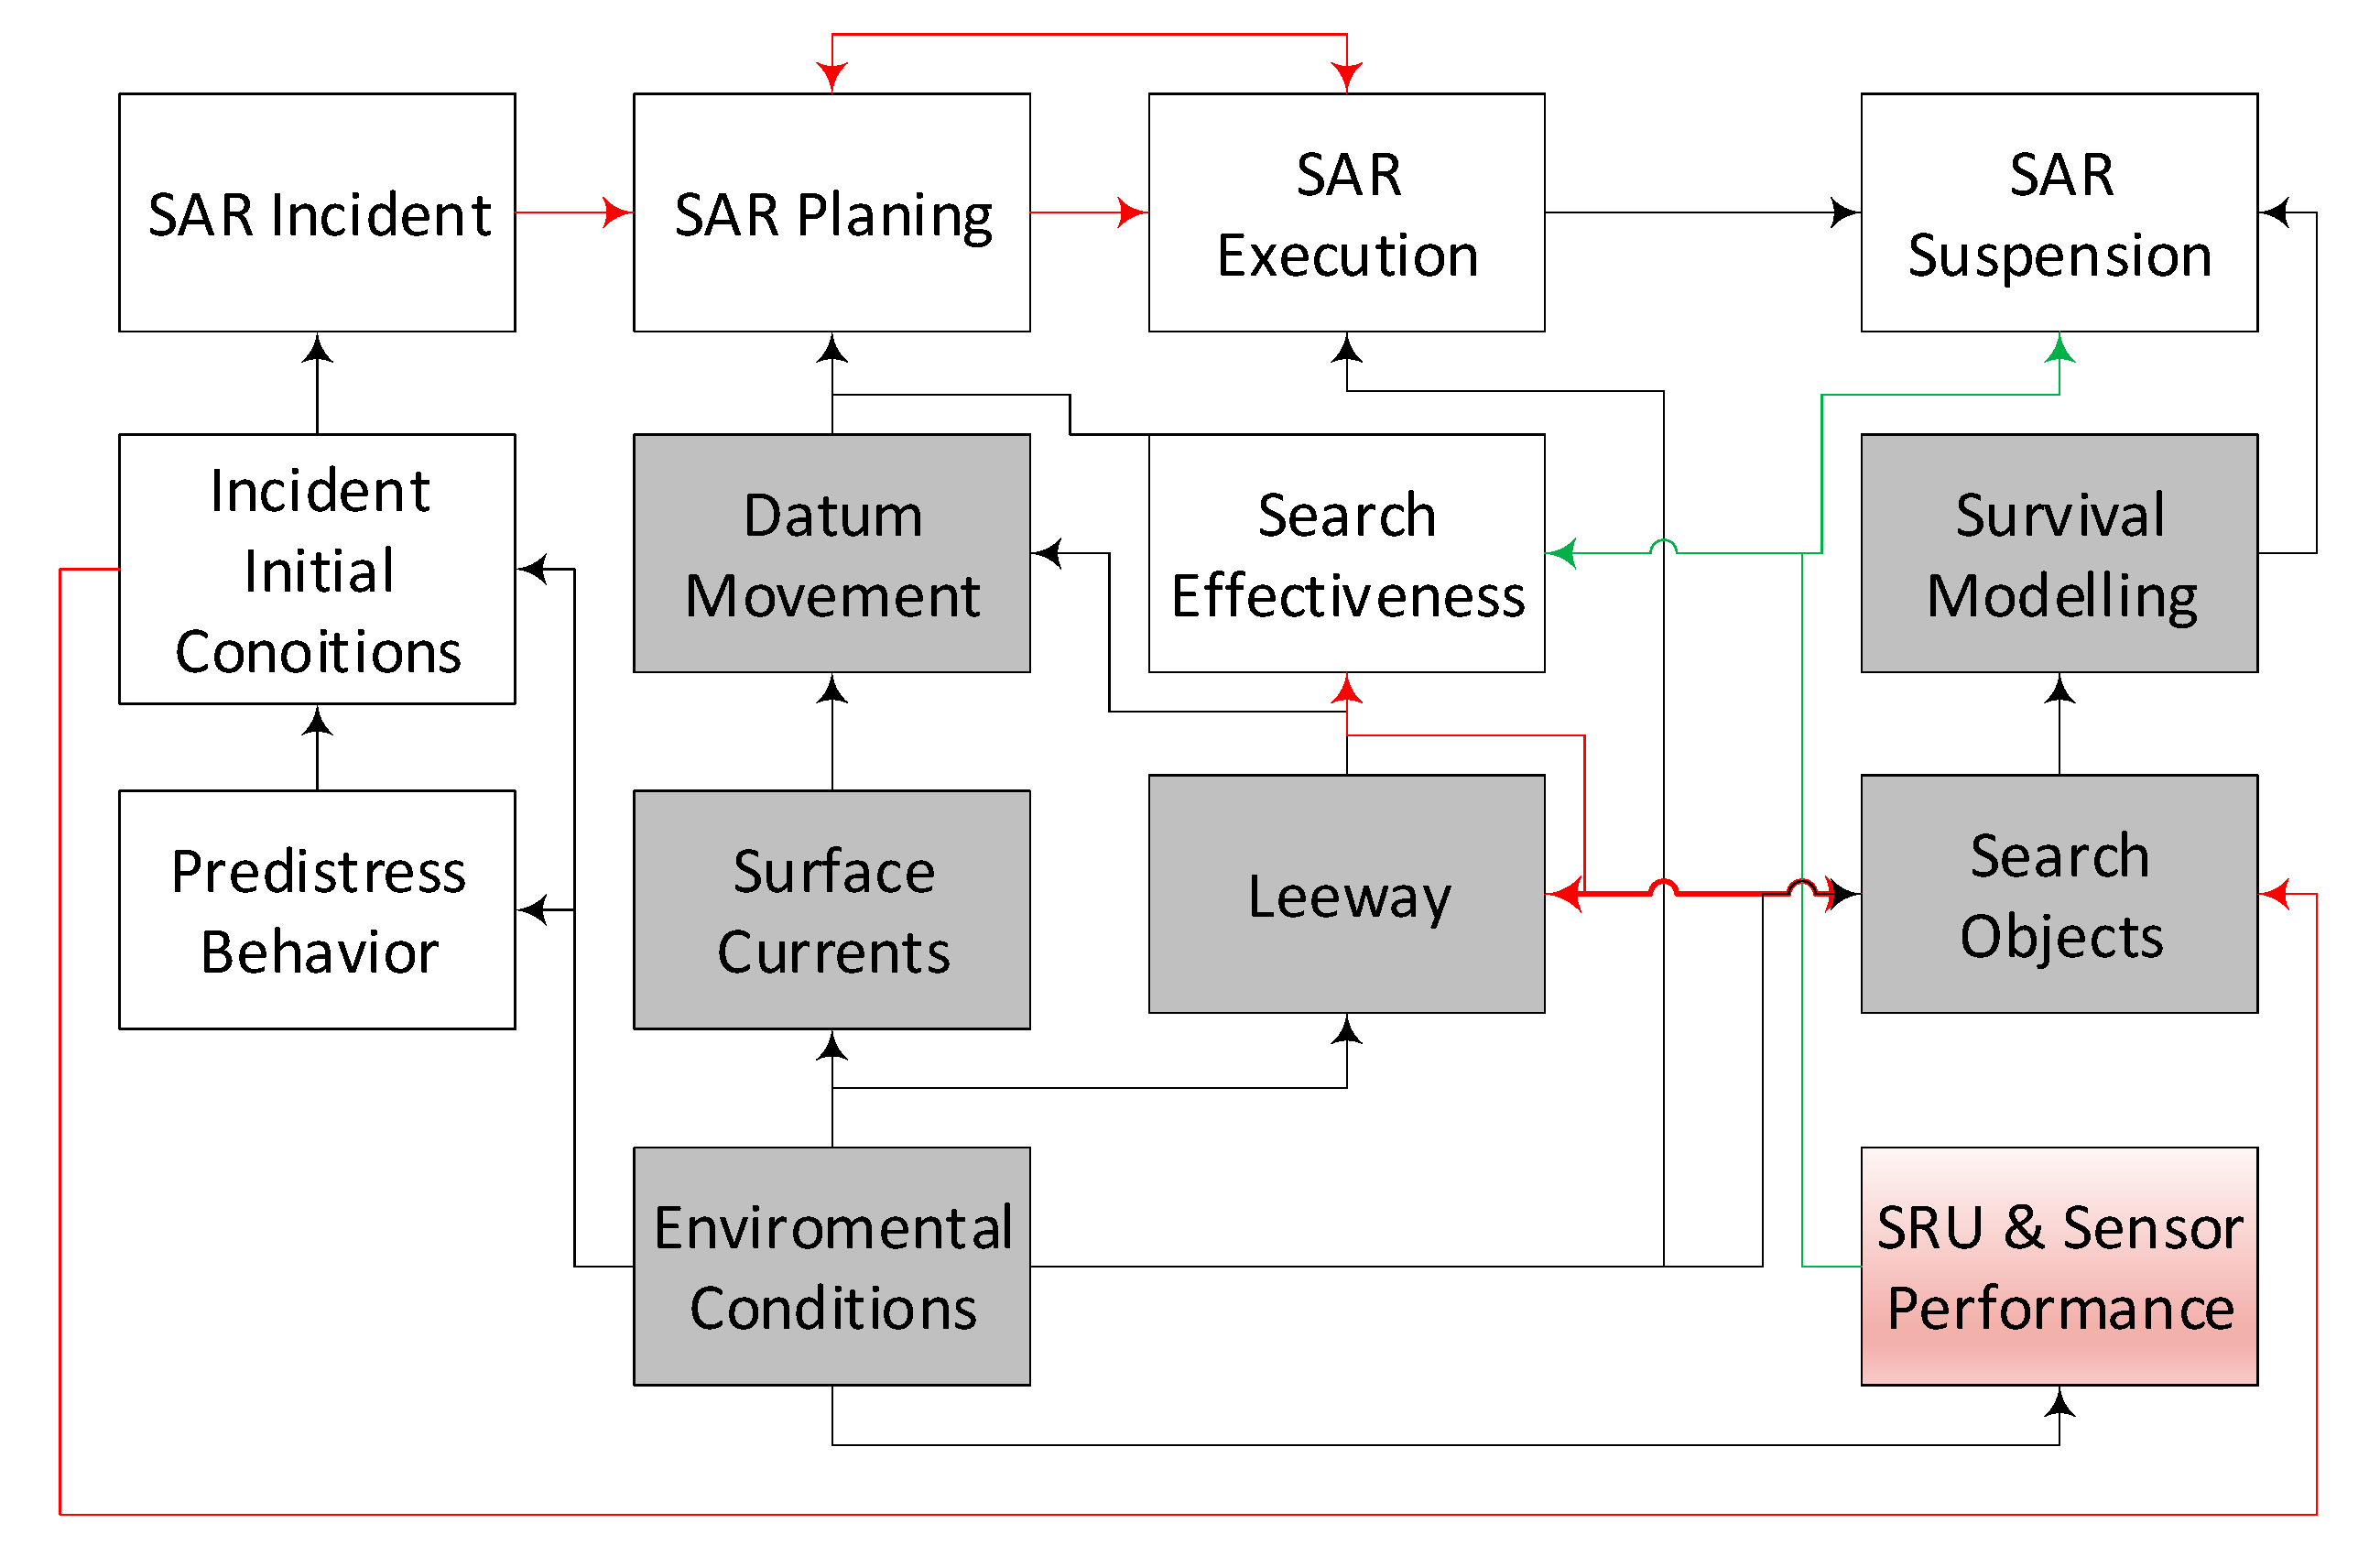
1. Introduction
2. Materials and Methods
2.1. Factors Affecting the Reliability of SAR Actions
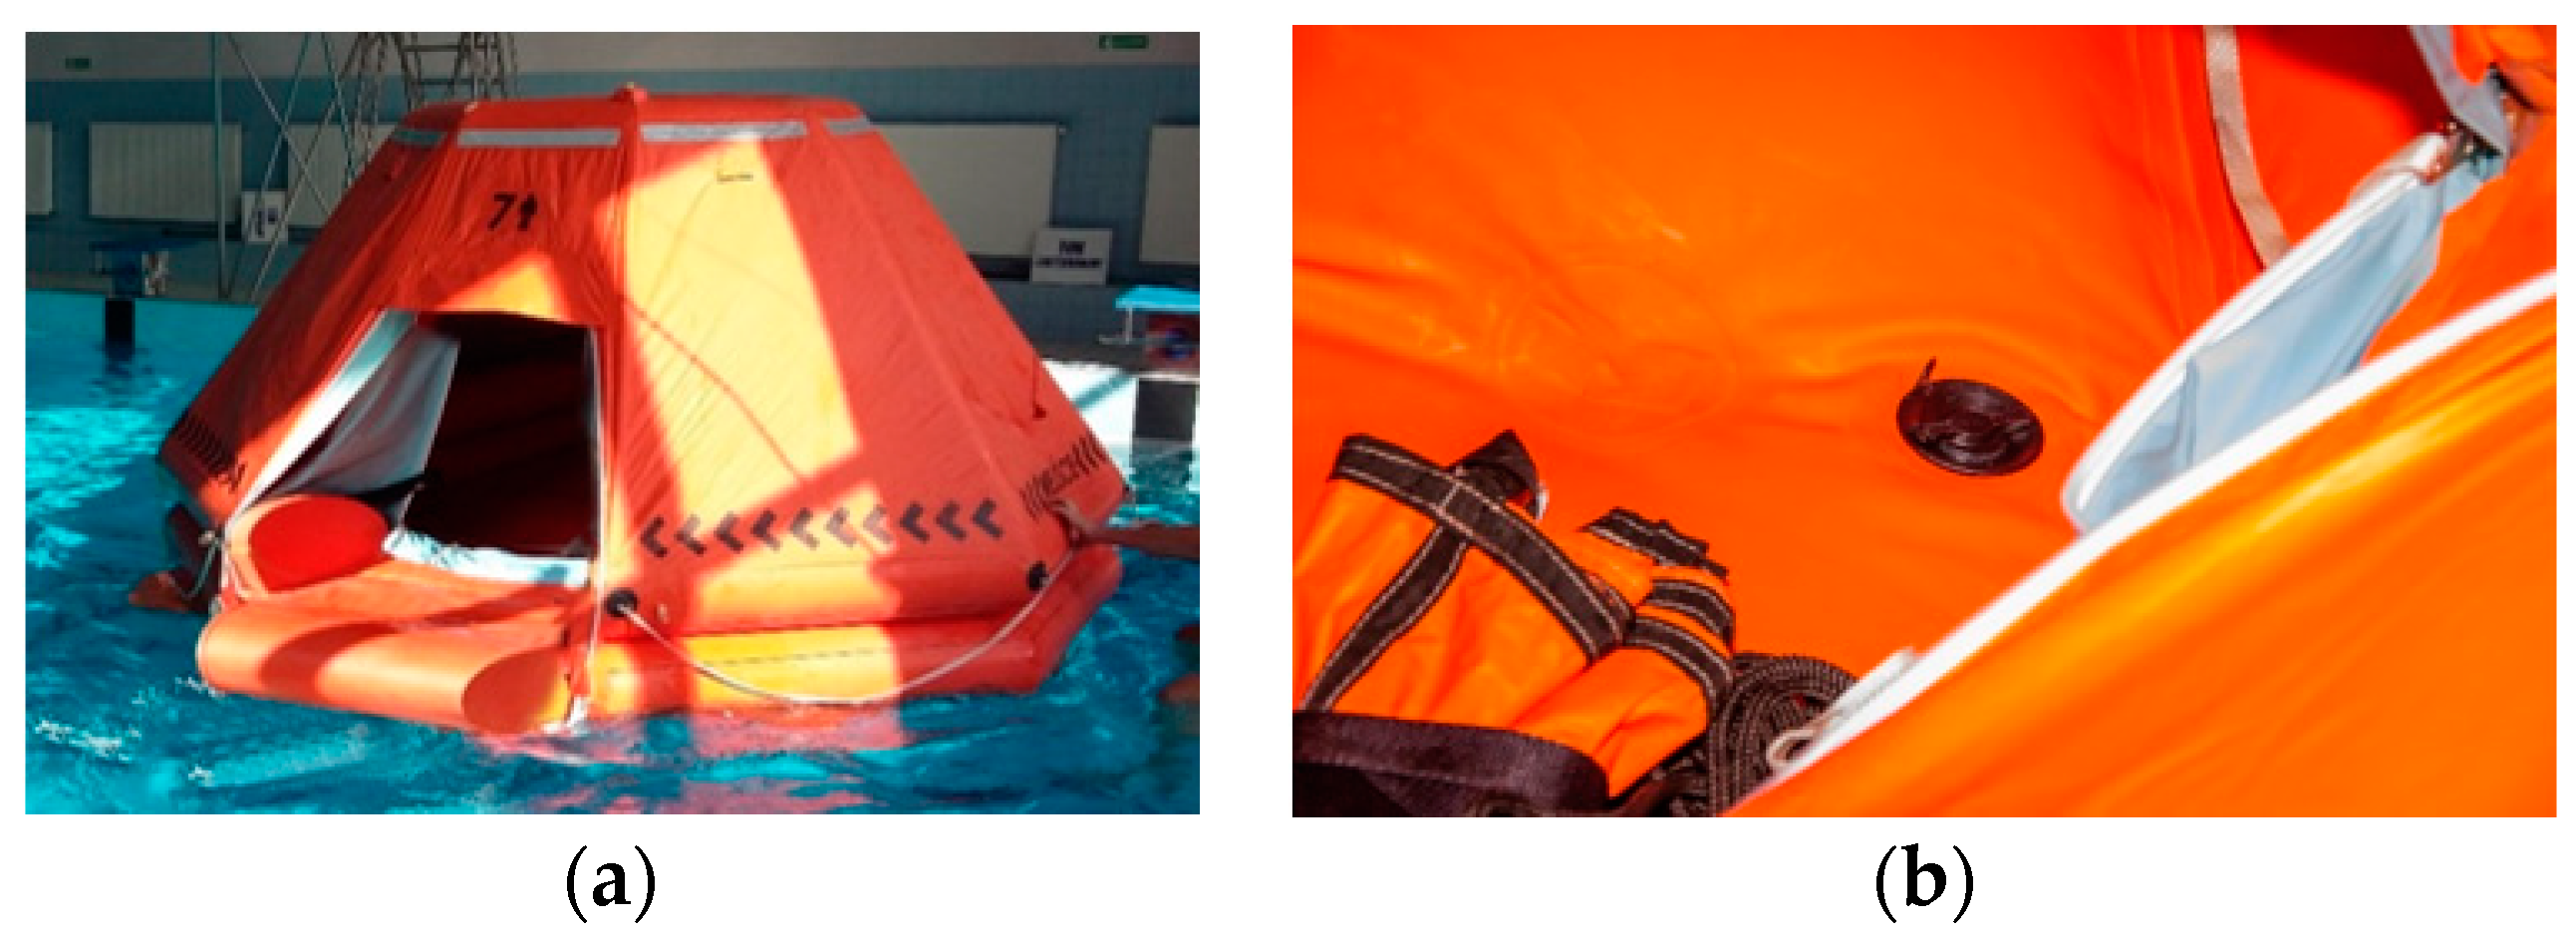
2.1.1. Life Raft Reliability
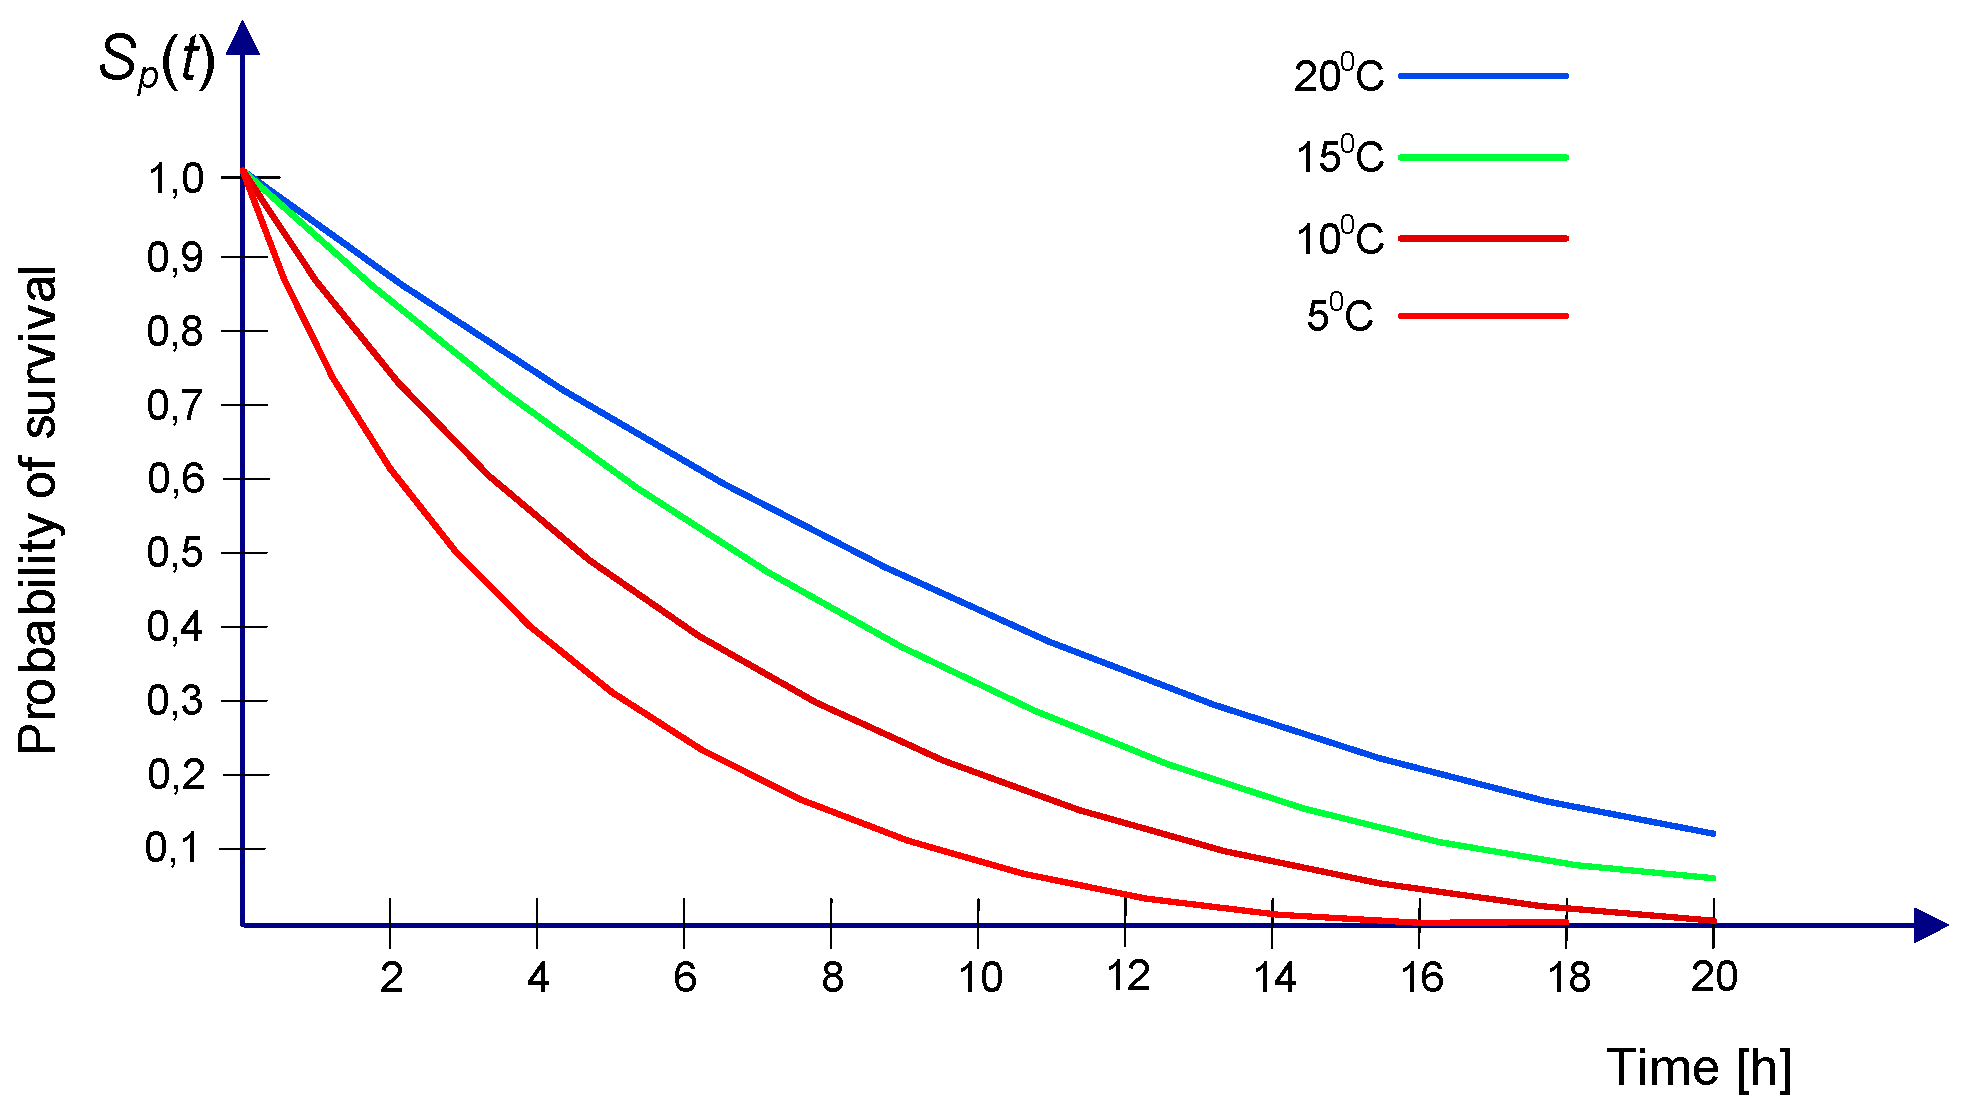
2.1.2. Probability of Survival
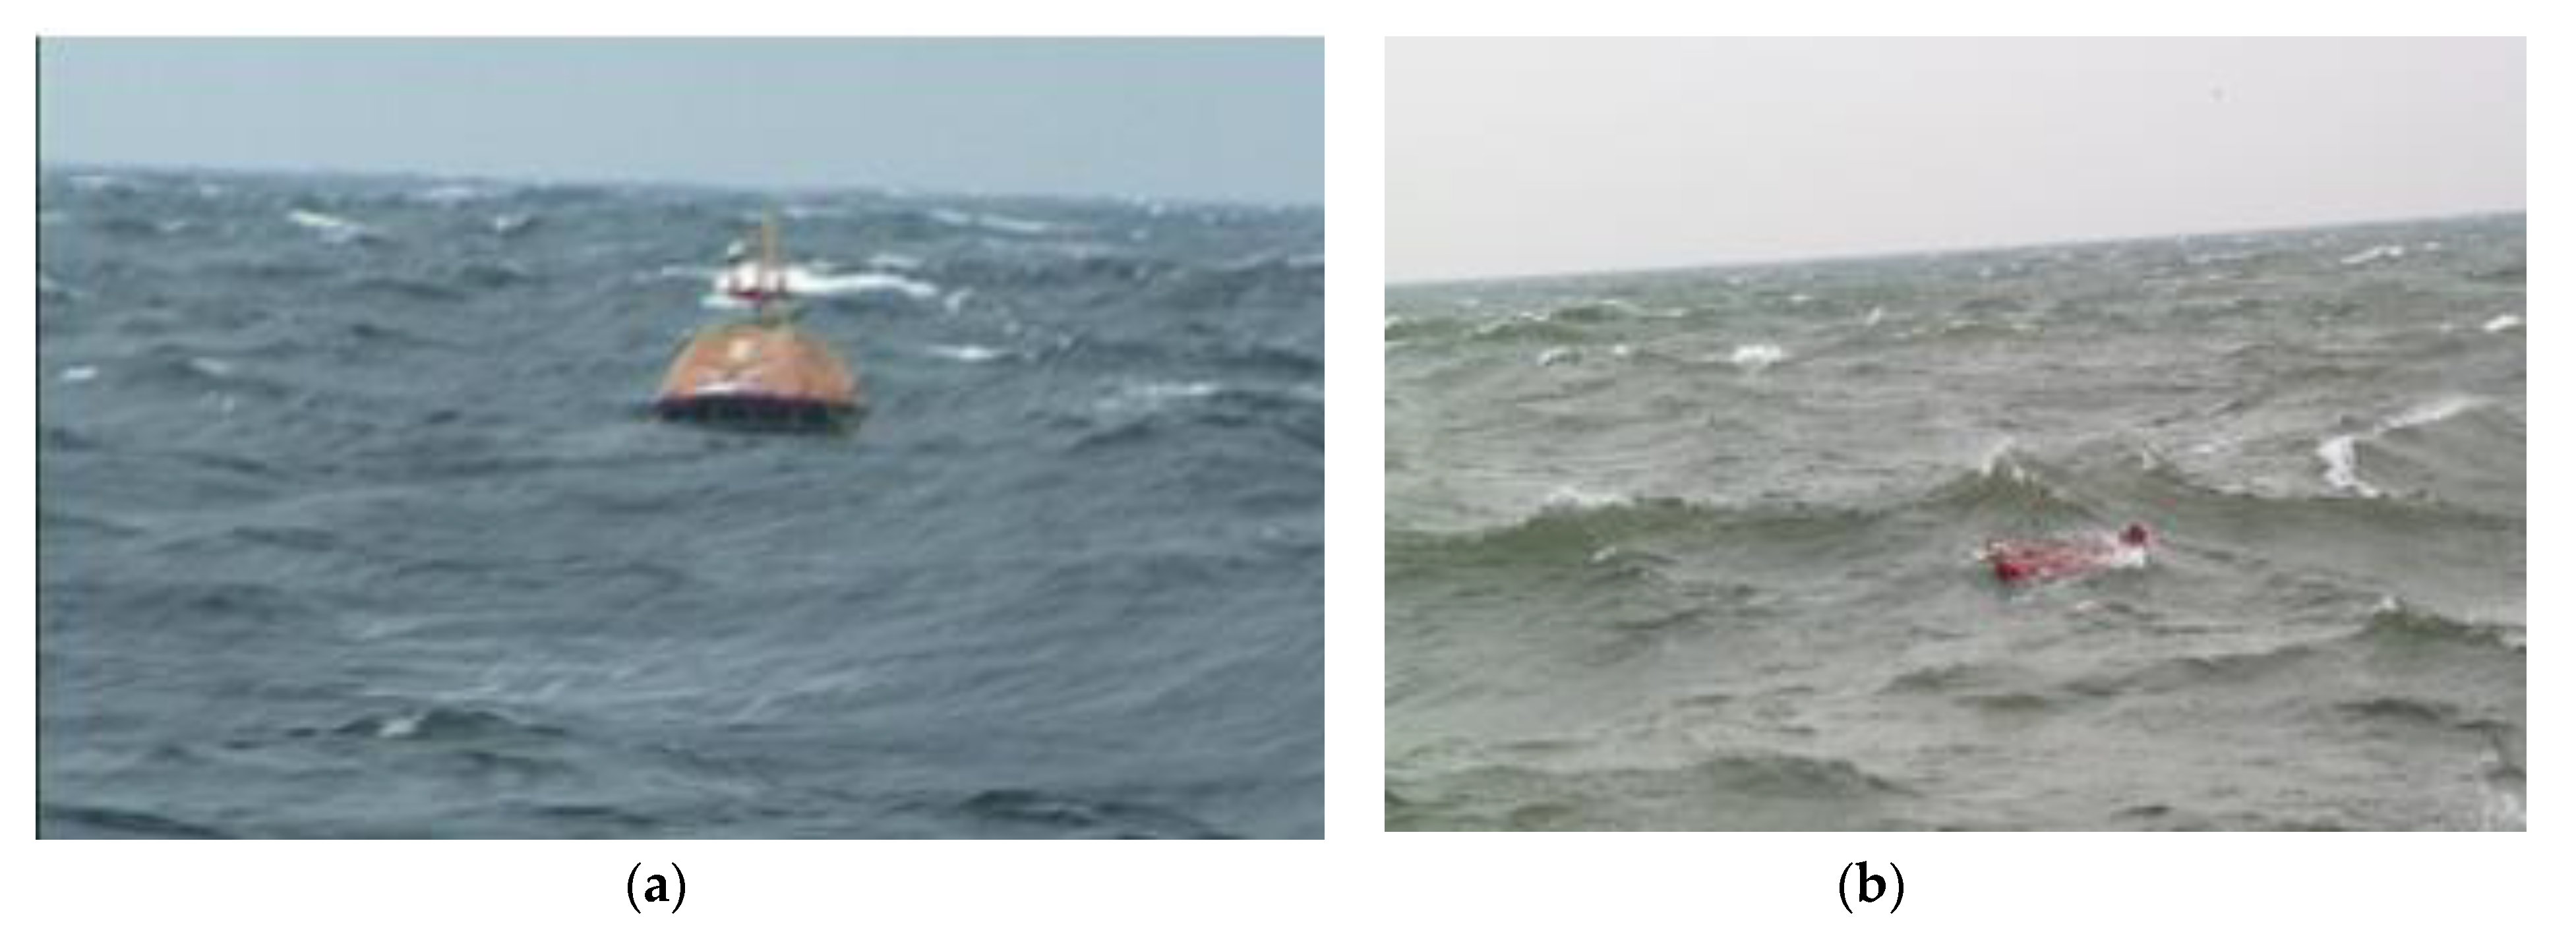
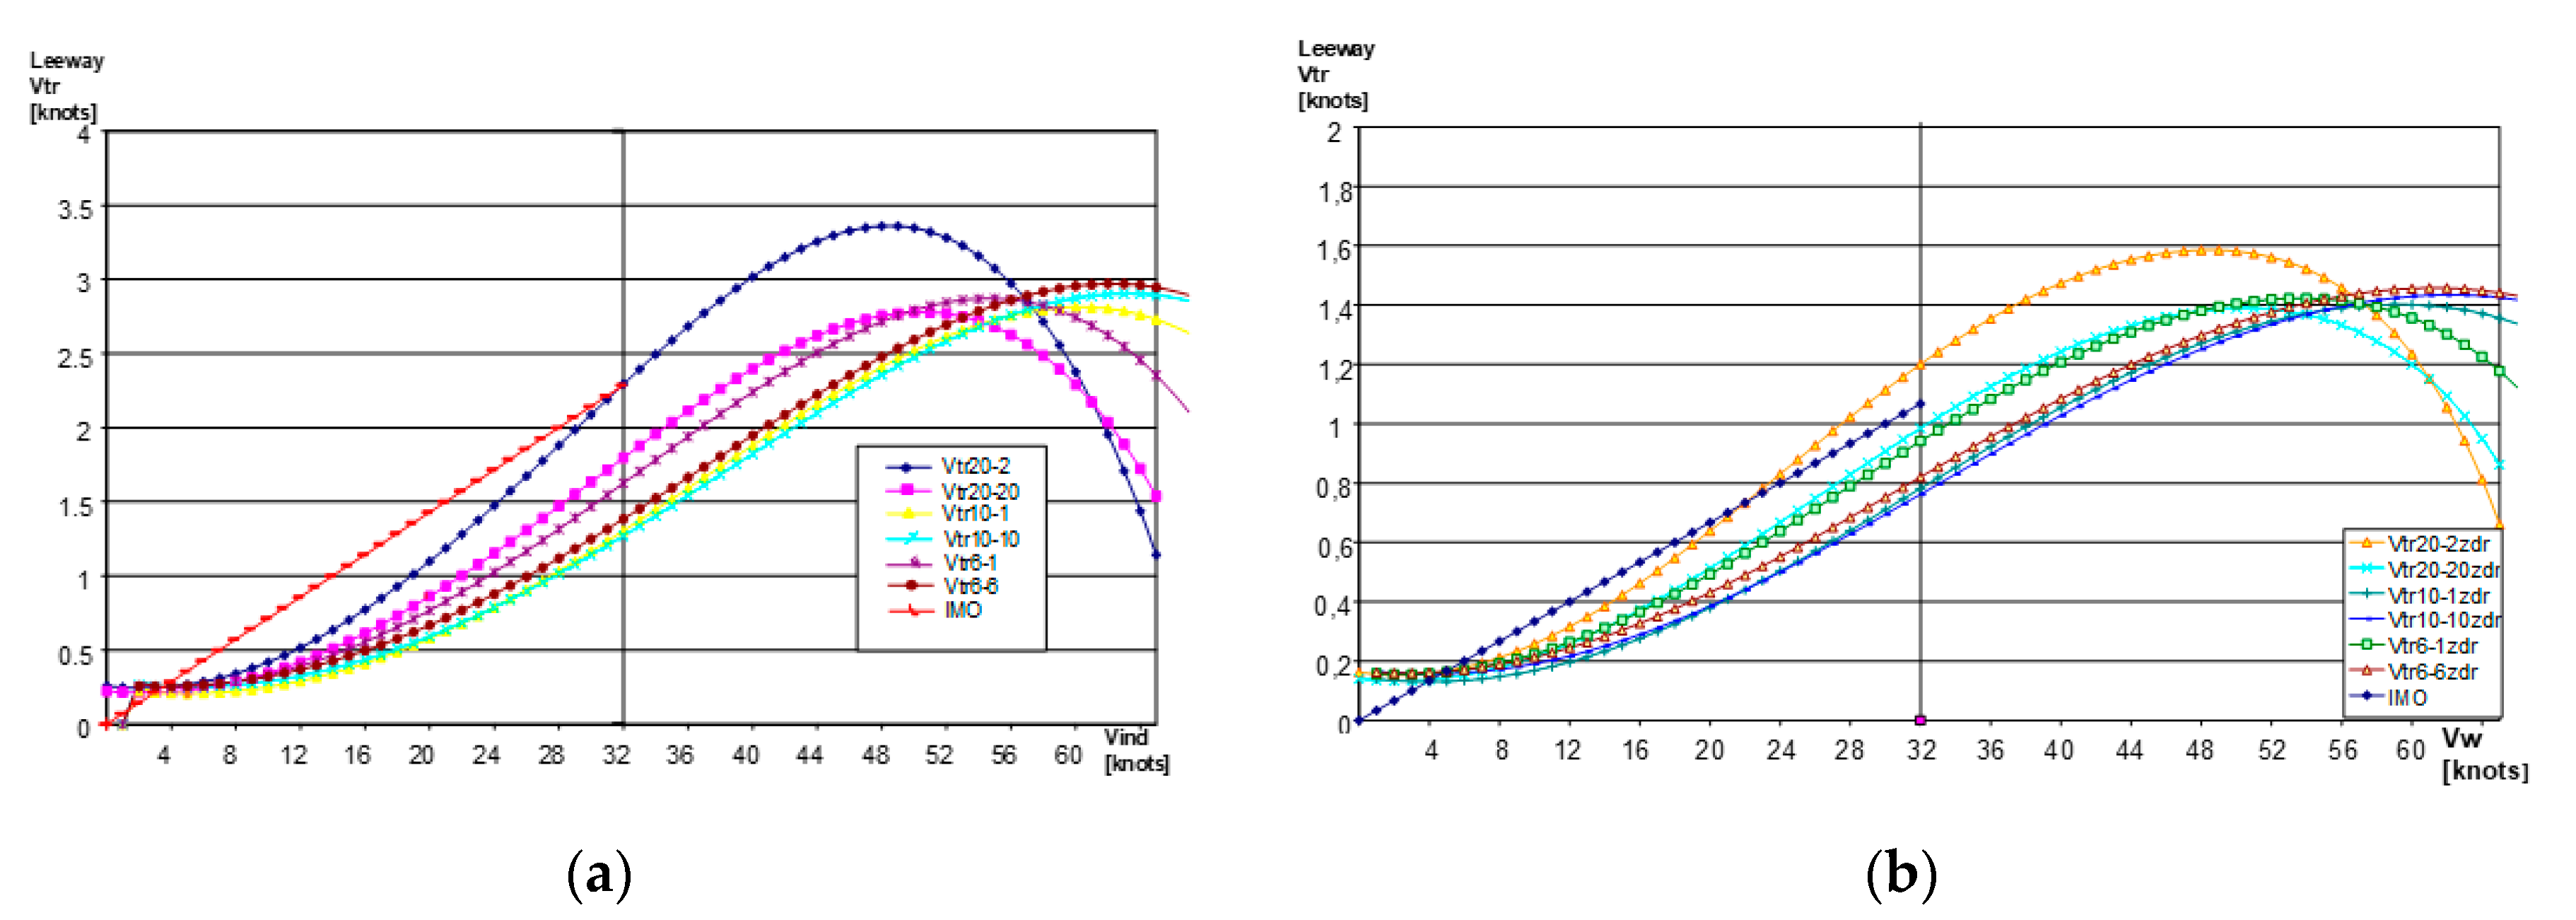
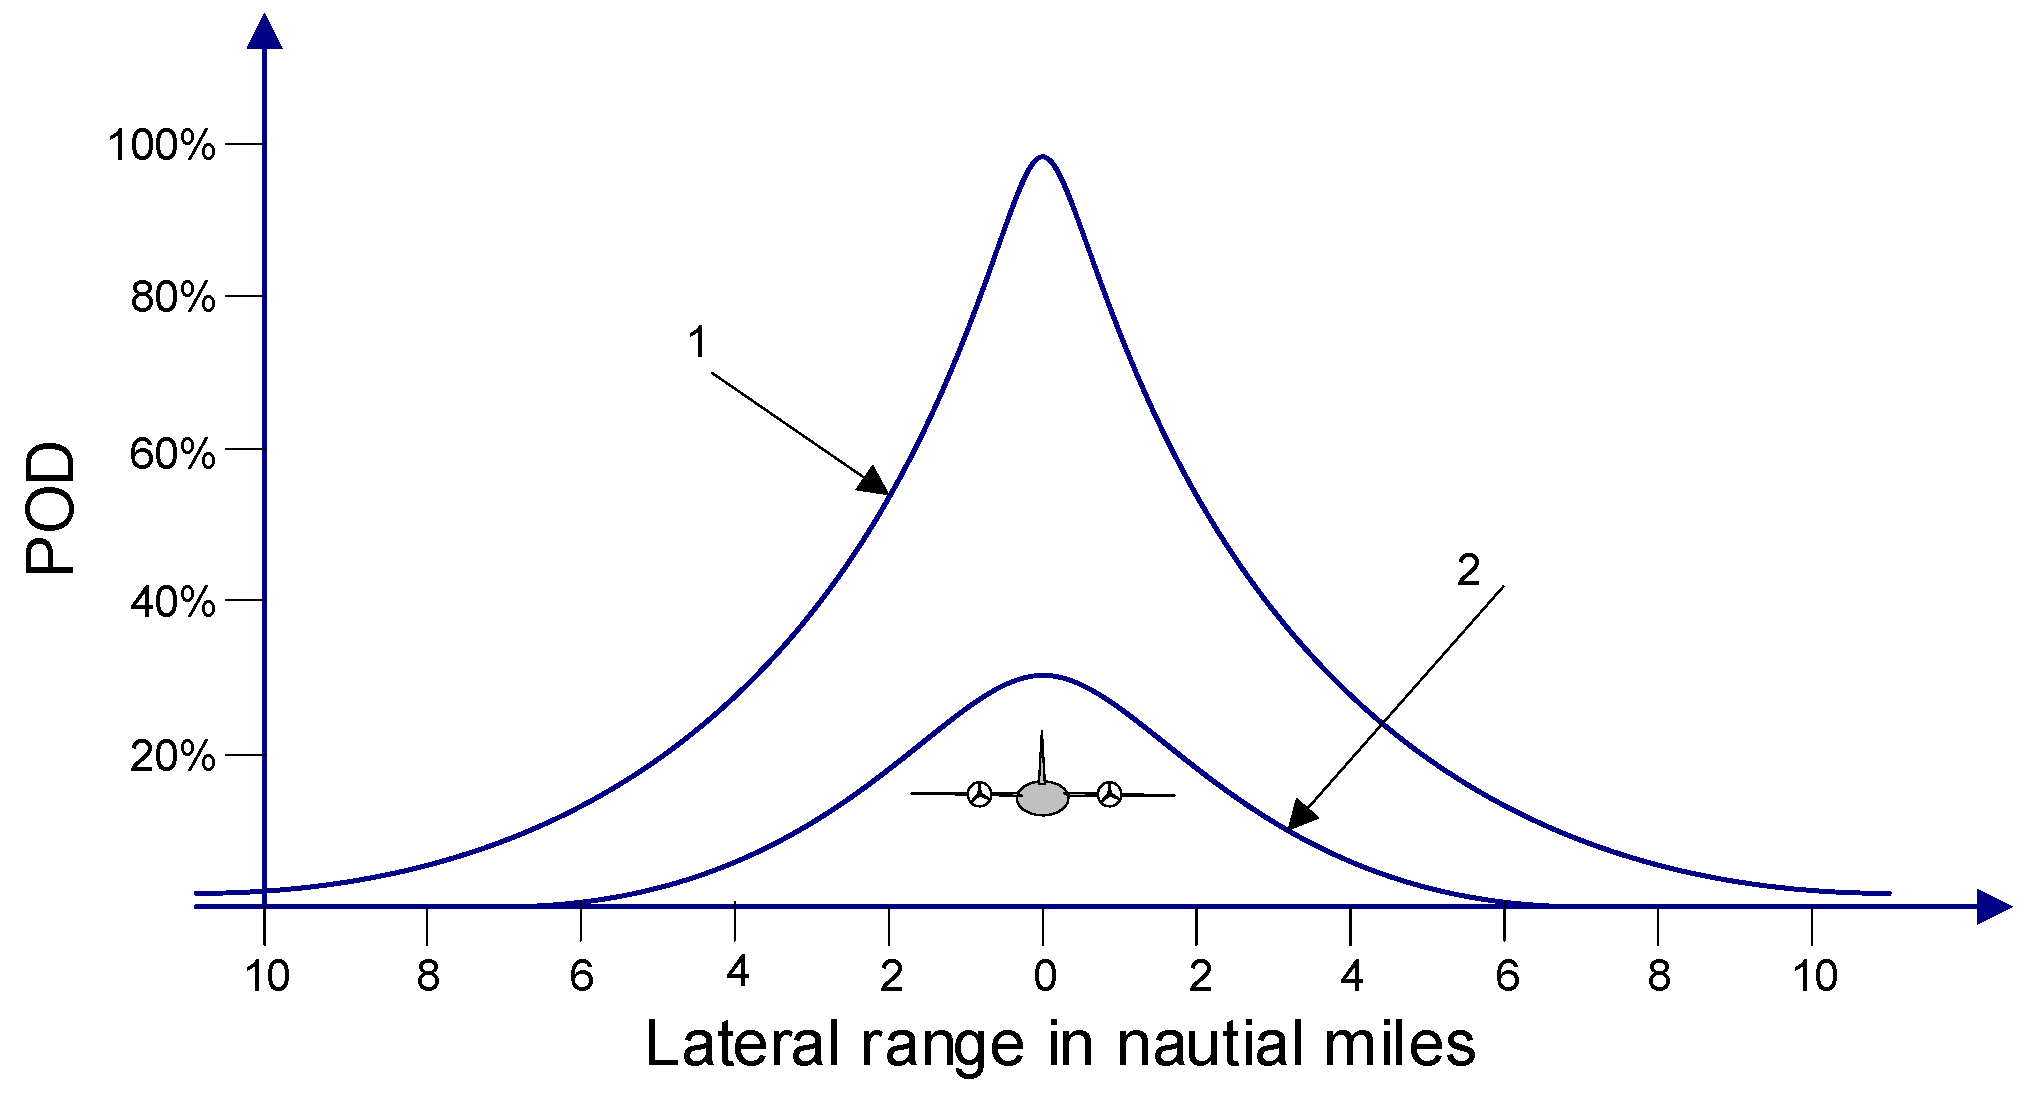
2.2. Detectability of the Search Object at Sea
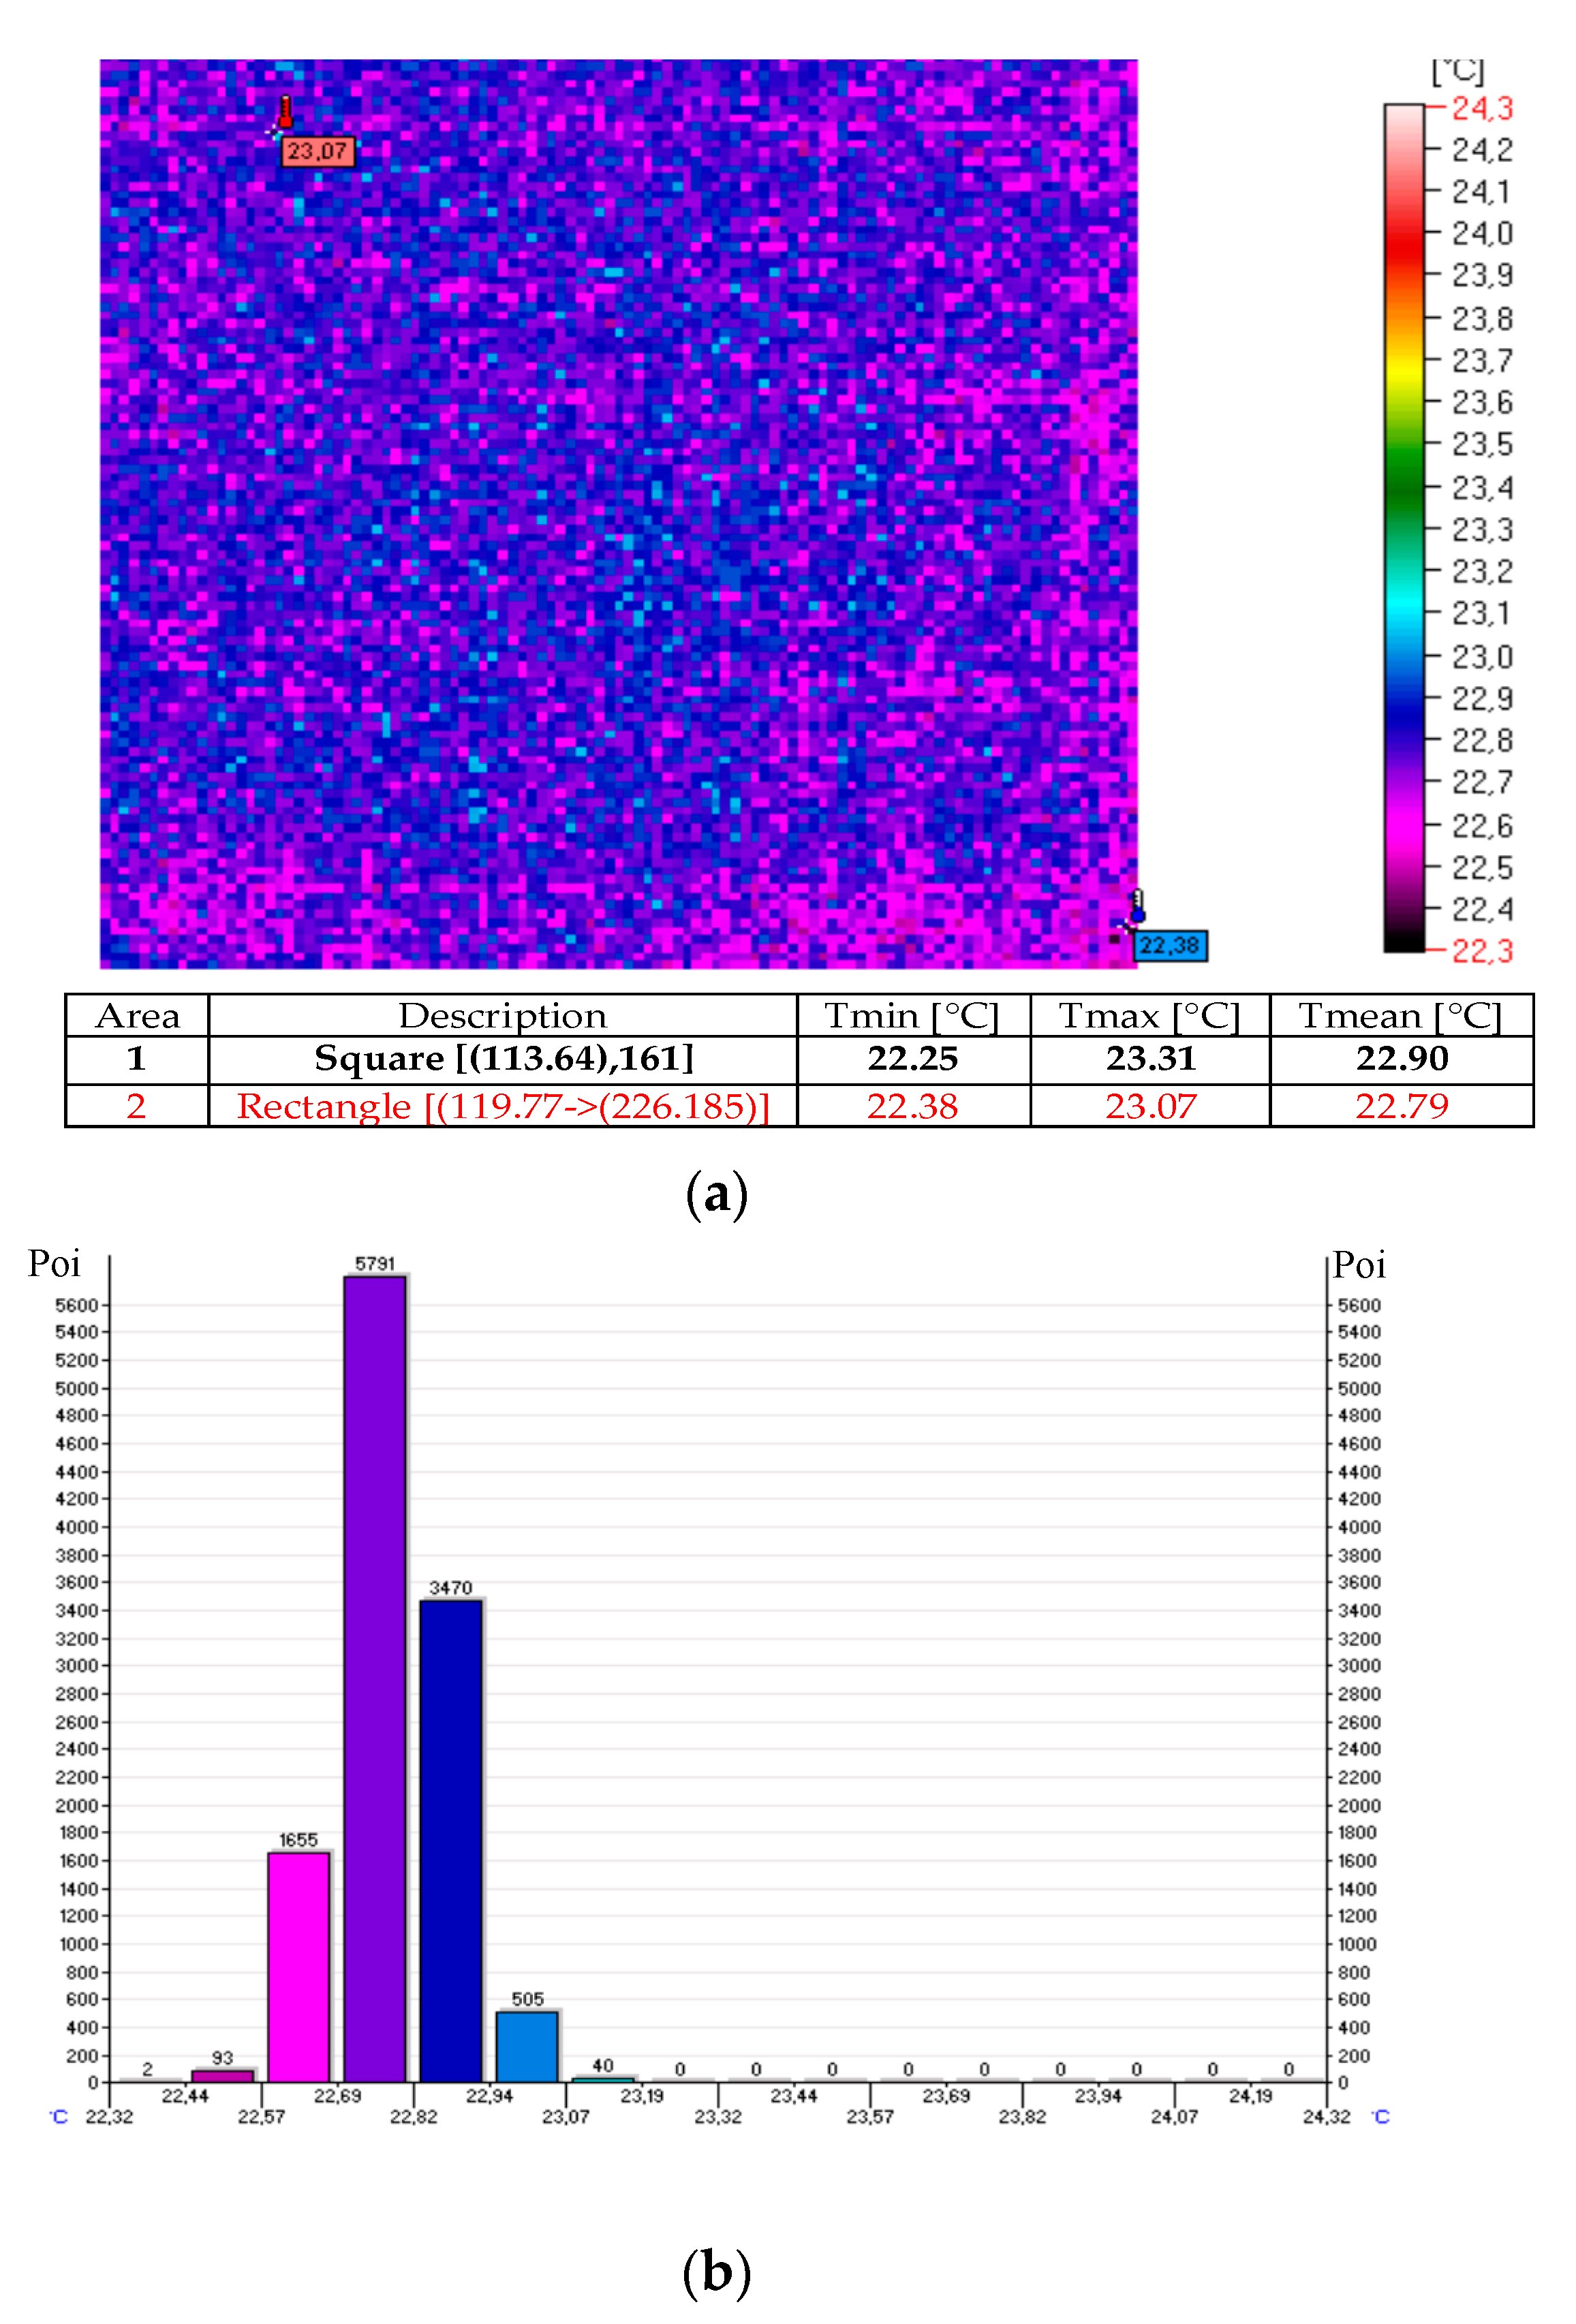
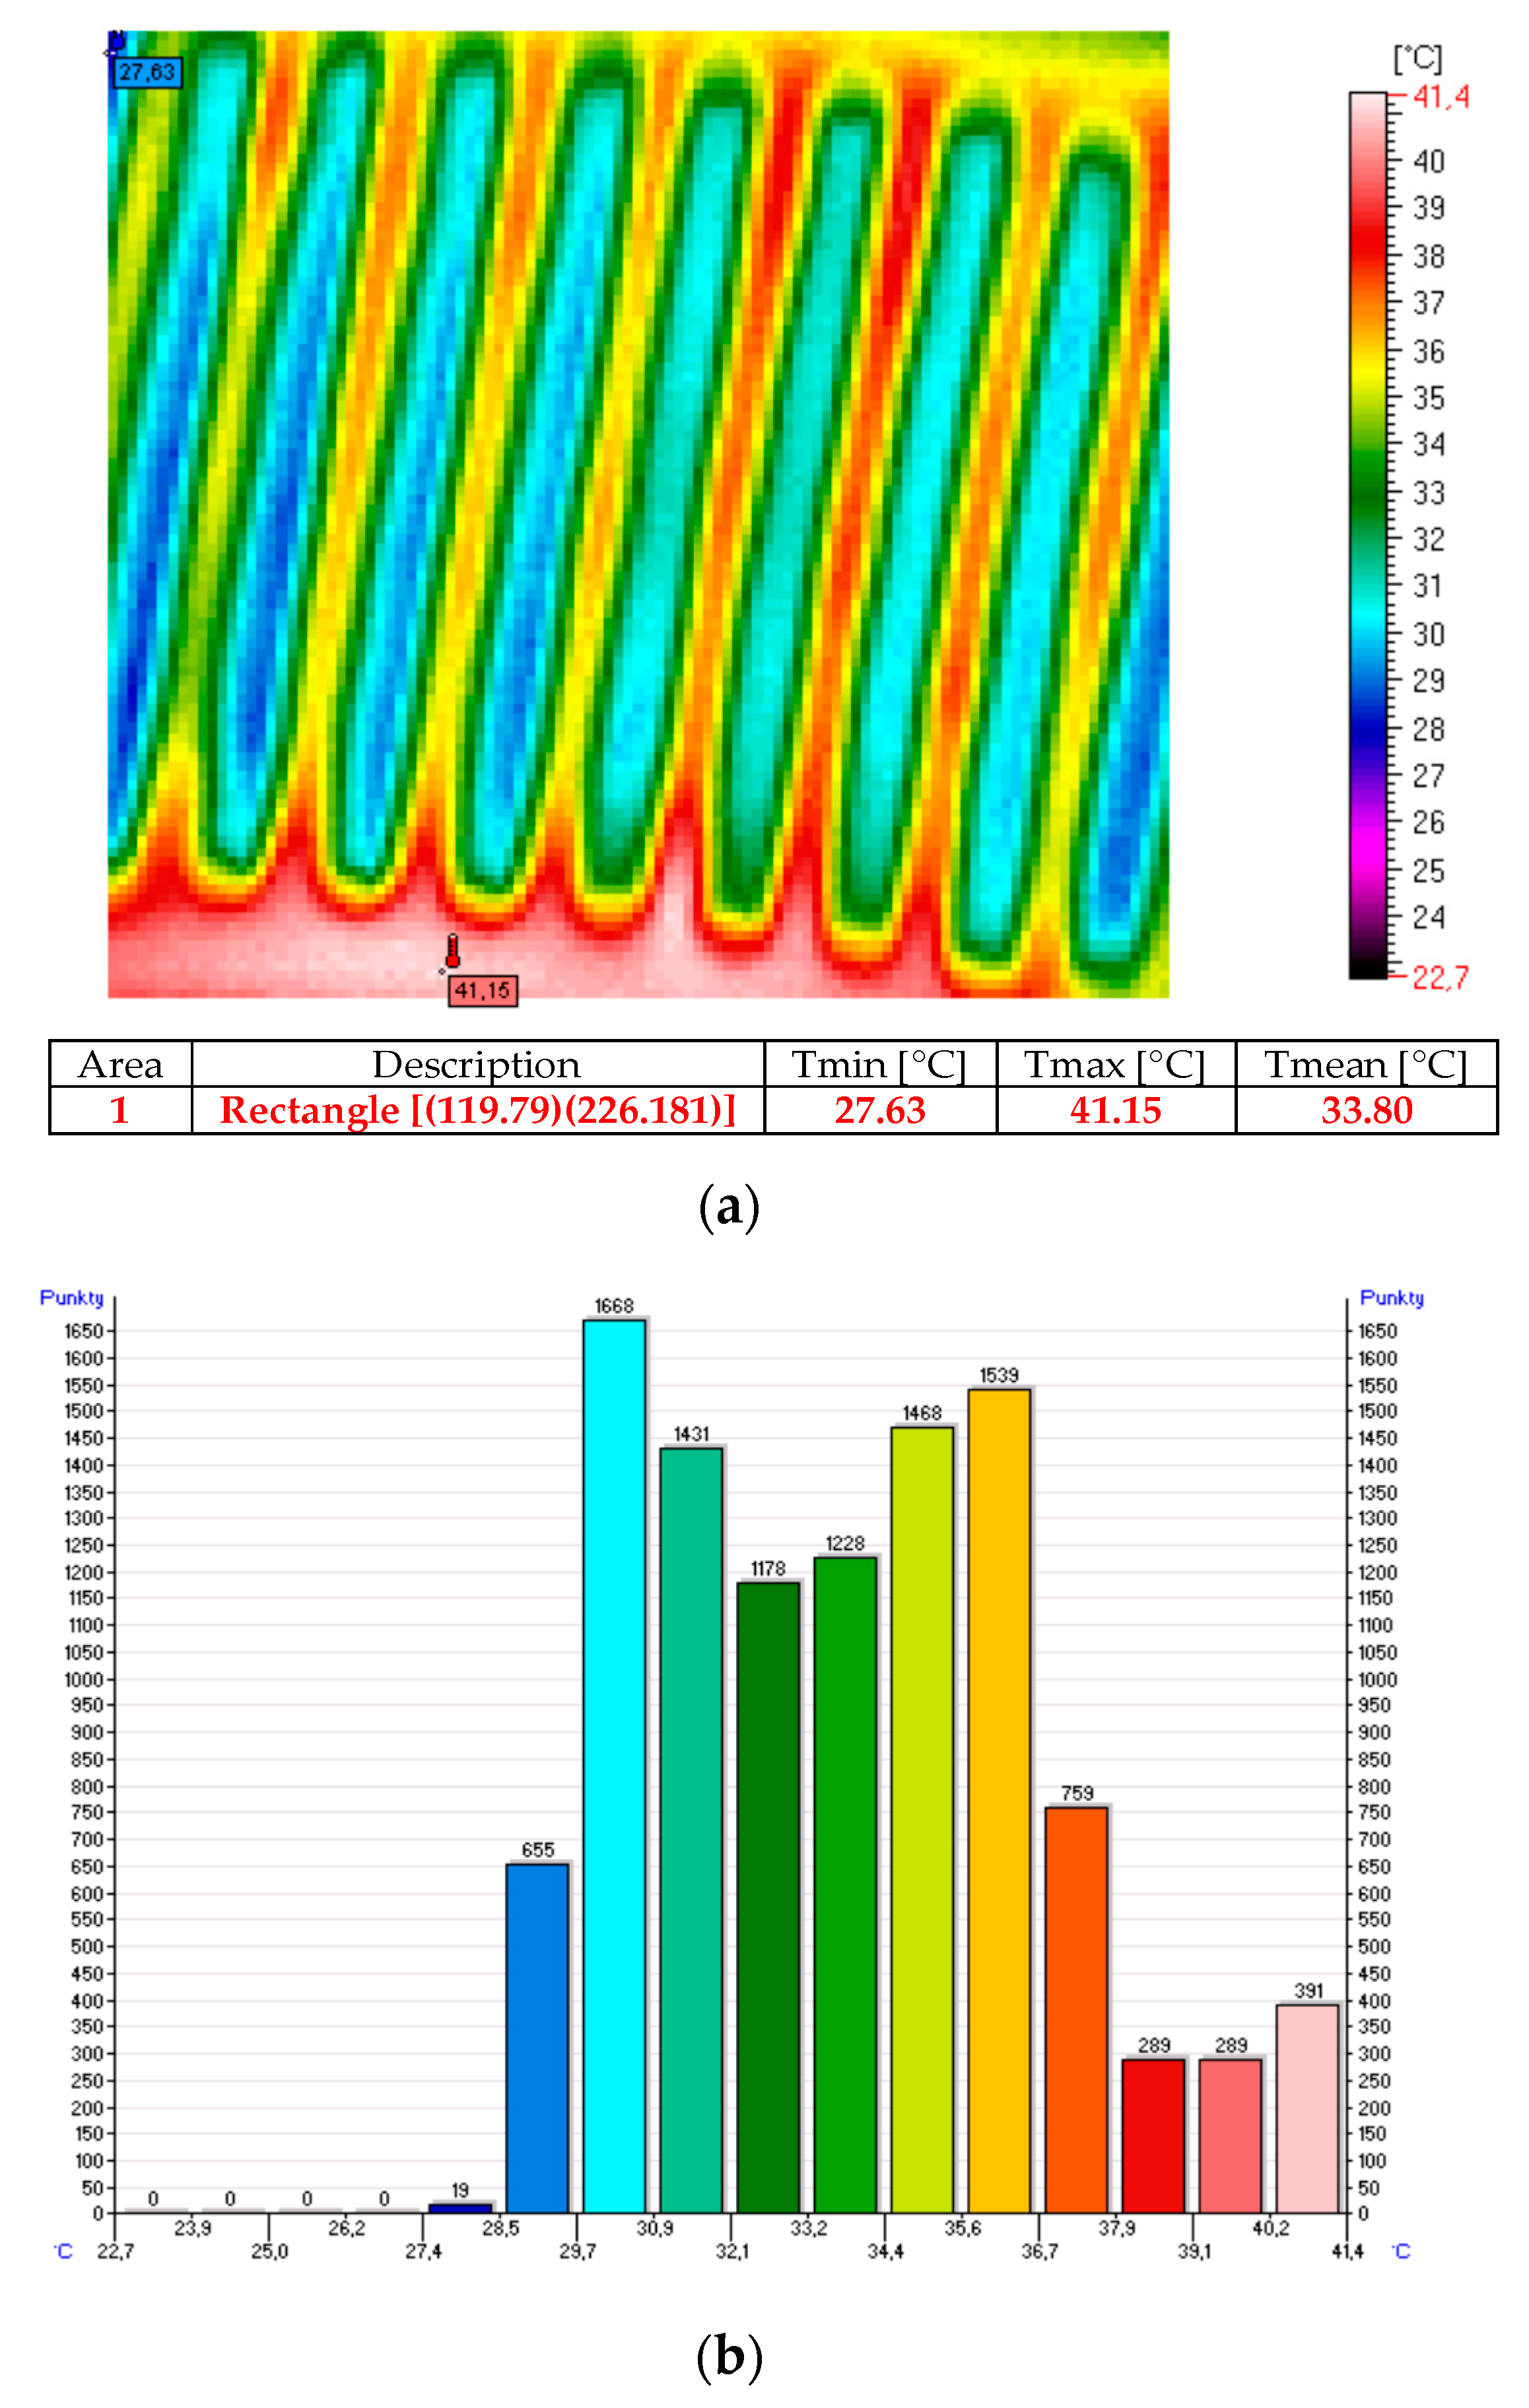
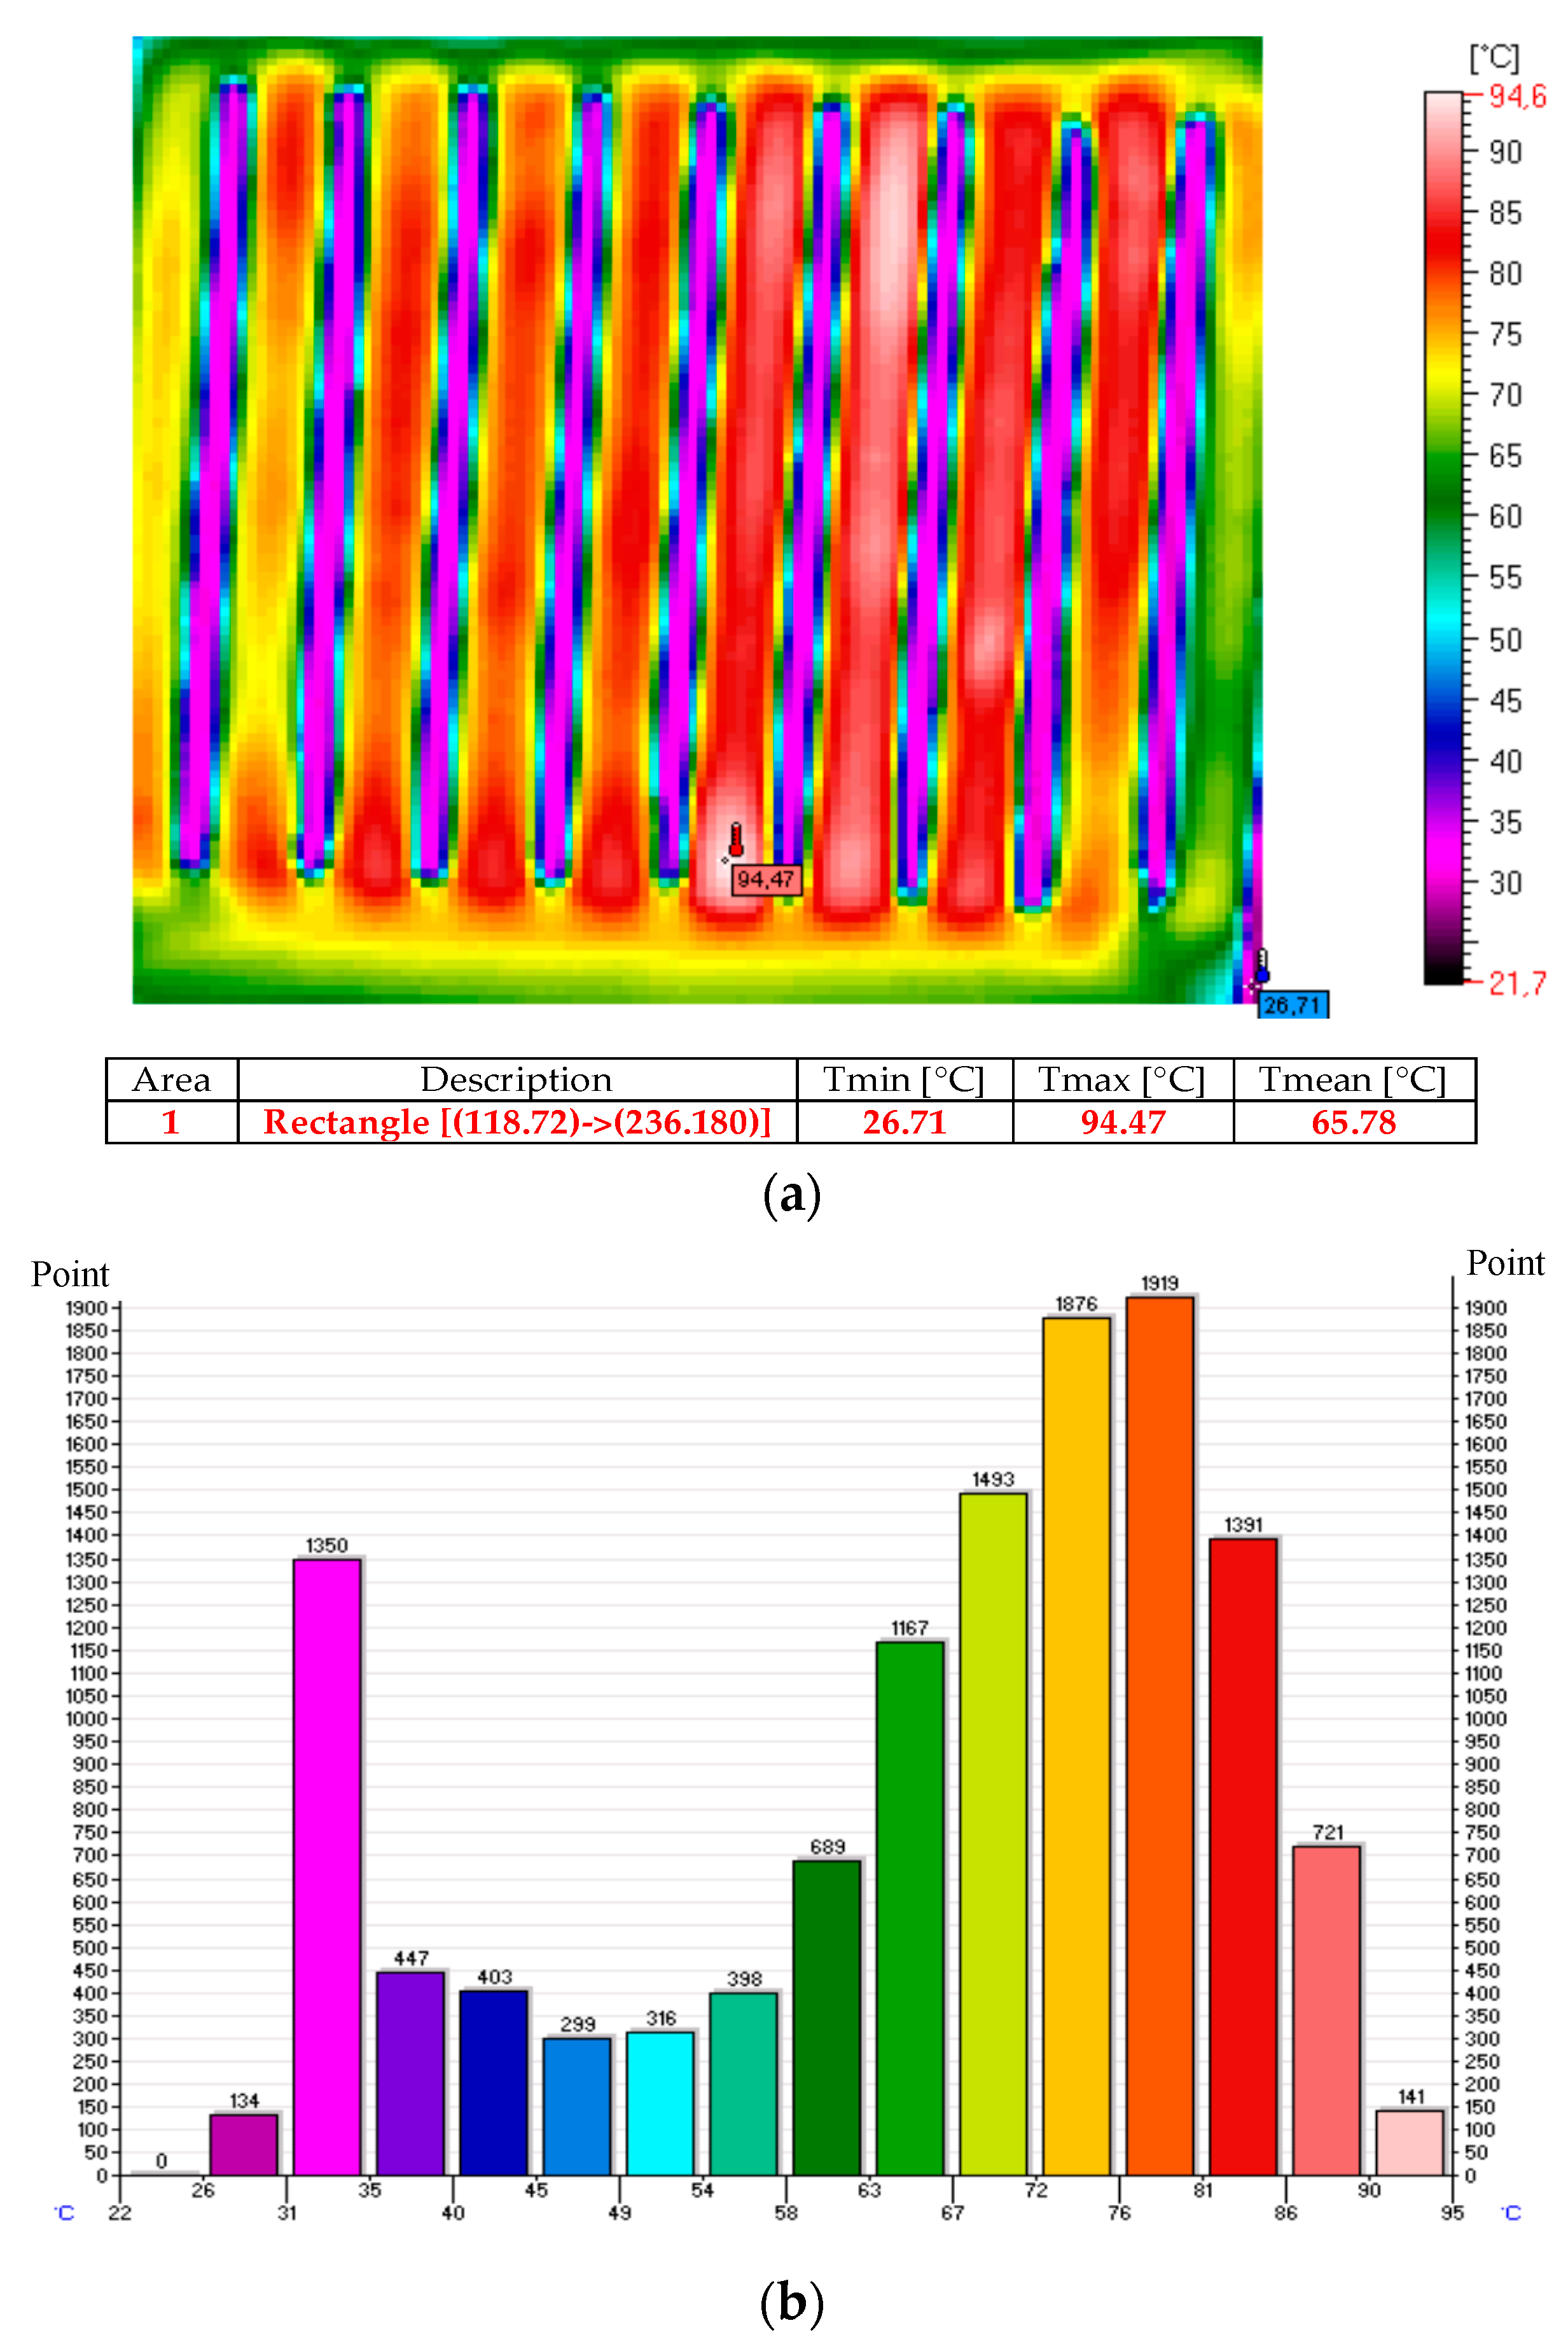
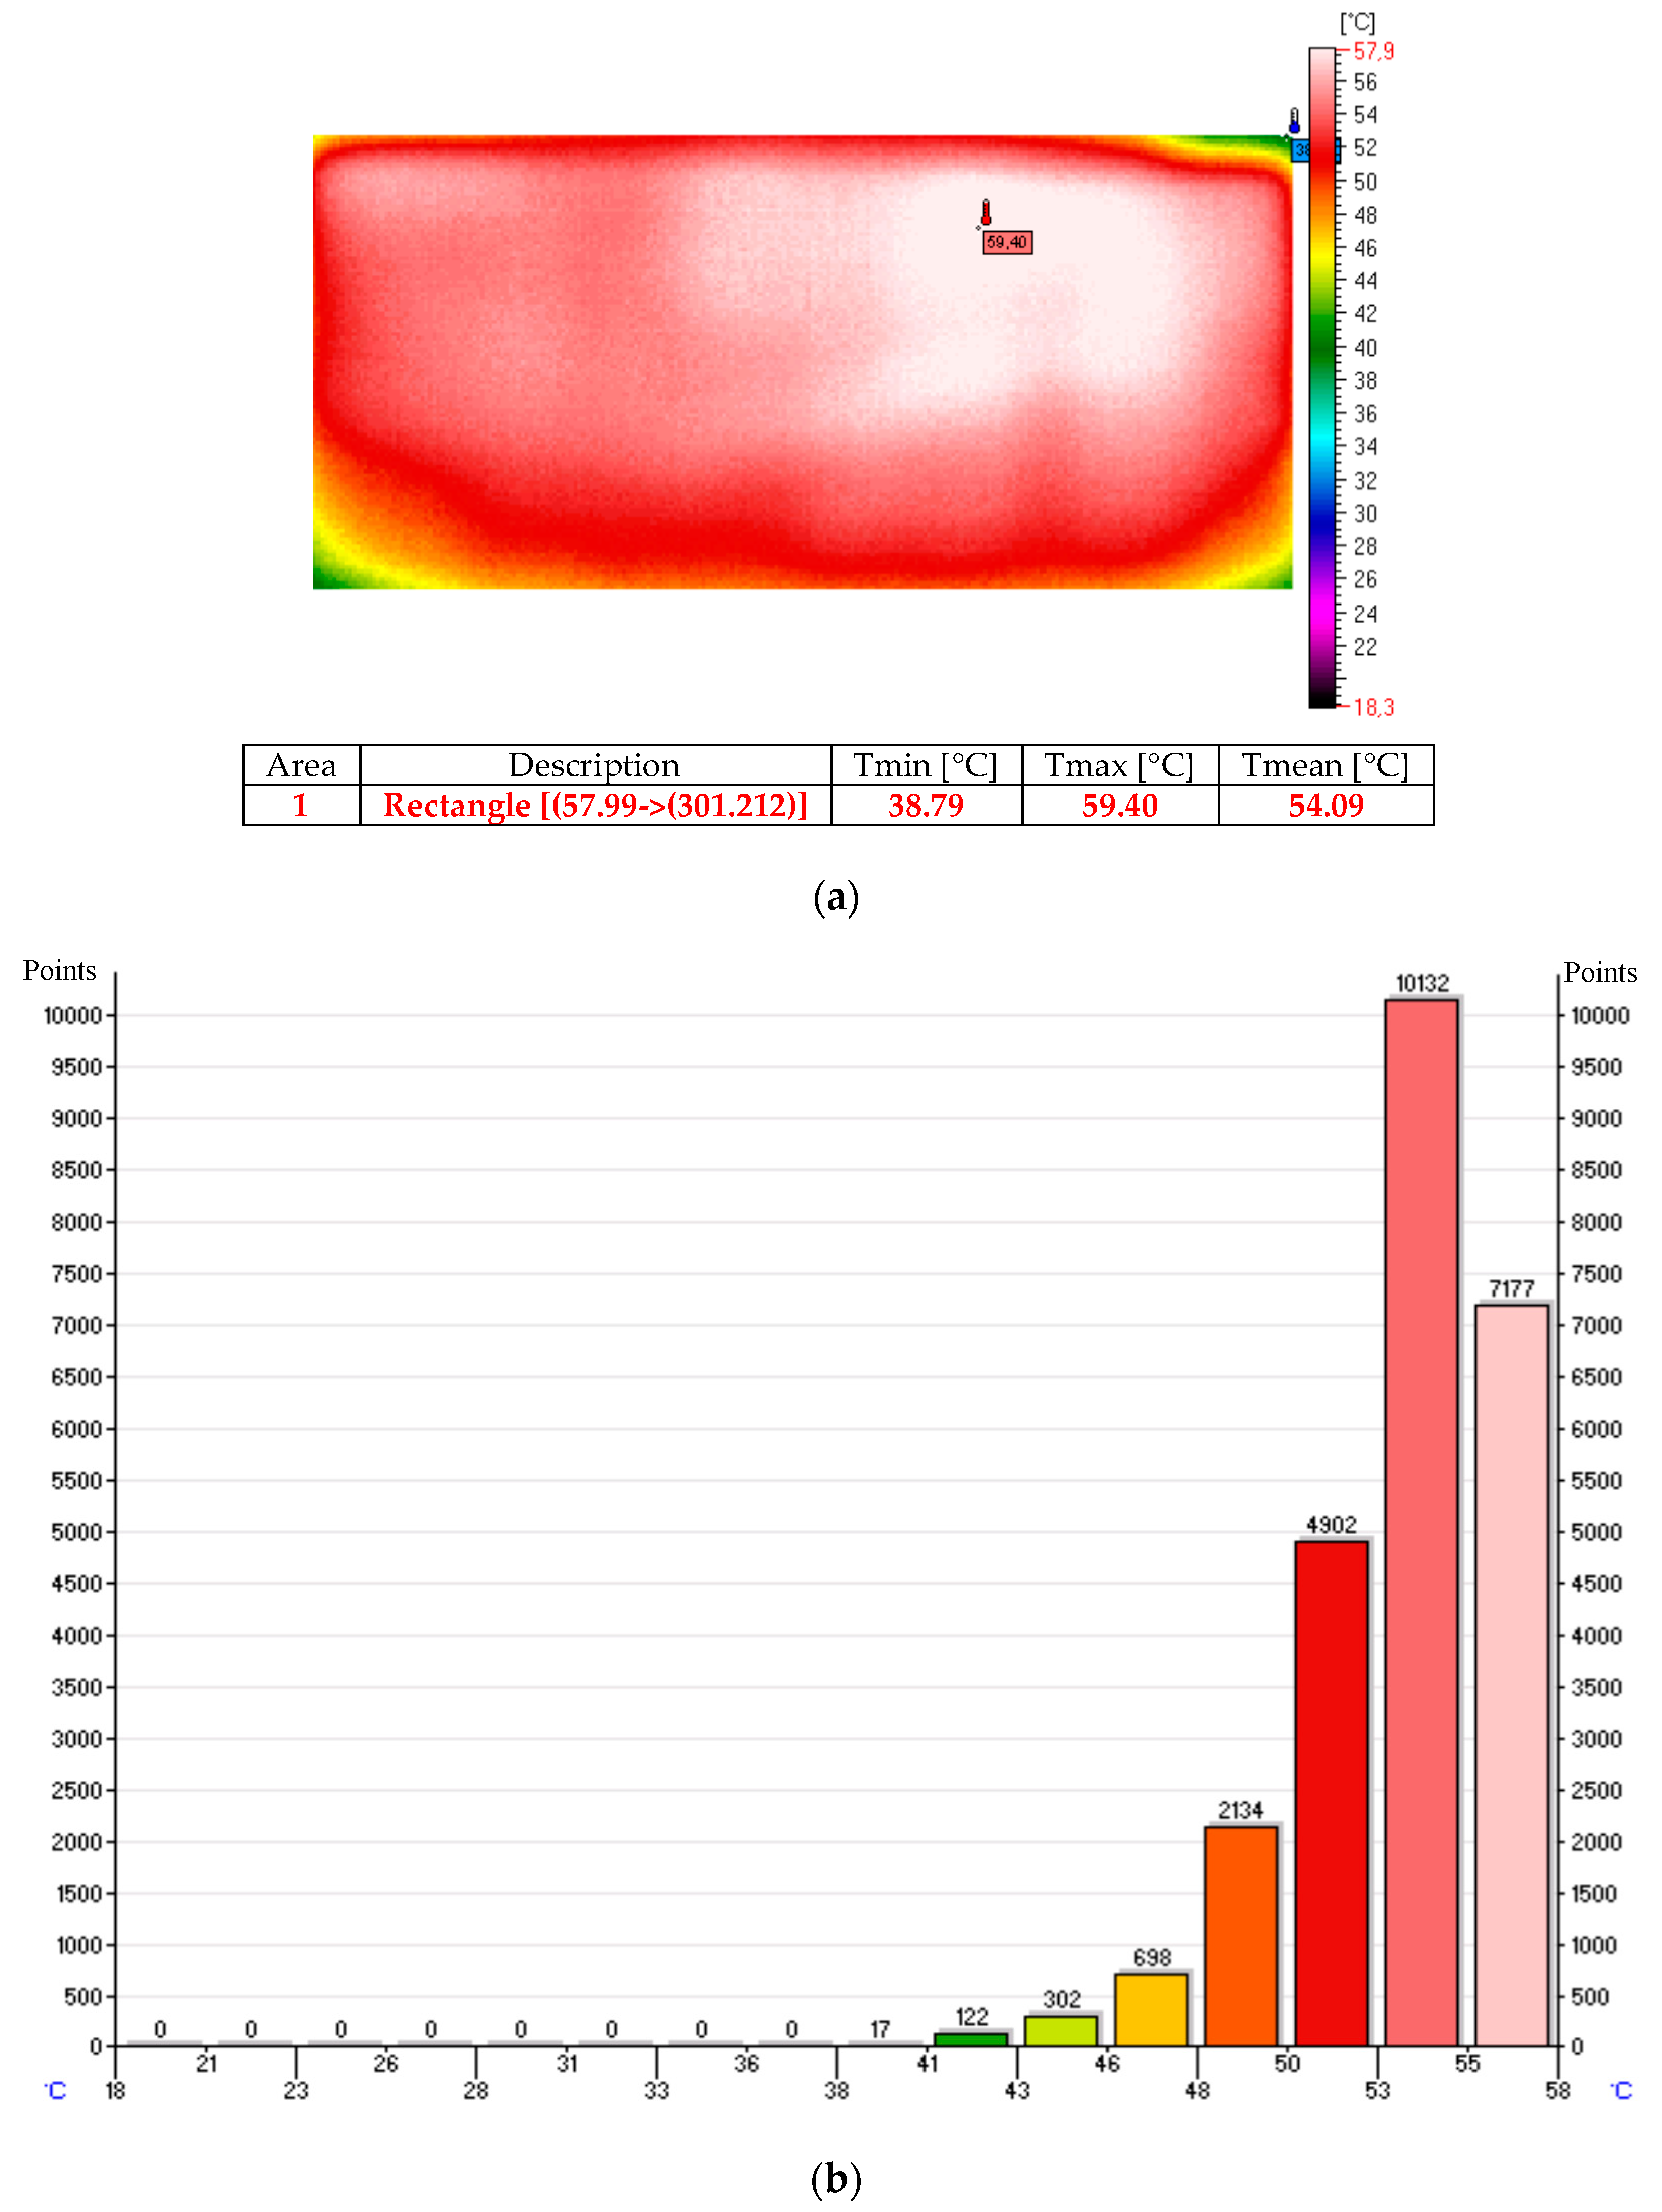
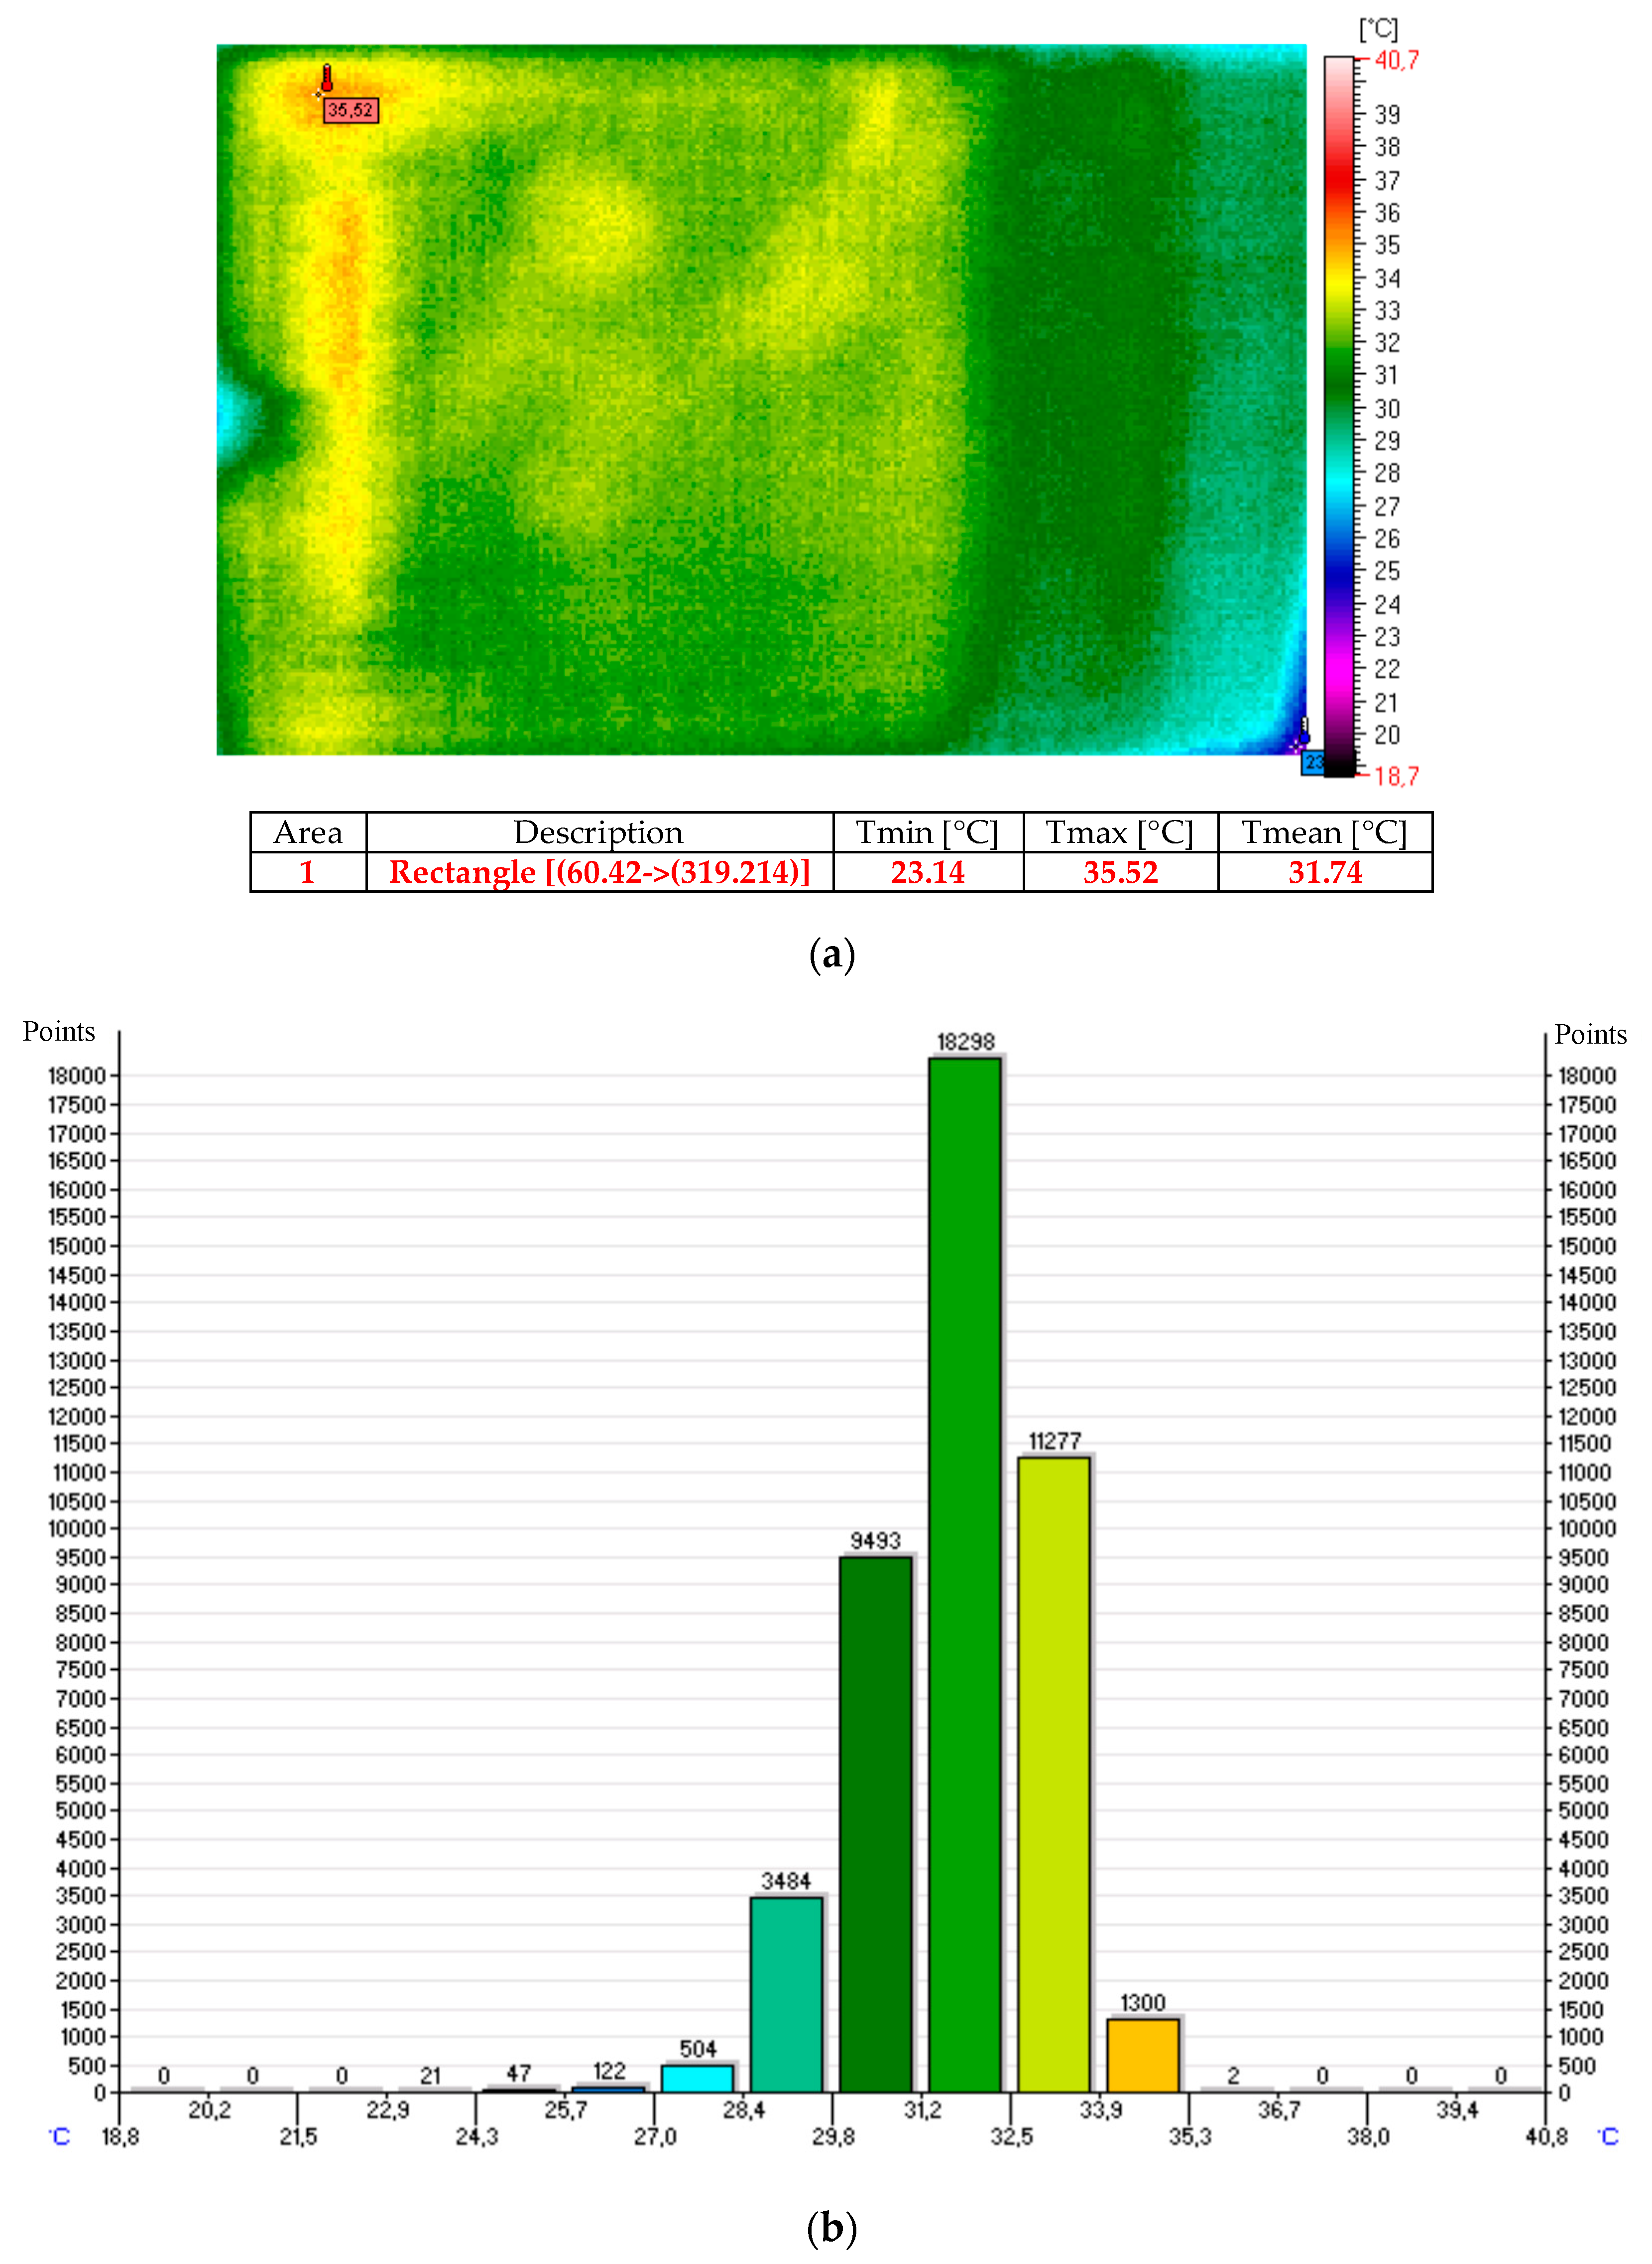
2.2.1. Increasing the Signature in the Thermal Range—Laboratory Tests
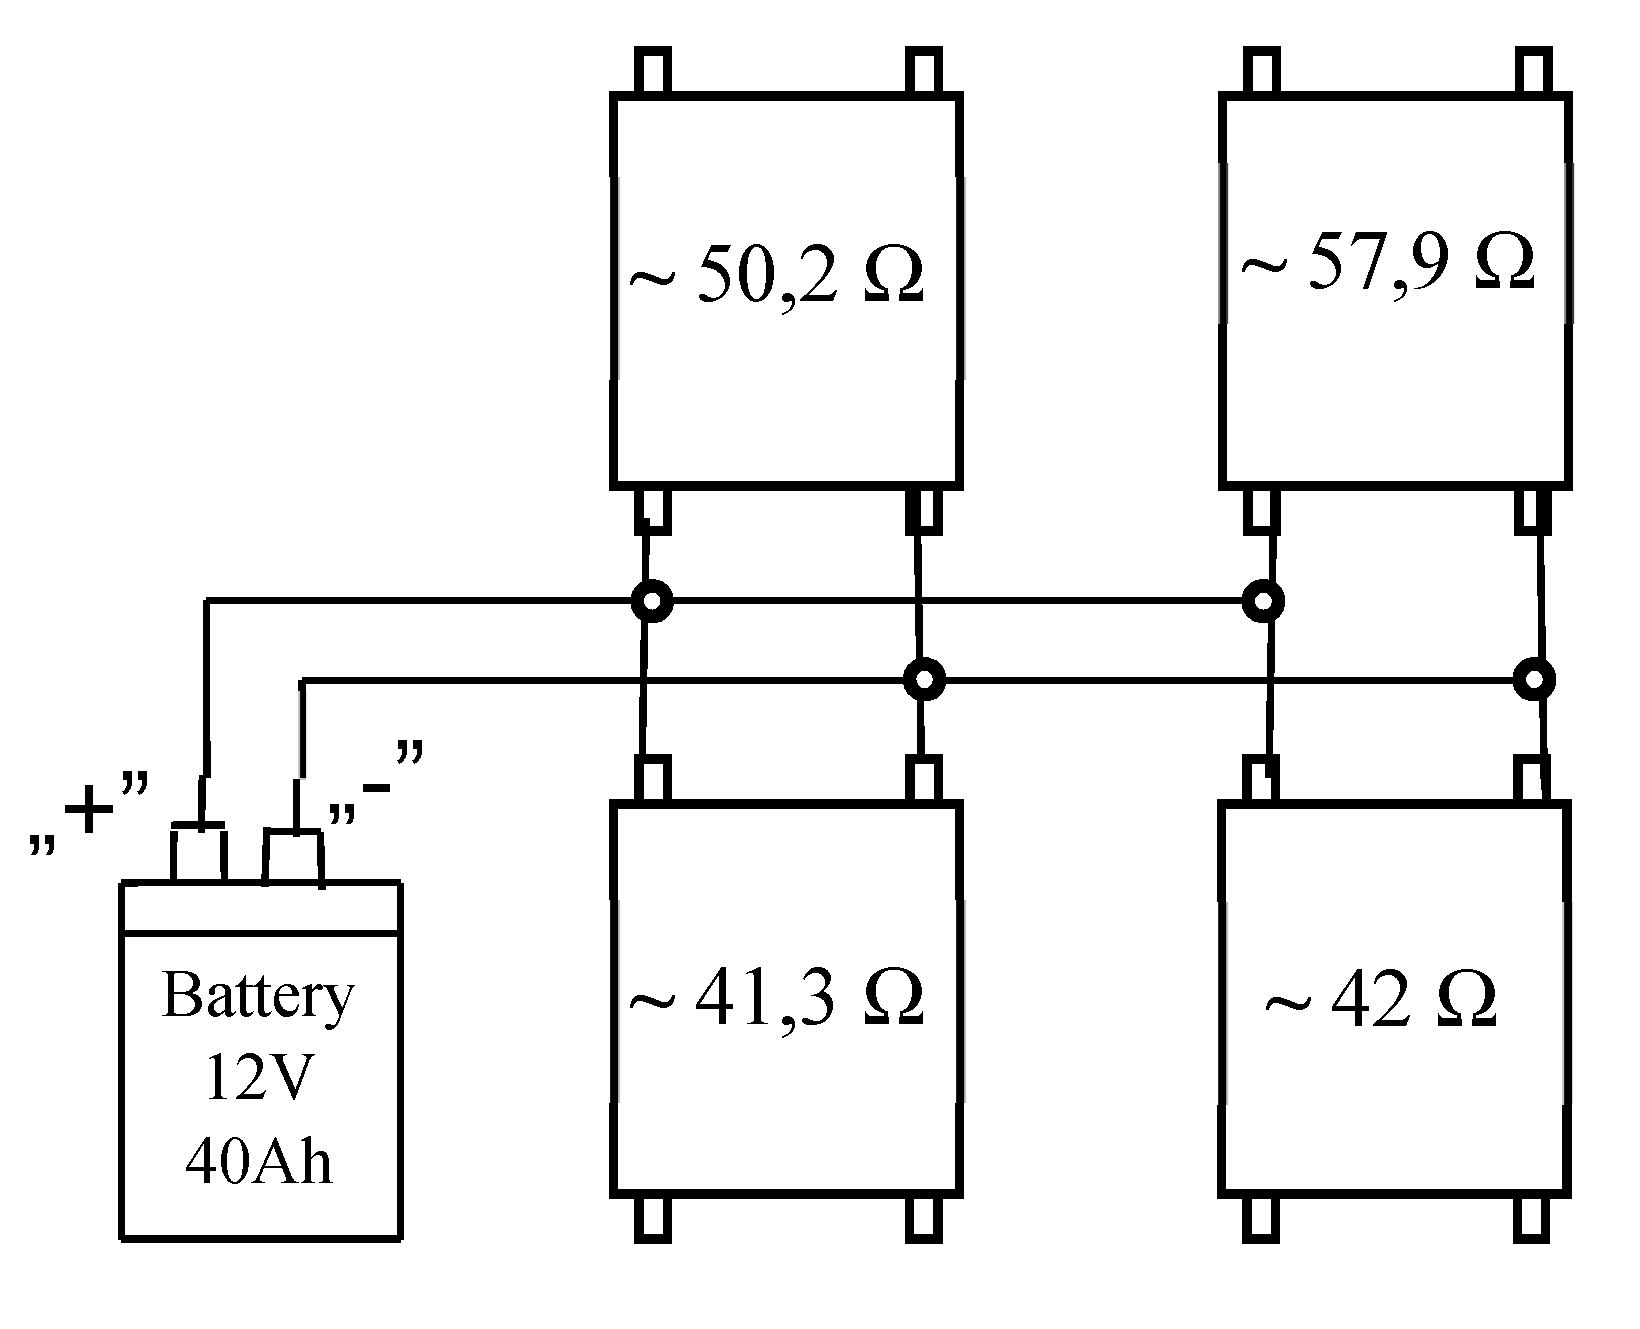
- heating mats made of nanocomposites based on carbon nanotubes embedded in silicone,
- heating mats made of nanocomposites based on carbon nanotubes coated with fiber on both sides and embedded in silicone,
- thermo-adhesive heating mat made in the form of resistance pathways applied onto an elastic dielectric material.
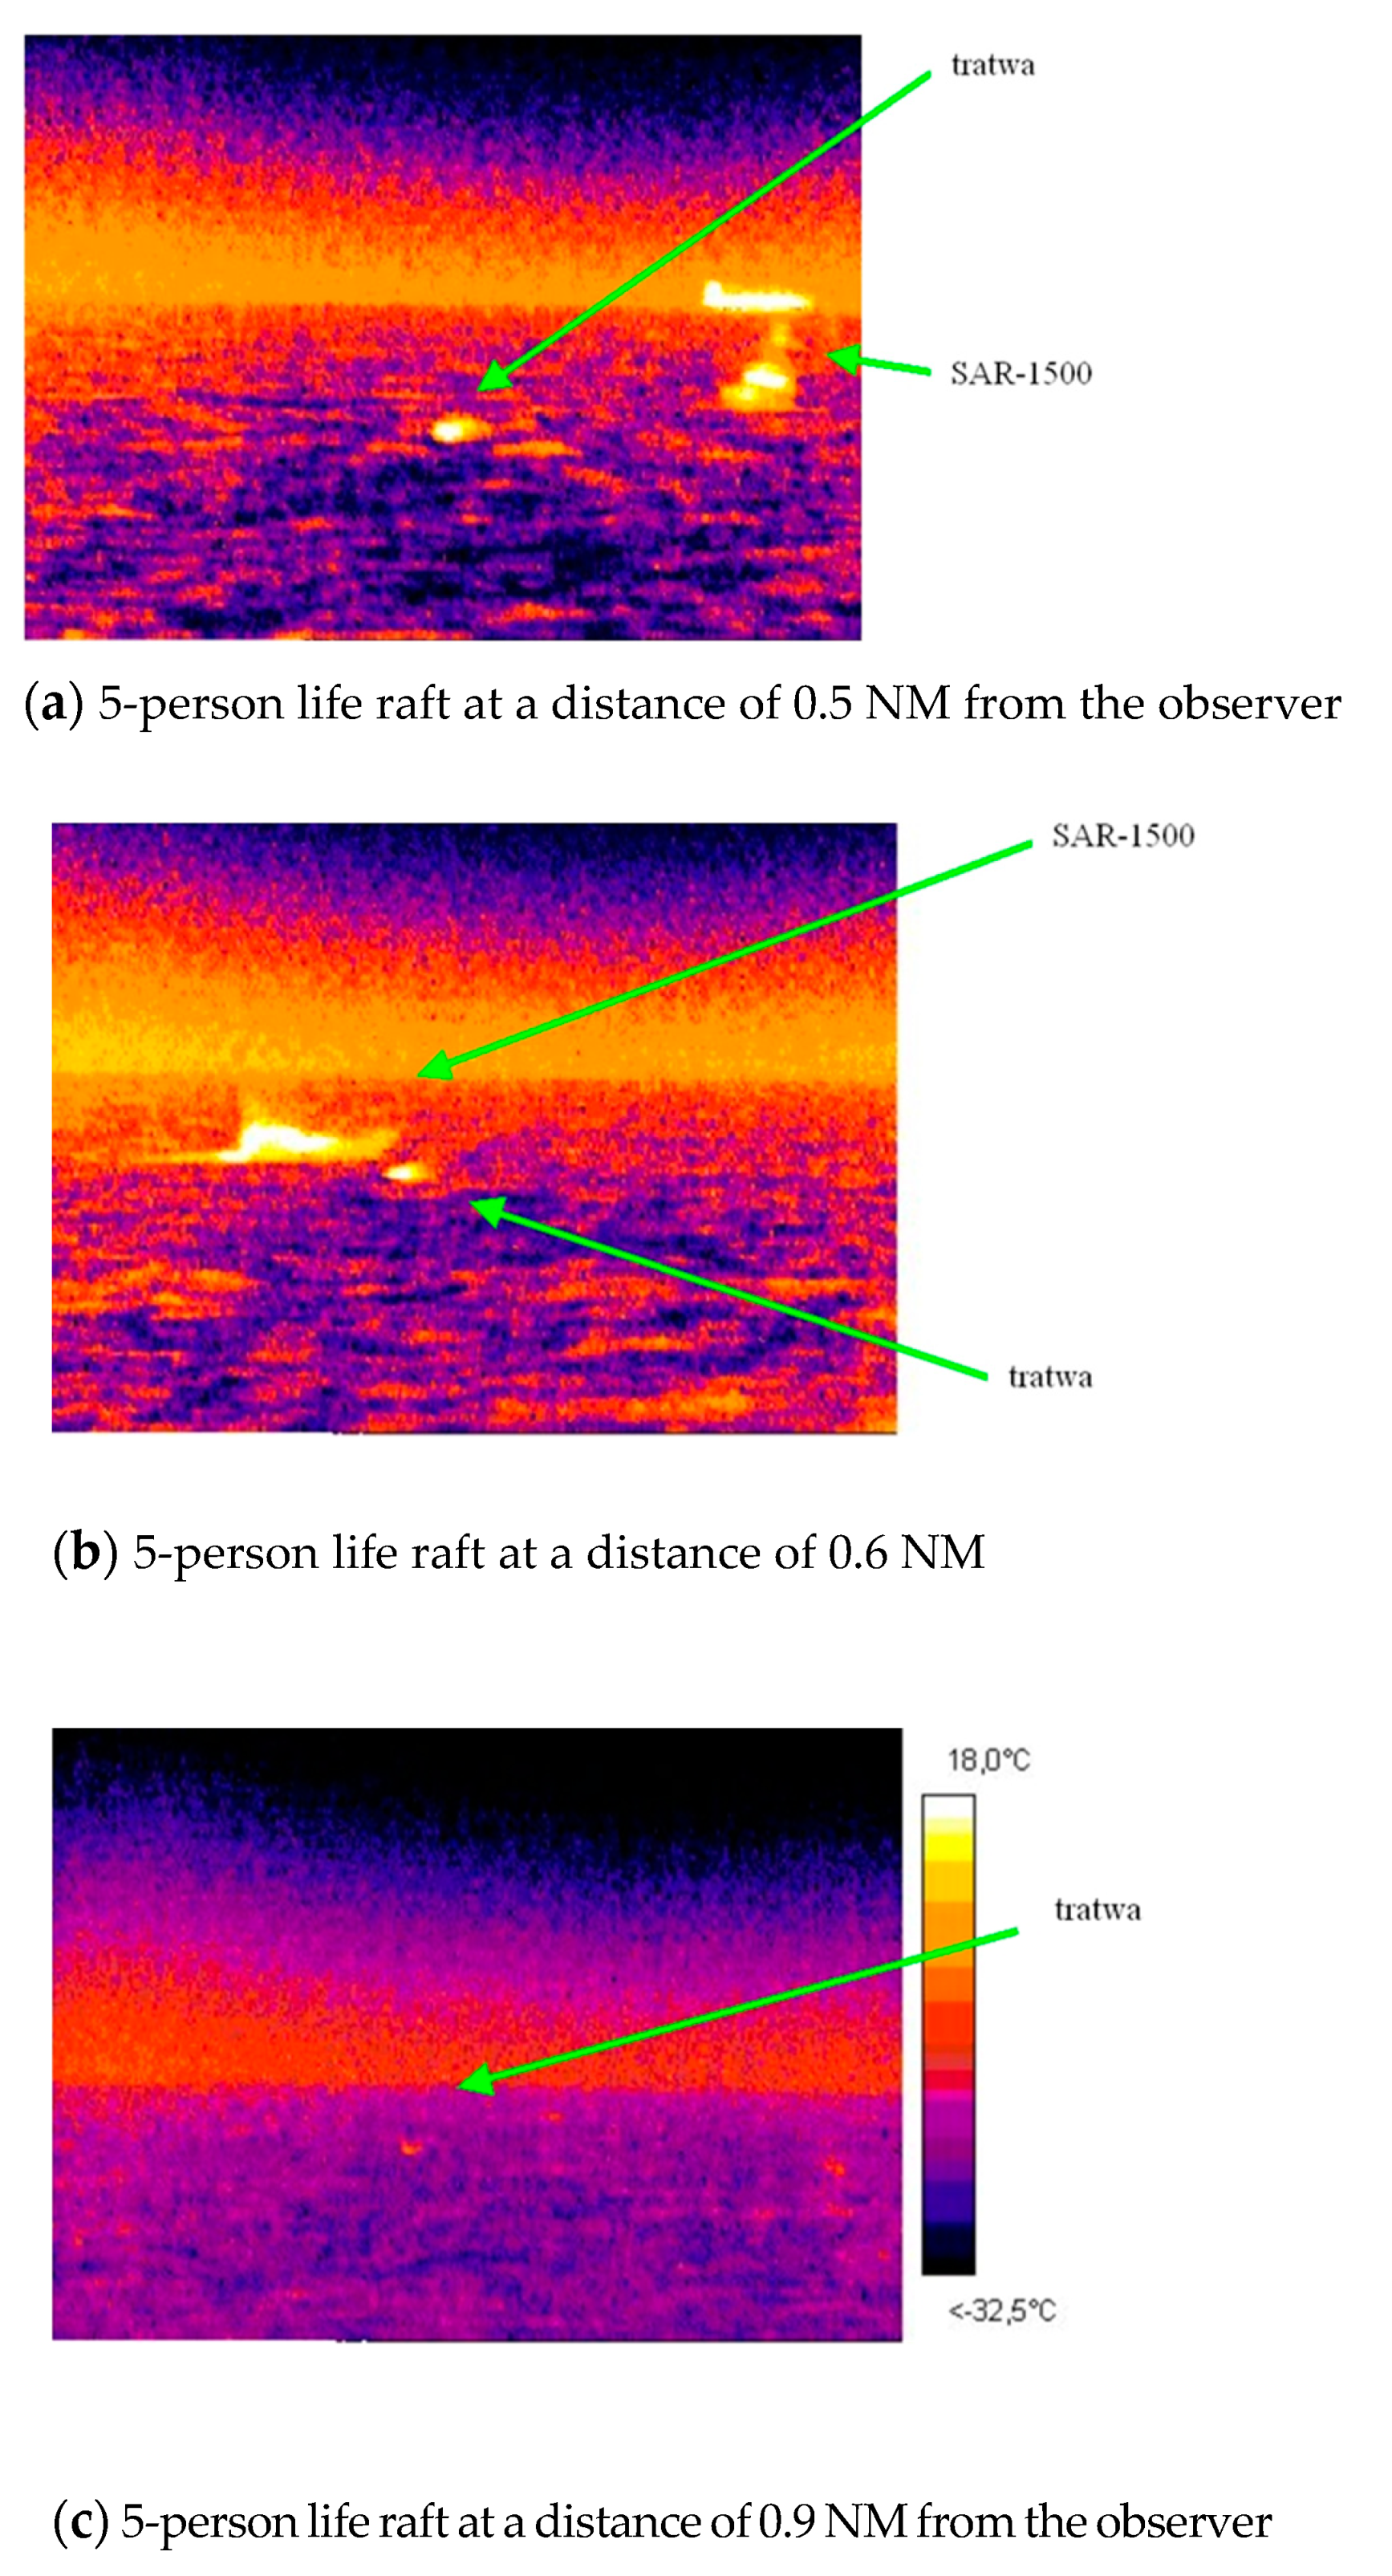
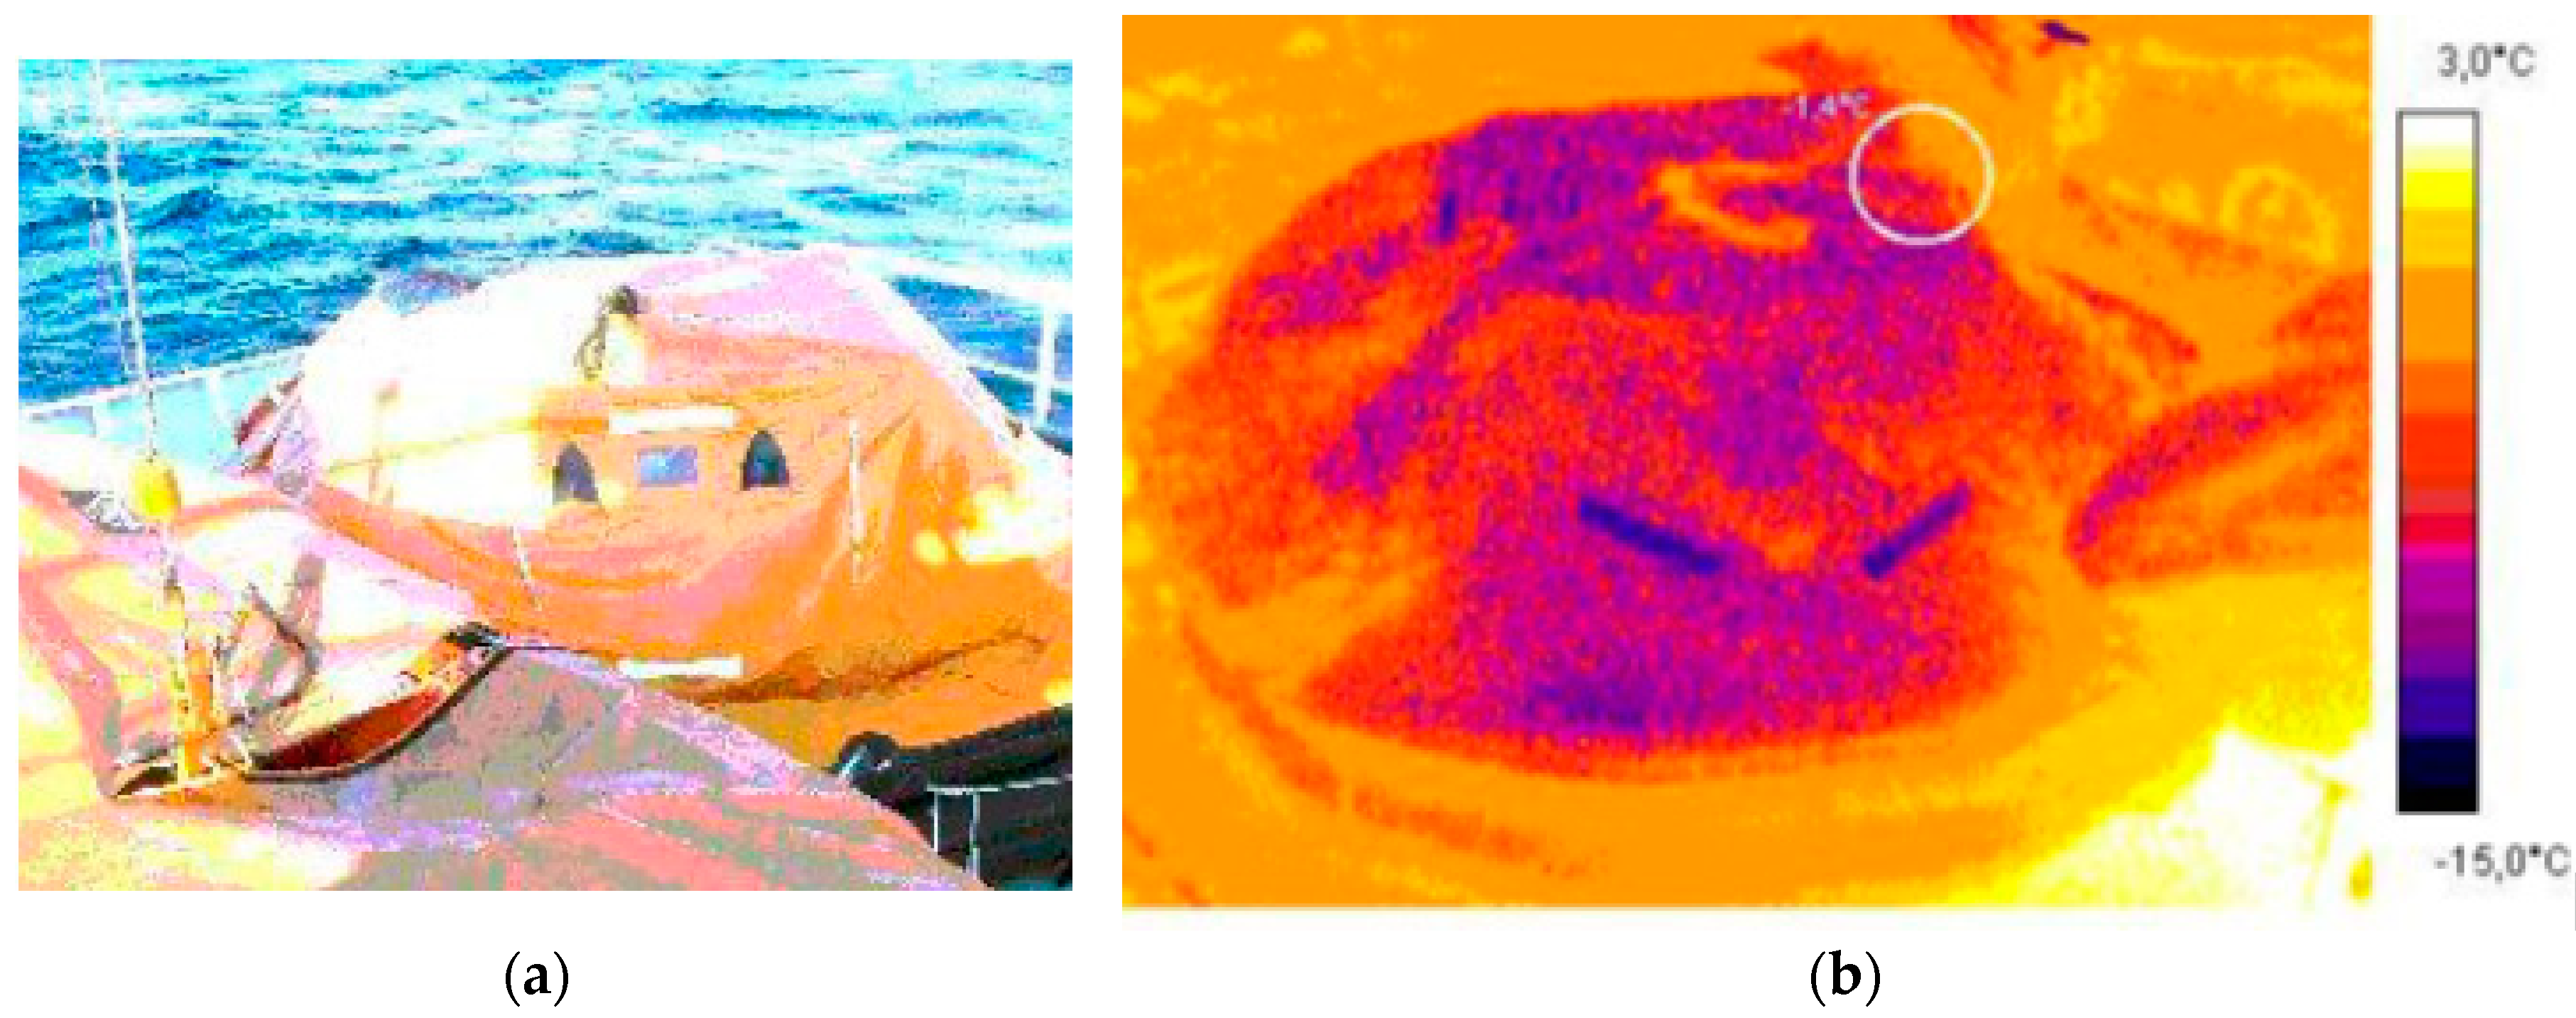
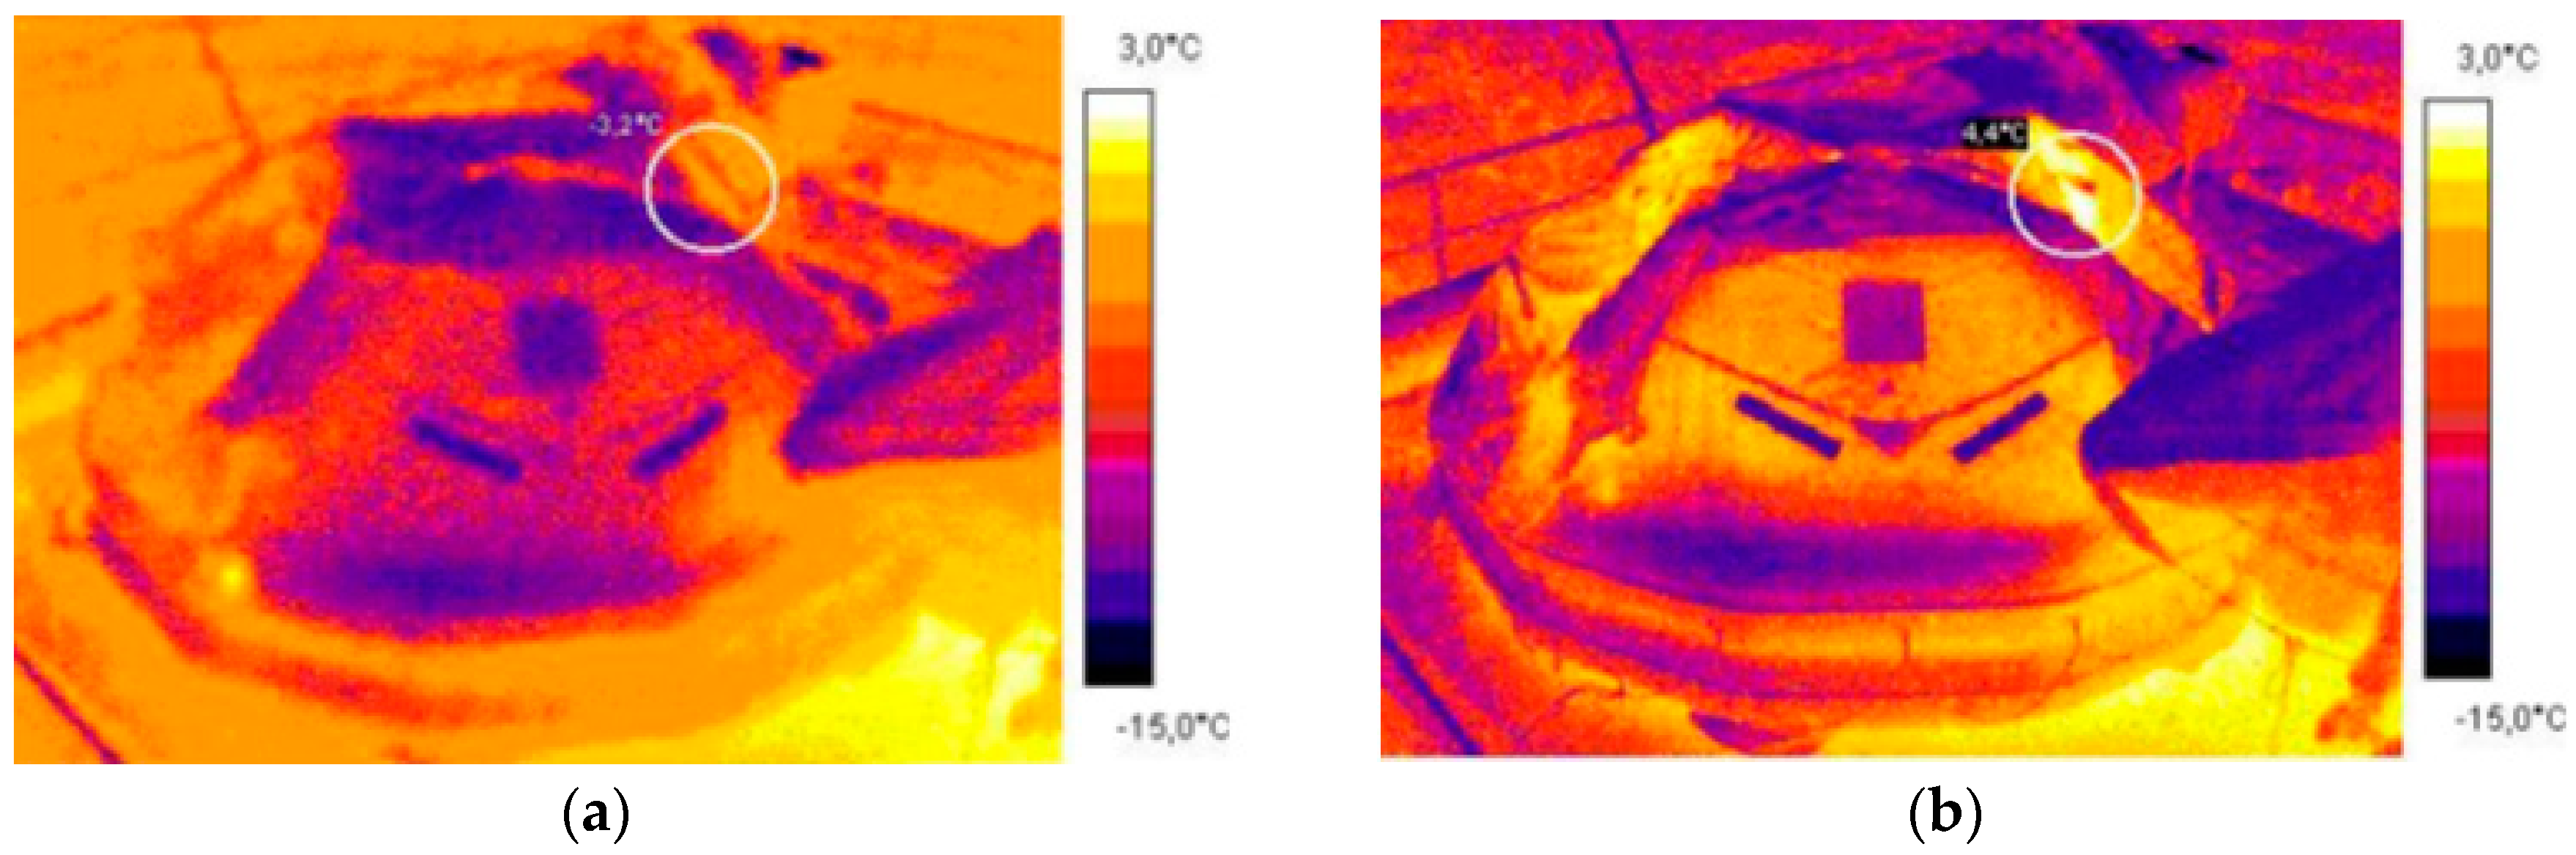
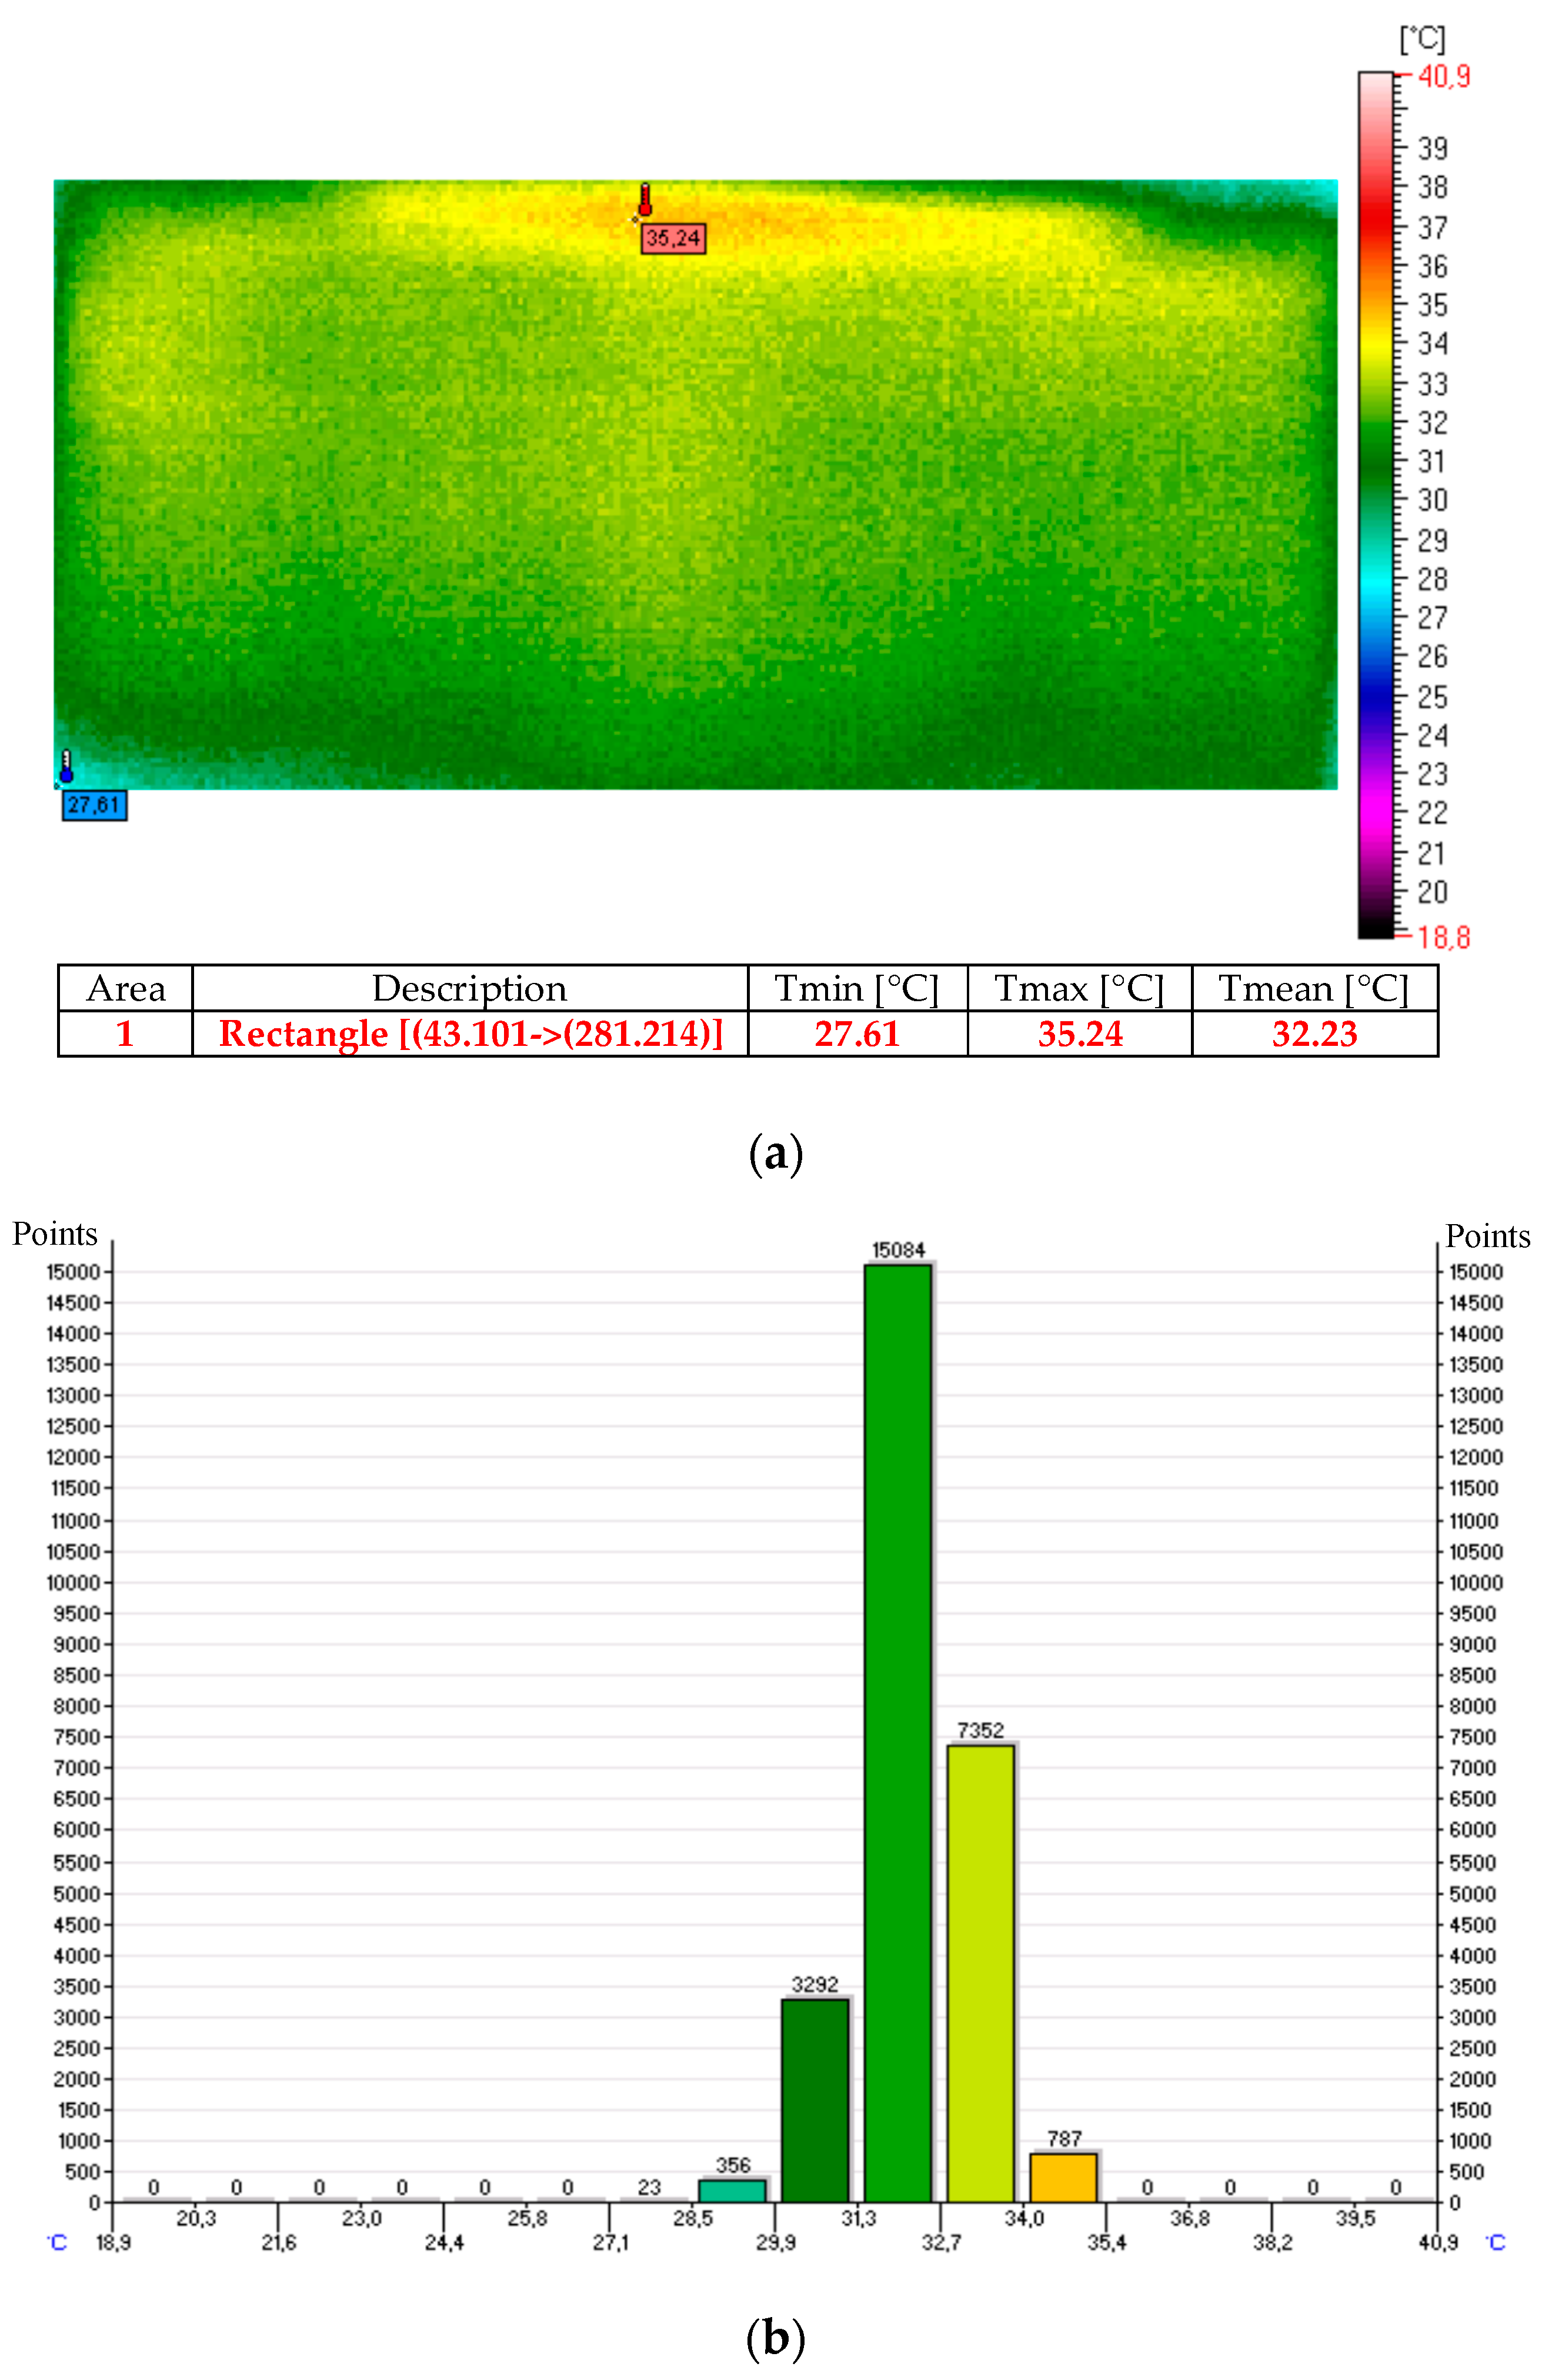
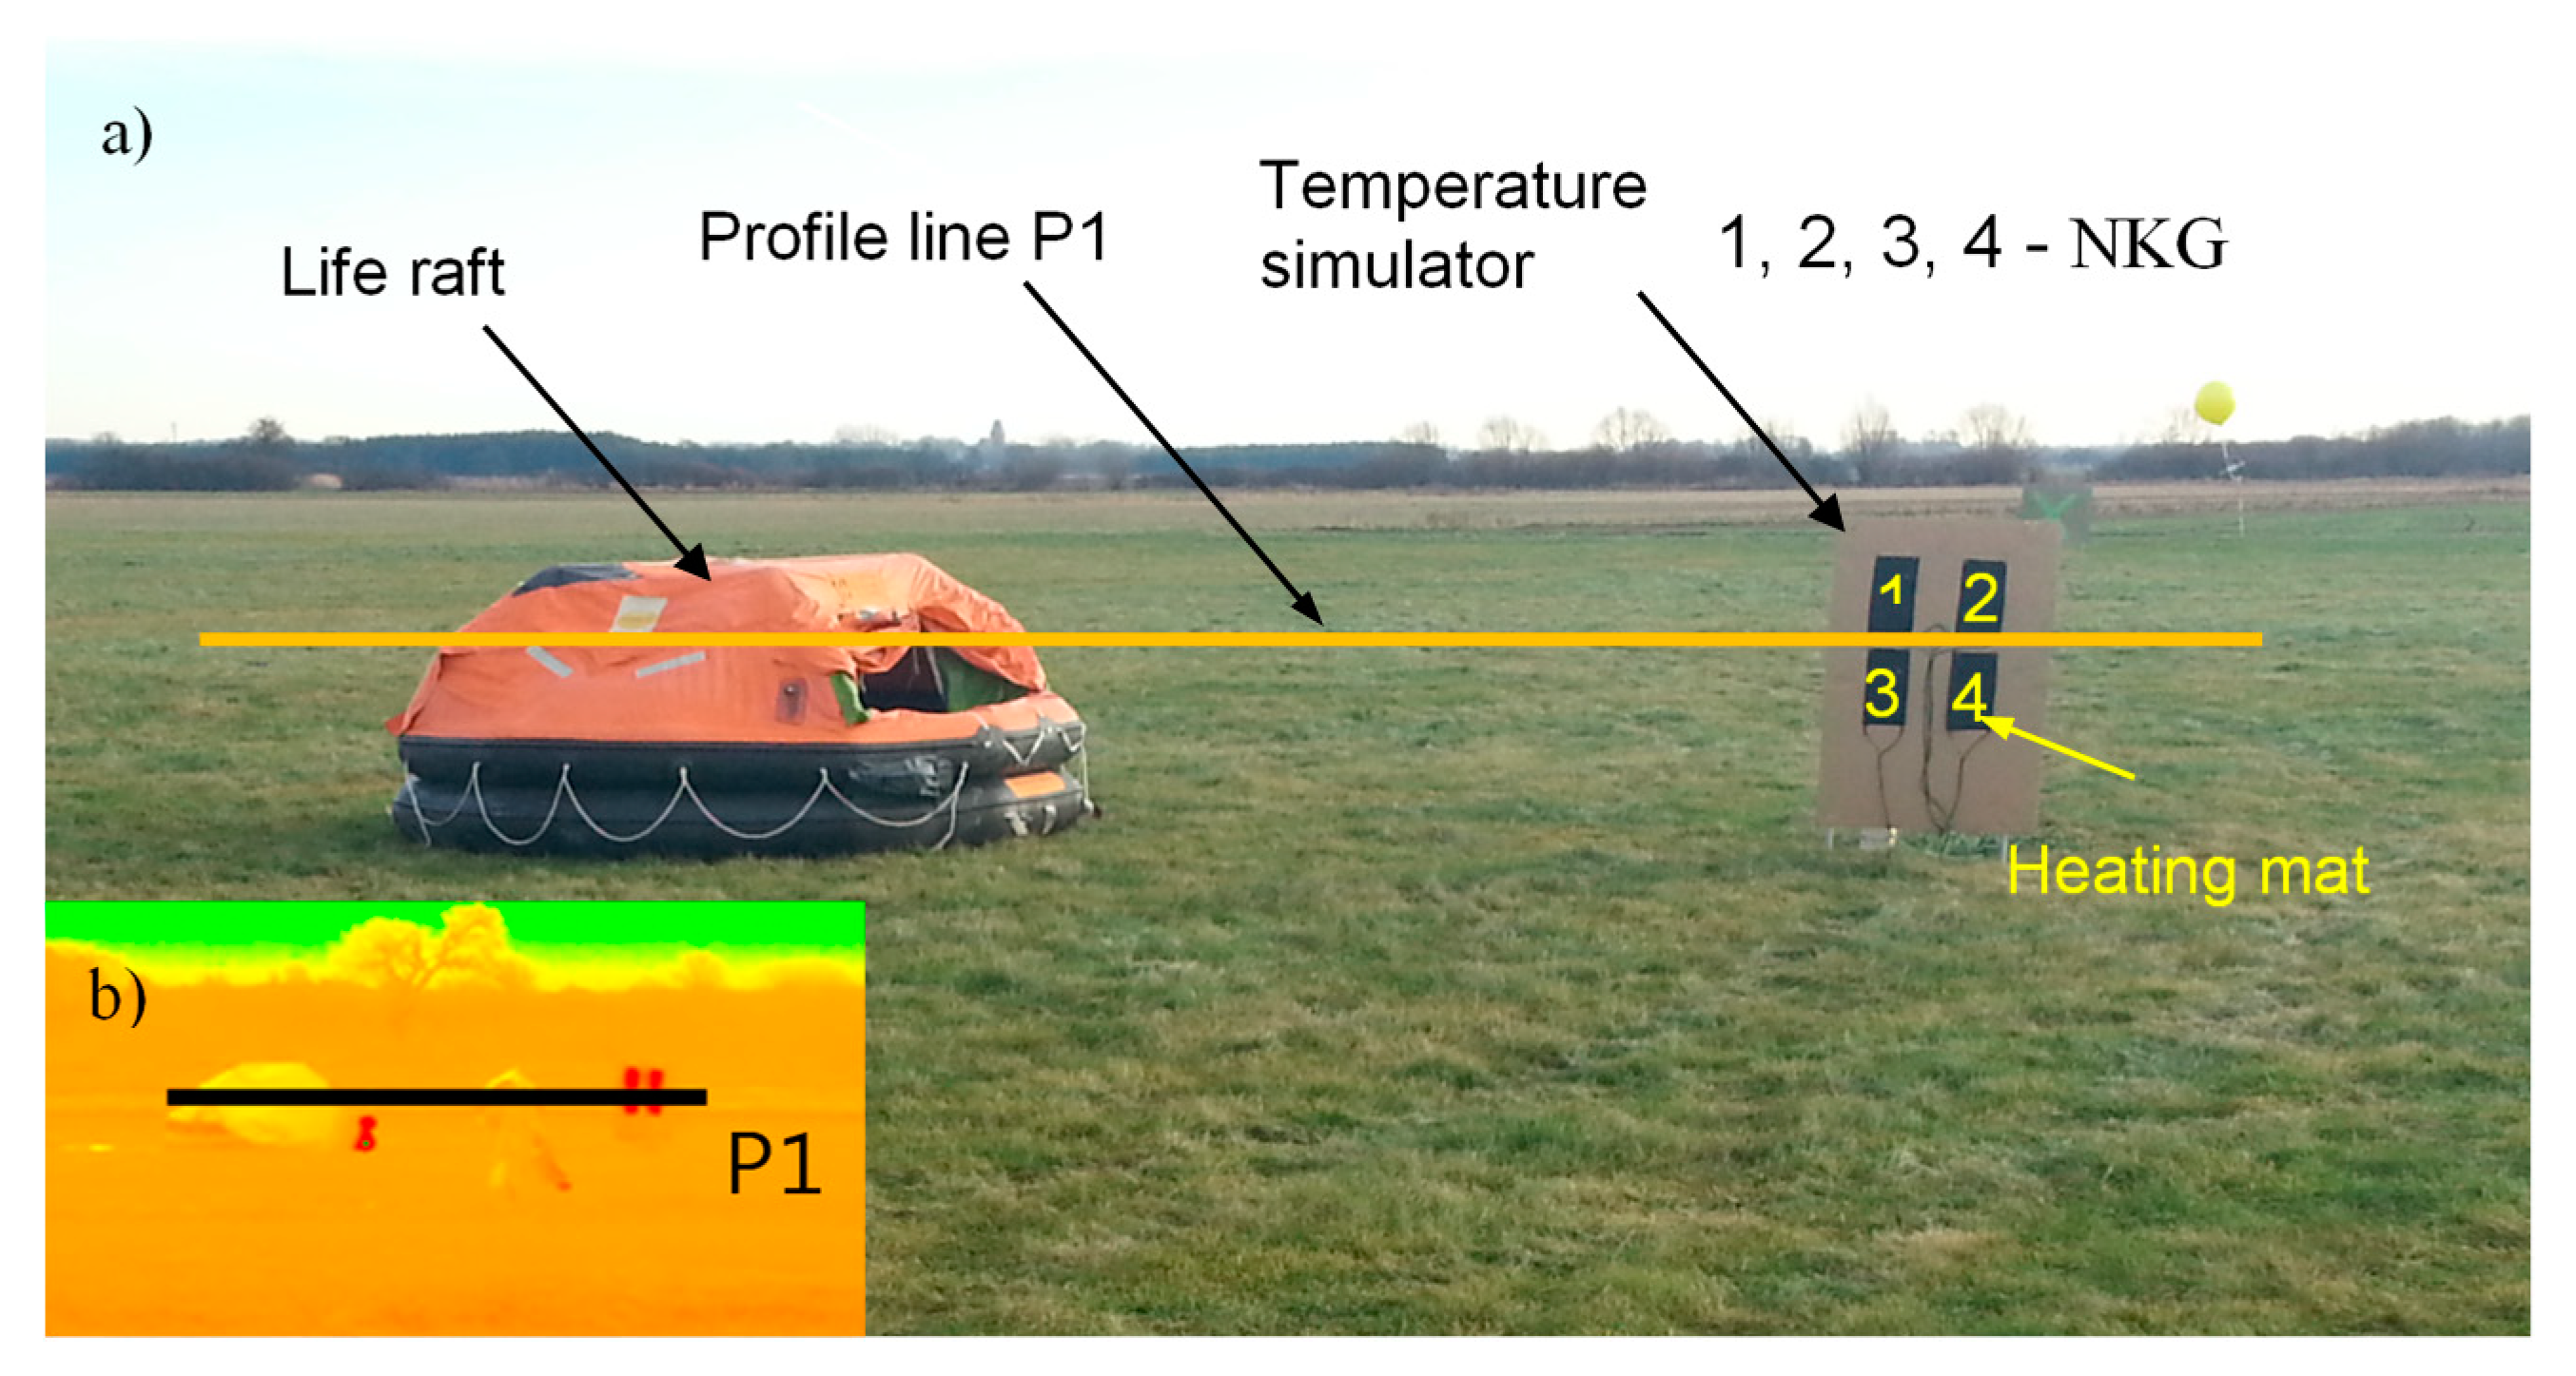
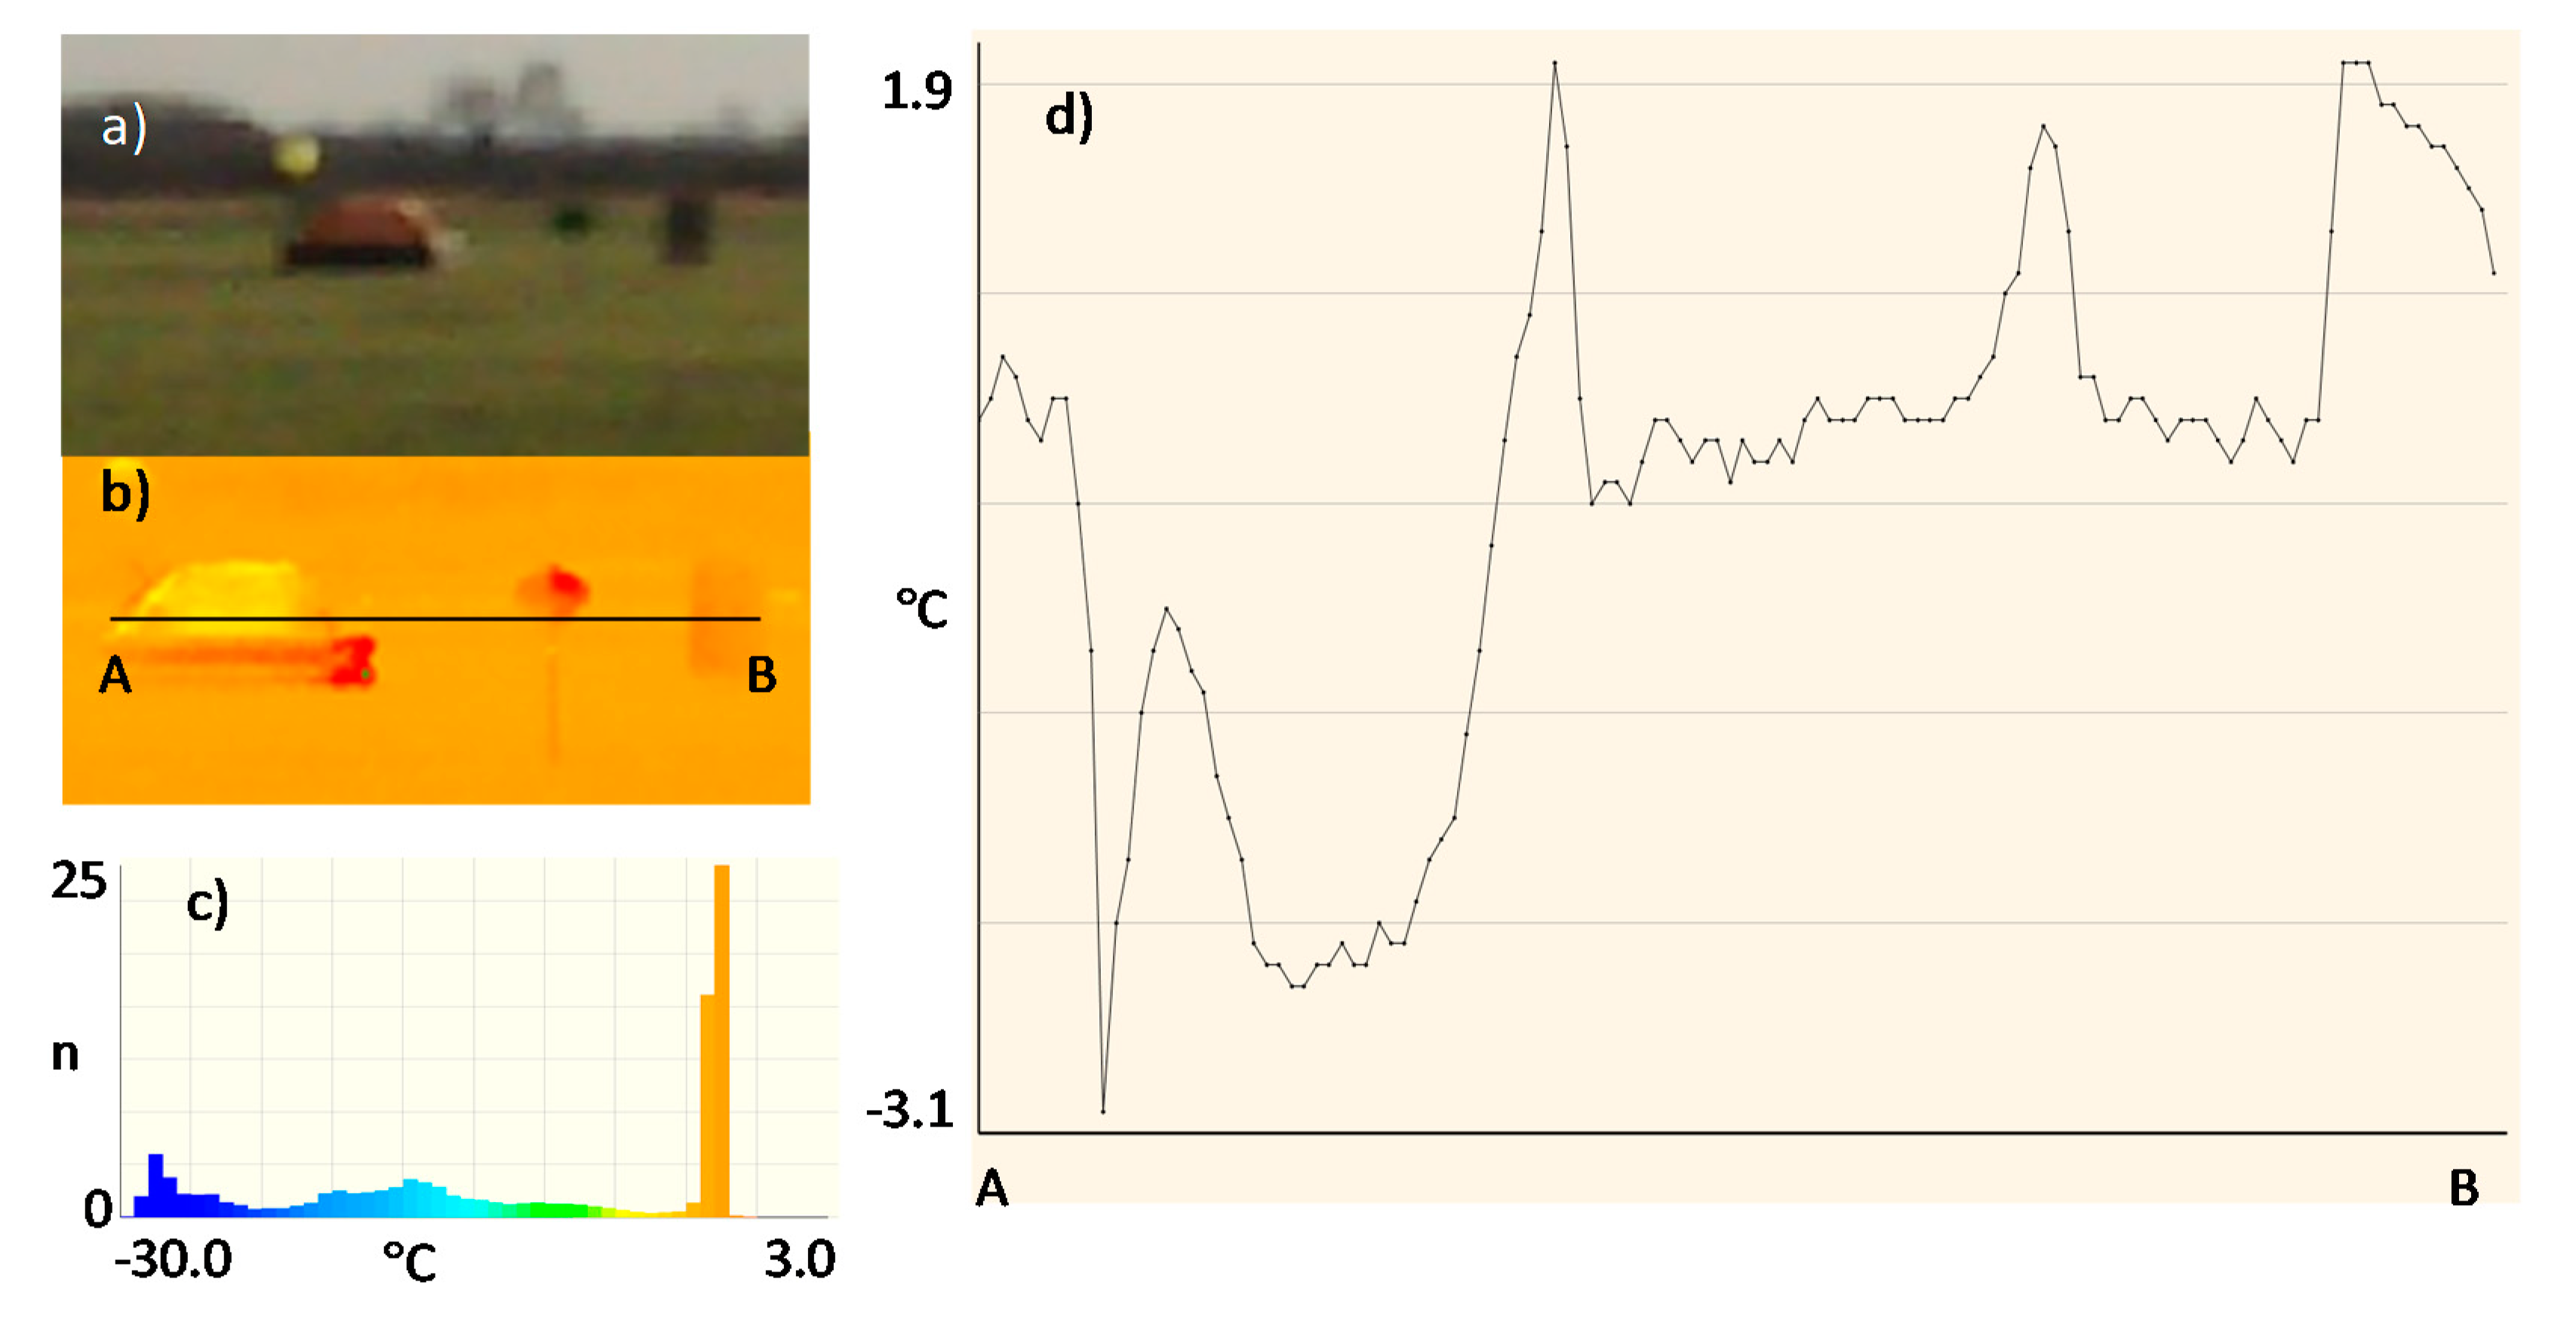
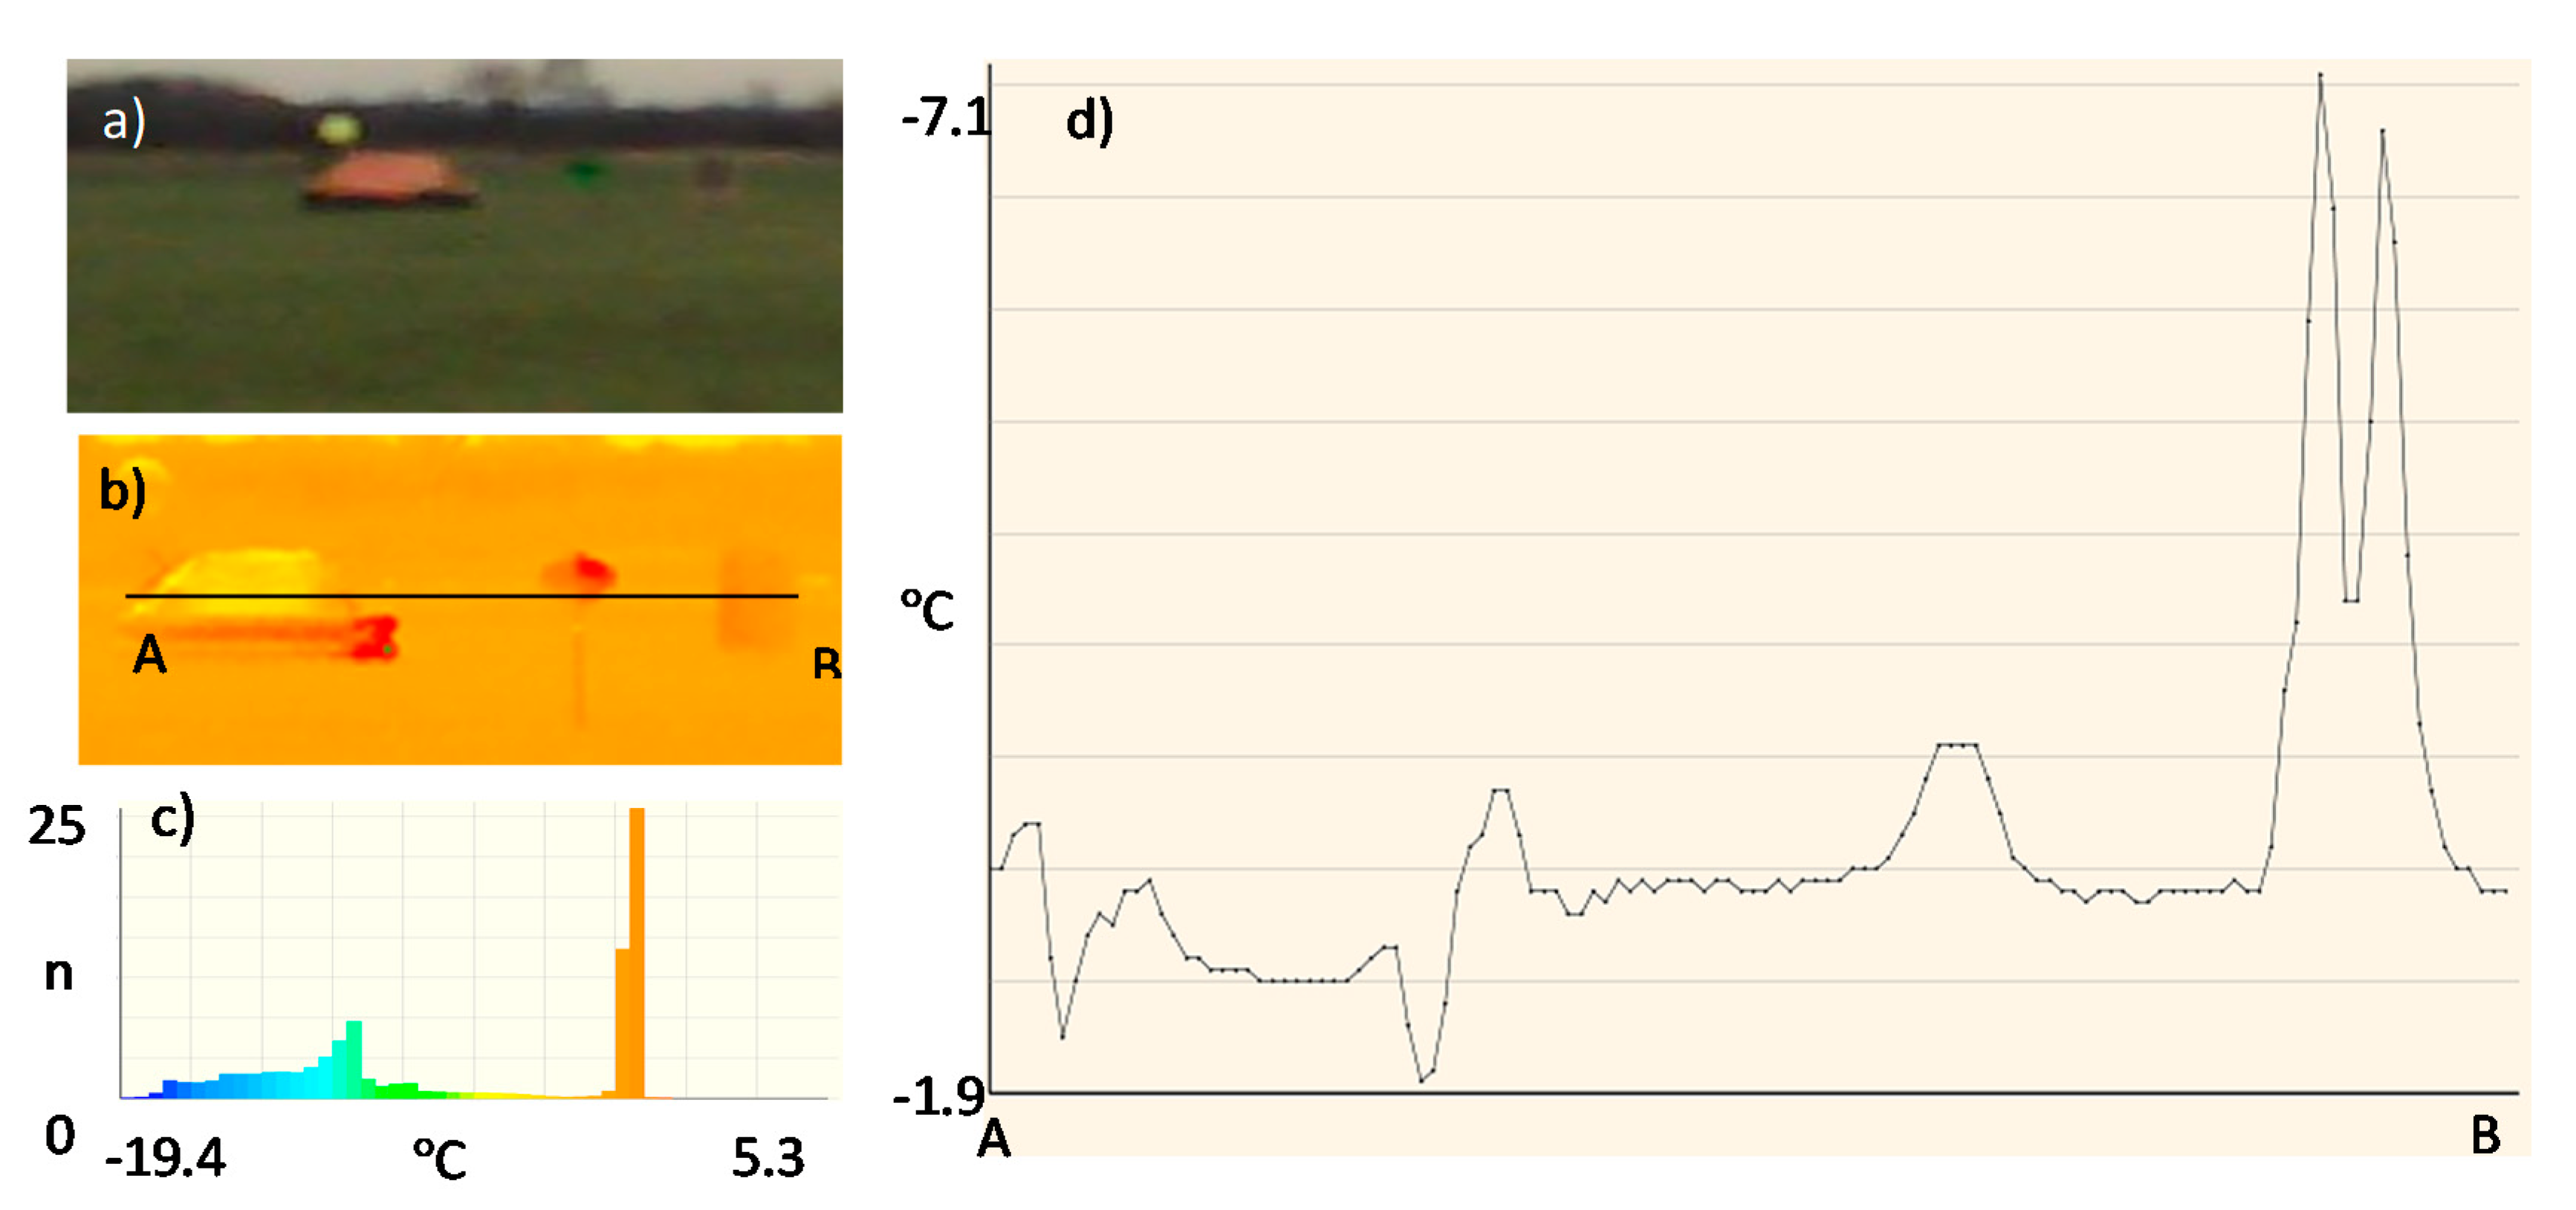
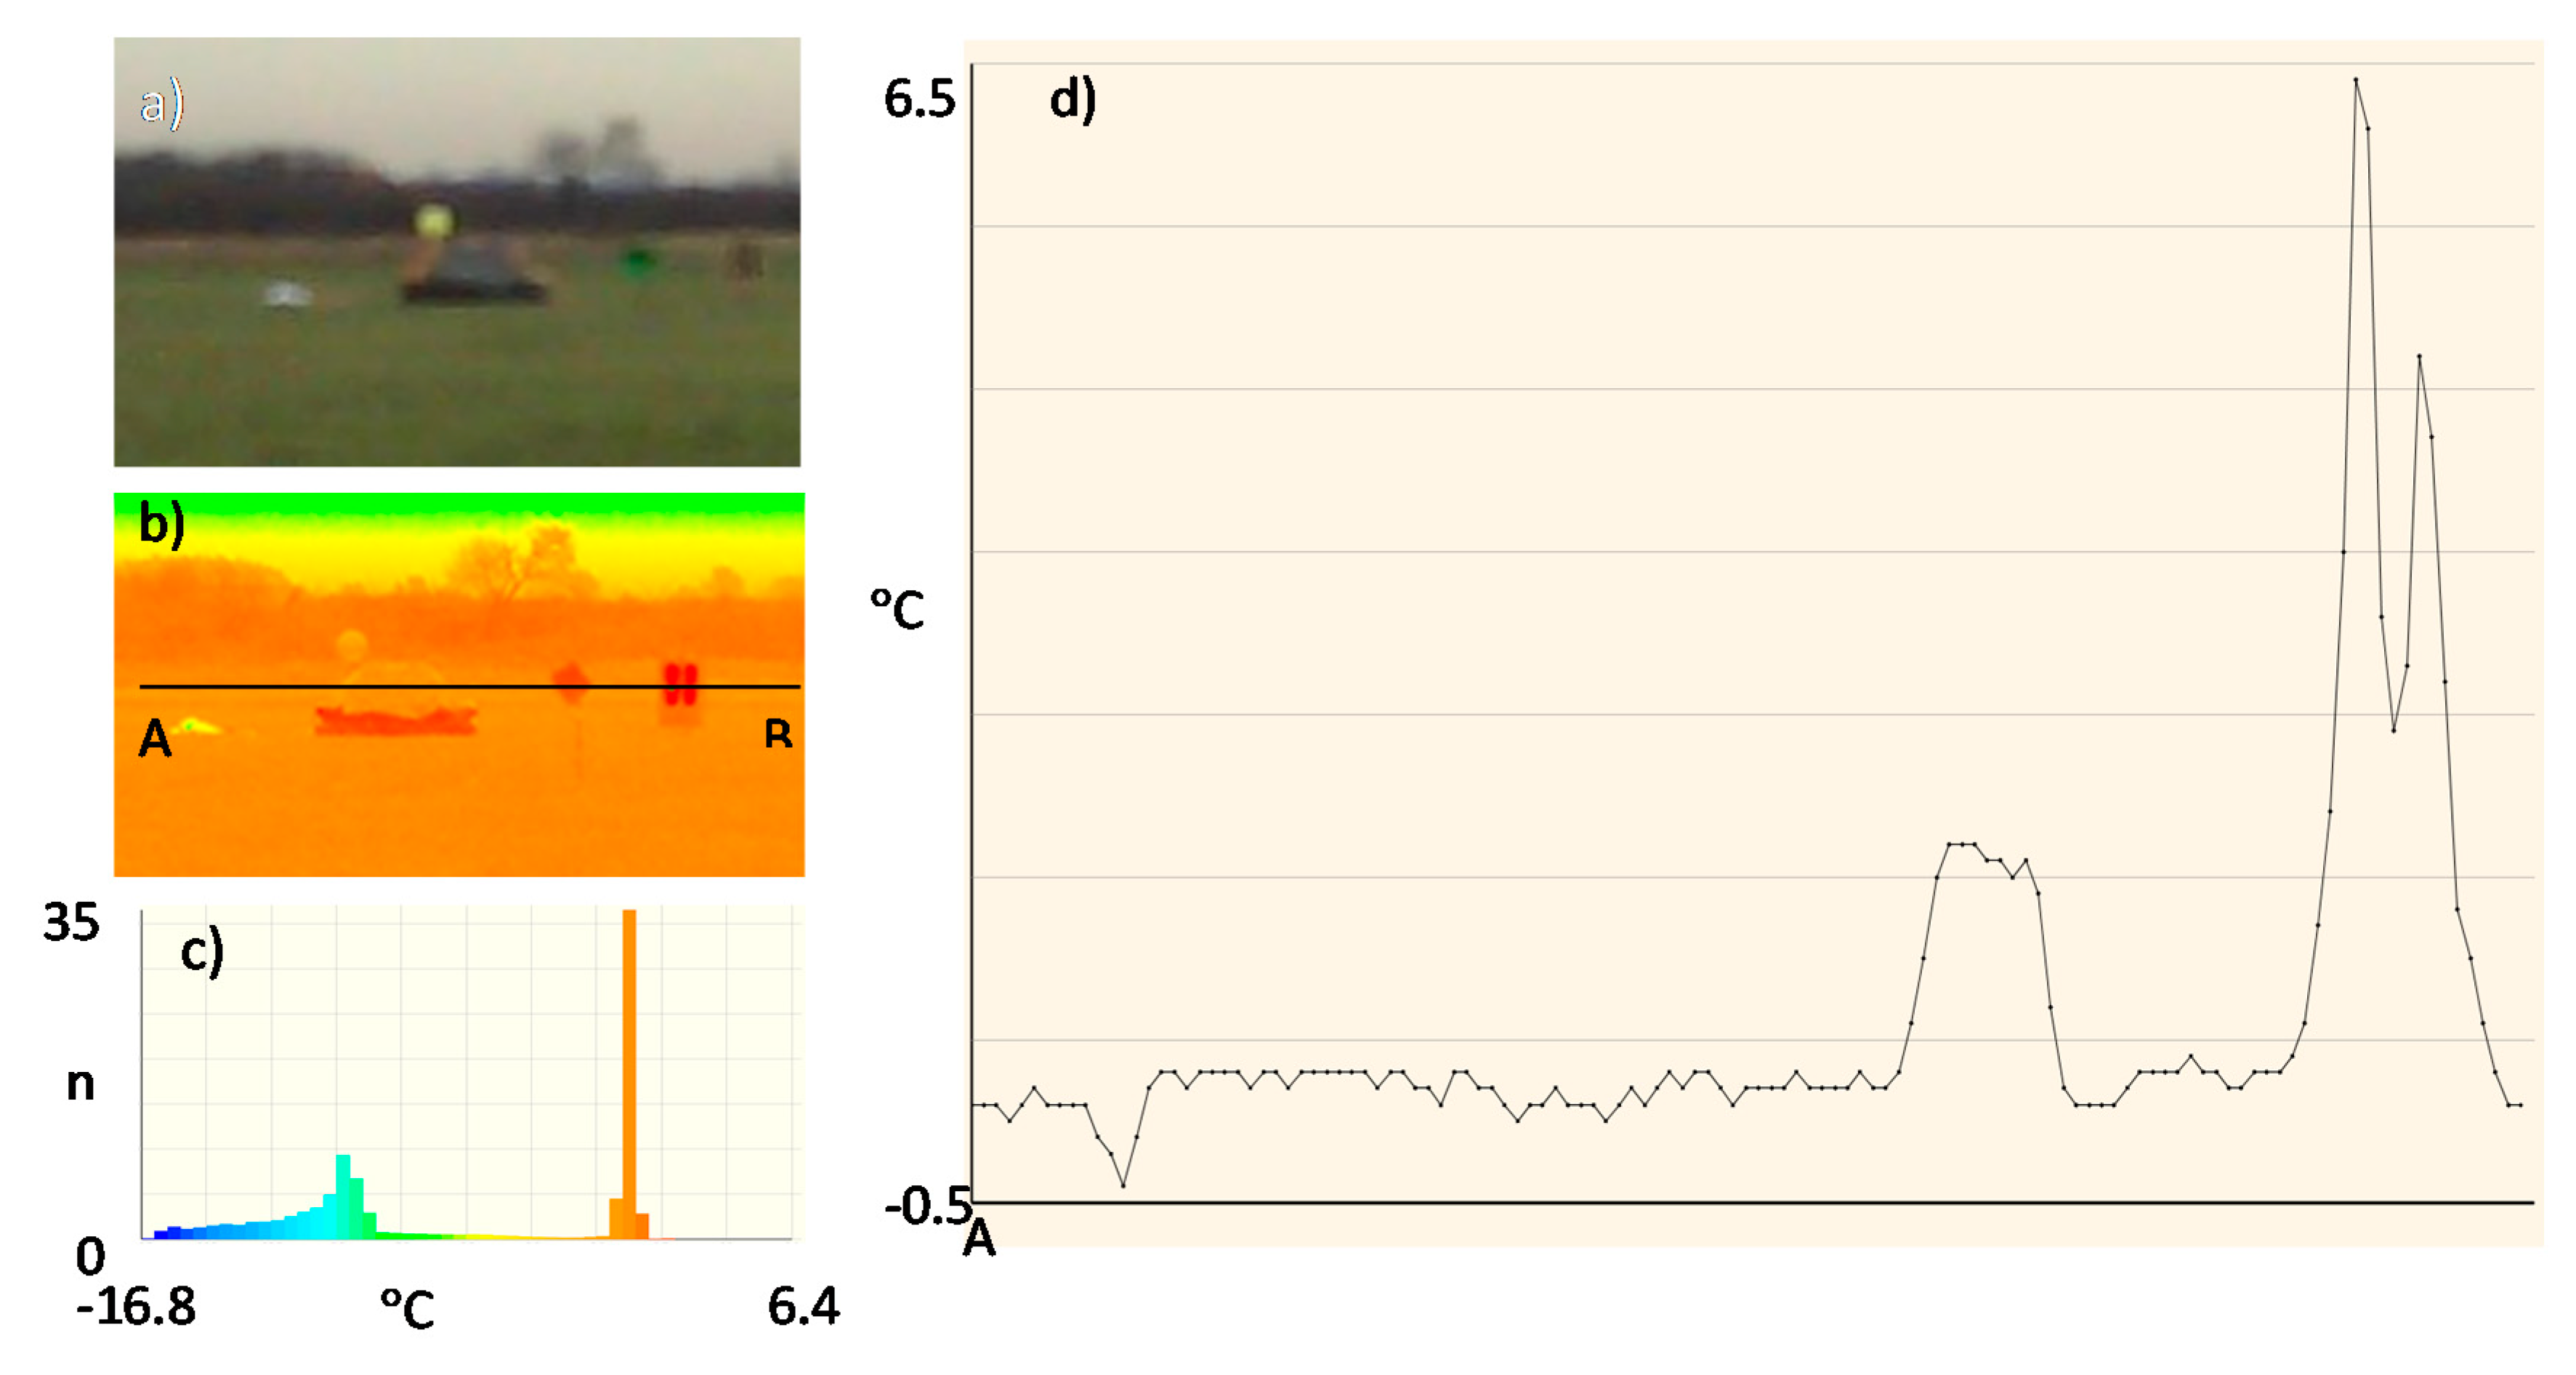
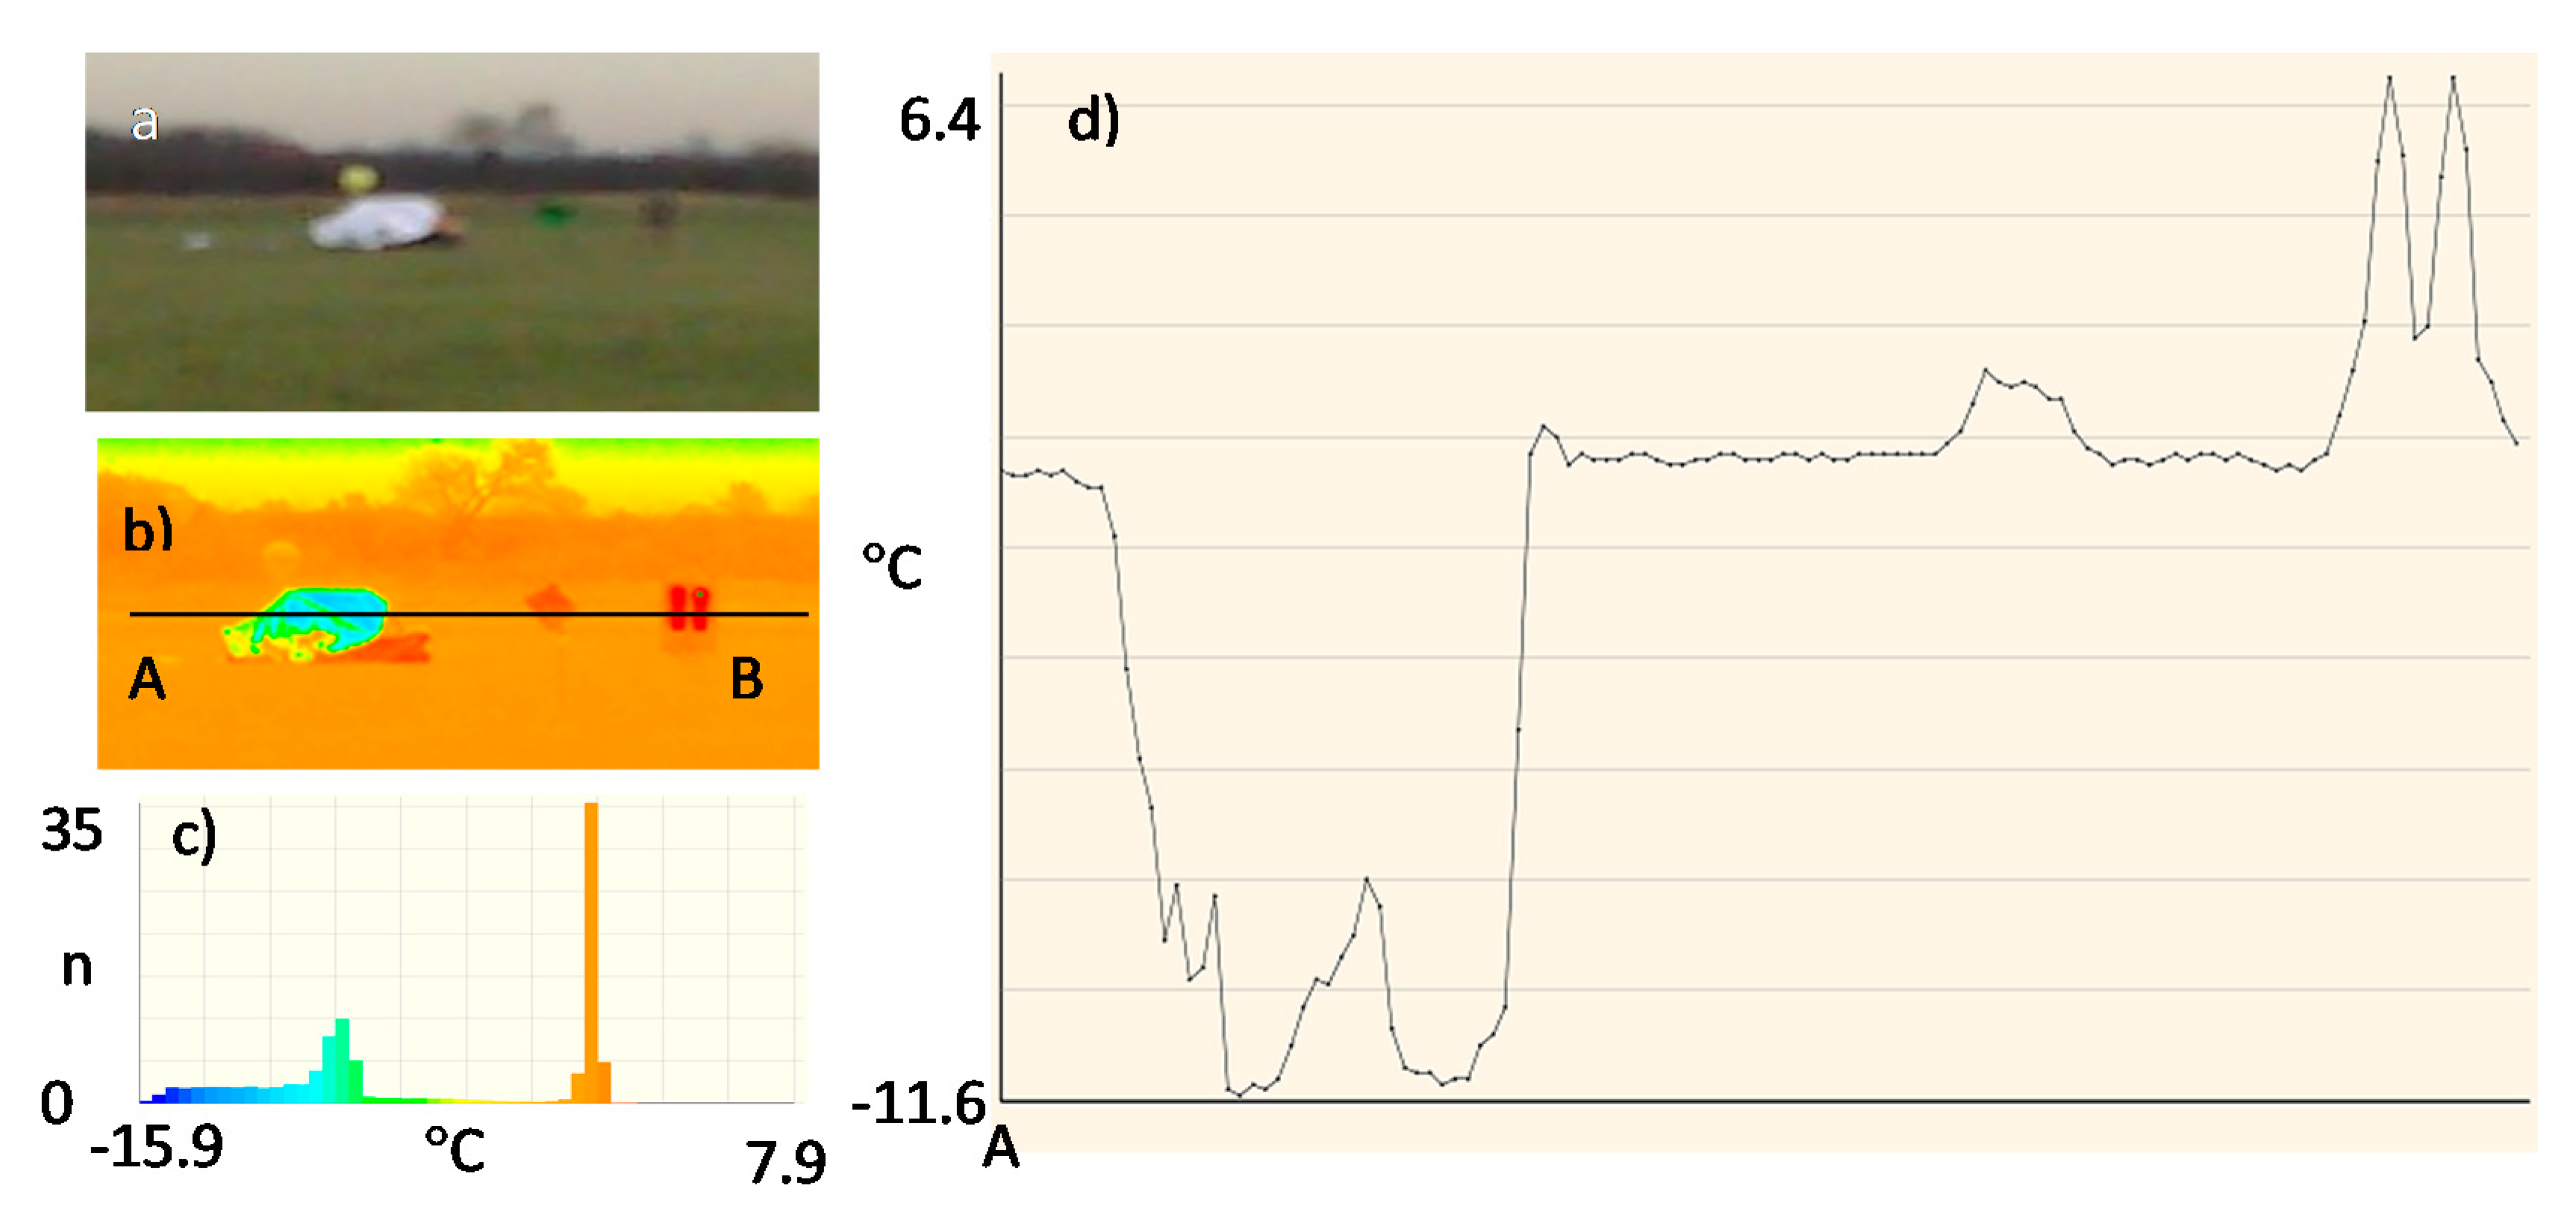
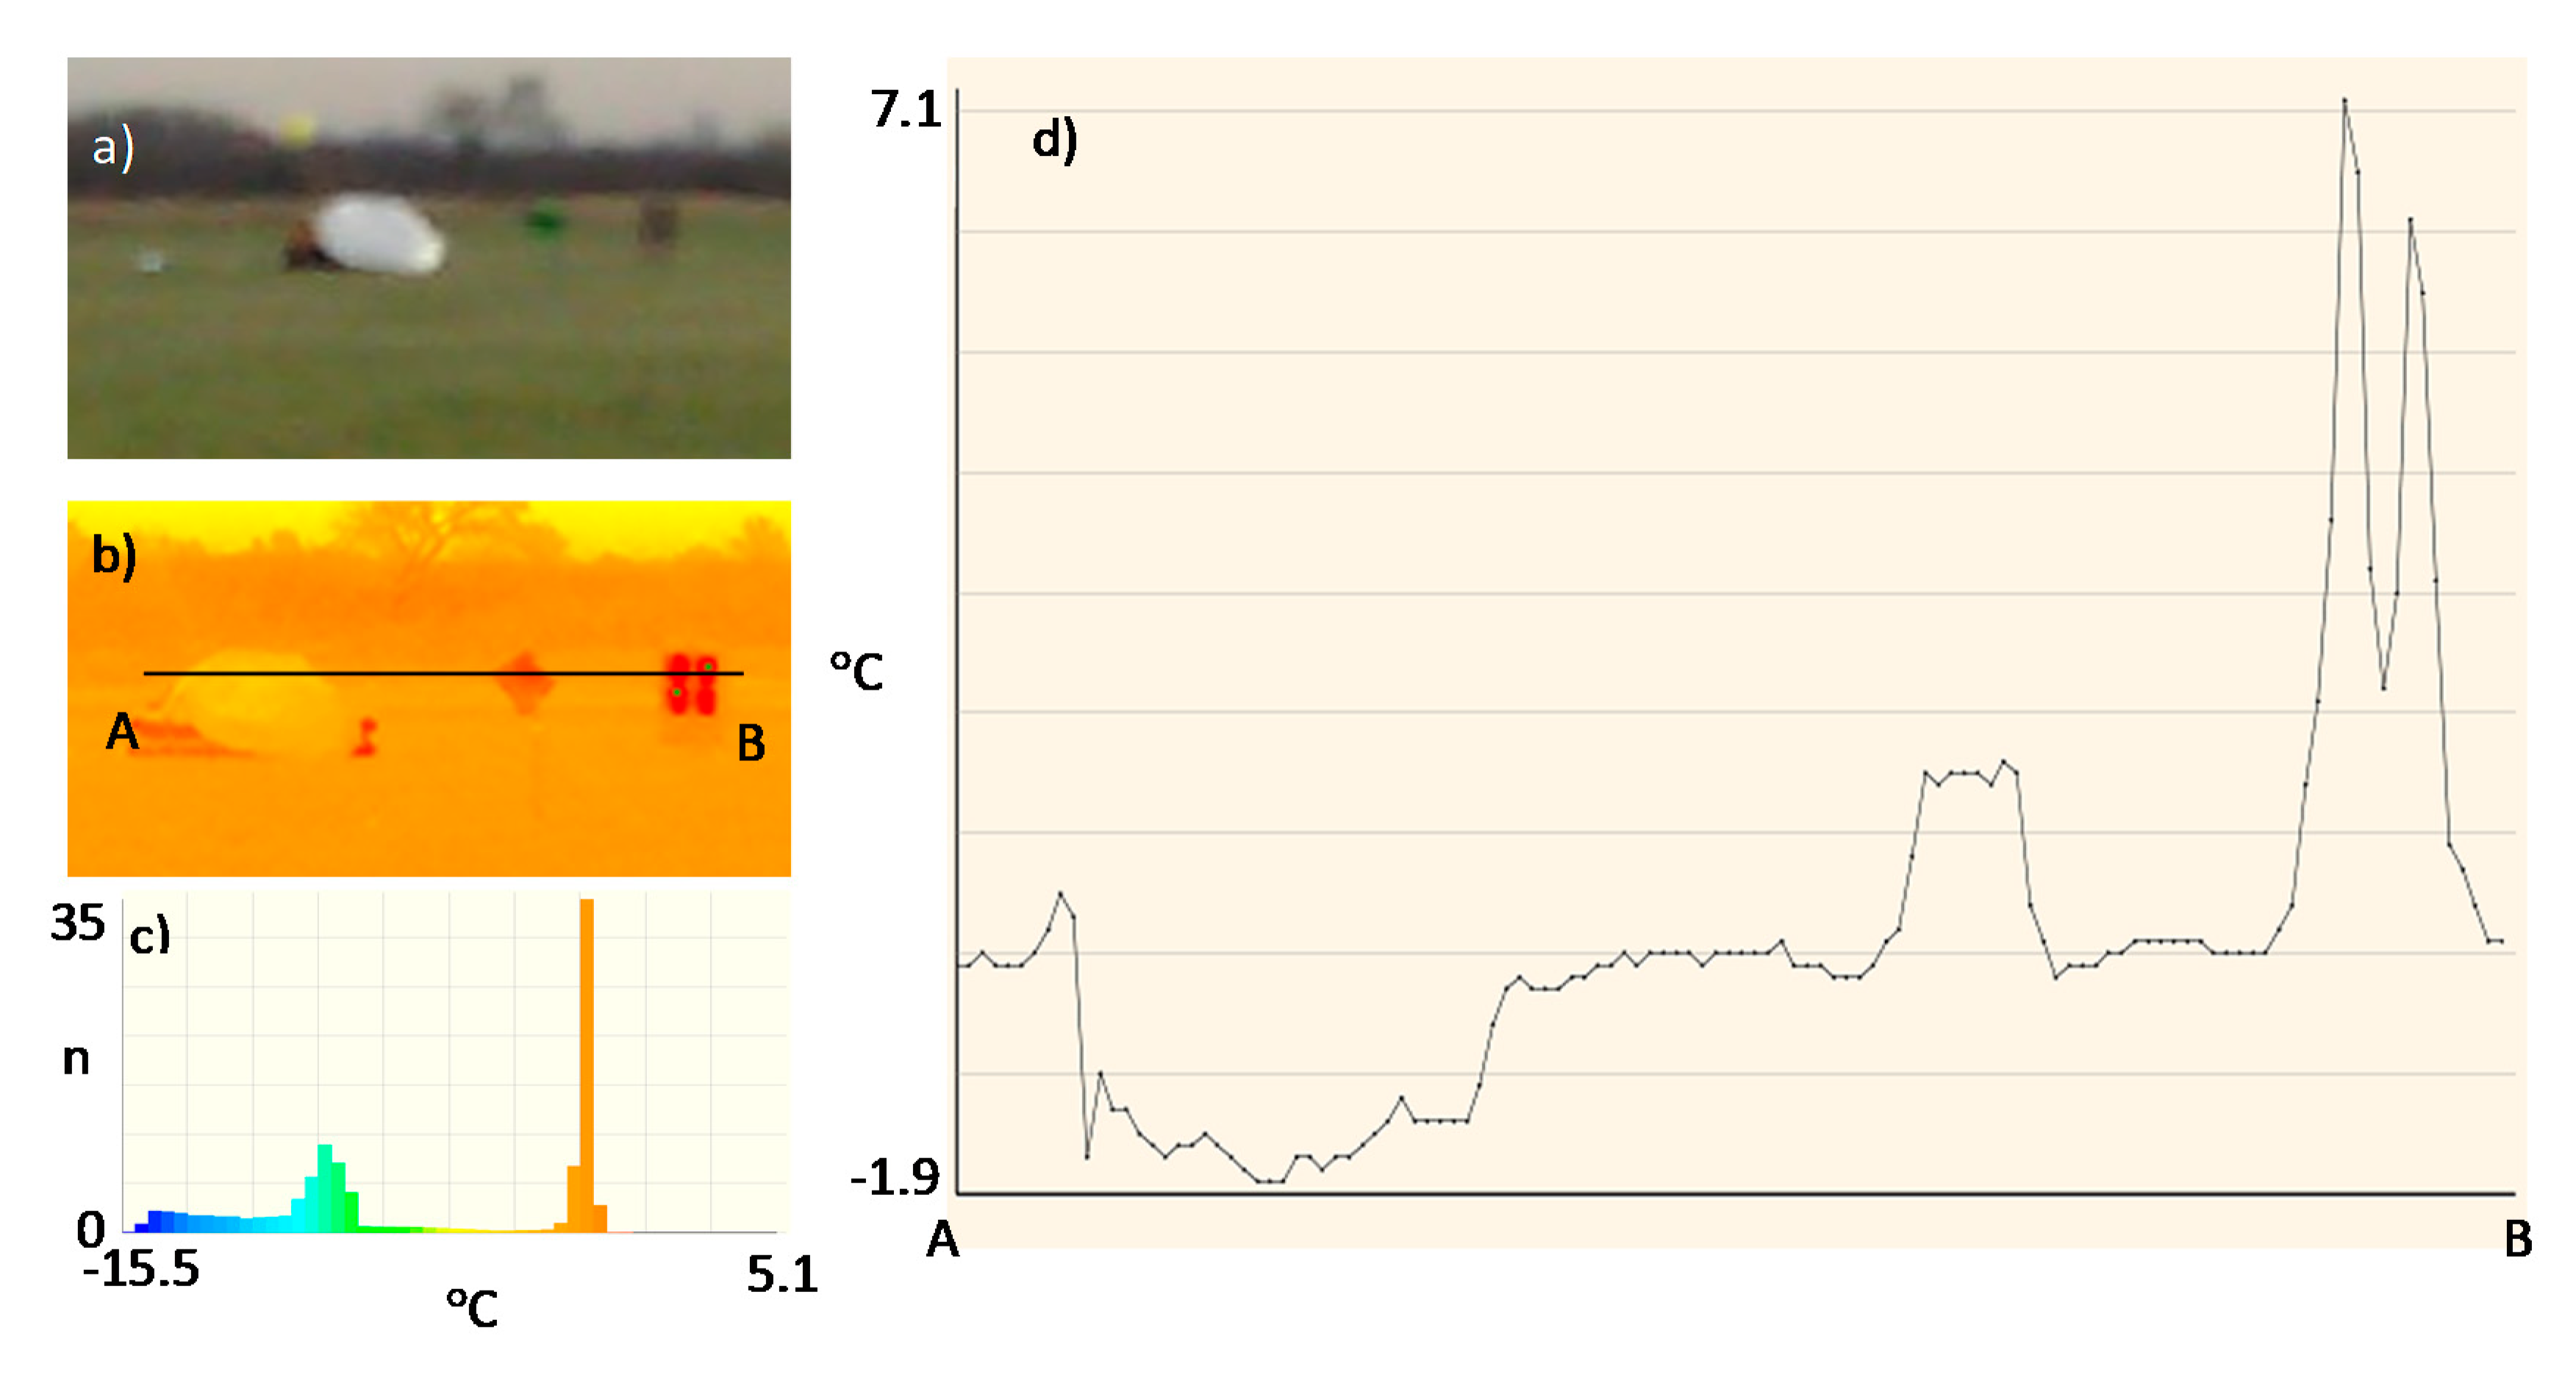
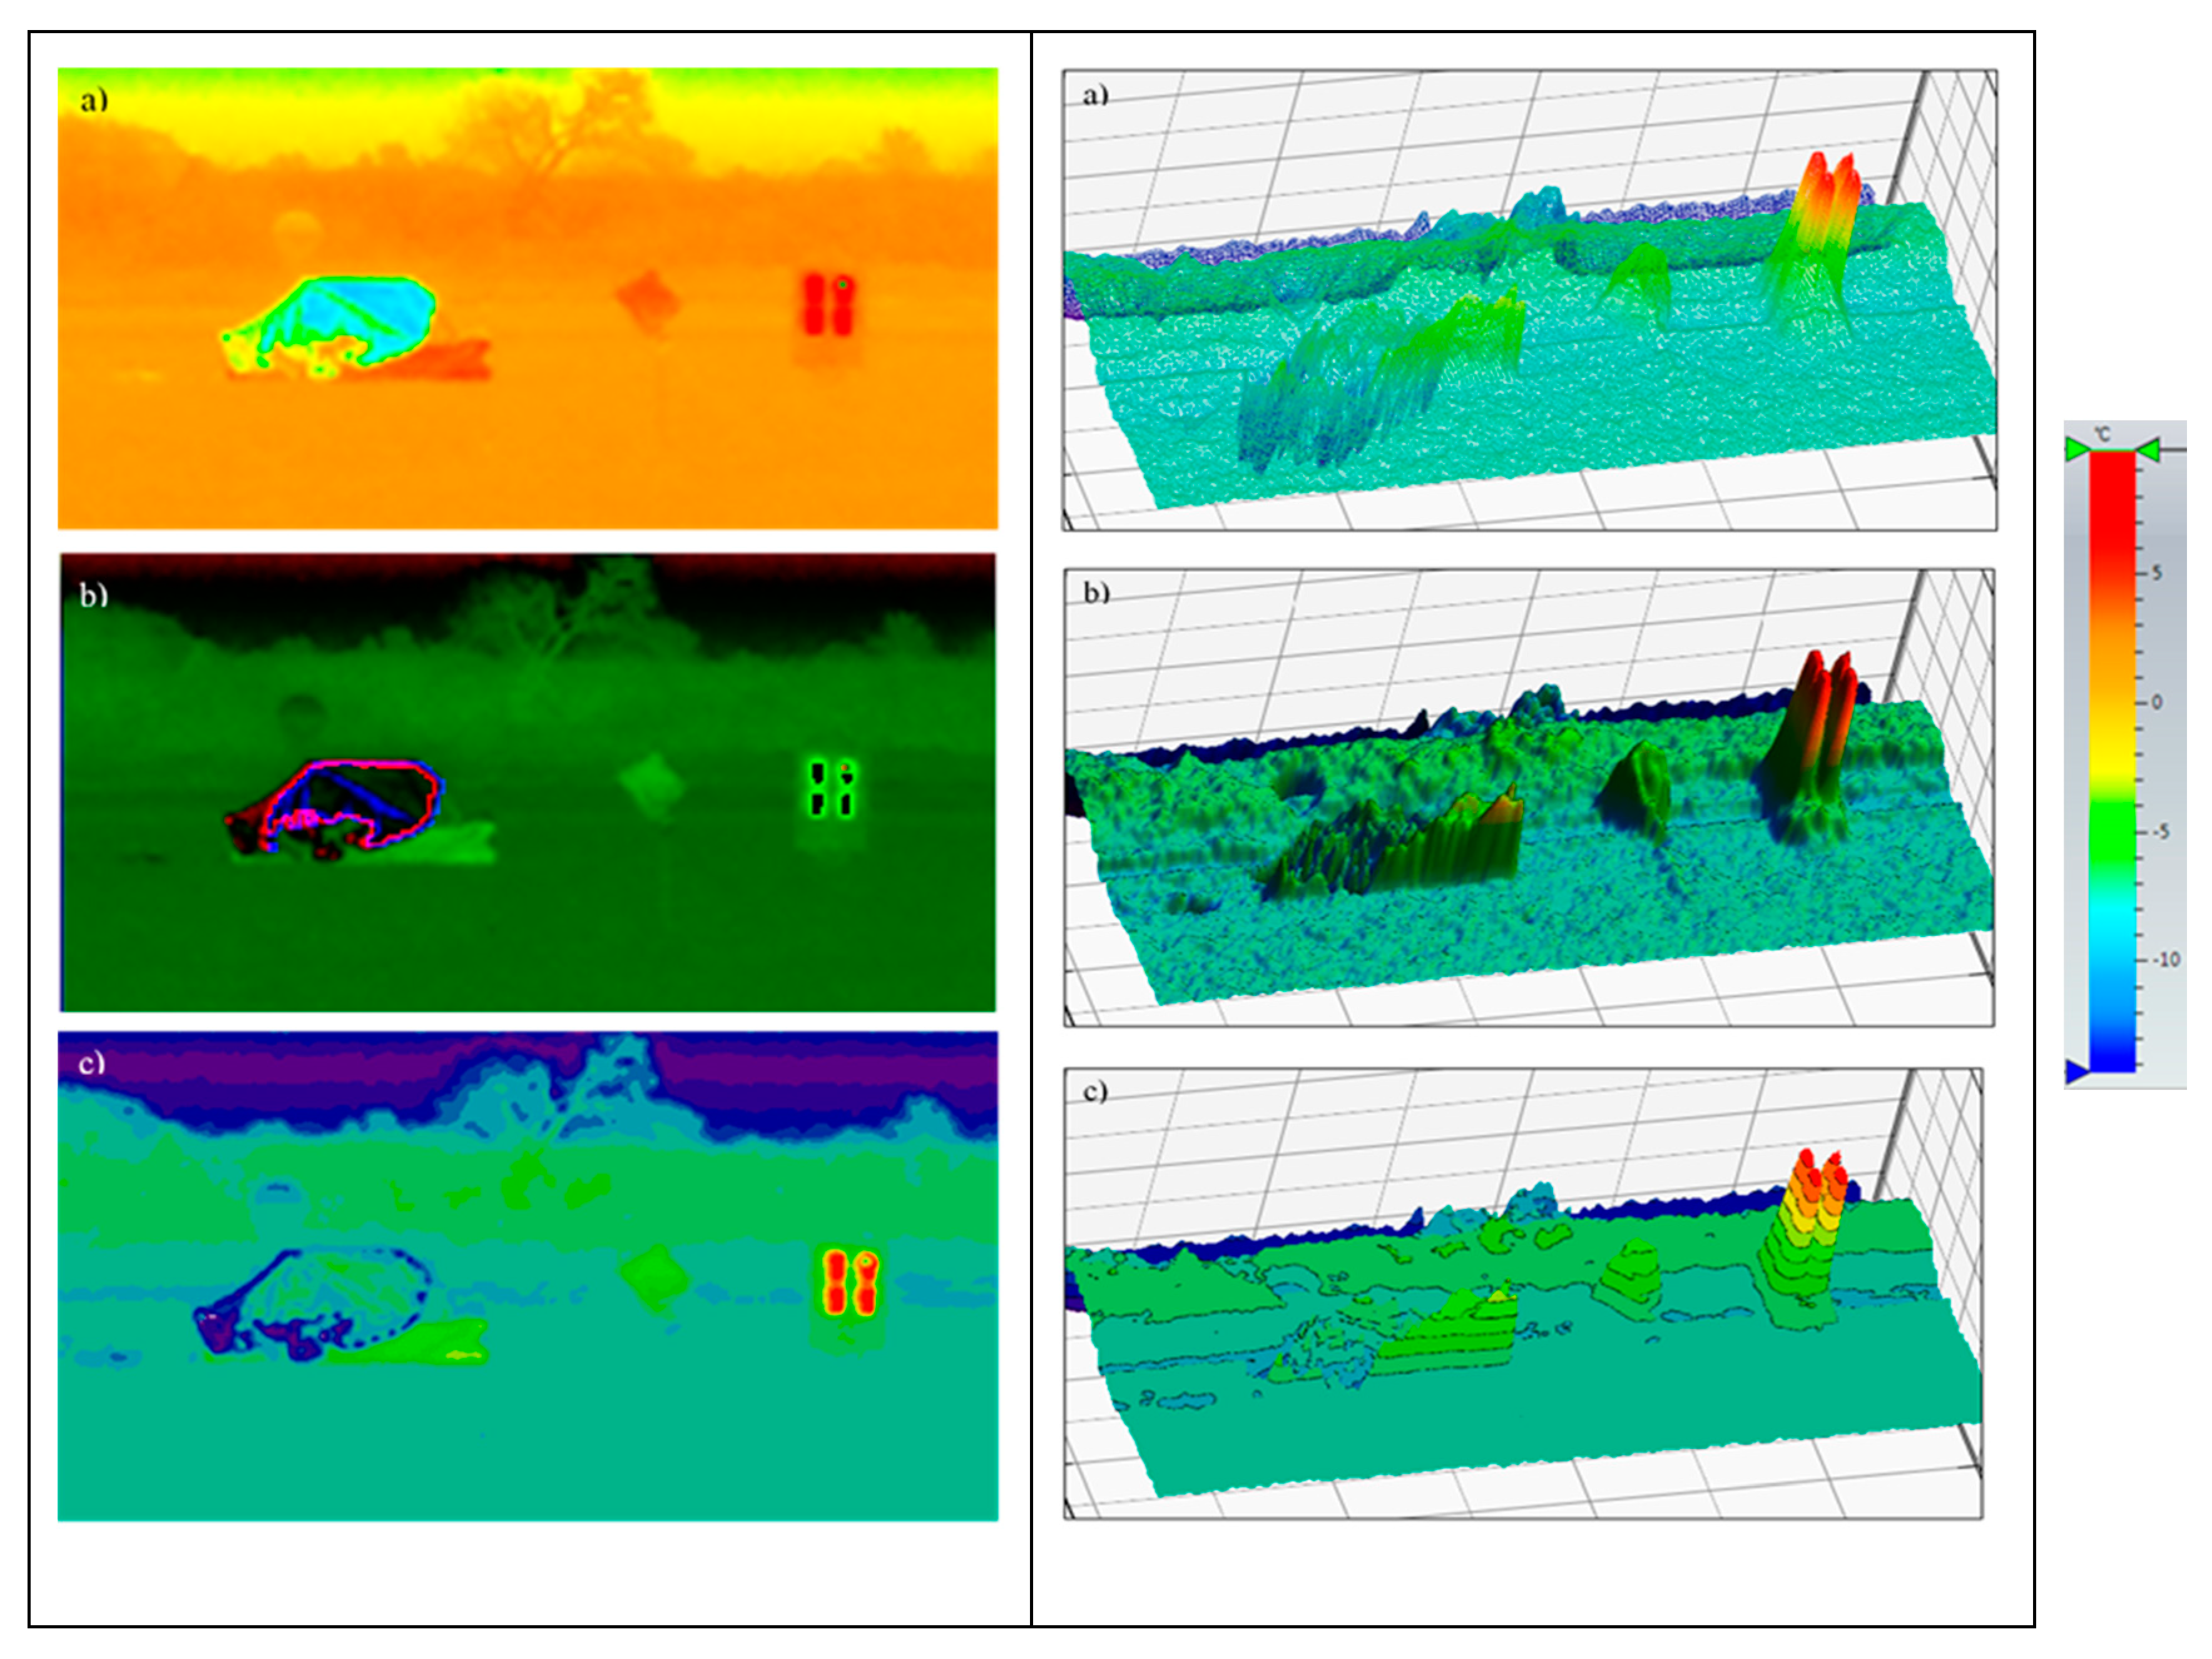
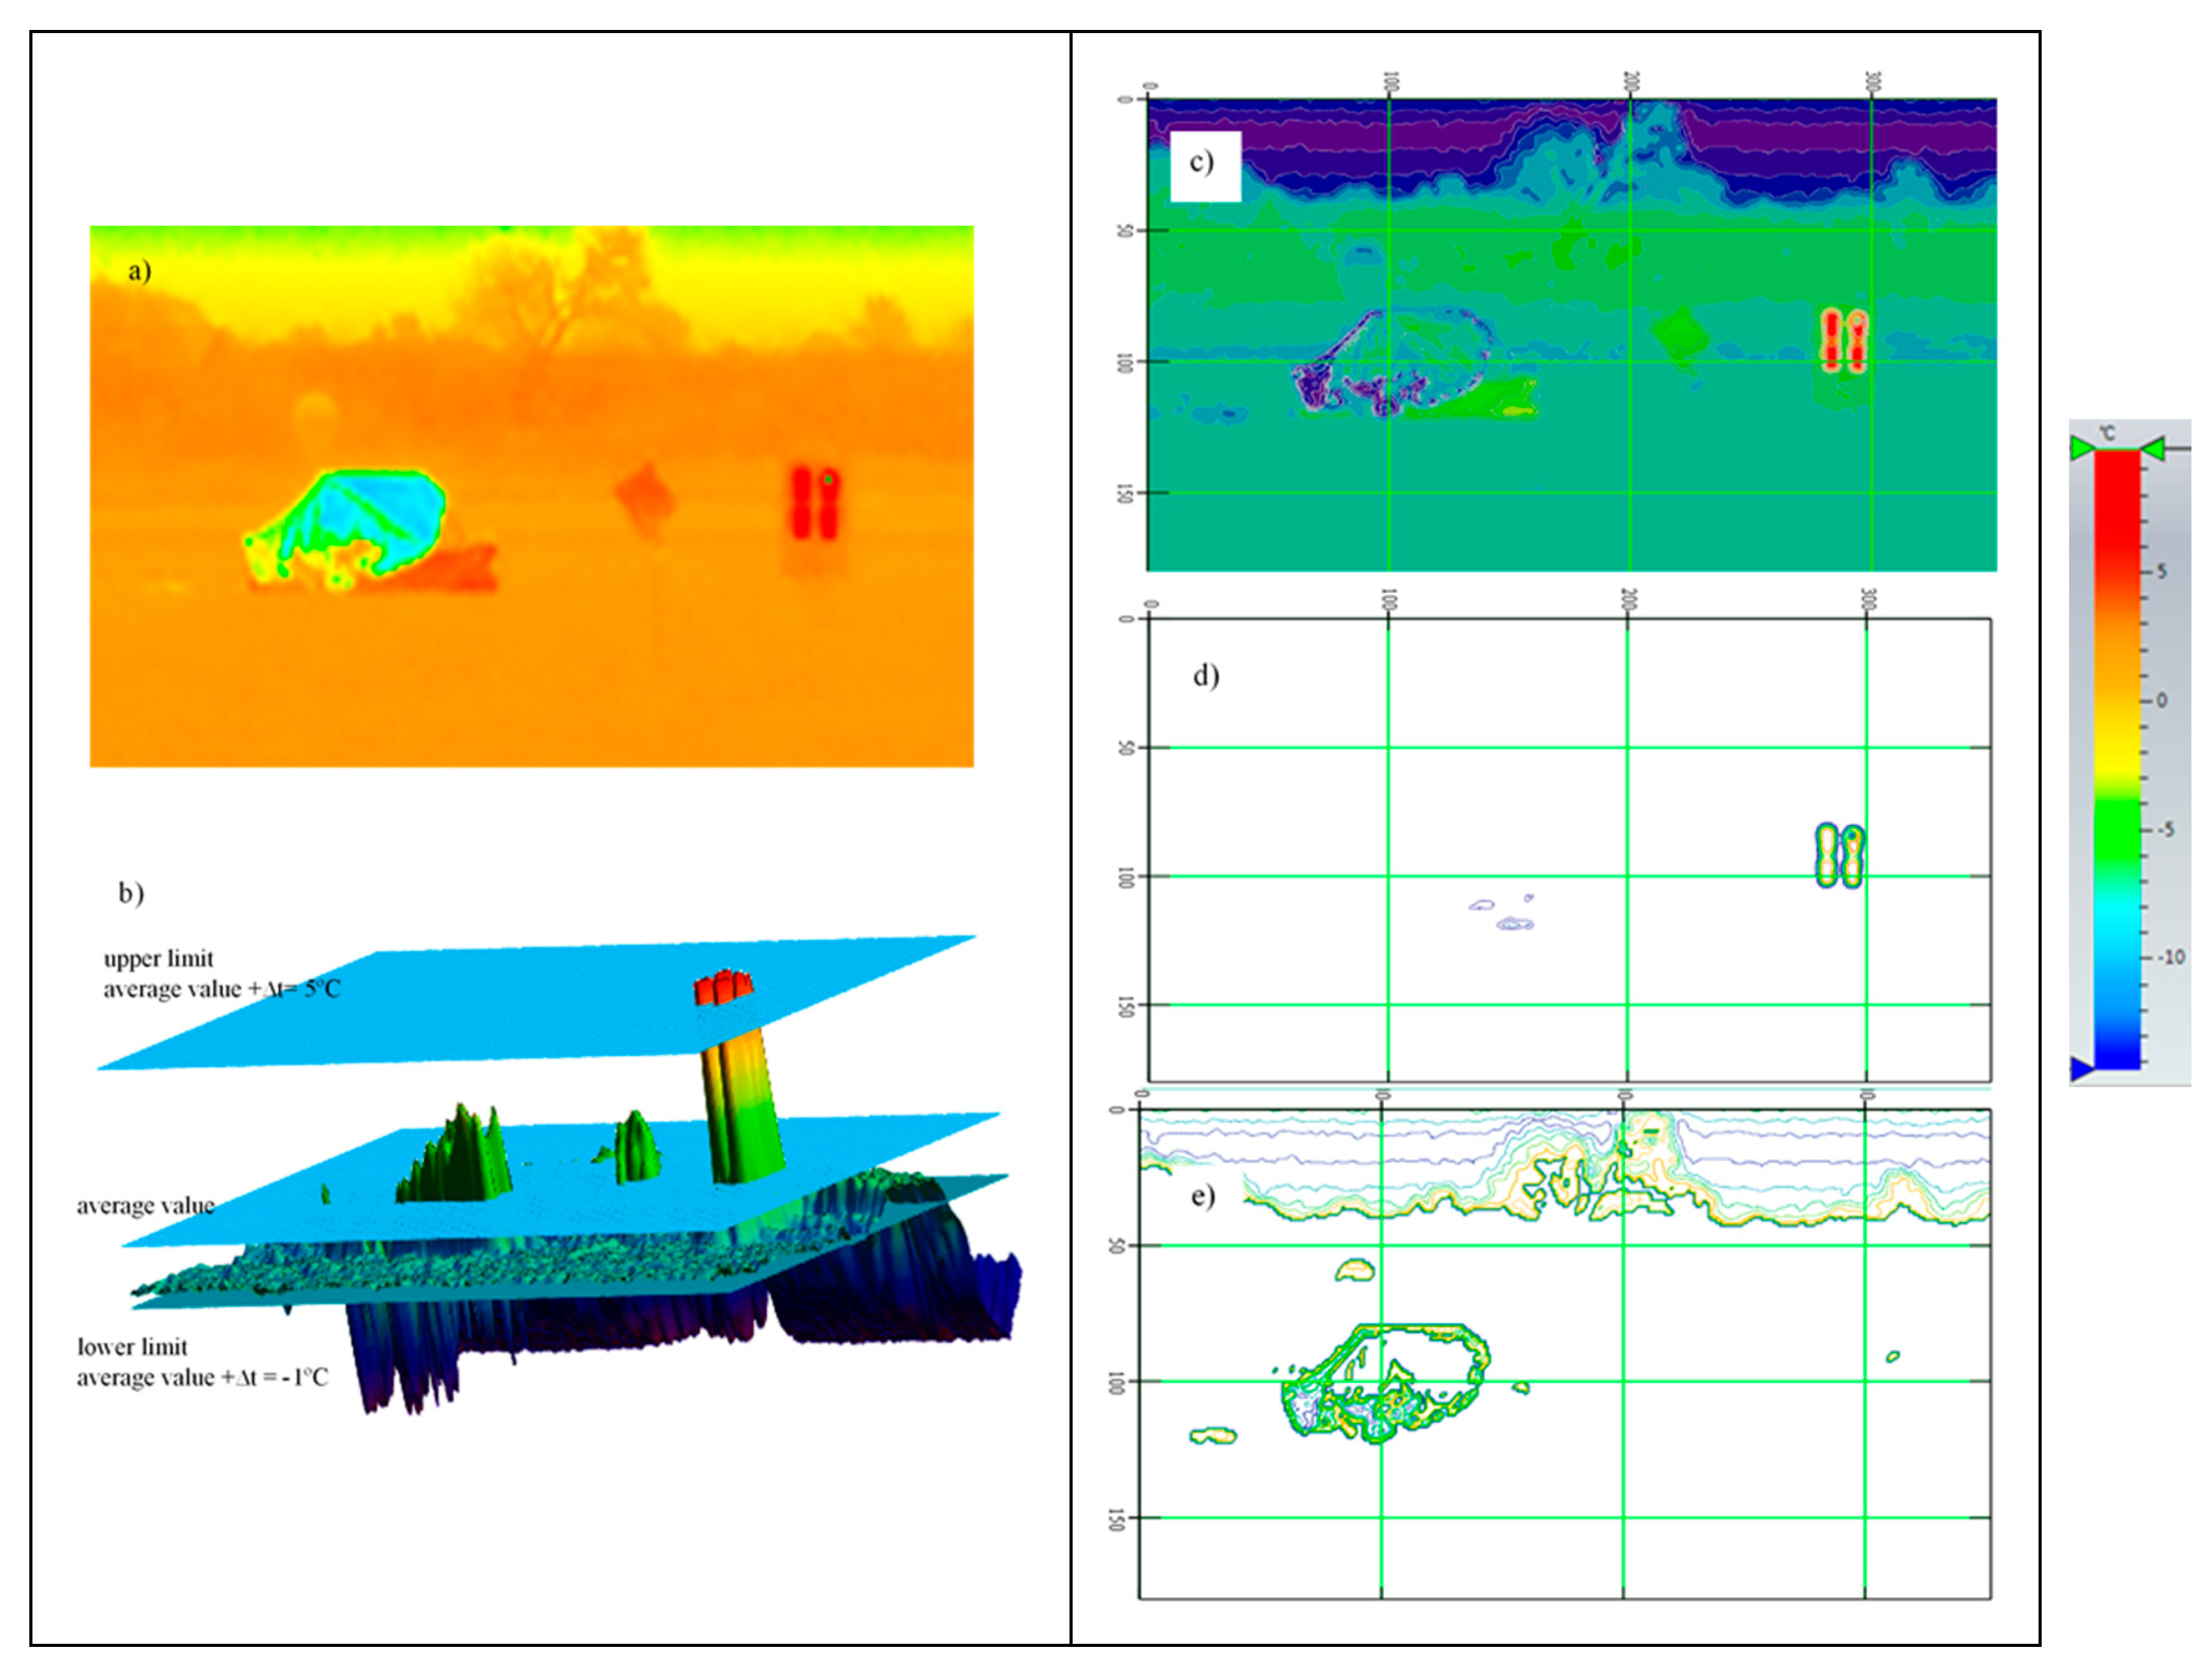
2.2.2. Increasing the Signature in the Thermal Range—Field Experiments
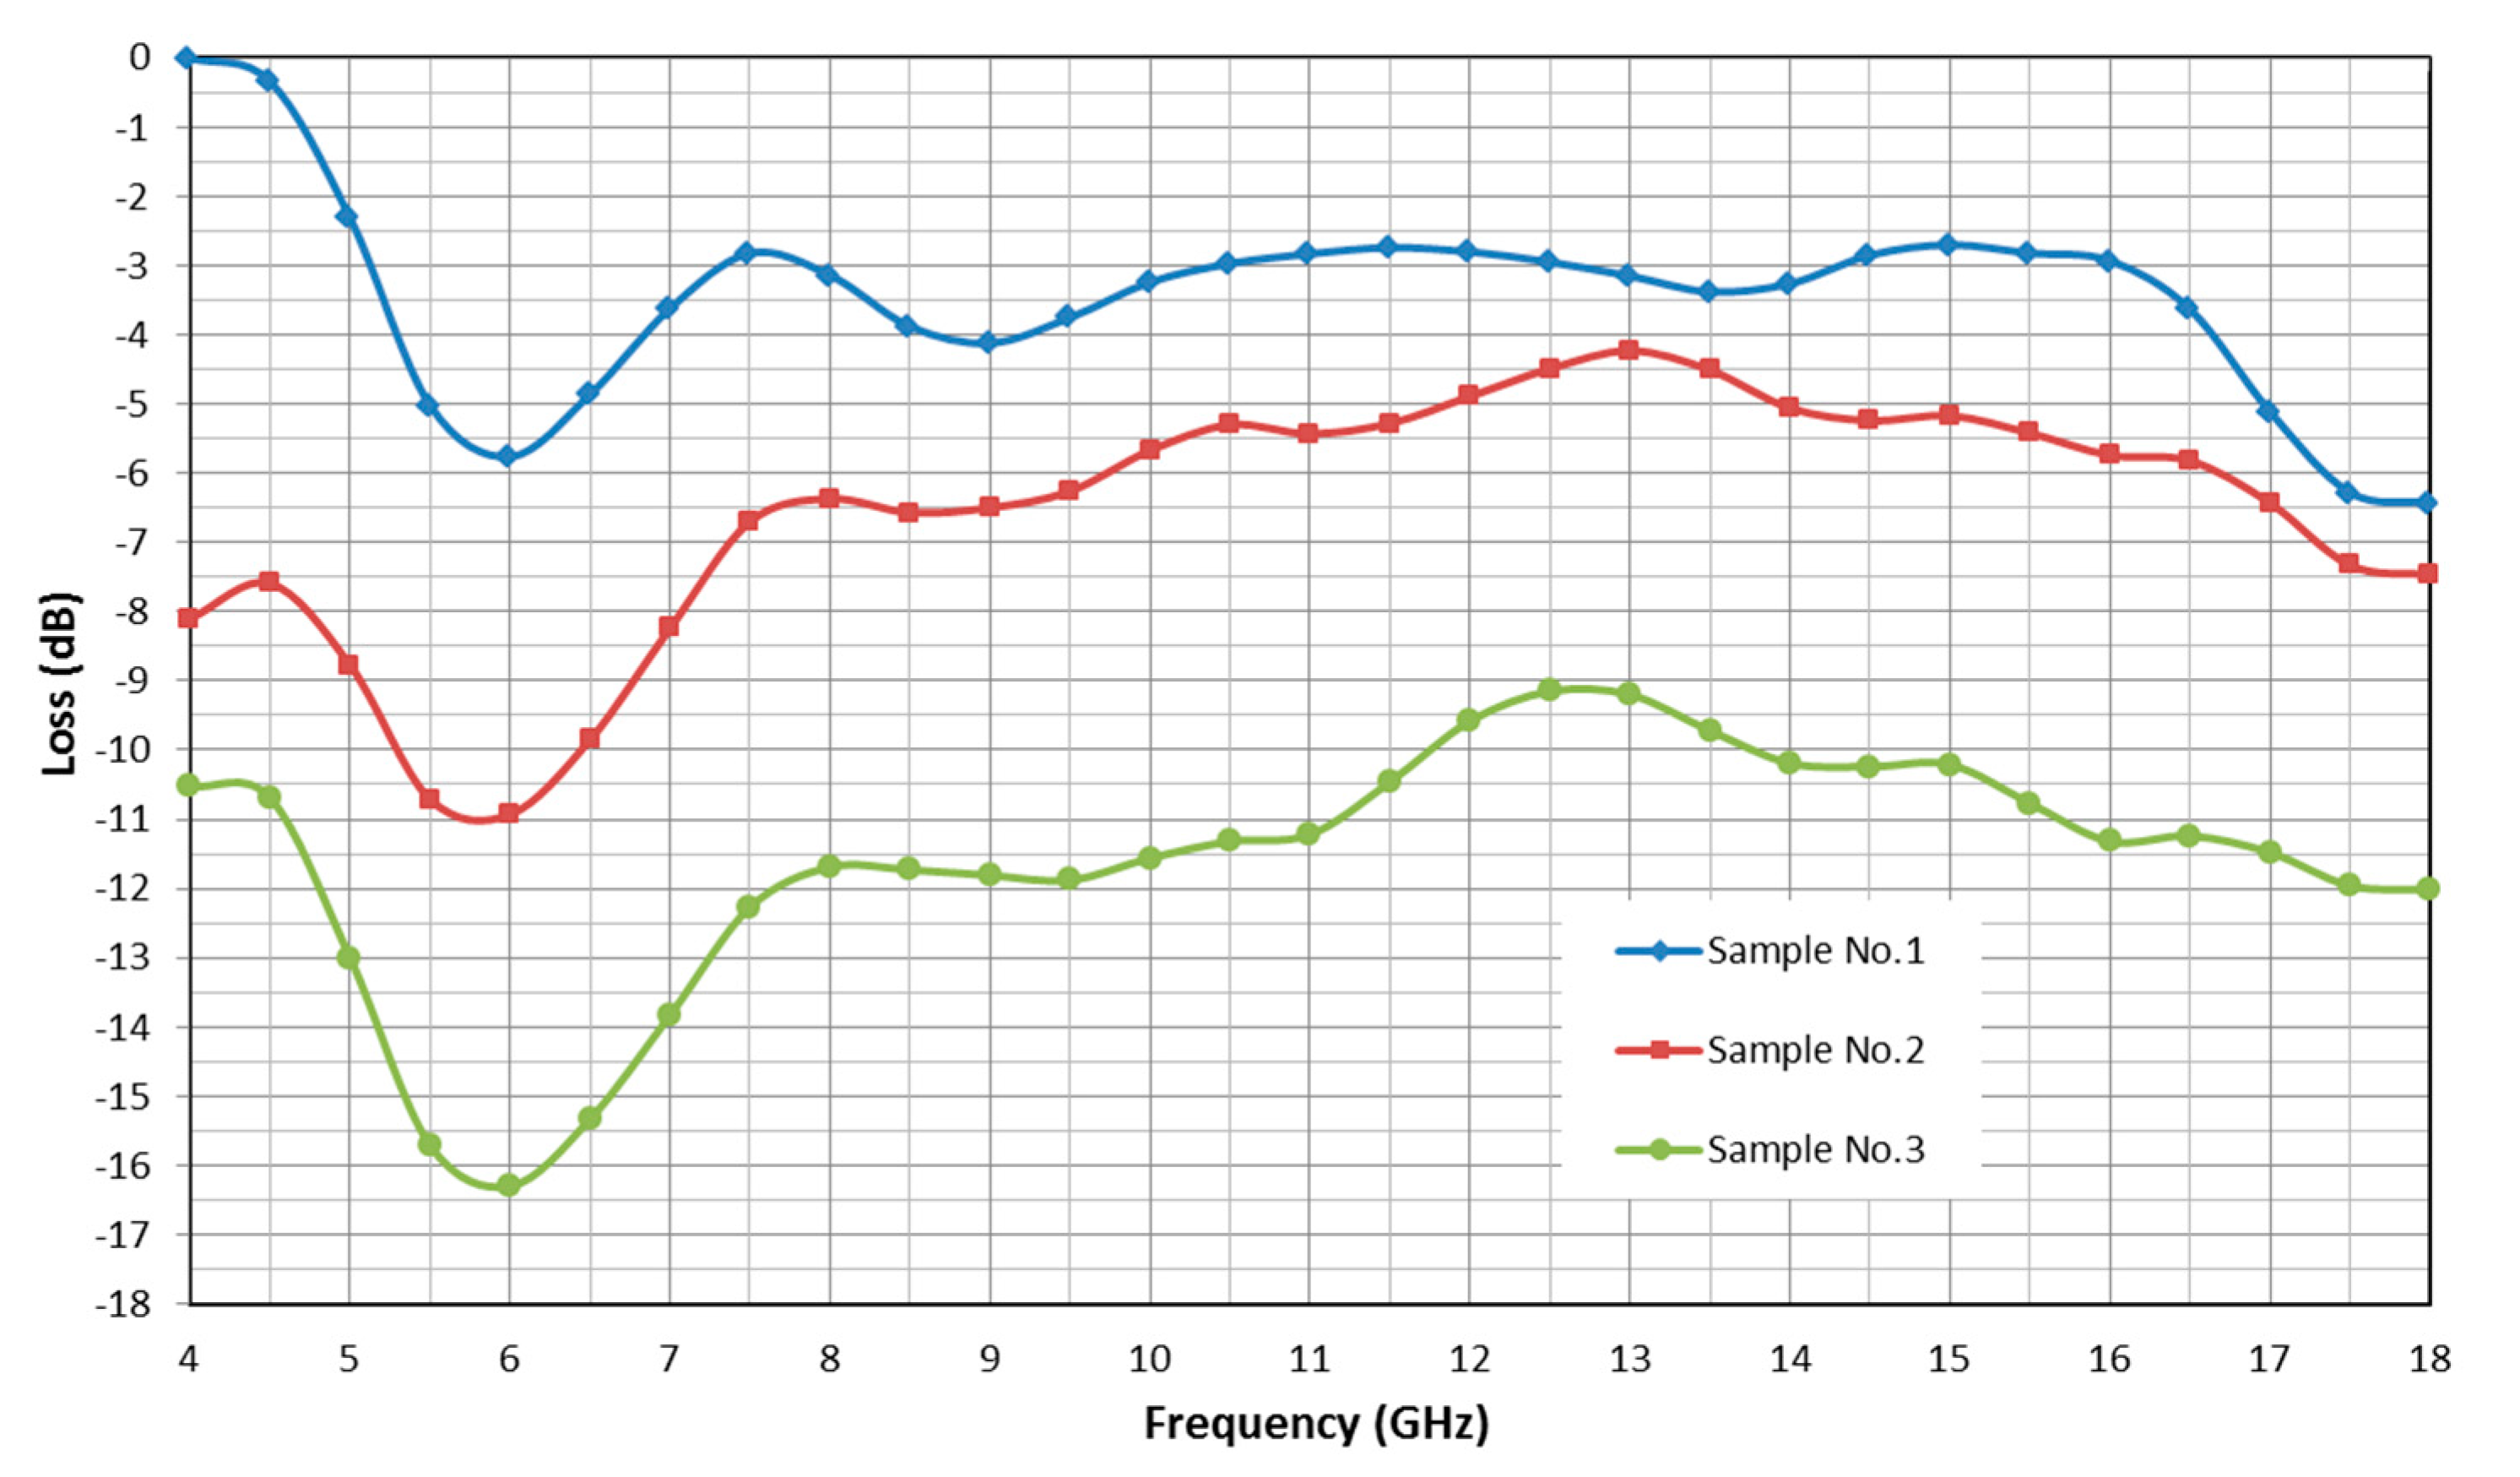
2.2.3. Increasing the Signature in the Radar Range—Laboratory Tests
- the use of a radar target enhancer (radar reflector) mounted directly on the life raft canopy or on a small mast,
- giving the outer shell of the raft the properties, which would result in radar signals being reflected.
3. Discussion
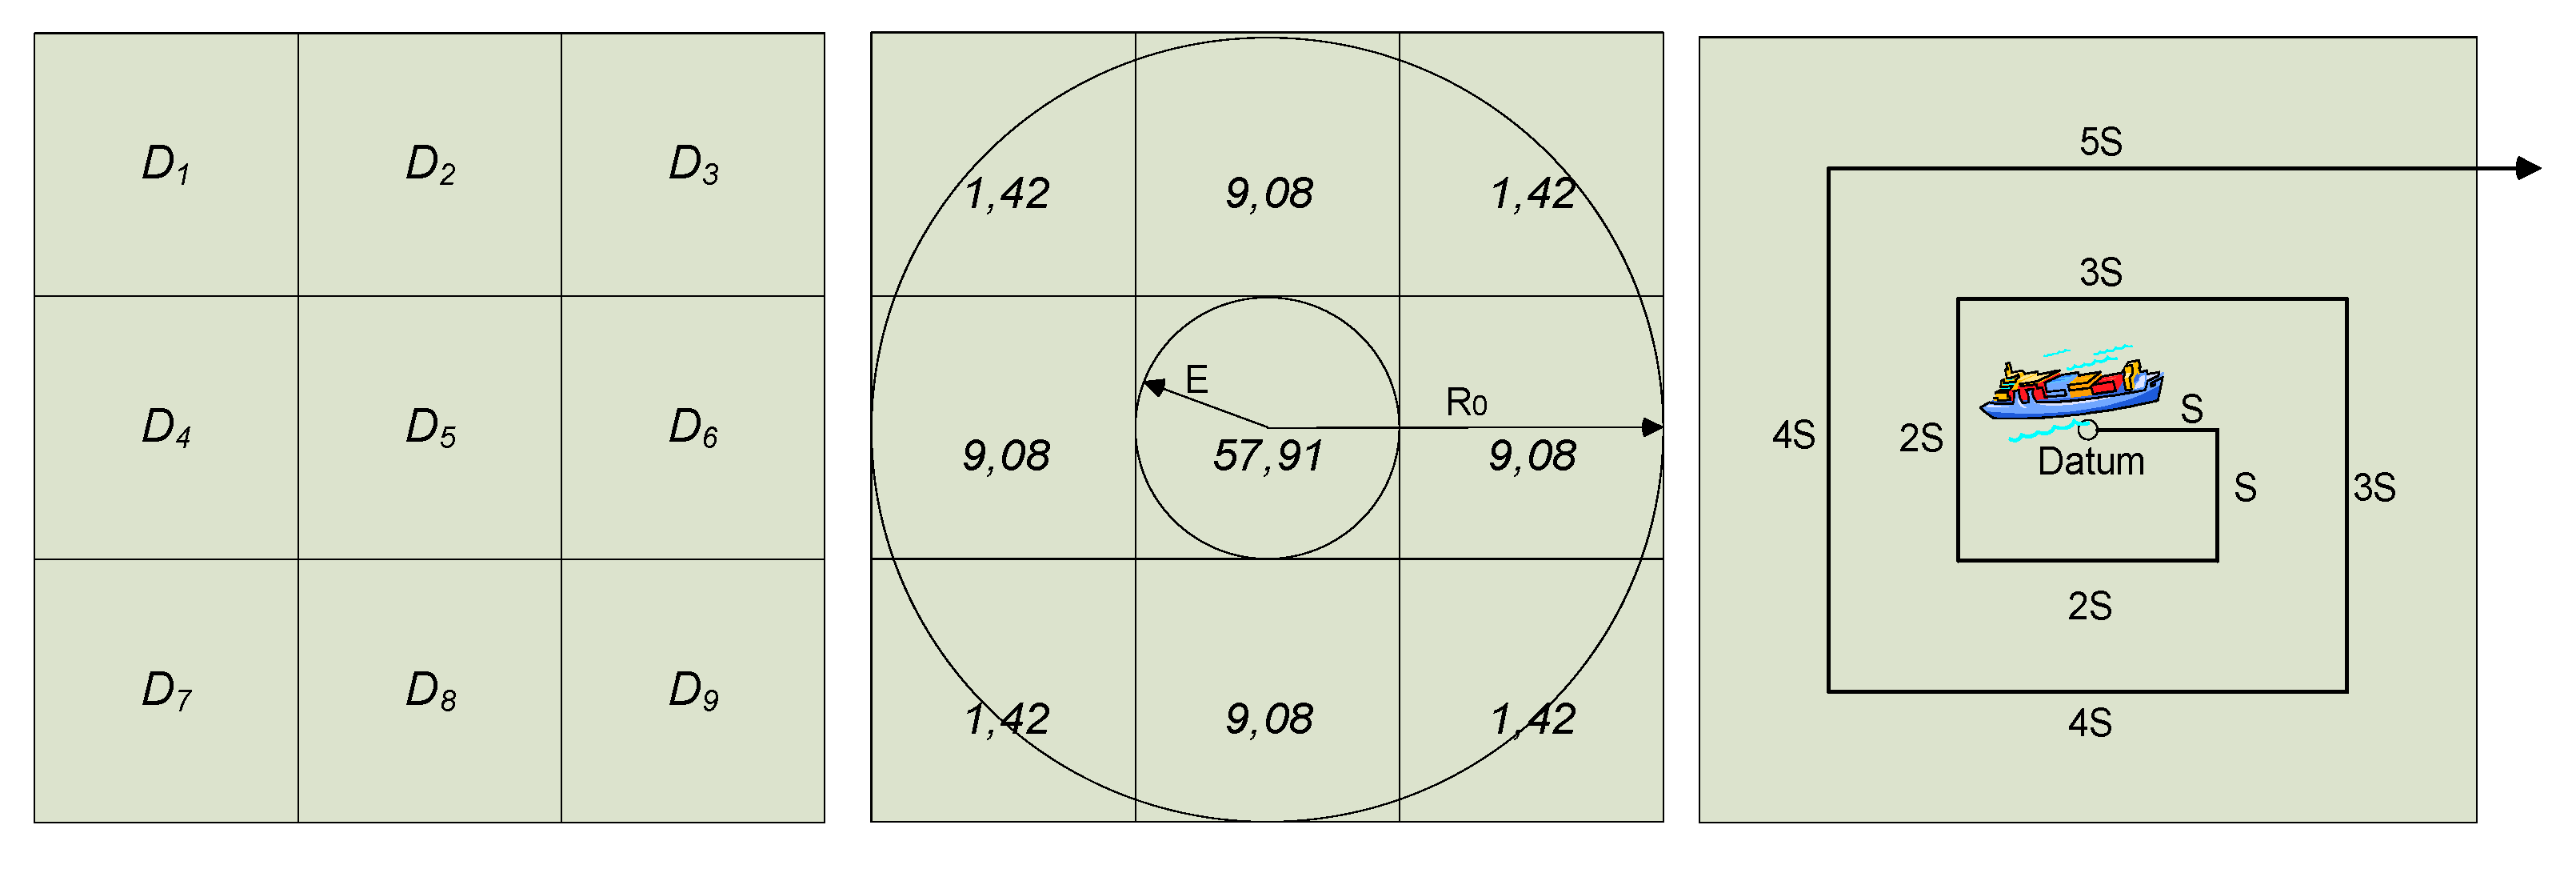
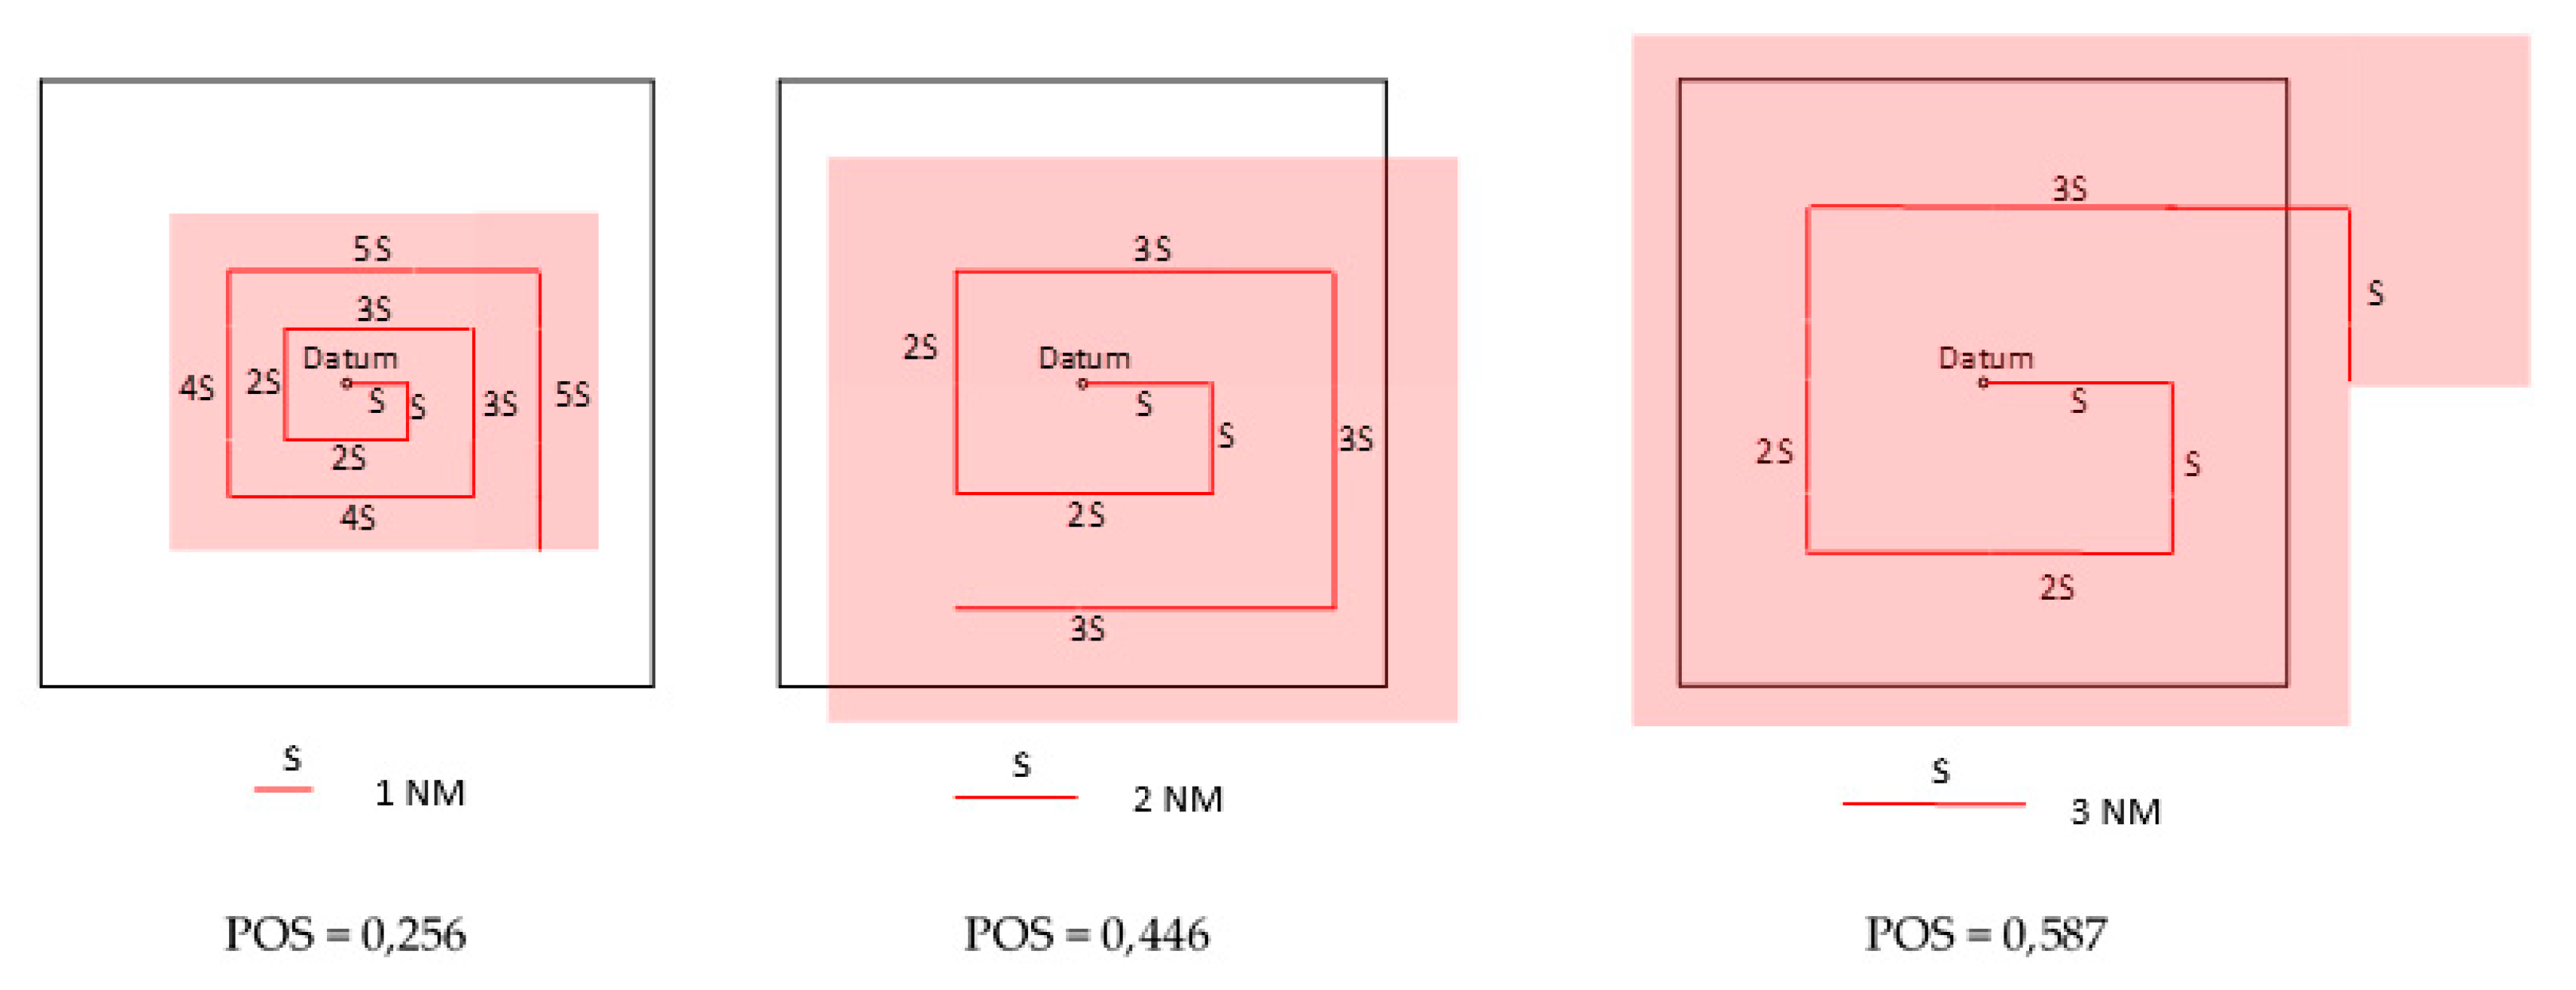
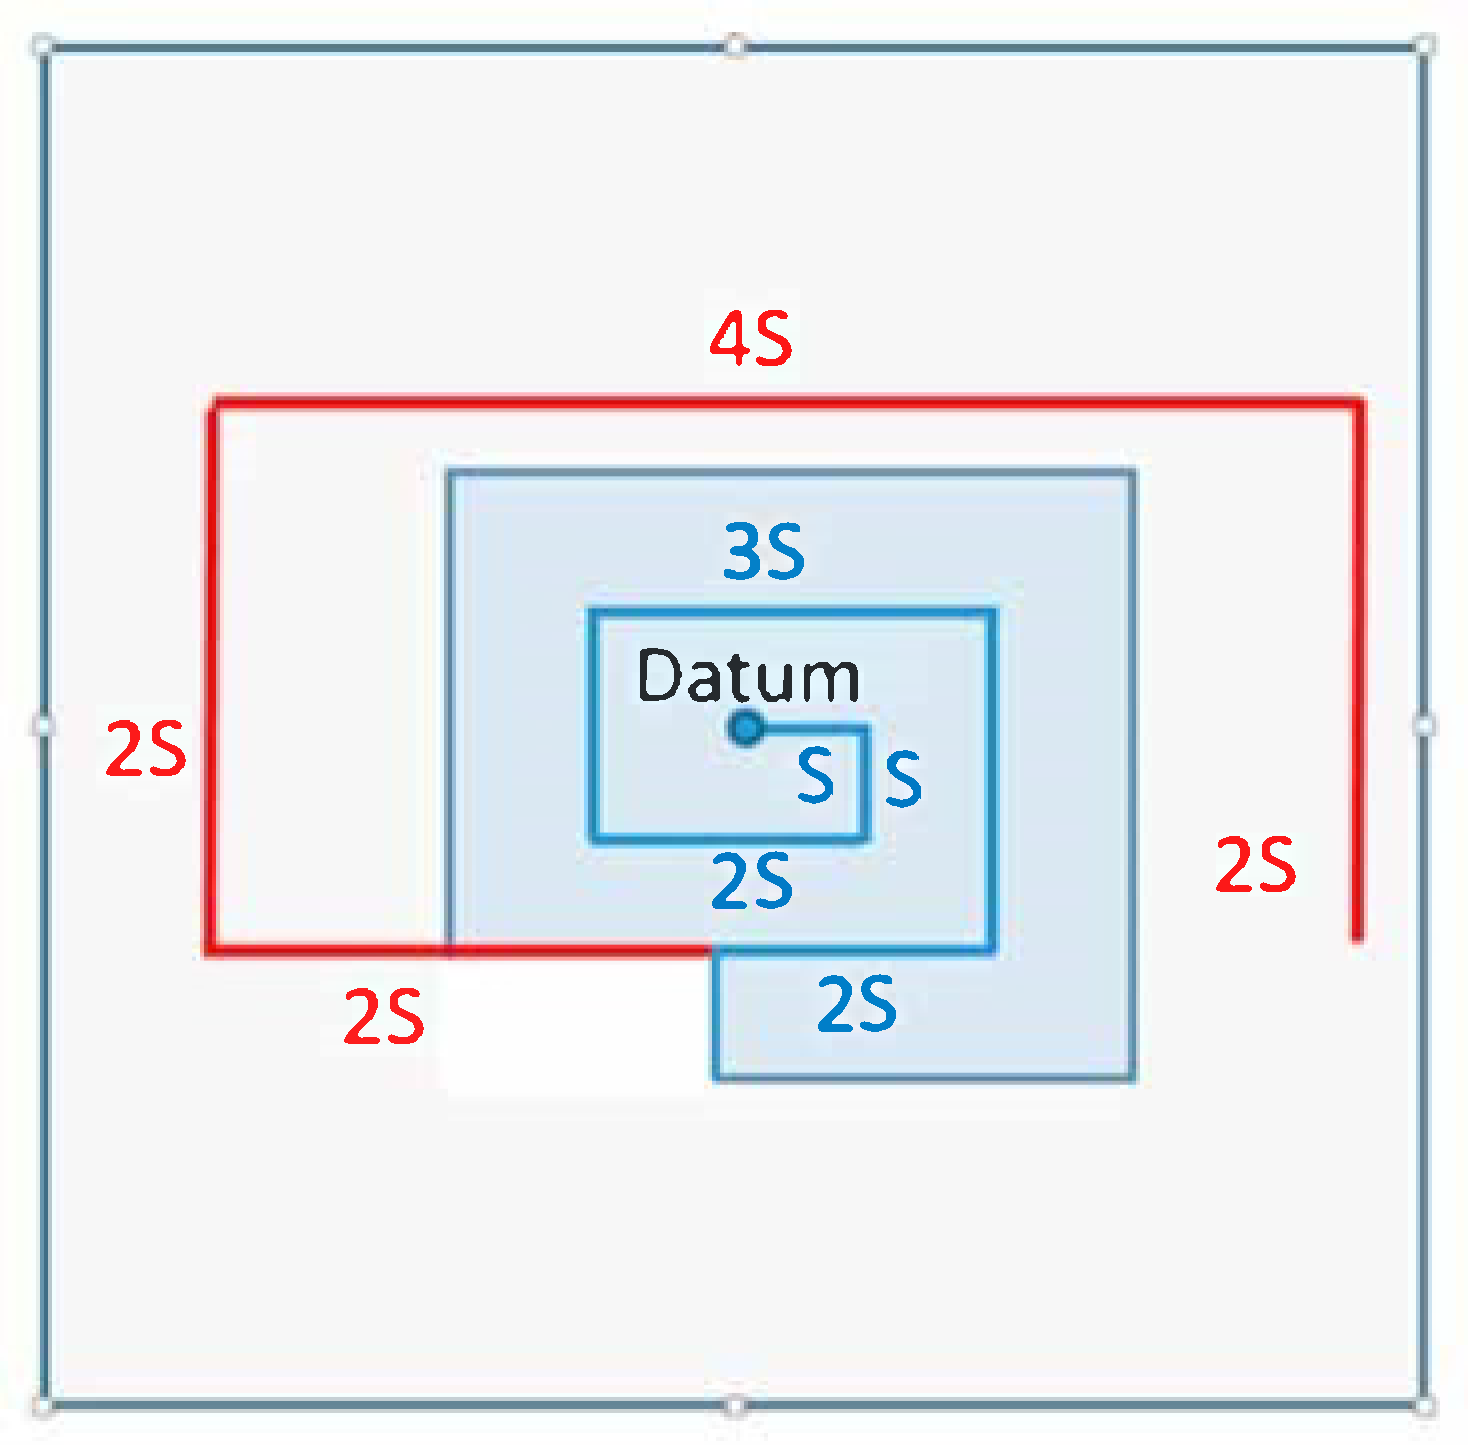
3.1. Increase of POS by Widening the Sweep Width of a Search Pattern
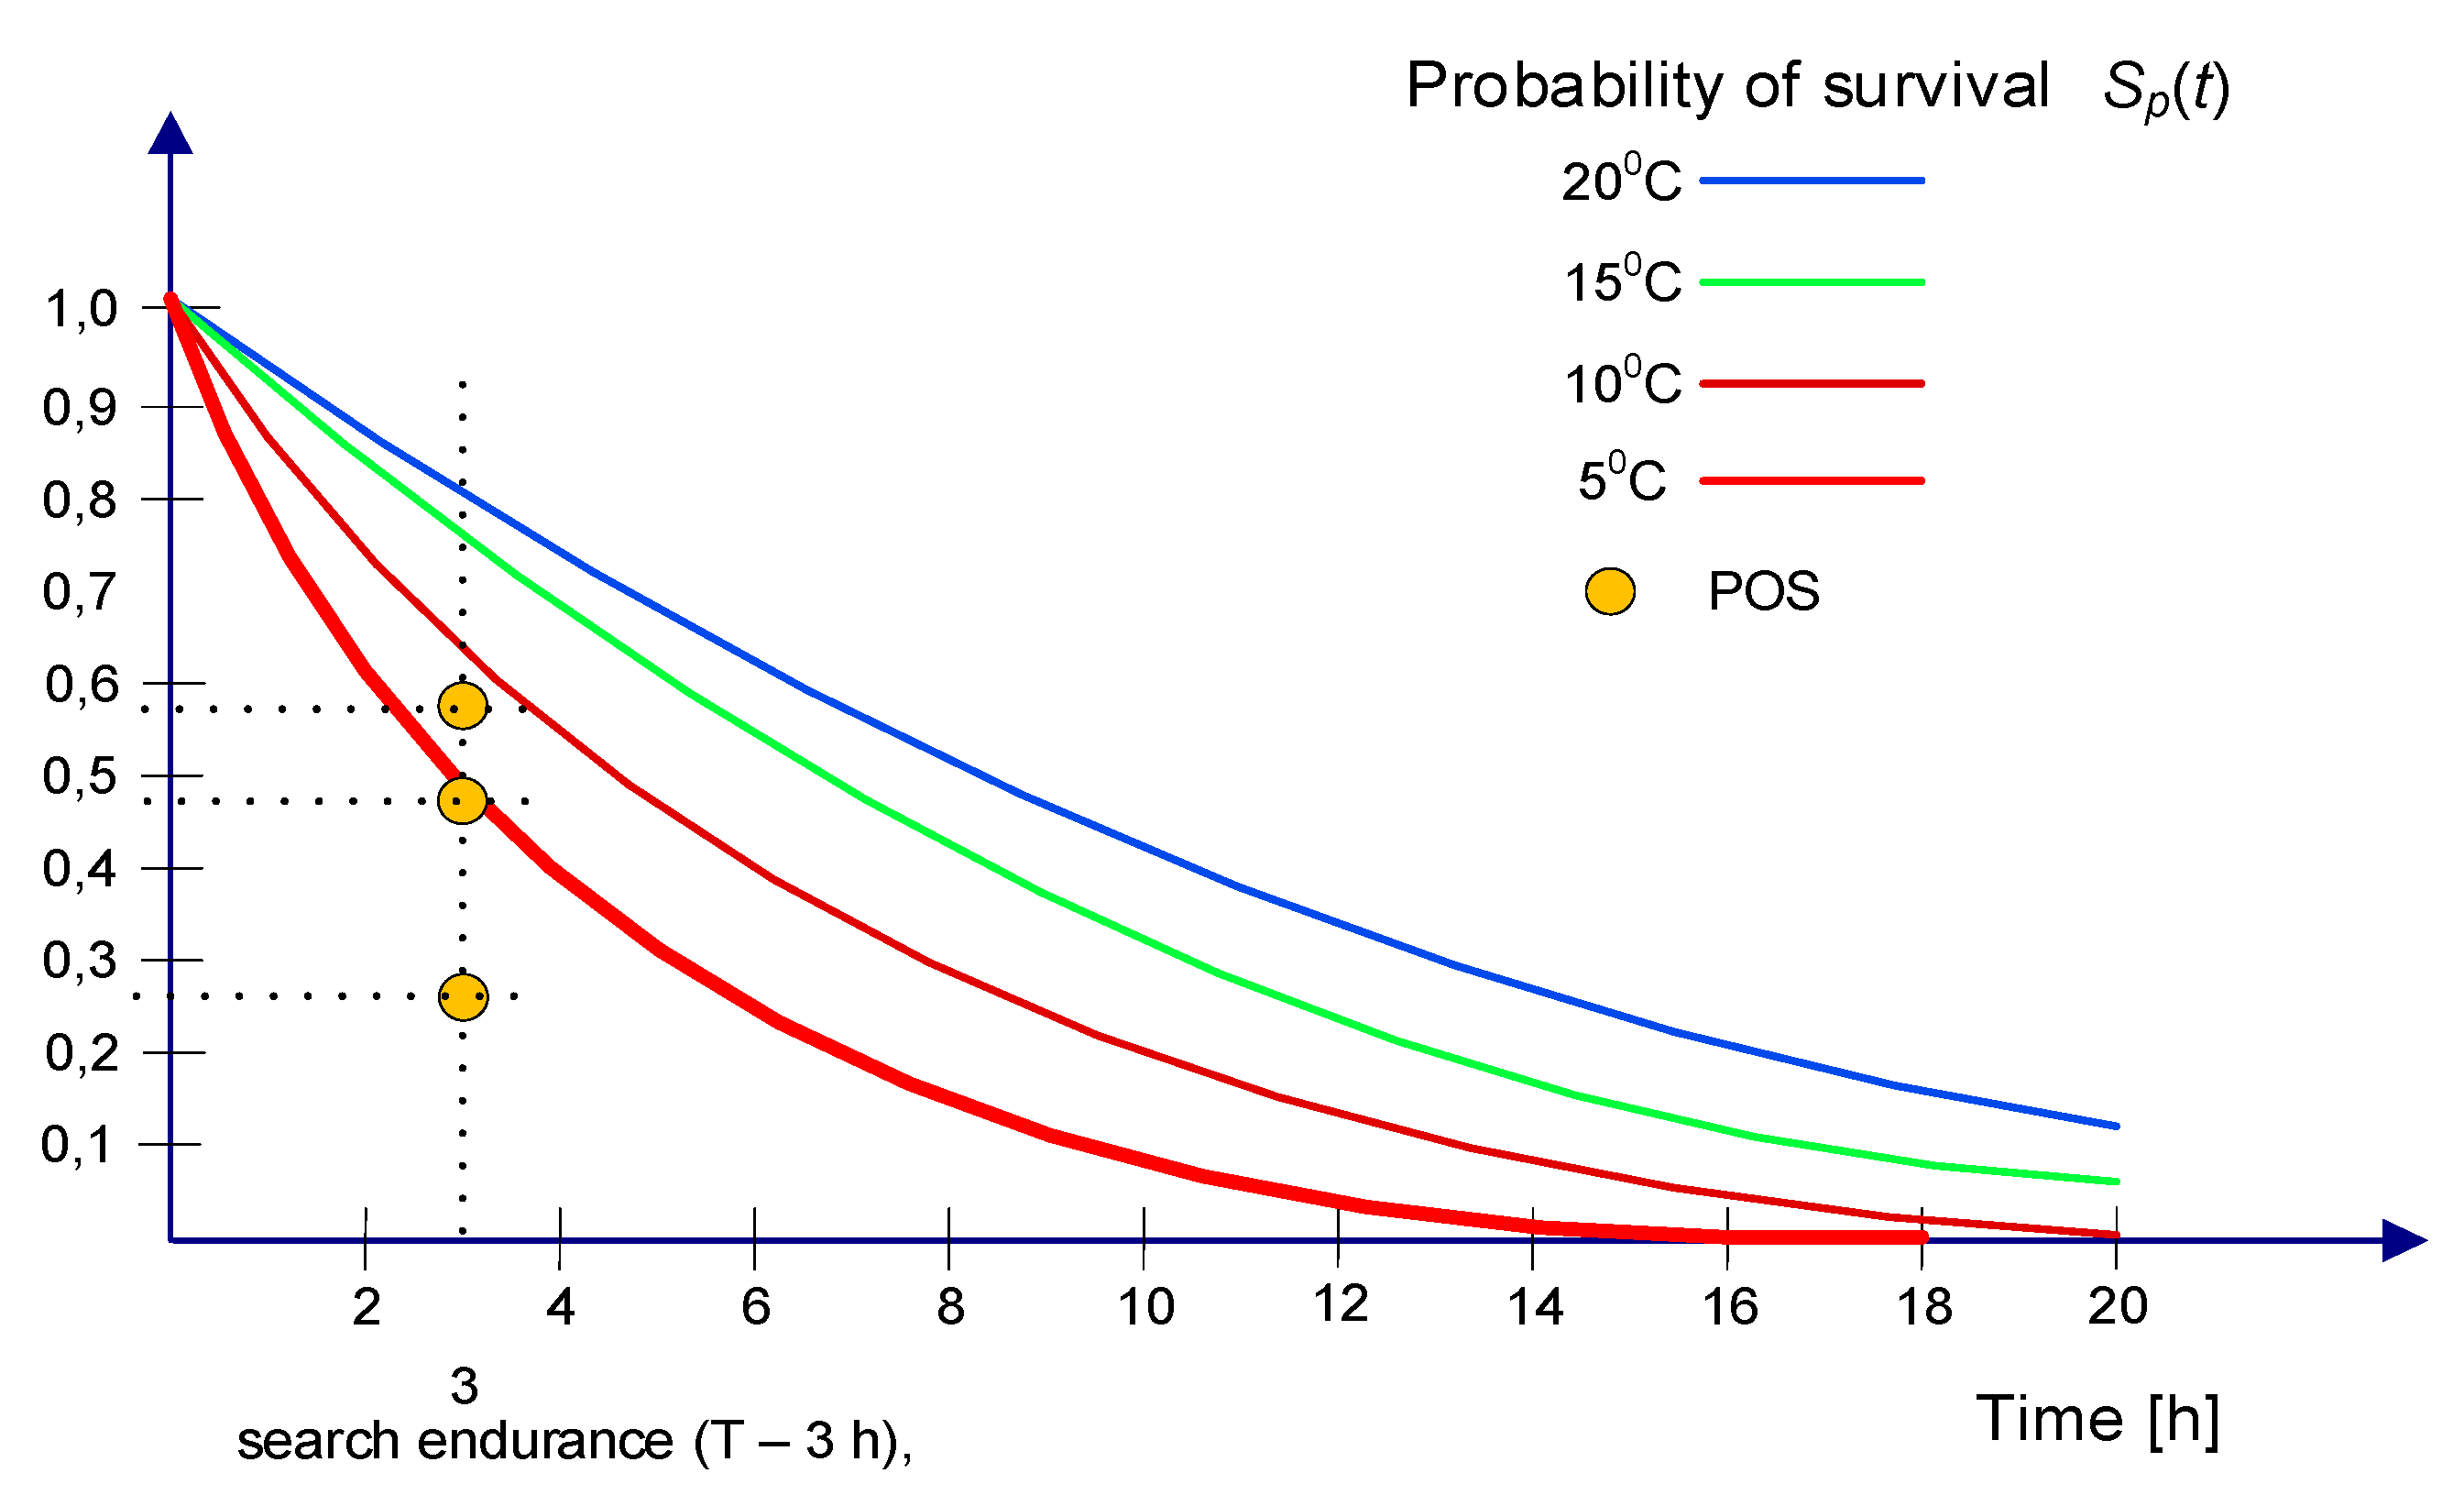
3.2. Influence of Detection Distance on the Probability of Success Related to the Survival Time of a Person in the Water
4. Conclusions
Author Contributions
Funding
Conflicts of Interest
References
- Burciu, Z. Reliability of Search and Rescue Action in Maritime Transport; Publishing House of Warsaw University of Technology: Warsaw, Poland, 2012; p. 284. [Google Scholar]
- Skokdalen, J.E. Quantitative risk analysis offshore—Human and organizational factors. Reliab. Eng. Syst. Saf. 2011, 96, 468–479. [Google Scholar] [CrossRef]
- Huo, W.; Jifang Pei, J.; Huang, Y.; Zhang, Q.; Yang, J. A New Maritime Moving Target Detection and Tracking Method for Airborne Forward-looking Scanning Radar. Sensors 2019, 19, 1586. [Google Scholar] [CrossRef] [PubMed]
- Jung, C.Y.; Yoo, S.L. Optimal Rescue Ship Locations Using Image Processing and Clustering. Symmetry 2019, 11, 32. [Google Scholar] [CrossRef]
- Gao, H.; Li, J. Detection and tracking of a moving target using SAR images with the particle filter-based track-before-detect algorithm. Sensors 2014, 14, 10829–10845. [Google Scholar] [CrossRef] [PubMed]
- Guo, R.; Cui, J.; Jing, G.; Zhang, S.; Xing, M. Validating GEV Model for Reflection Symmetry-Based Ocean Ship Detection with Gaofen-3 Dual-Polarimetric Data. Remote Sens. 2020, 12, 1148. [Google Scholar] [CrossRef]
- Kim, S.-H.; Choi, B.-S.; Lee, J.; Lee, J.; Lee, J.; Park, J.-H.; Lee, K.; Shin, J.-K. Averaging Pixel Current Adjustment Technique for Reducing Fixed Pattern Noise in the Bolometer-Type Uncooled Infrared Image Sensor. Sensors 2019, 19, 1653. [Google Scholar] [CrossRef] [PubMed]
- International Maritime Organization. LSA-Code International Life-Saving Appliance Code (MSC.48(66)), 2019th ed.; International Maritime Organization: London, UK, 2019. [Google Scholar]
- Gooding, B. How Safe Are Today’s Life Rafts; Cruising World: Cornwall, ON, Canada, 1991. [Google Scholar]
- National Centre of Research and Development. Innovative Transport Means in the Situations Hazardous to People Life at Sea; Gdynia Maritime University: Gdynia, Poland, 2013. [Google Scholar]
- National Centre of Research and Development. Innovative Transport Means in the Situations Hazardous to People Life at Sea; Military Institute of Engineer Technology: Wroclaw, Poland, 2013. [Google Scholar]
- Allen, A.; Roth, J.C.; Maisondieu, C.; Breivik, Ø.; Forest, B. Field Determination of the Leeway of Drifting Objects; Norwegian Meteorological Institute: Oslo, Norway, 2010. [Google Scholar]
- Breivik, Ø.; Allen, A.A. An Operational Search and Rescue Model for the Norwegian Sea and the North Sea. J. Mar. Syst. 2007, 69, 99–113. [Google Scholar] [CrossRef]
- Burciu, Z.; Grabski, F. The experimental and theoretical study on the reliability of life rafts. Reliab. Eng. Syst. Saf. 2011, 96, 1456–1461. [Google Scholar] [CrossRef]
- Frost, J.; Stone, L. Review of Search Theory: Advances and Applications to Search and Rescue Decision Support; USCG Research and Development Center: New London, CT, USA, 2001. [Google Scholar]
- Allen, A.A.; Plourde, J.V. Review of Leeway: Field Experiments and Implementation; U.S. Coast Guard Research and Development Center: New London, CT, USA, 1999. [Google Scholar]
- International Maritime Organisation. International Aeronautical and Maritime Search and Rescue Manual, Volume II Mission Co-ordination, 2019th ed.; International Maritime Organisation: London, UK, 2019. [Google Scholar]
- Aronica1, S.; Benvegna, F.; Cossentino, M.; Gaglio, S.; Langiu, A.; Lodato, C.; Lopes, S.; Maniscalco, U.; Sangiorgi, P. An agent-based system for maritime search and rescue operations. In Proceedings of the 11th Workshop on Objects to Agents, WOA, Rimini, Italy, 5−7 September 2010. [Google Scholar]
- Futch, V.; Allen, A. Search and Rescue Applications: On the Need to Improve Ocean Observing Data Systems in Offshore or Remote Locations. Front. Mar. Sci. 2019. [Google Scholar] [CrossRef]
- Scientific Research Committee. System of Optical Search for Survivors at Sea; Internal Report of Gdynia Maritime University: Gdynia, Poland, 2002. [Google Scholar]
- Turner, A.; Lewandowski, M.; Parker, J.; McClay, T.; Havey, A. Recommendations for the U.S. Coast Guard Survival Prediction Tool; Acquisition Directorate Research and Development Centre: New London, CT, USA, 2009. [Google Scholar]
- Chaturvedi, S.K. Study of synthetic aperture radar and automatic identification system for ship target detection. J. Ocean Eng. Sci. 2019, 4, 173–182. [Google Scholar] [CrossRef]
- Yim, J.-B.; Kim, W.-S. Design of Passive-Type Radar Reflector. Int. J. Navig. Port Res. 2003, 27, 267–272. [Google Scholar] [CrossRef]
- Harzheim, T. Mixed Frequency Single Receiver Architectures and Calibration Procedures for Linear and Non-Linear Vector Network Analysis. Ph.D. Thesis, University of Luxembourg, Luxembourg, 2019. [Google Scholar]


| W [NM] | C | Z | POD | POS | POS(PIW) | |||
|---|---|---|---|---|---|---|---|---|
| 5 °C | 10 °C | 15 °C | 20 °C | |||||
| 1 | 0.3 | 30 | 0.259 | 0.256 | 0.122 | 0.157 | 0.195 | 0.205 |
| 2 | 0.6 | 60 | 0.451 | 0.446 | 0.214 | 0.276 | 0.344 | 0.362 |
| 3 | 0.9 | 90 | 0.593 | 0.587 | 0.282 | 0.363 | 0.452 | 0.475 |
© 2020 by the authors. Licensee MDPI, Basel, Switzerland. This article is an open access article distributed under the terms and conditions of the Creative Commons Attribution (CC BY) license (http://creativecommons.org/licenses/by/4.0/).
Share and Cite
Burciu, Z.; Abramowicz-Gerigk, T.; Przybyl, W.; Plebankiewicz, I.; Januszko, A. The Impact of the Improved Search Object Detection on the SAR Action Success Probability in Maritime Transport. Sensors 2020, 20, 3962. https://doi.org/10.3390/s20143962
Burciu Z, Abramowicz-Gerigk T, Przybyl W, Plebankiewicz I, Januszko A. The Impact of the Improved Search Object Detection on the SAR Action Success Probability in Maritime Transport. Sensors. 2020; 20(14):3962. https://doi.org/10.3390/s20143962
Chicago/Turabian StyleBurciu, Zbigniew, Teresa Abramowicz-Gerigk, Wojciech Przybyl, Ireneusz Plebankiewicz, and Adam Januszko. 2020. "The Impact of the Improved Search Object Detection on the SAR Action Success Probability in Maritime Transport" Sensors 20, no. 14: 3962. https://doi.org/10.3390/s20143962
APA StyleBurciu, Z., Abramowicz-Gerigk, T., Przybyl, W., Plebankiewicz, I., & Januszko, A. (2020). The Impact of the Improved Search Object Detection on the SAR Action Success Probability in Maritime Transport. Sensors, 20(14), 3962. https://doi.org/10.3390/s20143962