Enhancing the Sensing Performance of Zigzag Graphene Nanoribbon to Detect NO, NO2, and NH3 Gases


Abstract
1. Introduction
2. Computational Method
3. Results
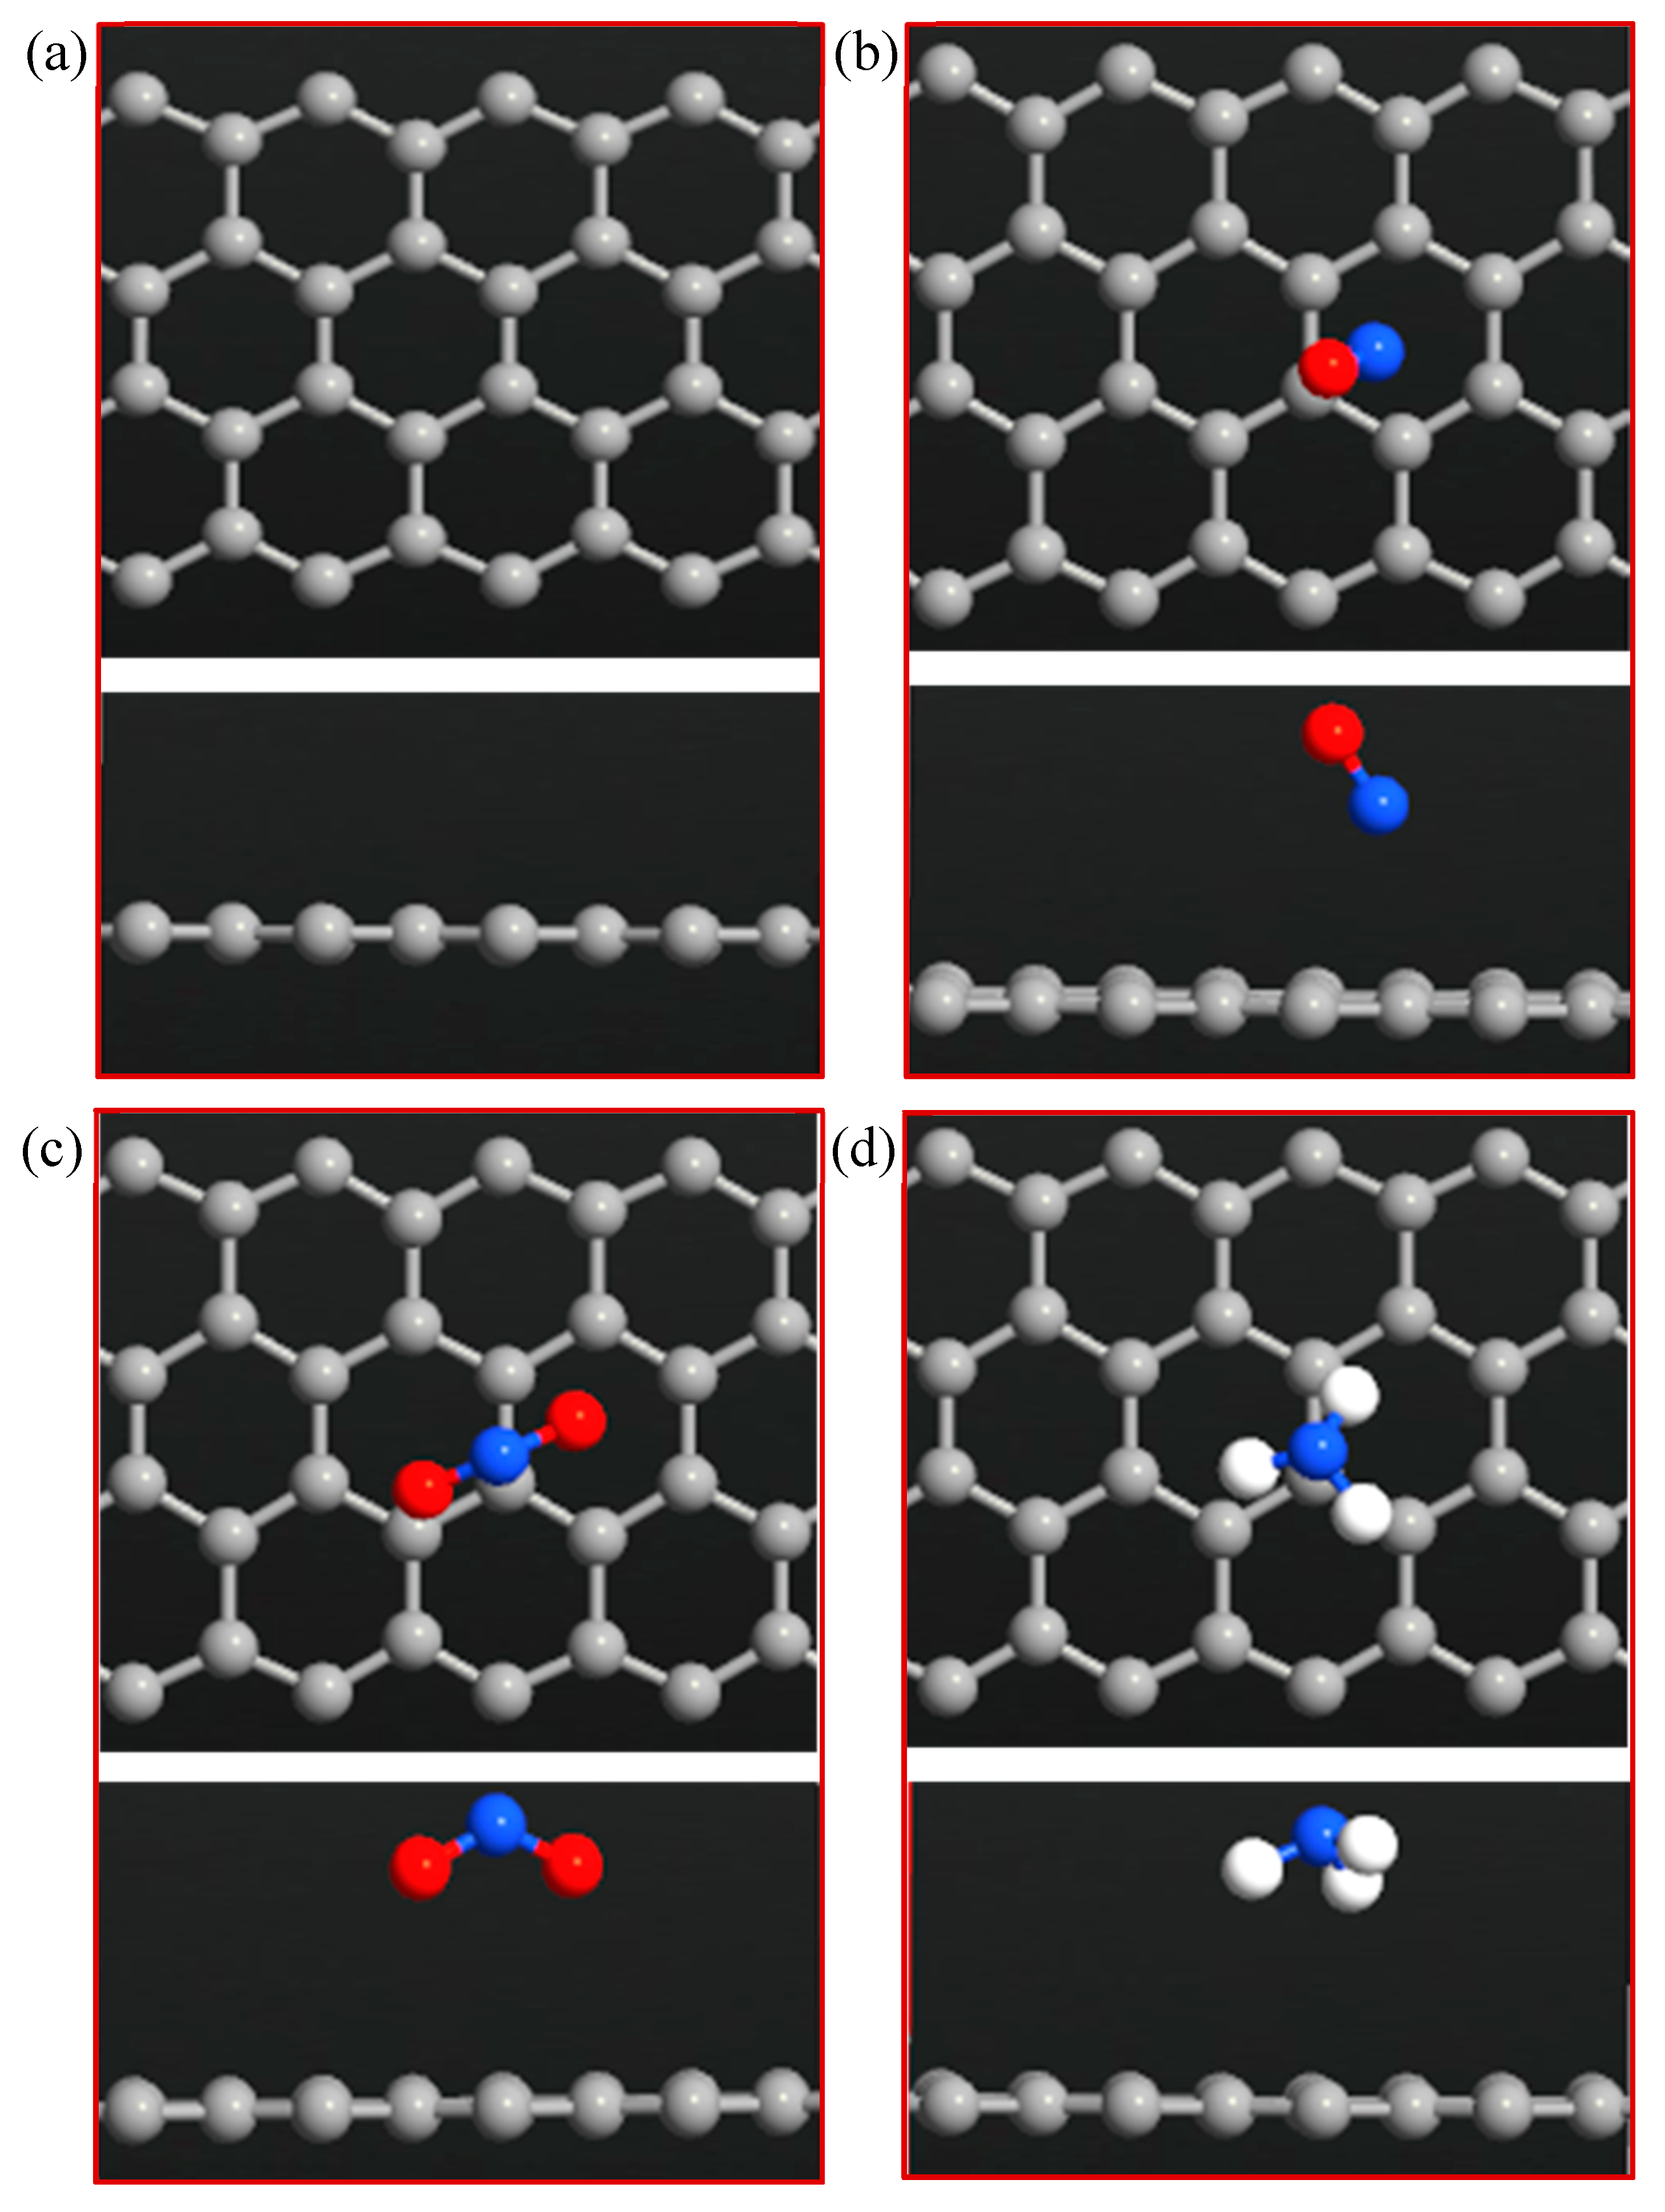
3.1. ZGNR System
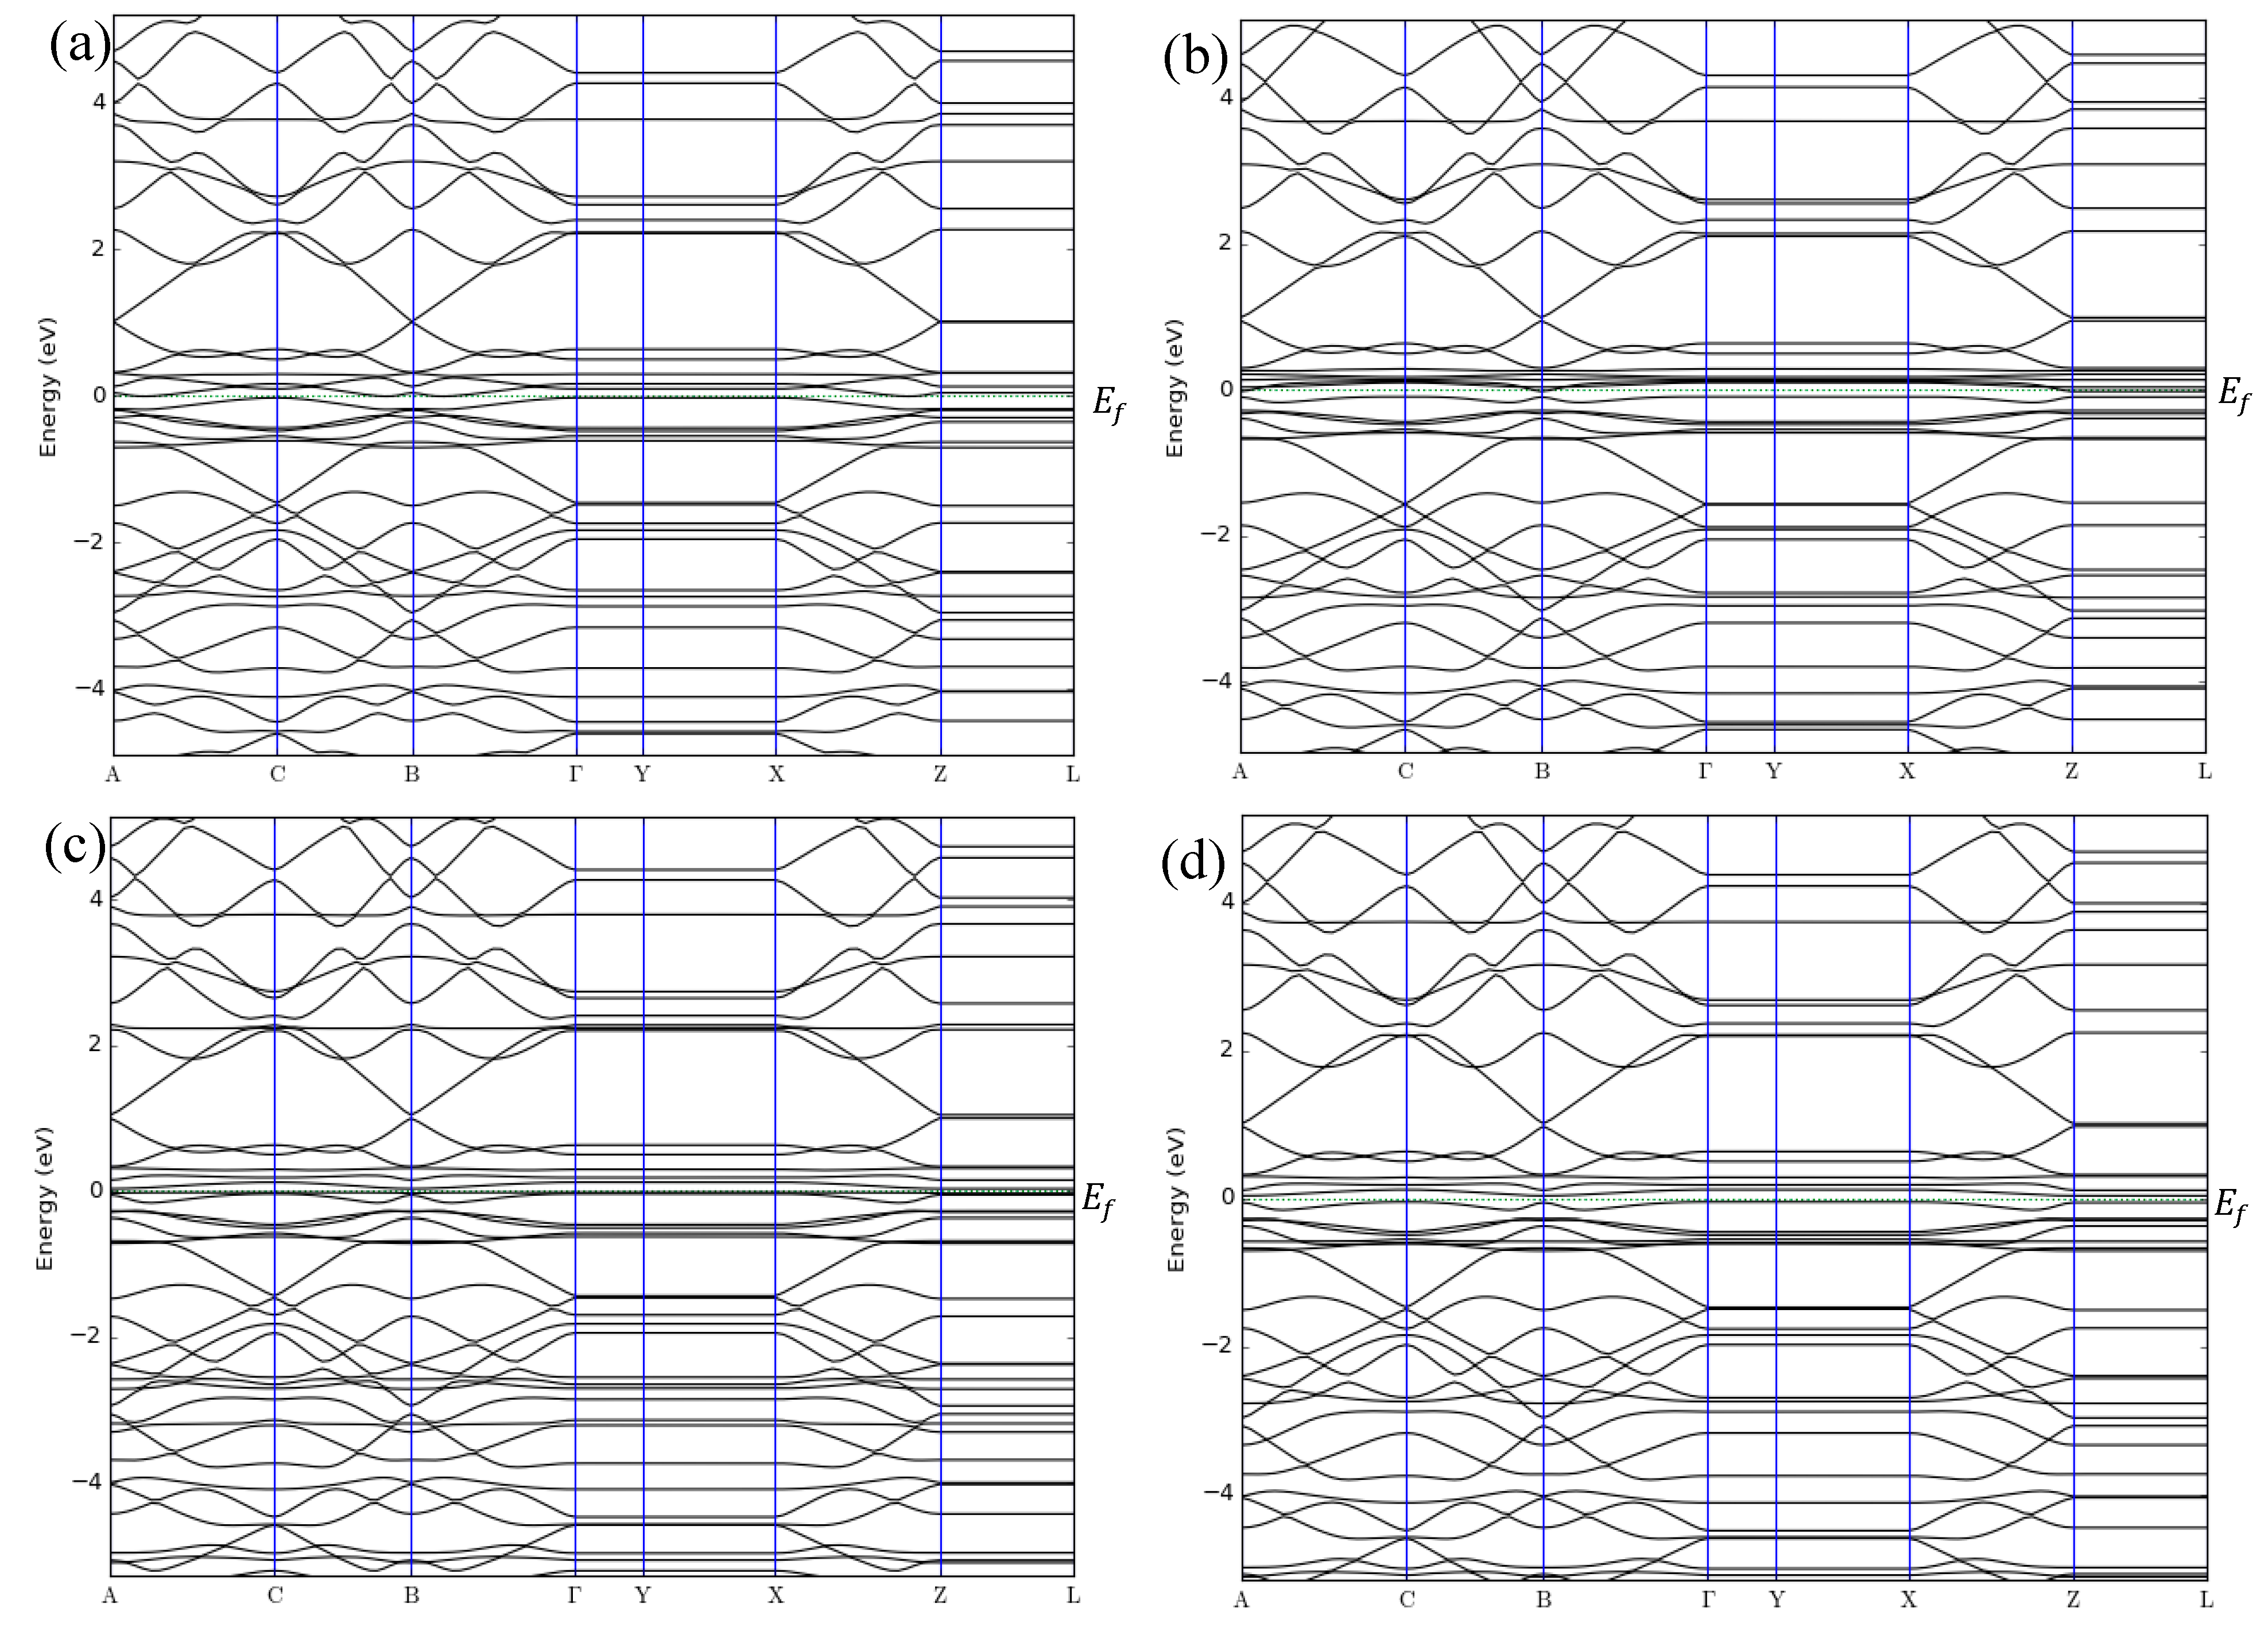
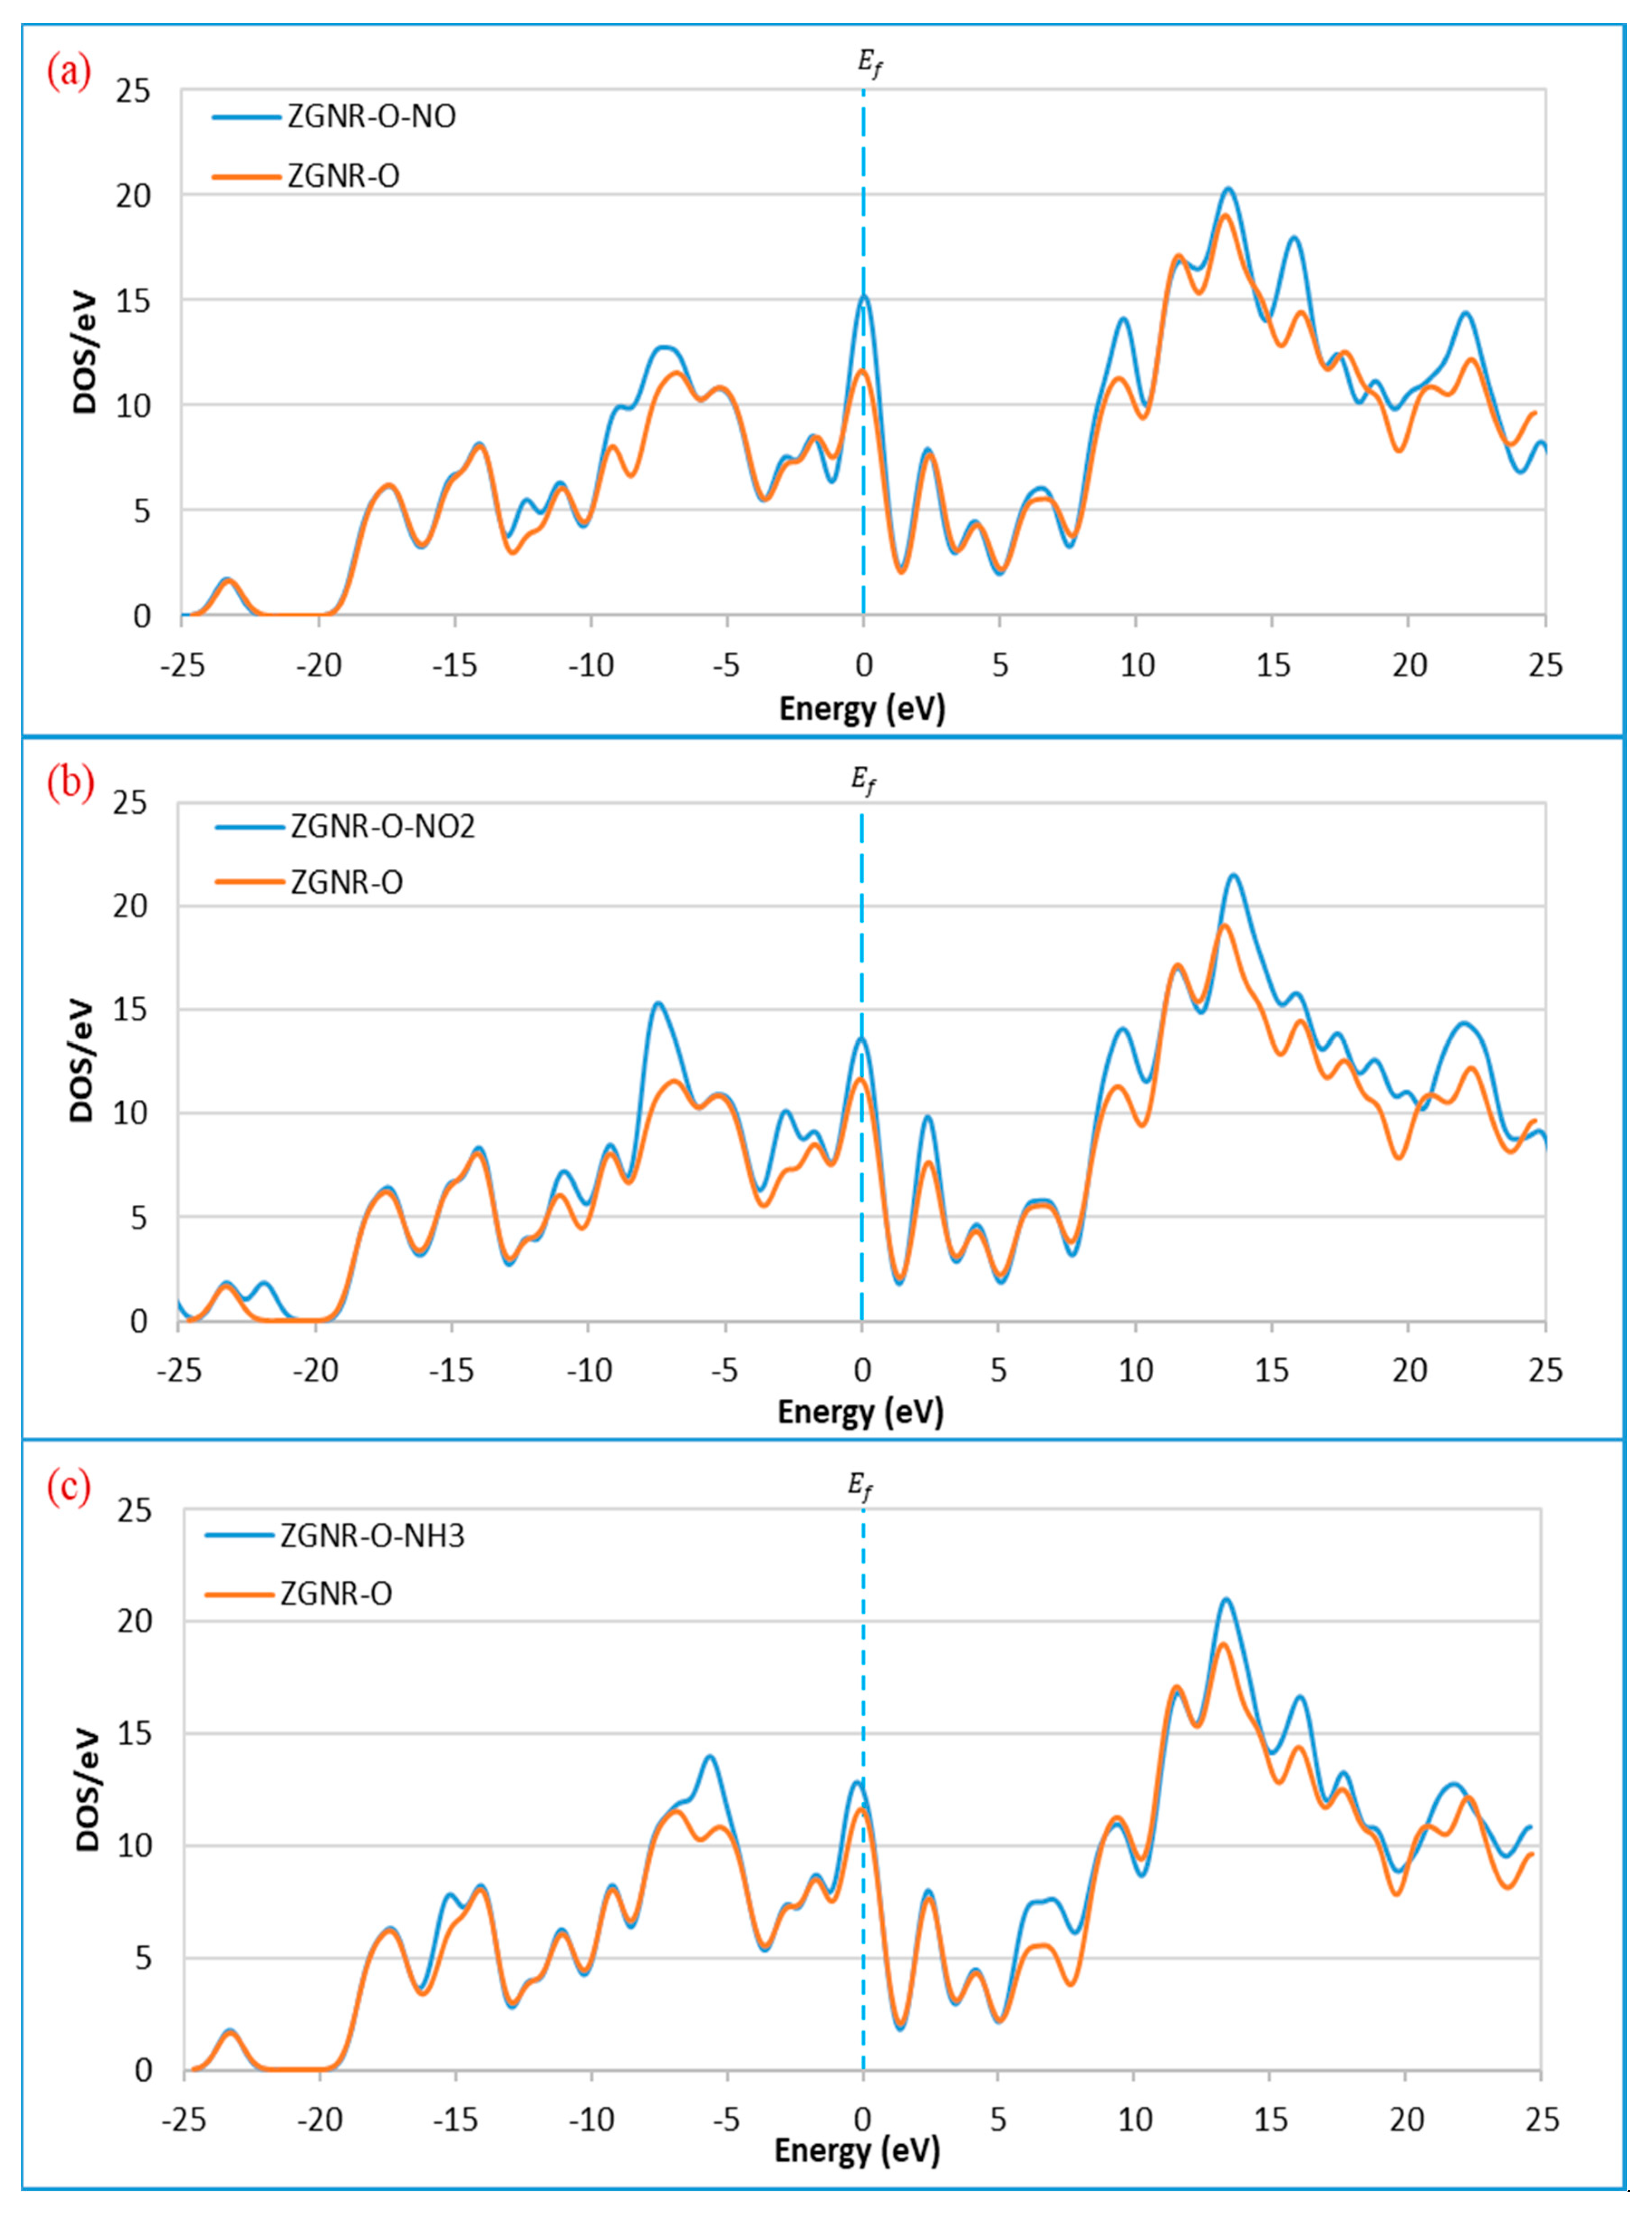
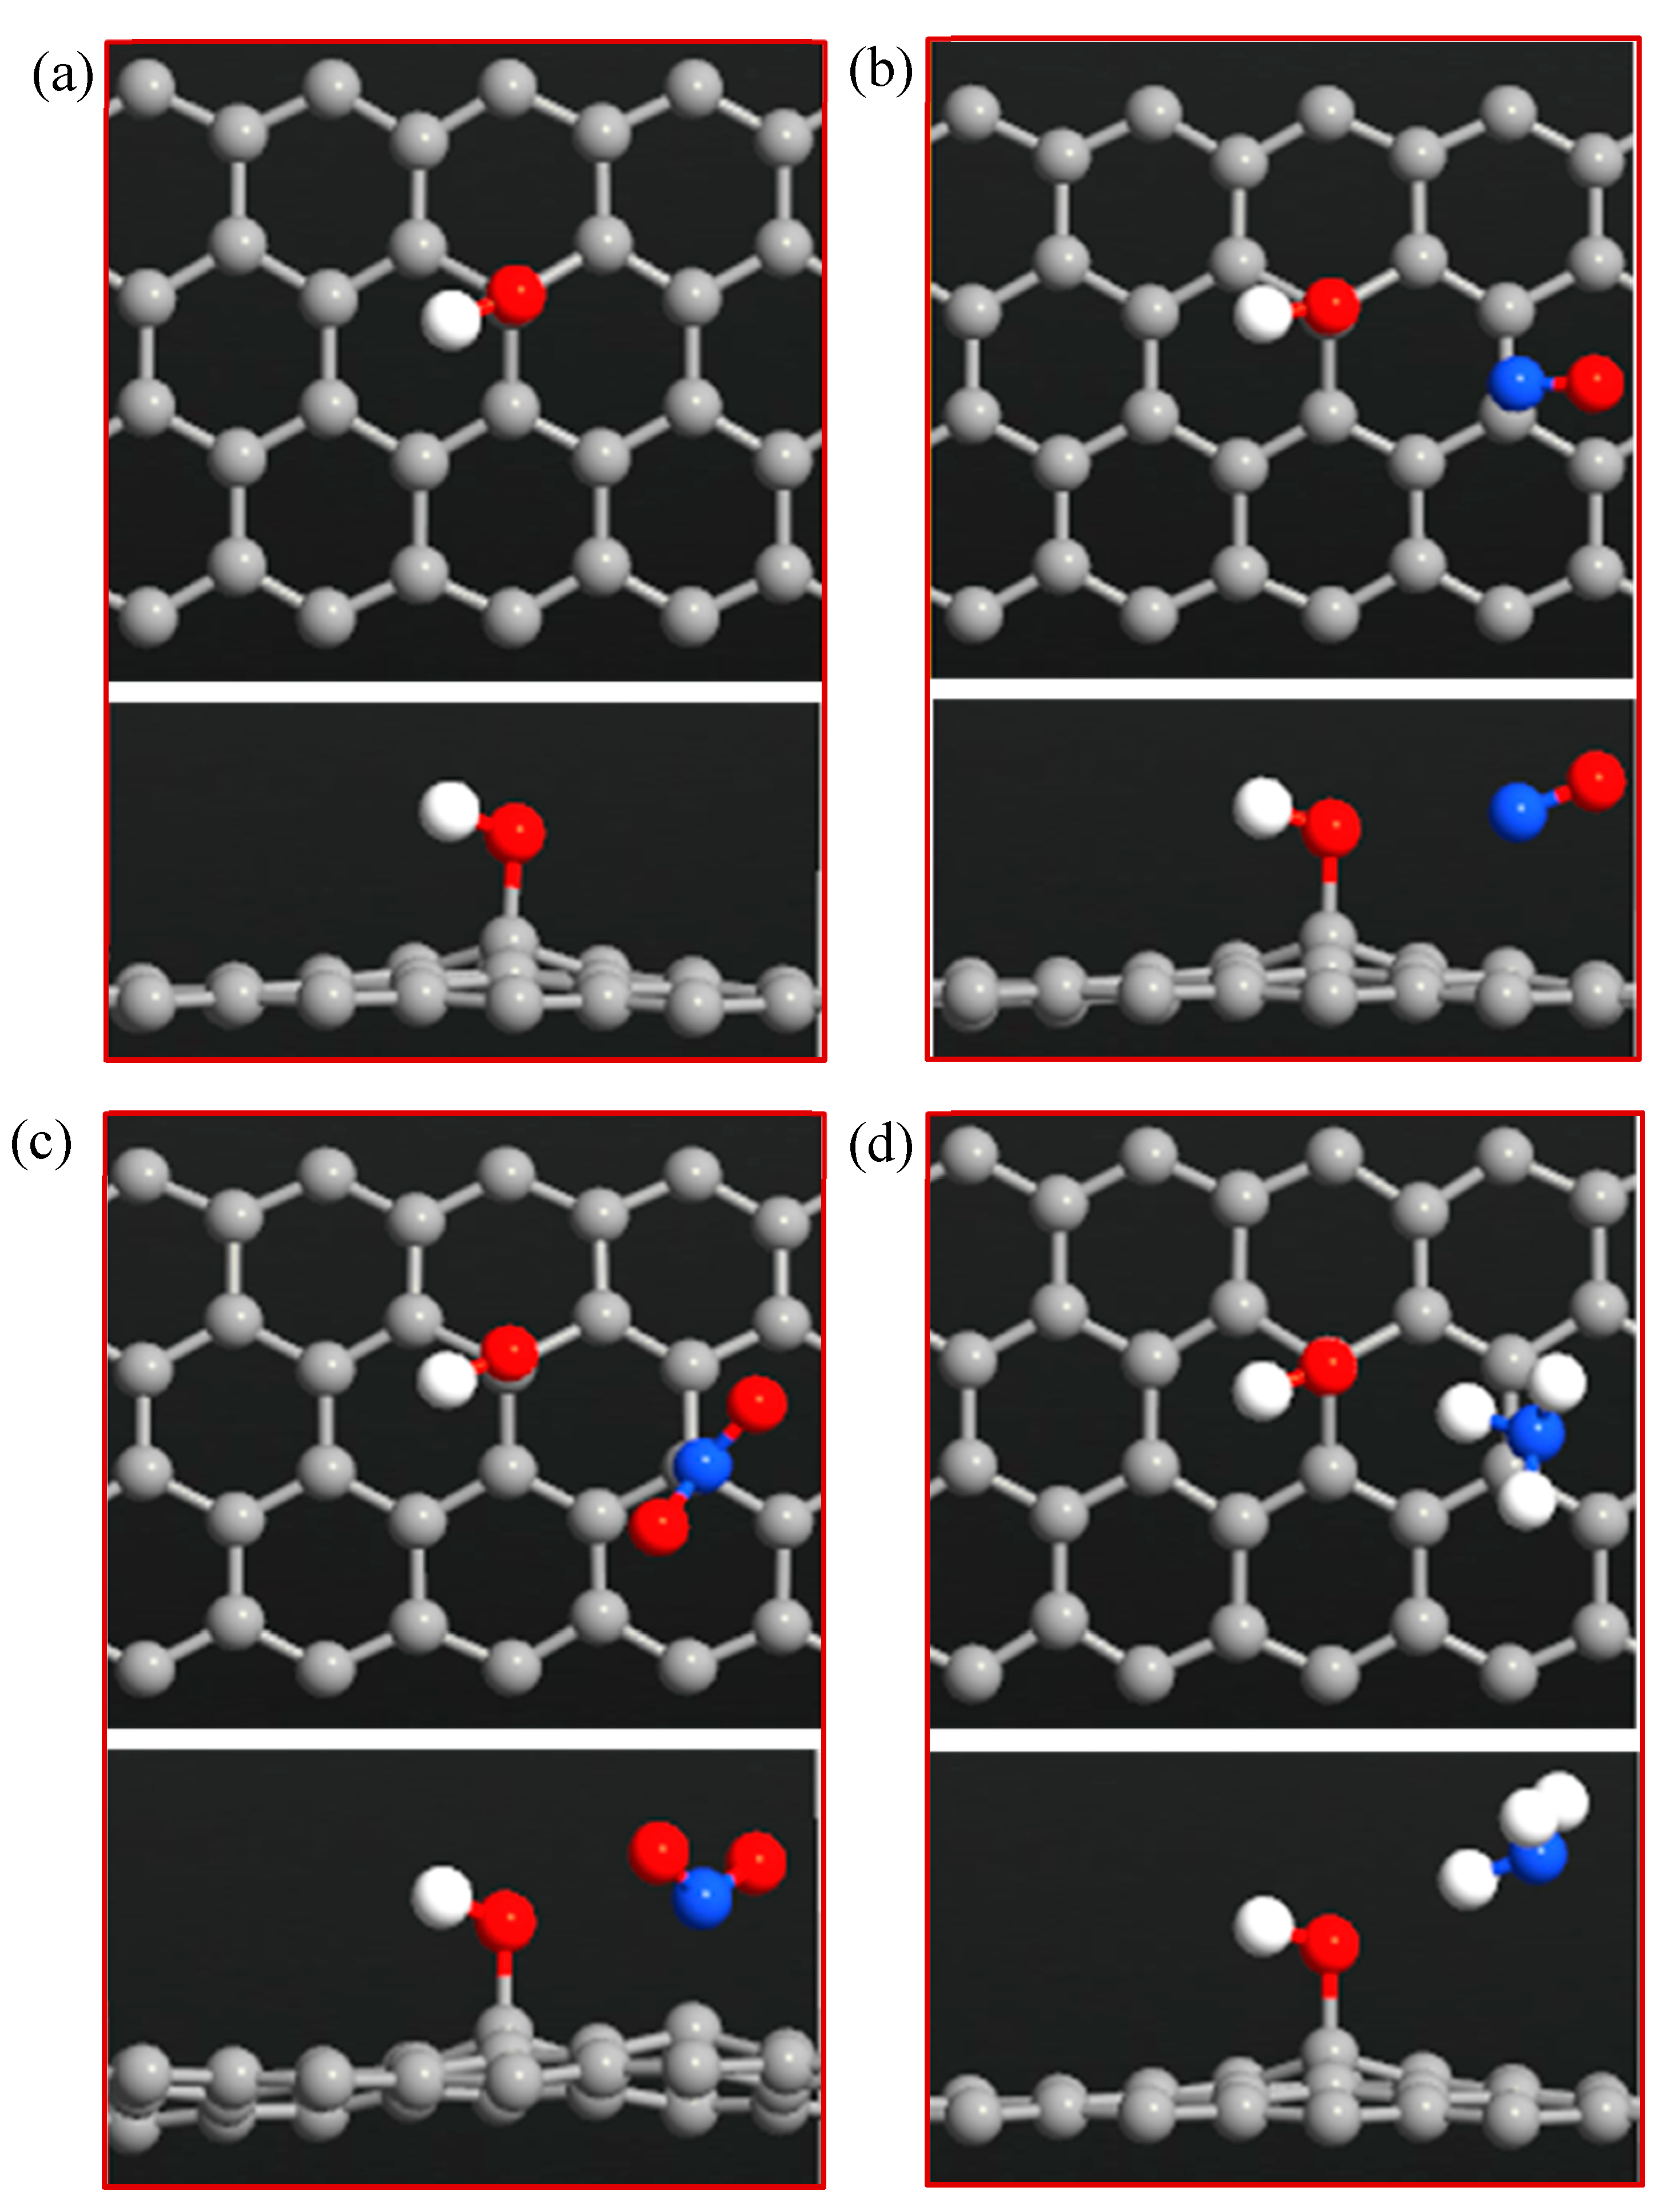
3.2. ZGNR-O System
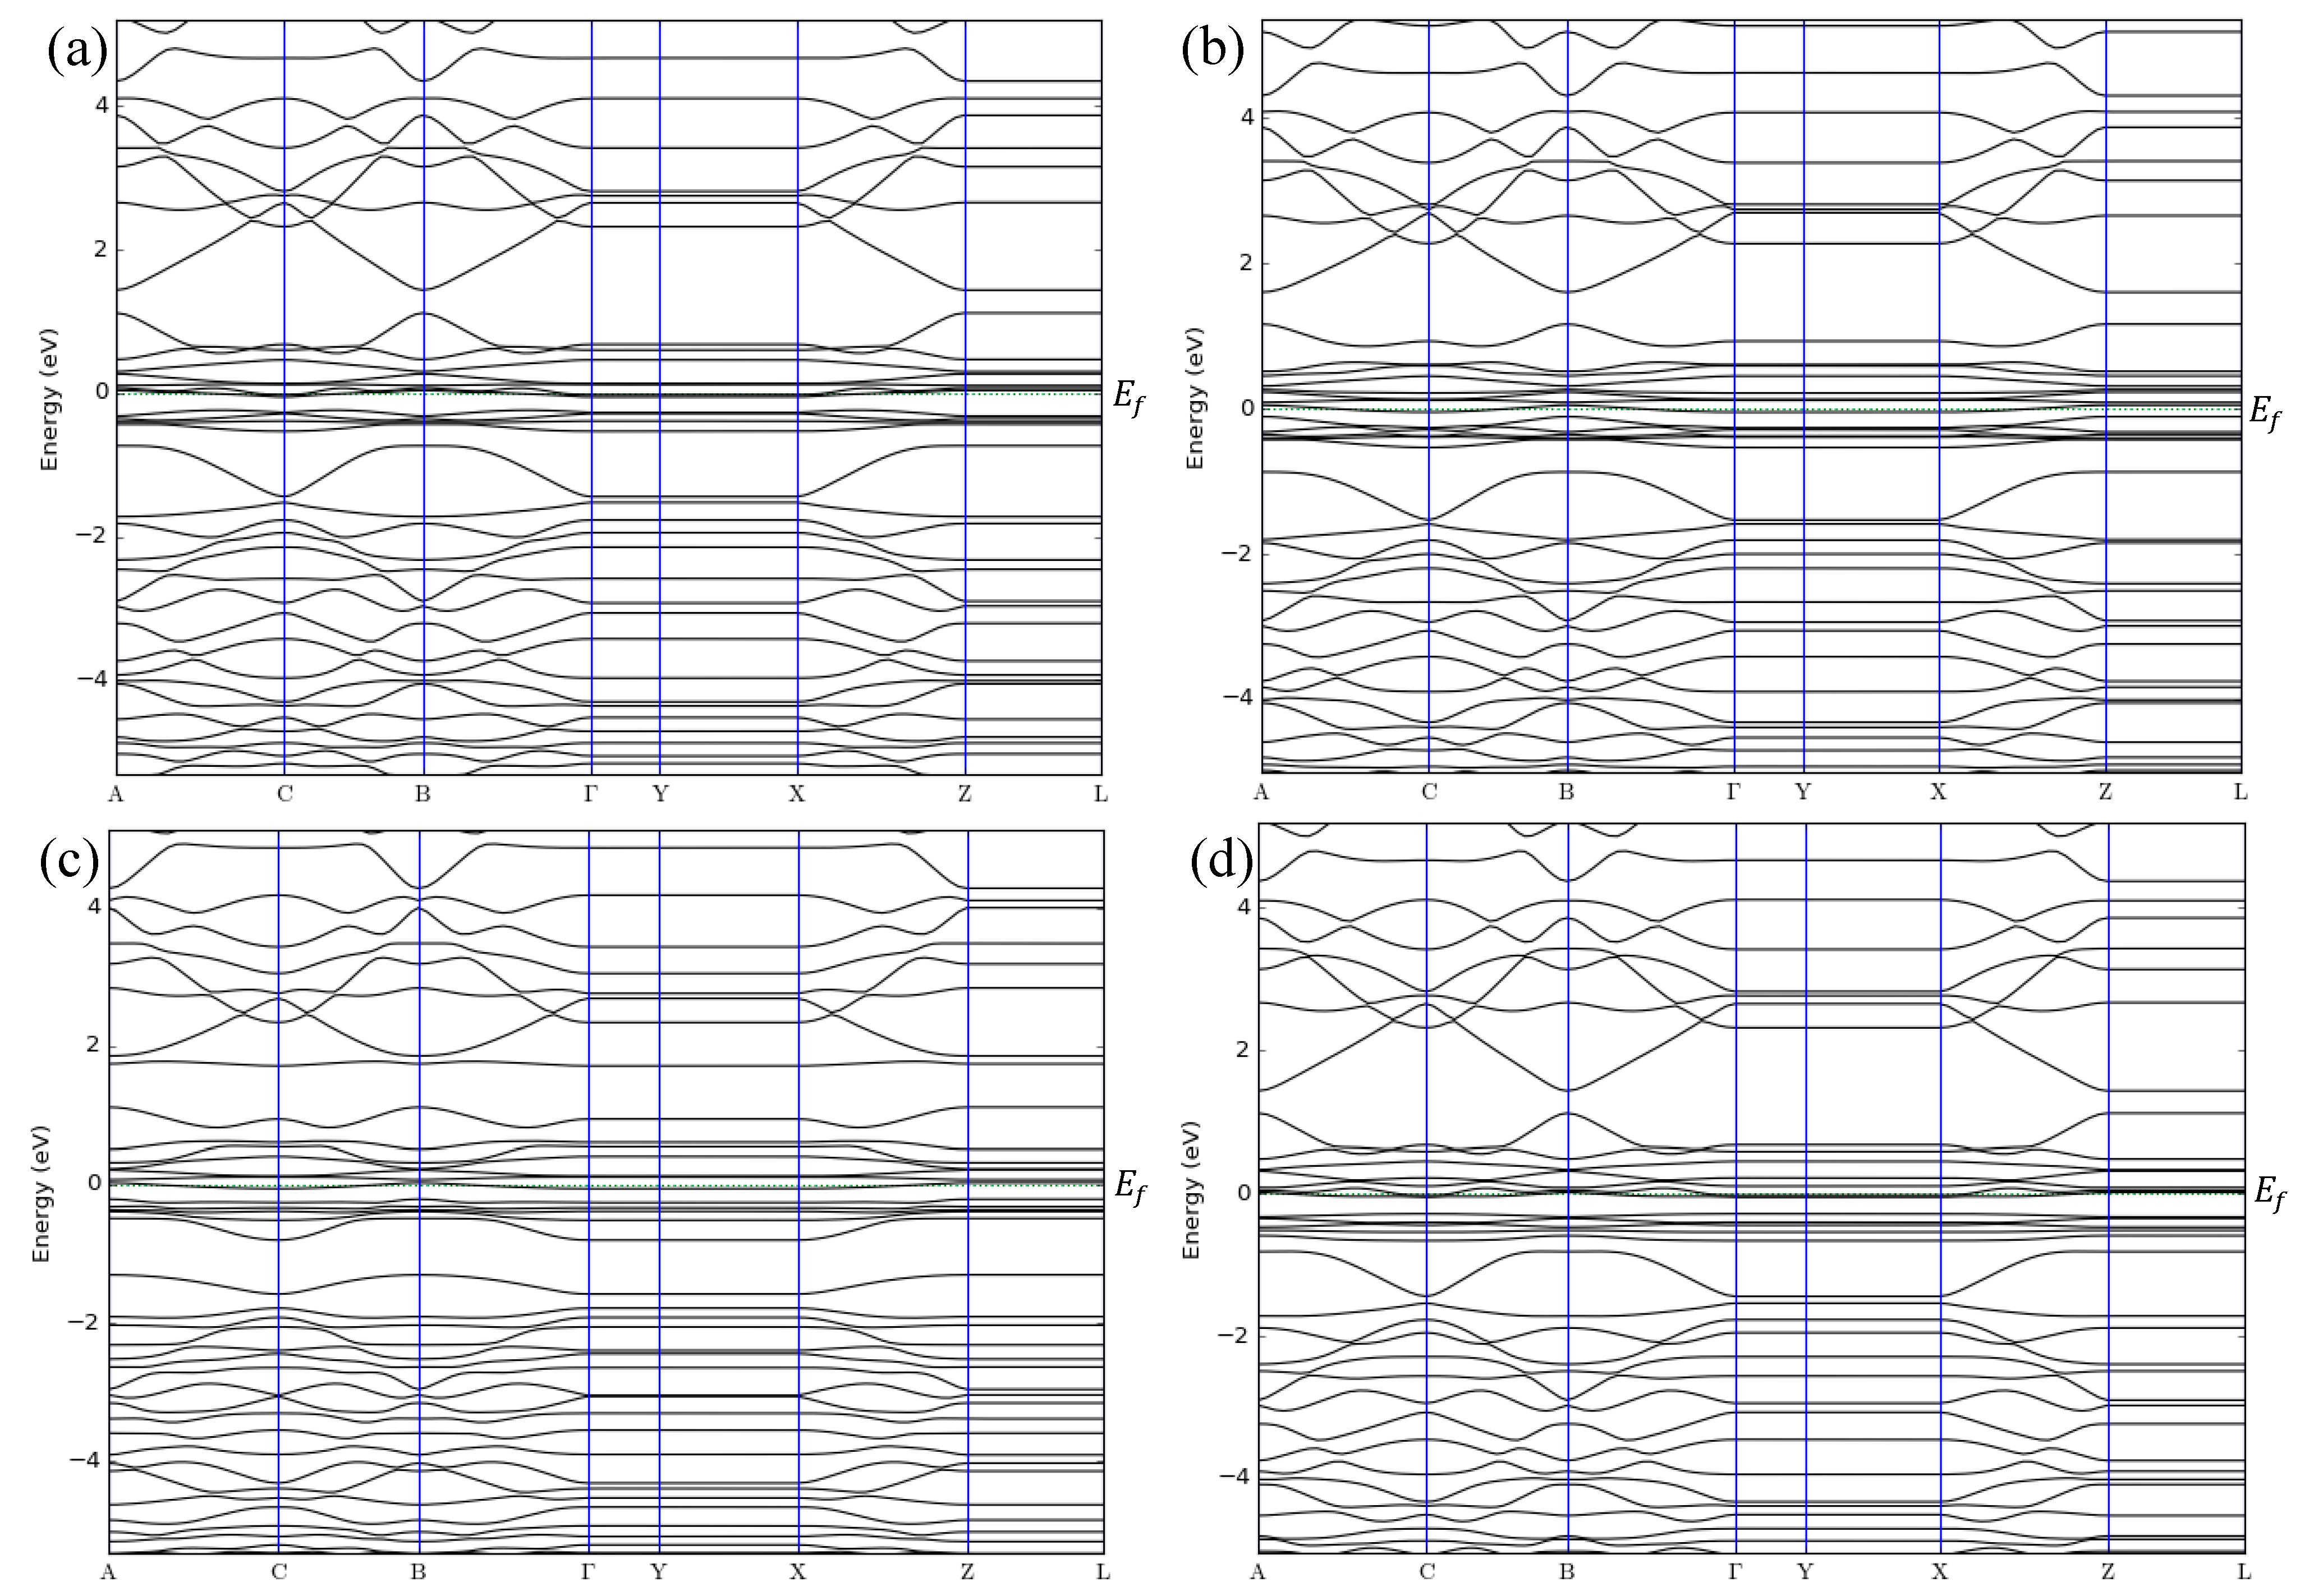
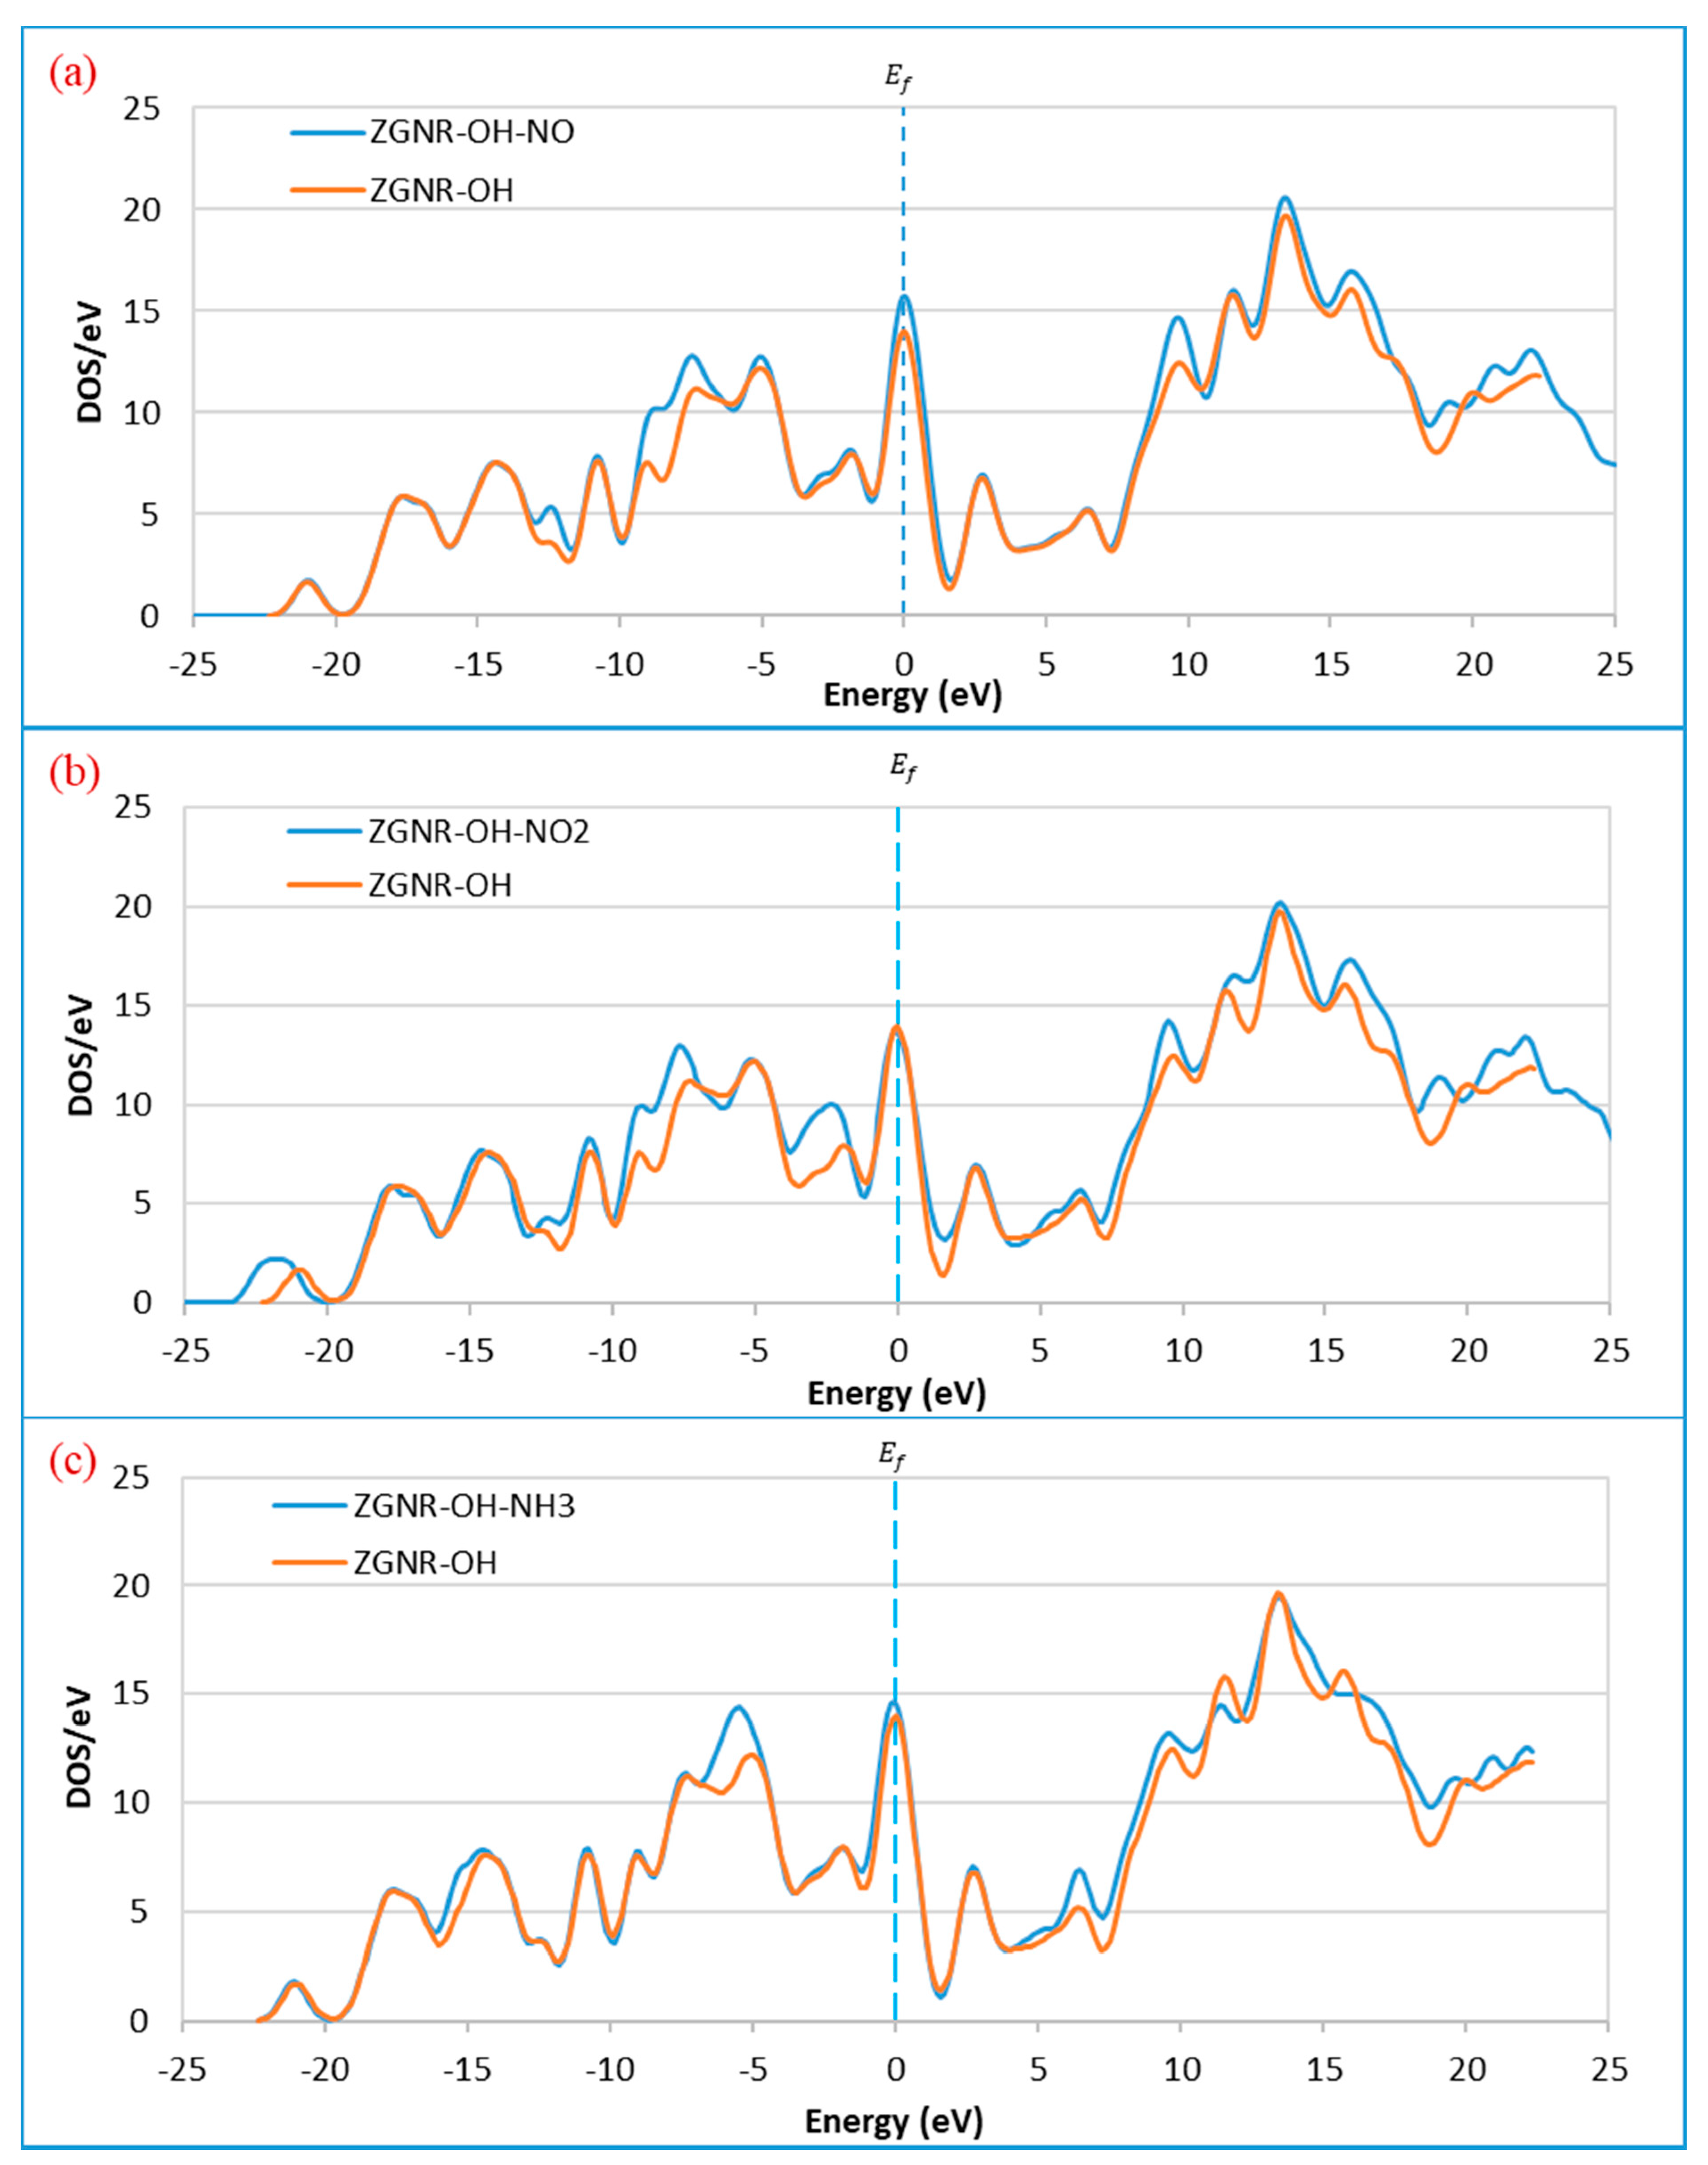
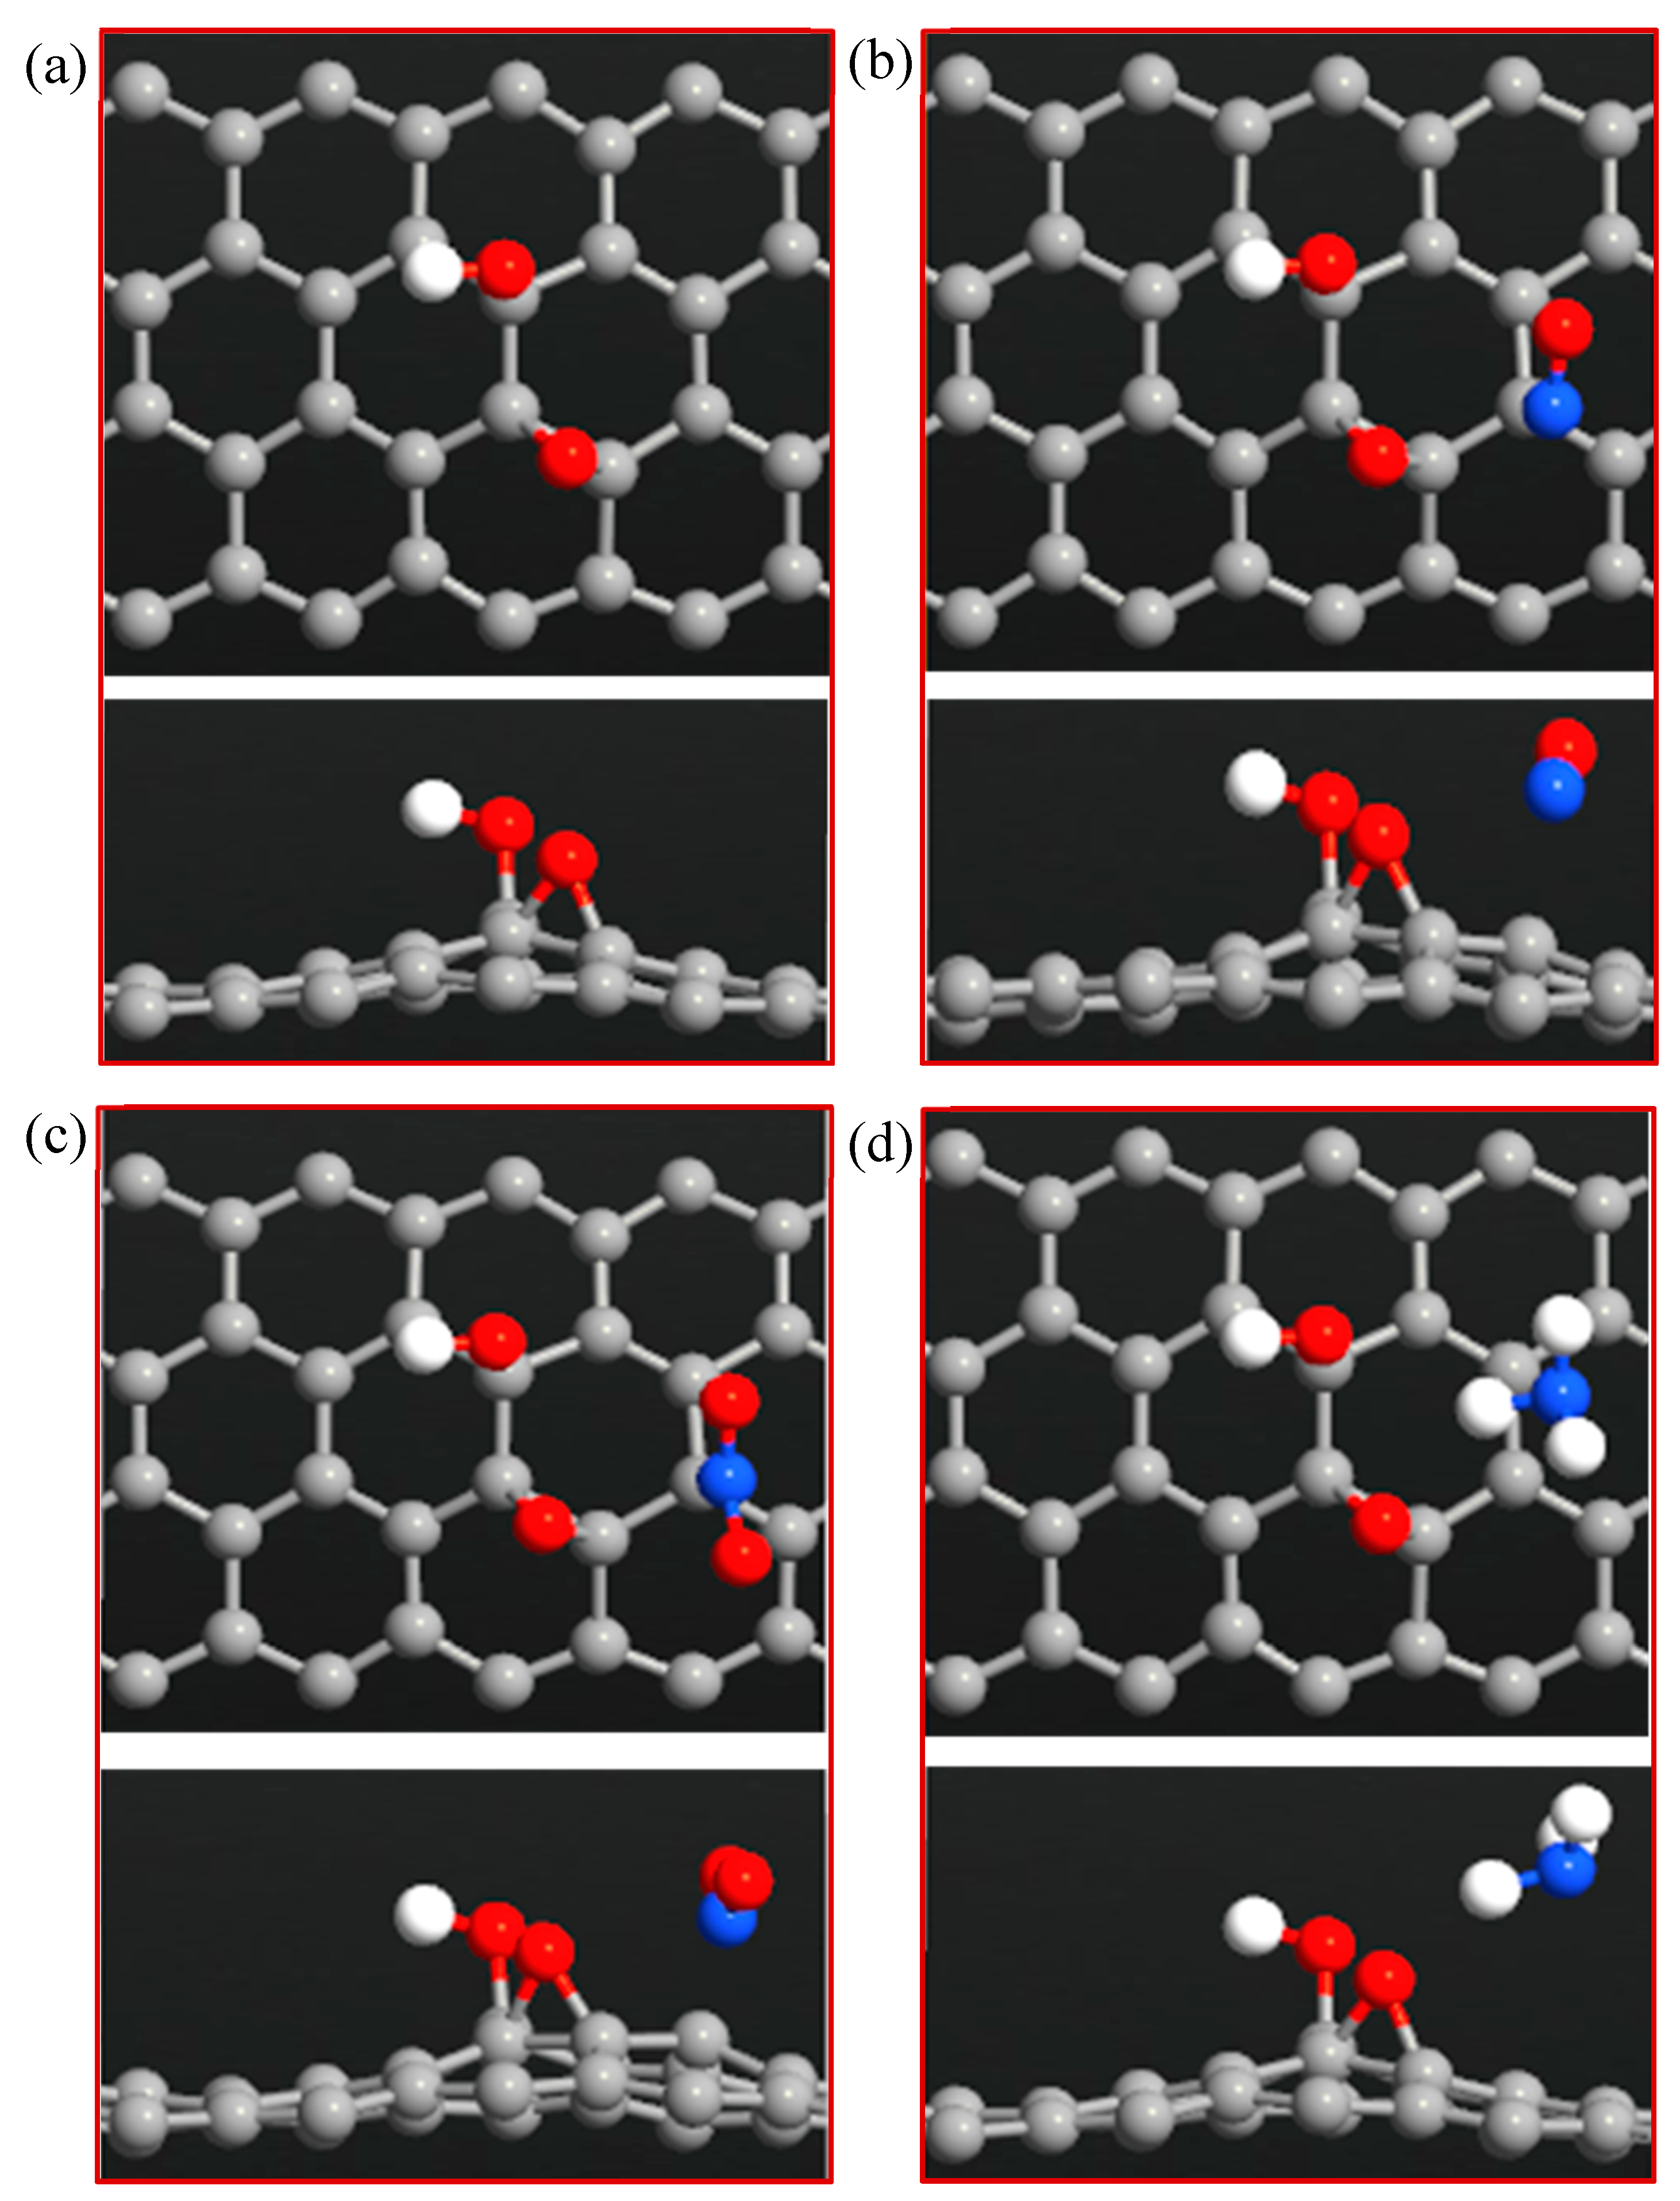
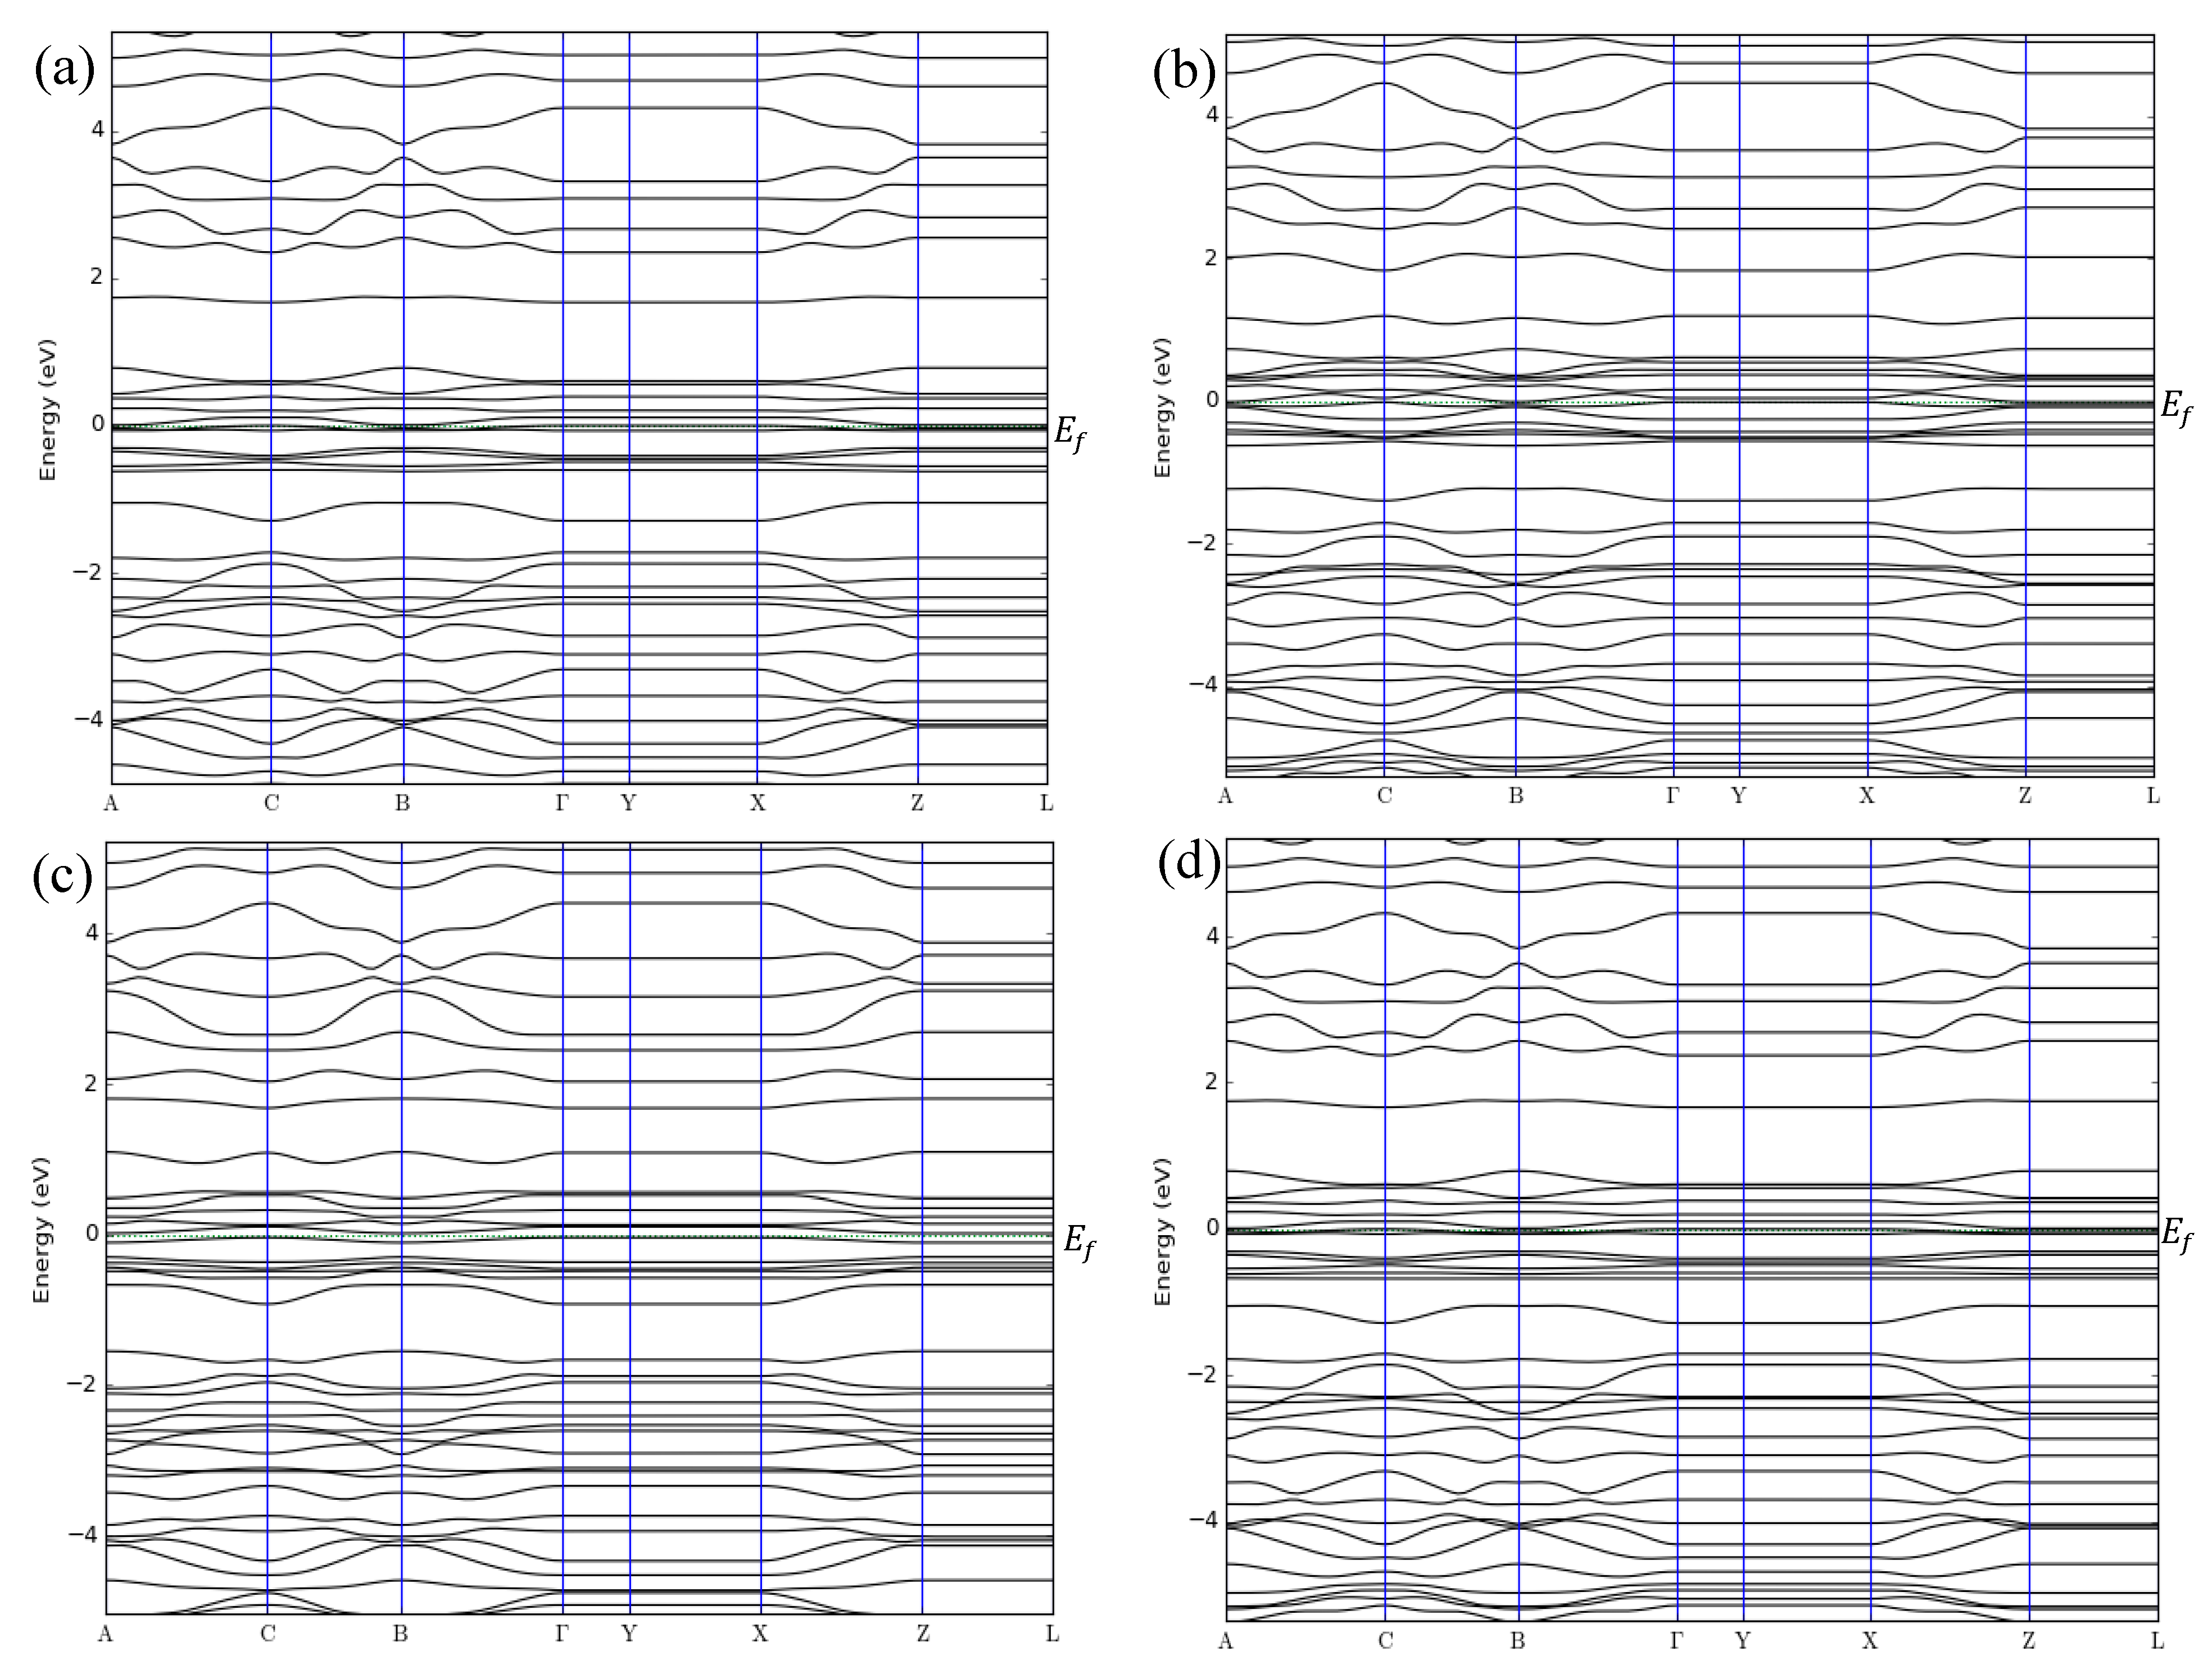
3.3. ZGNR-OH System
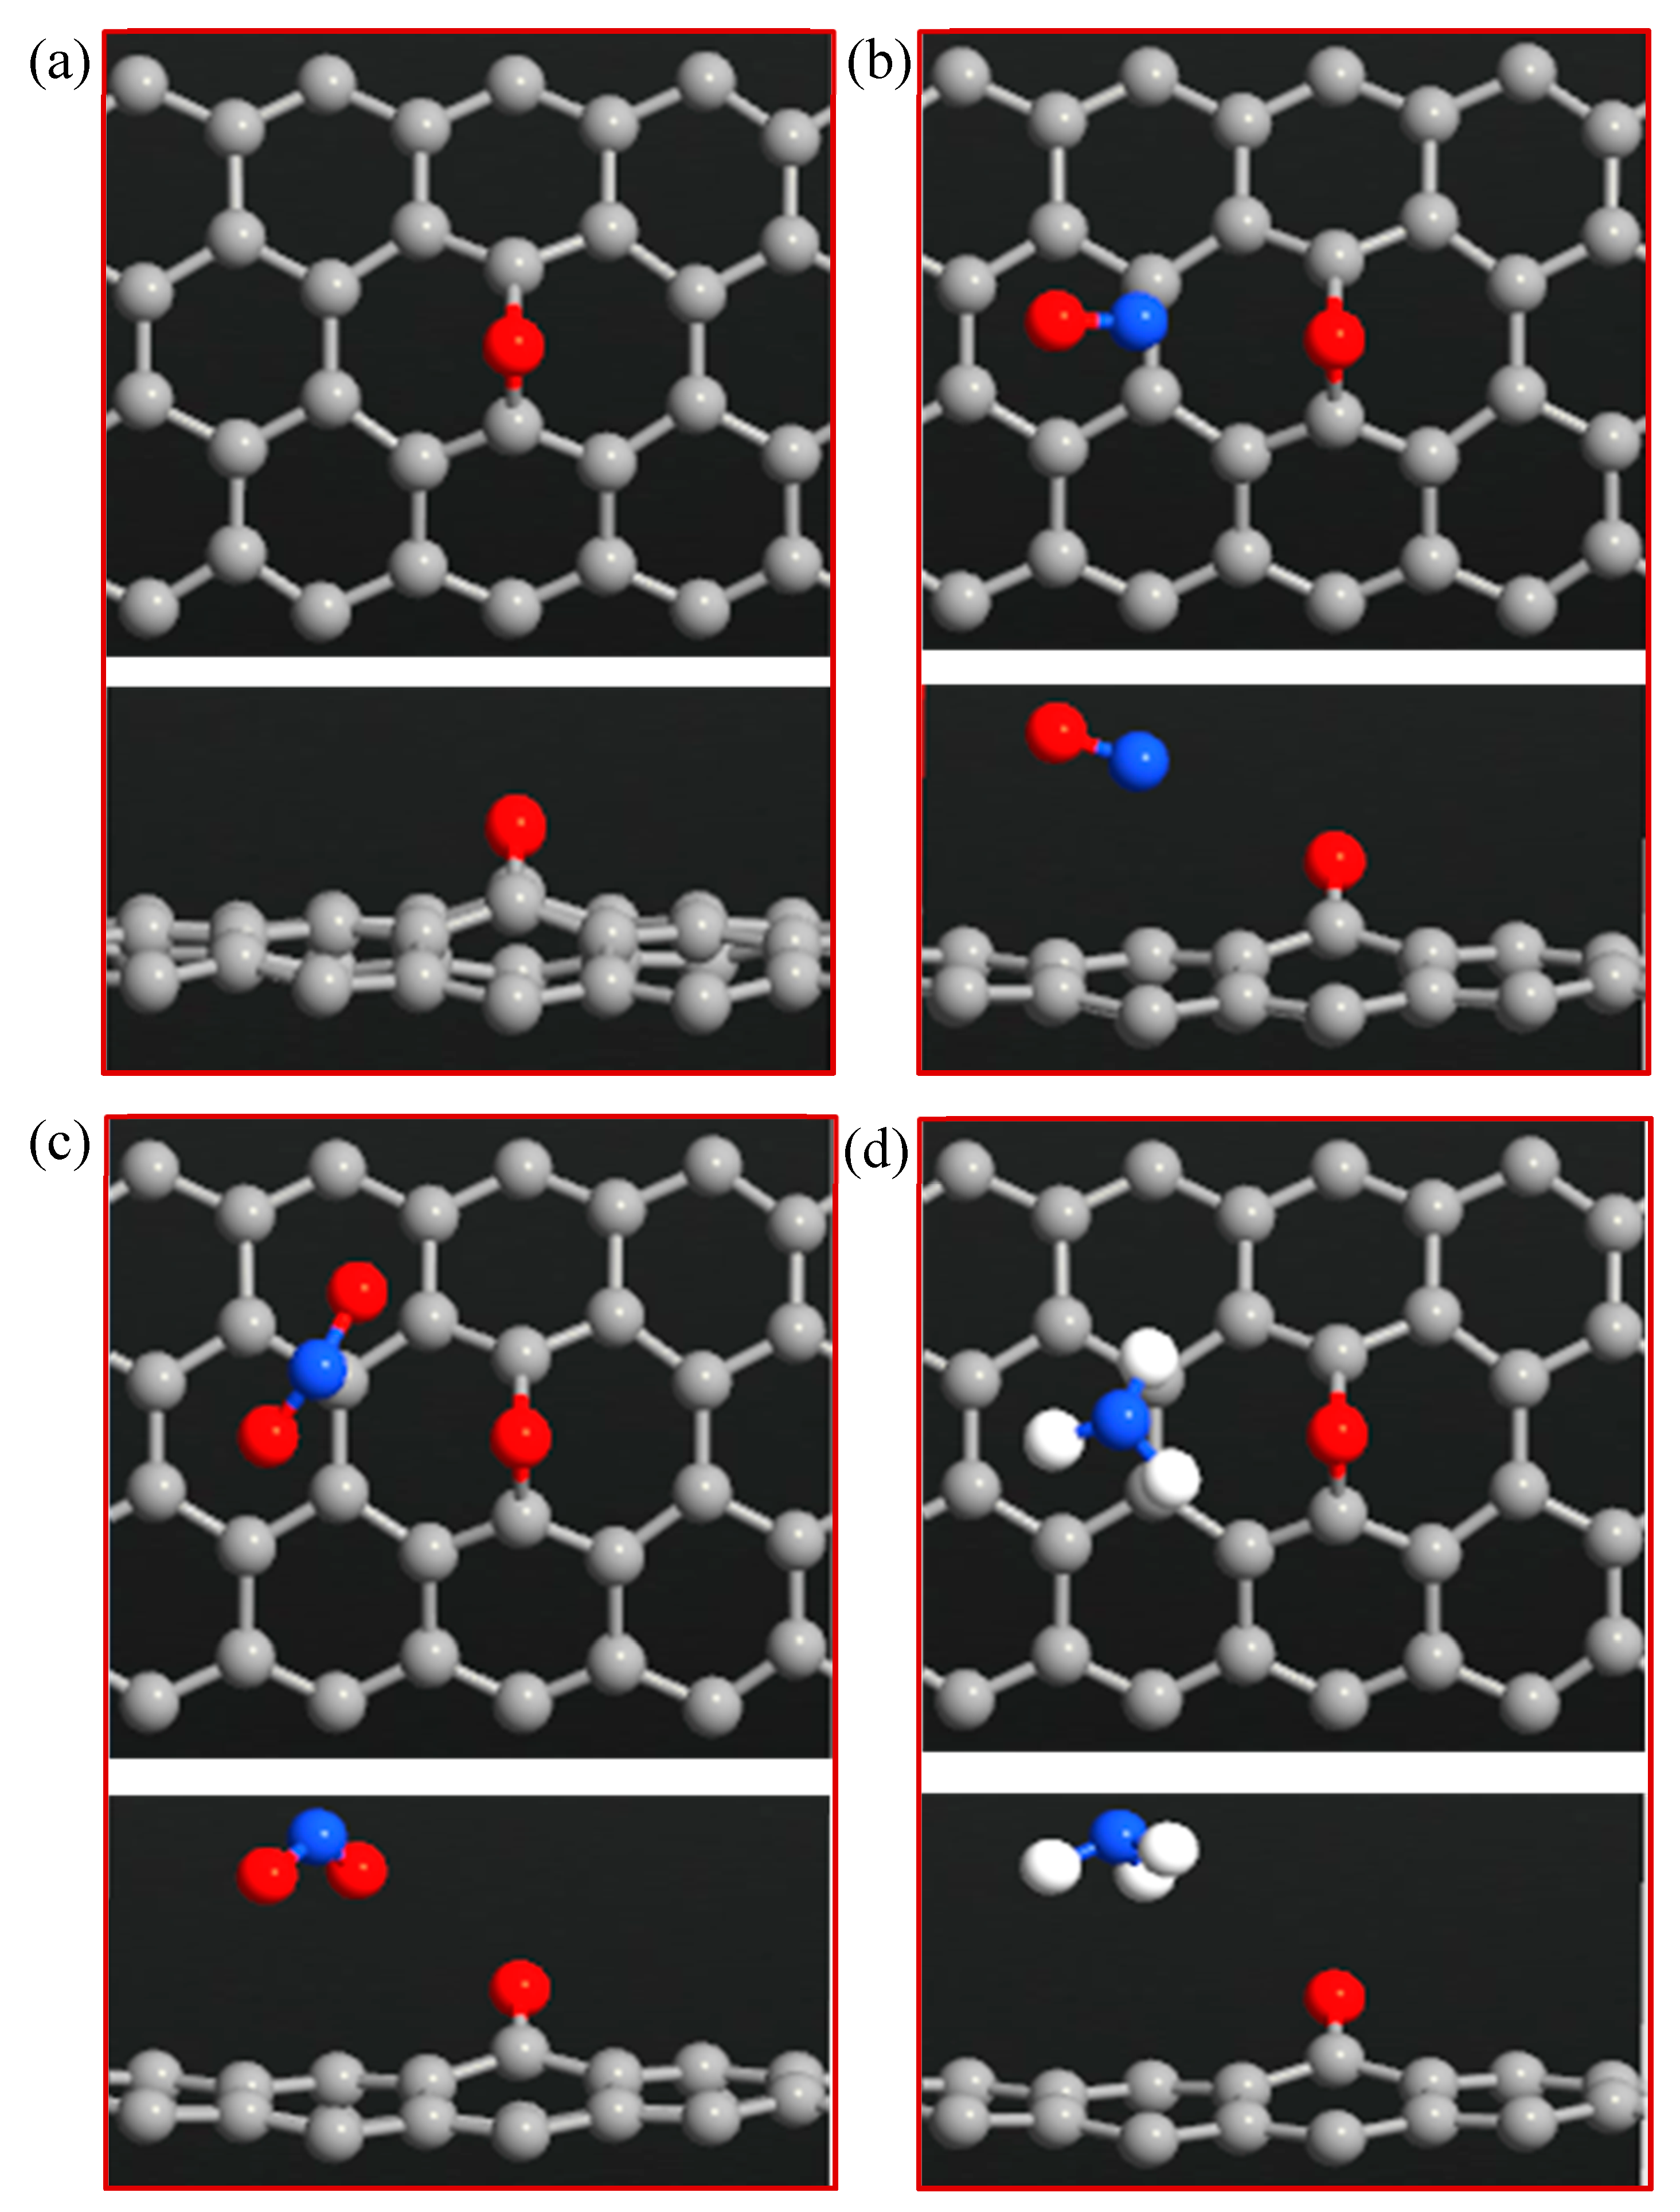
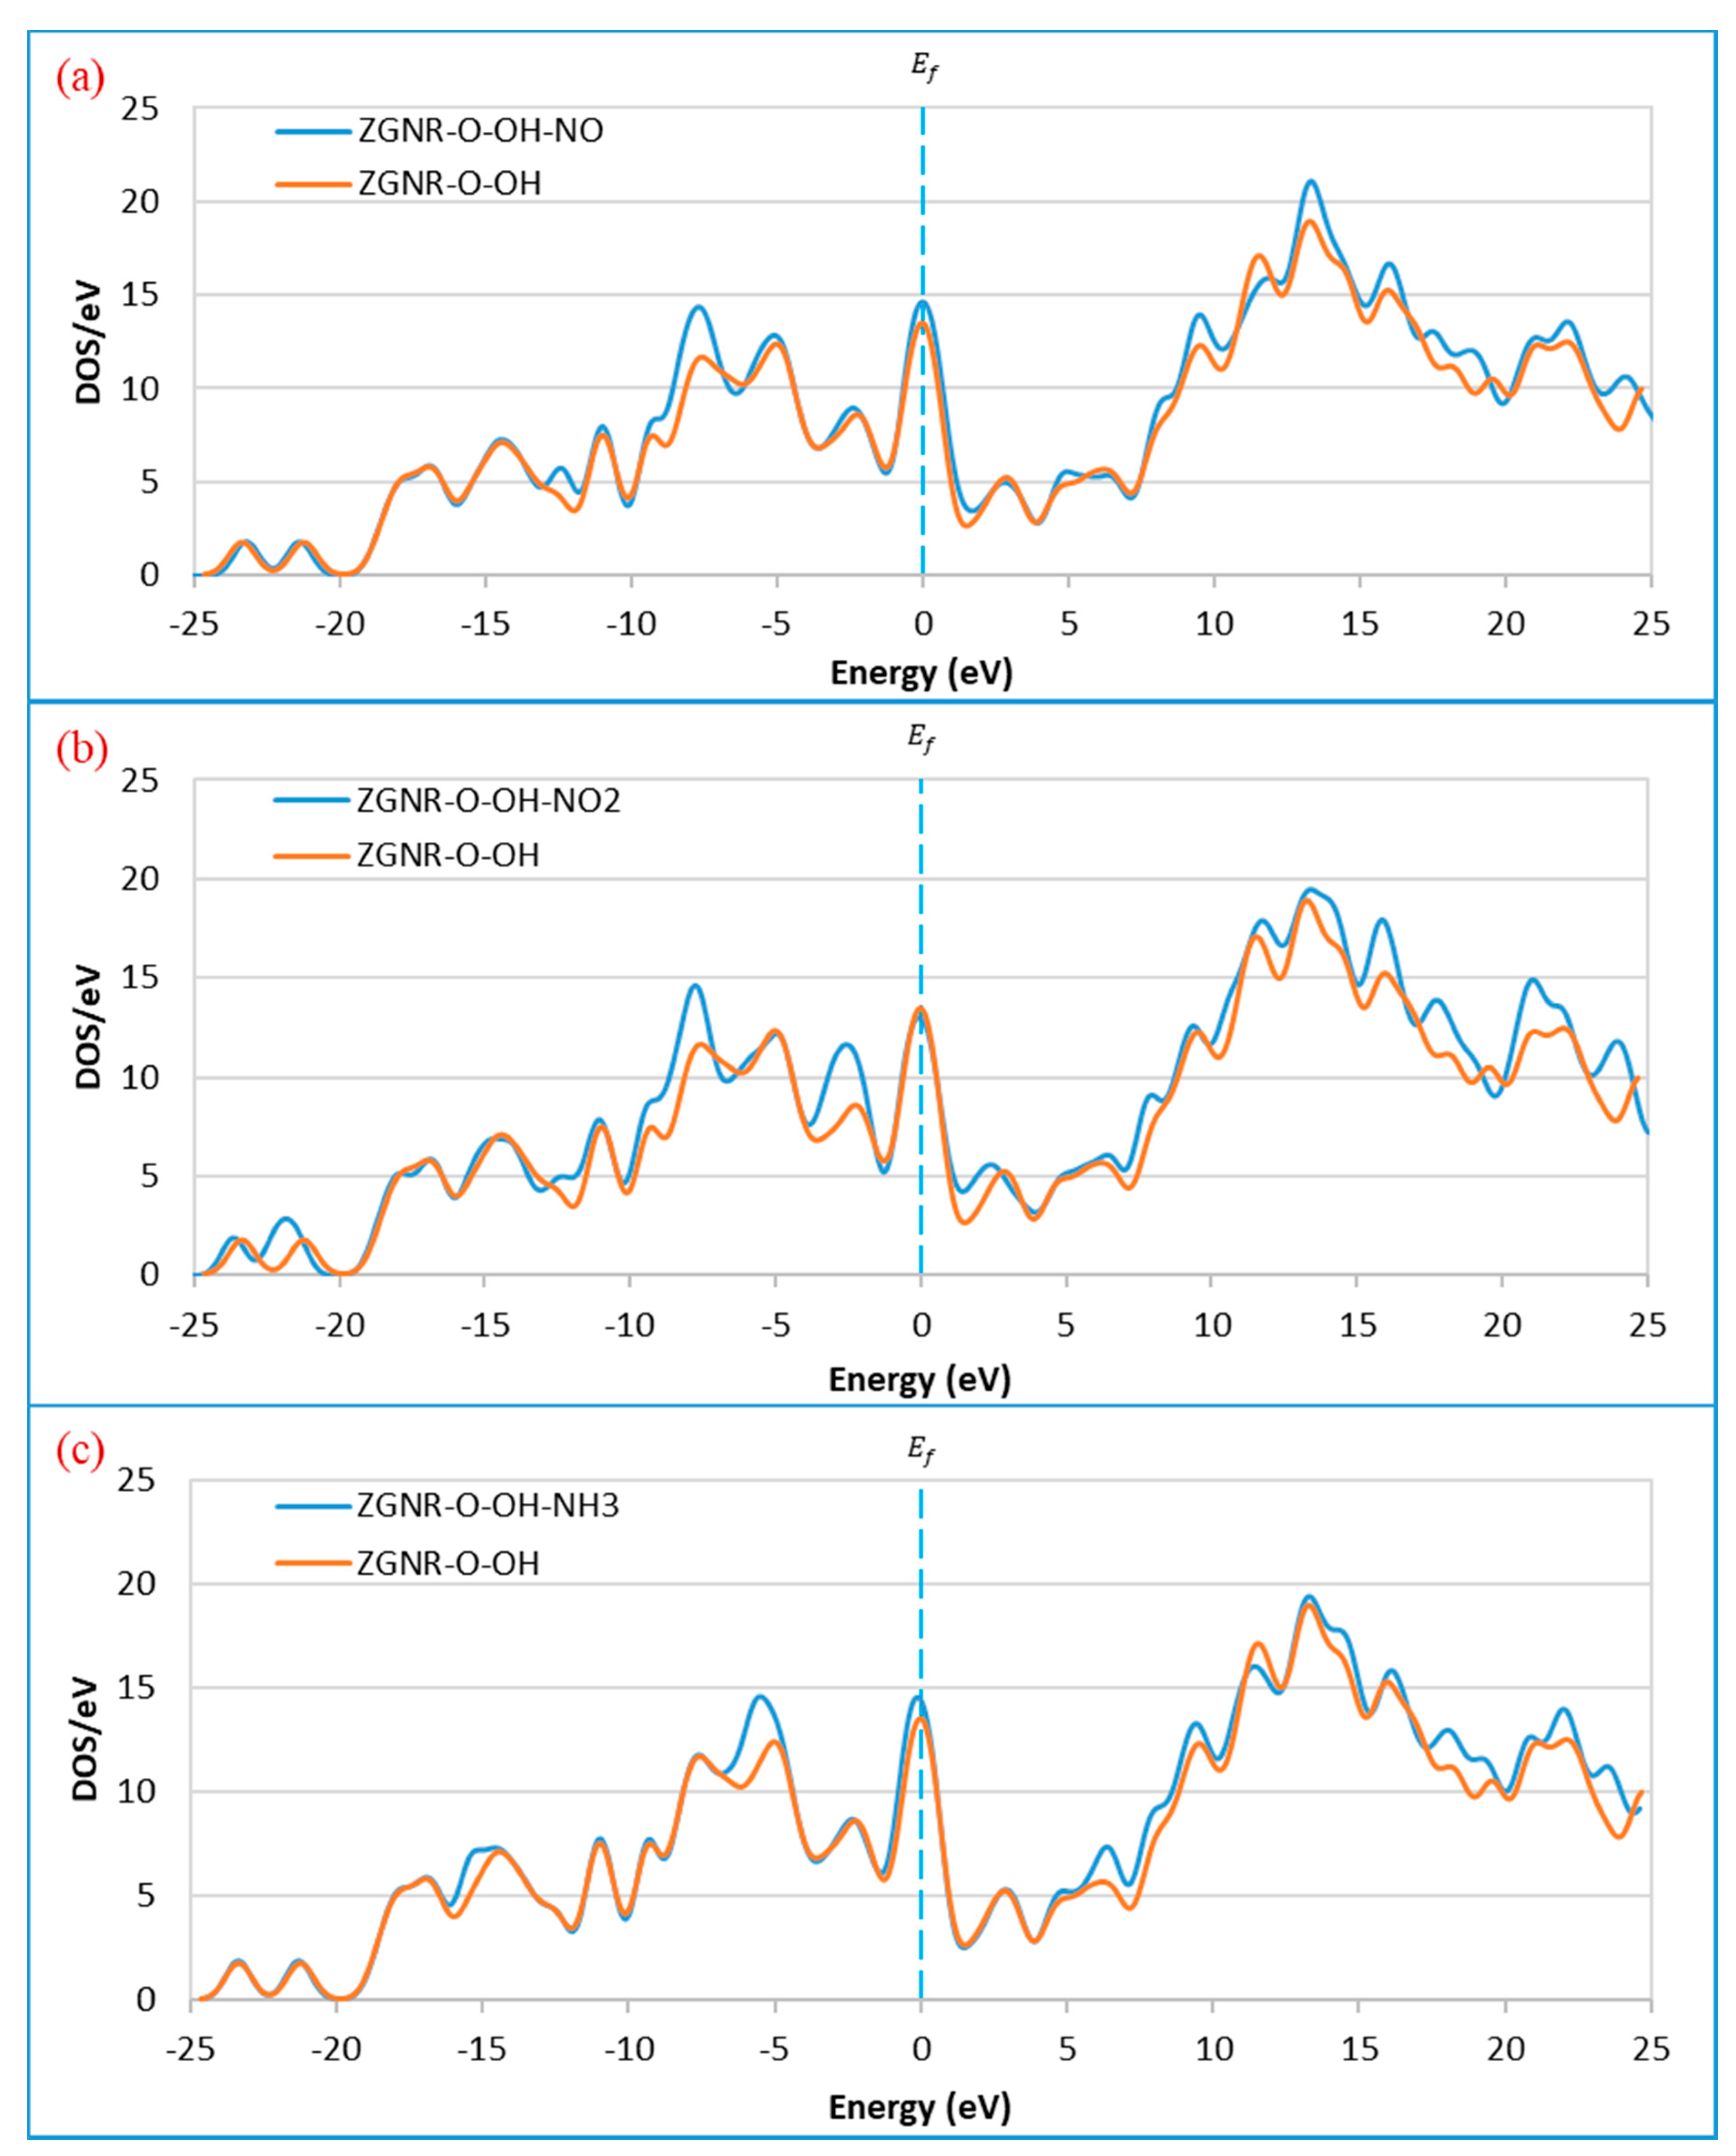
3.4. ZGNR-O-OH System
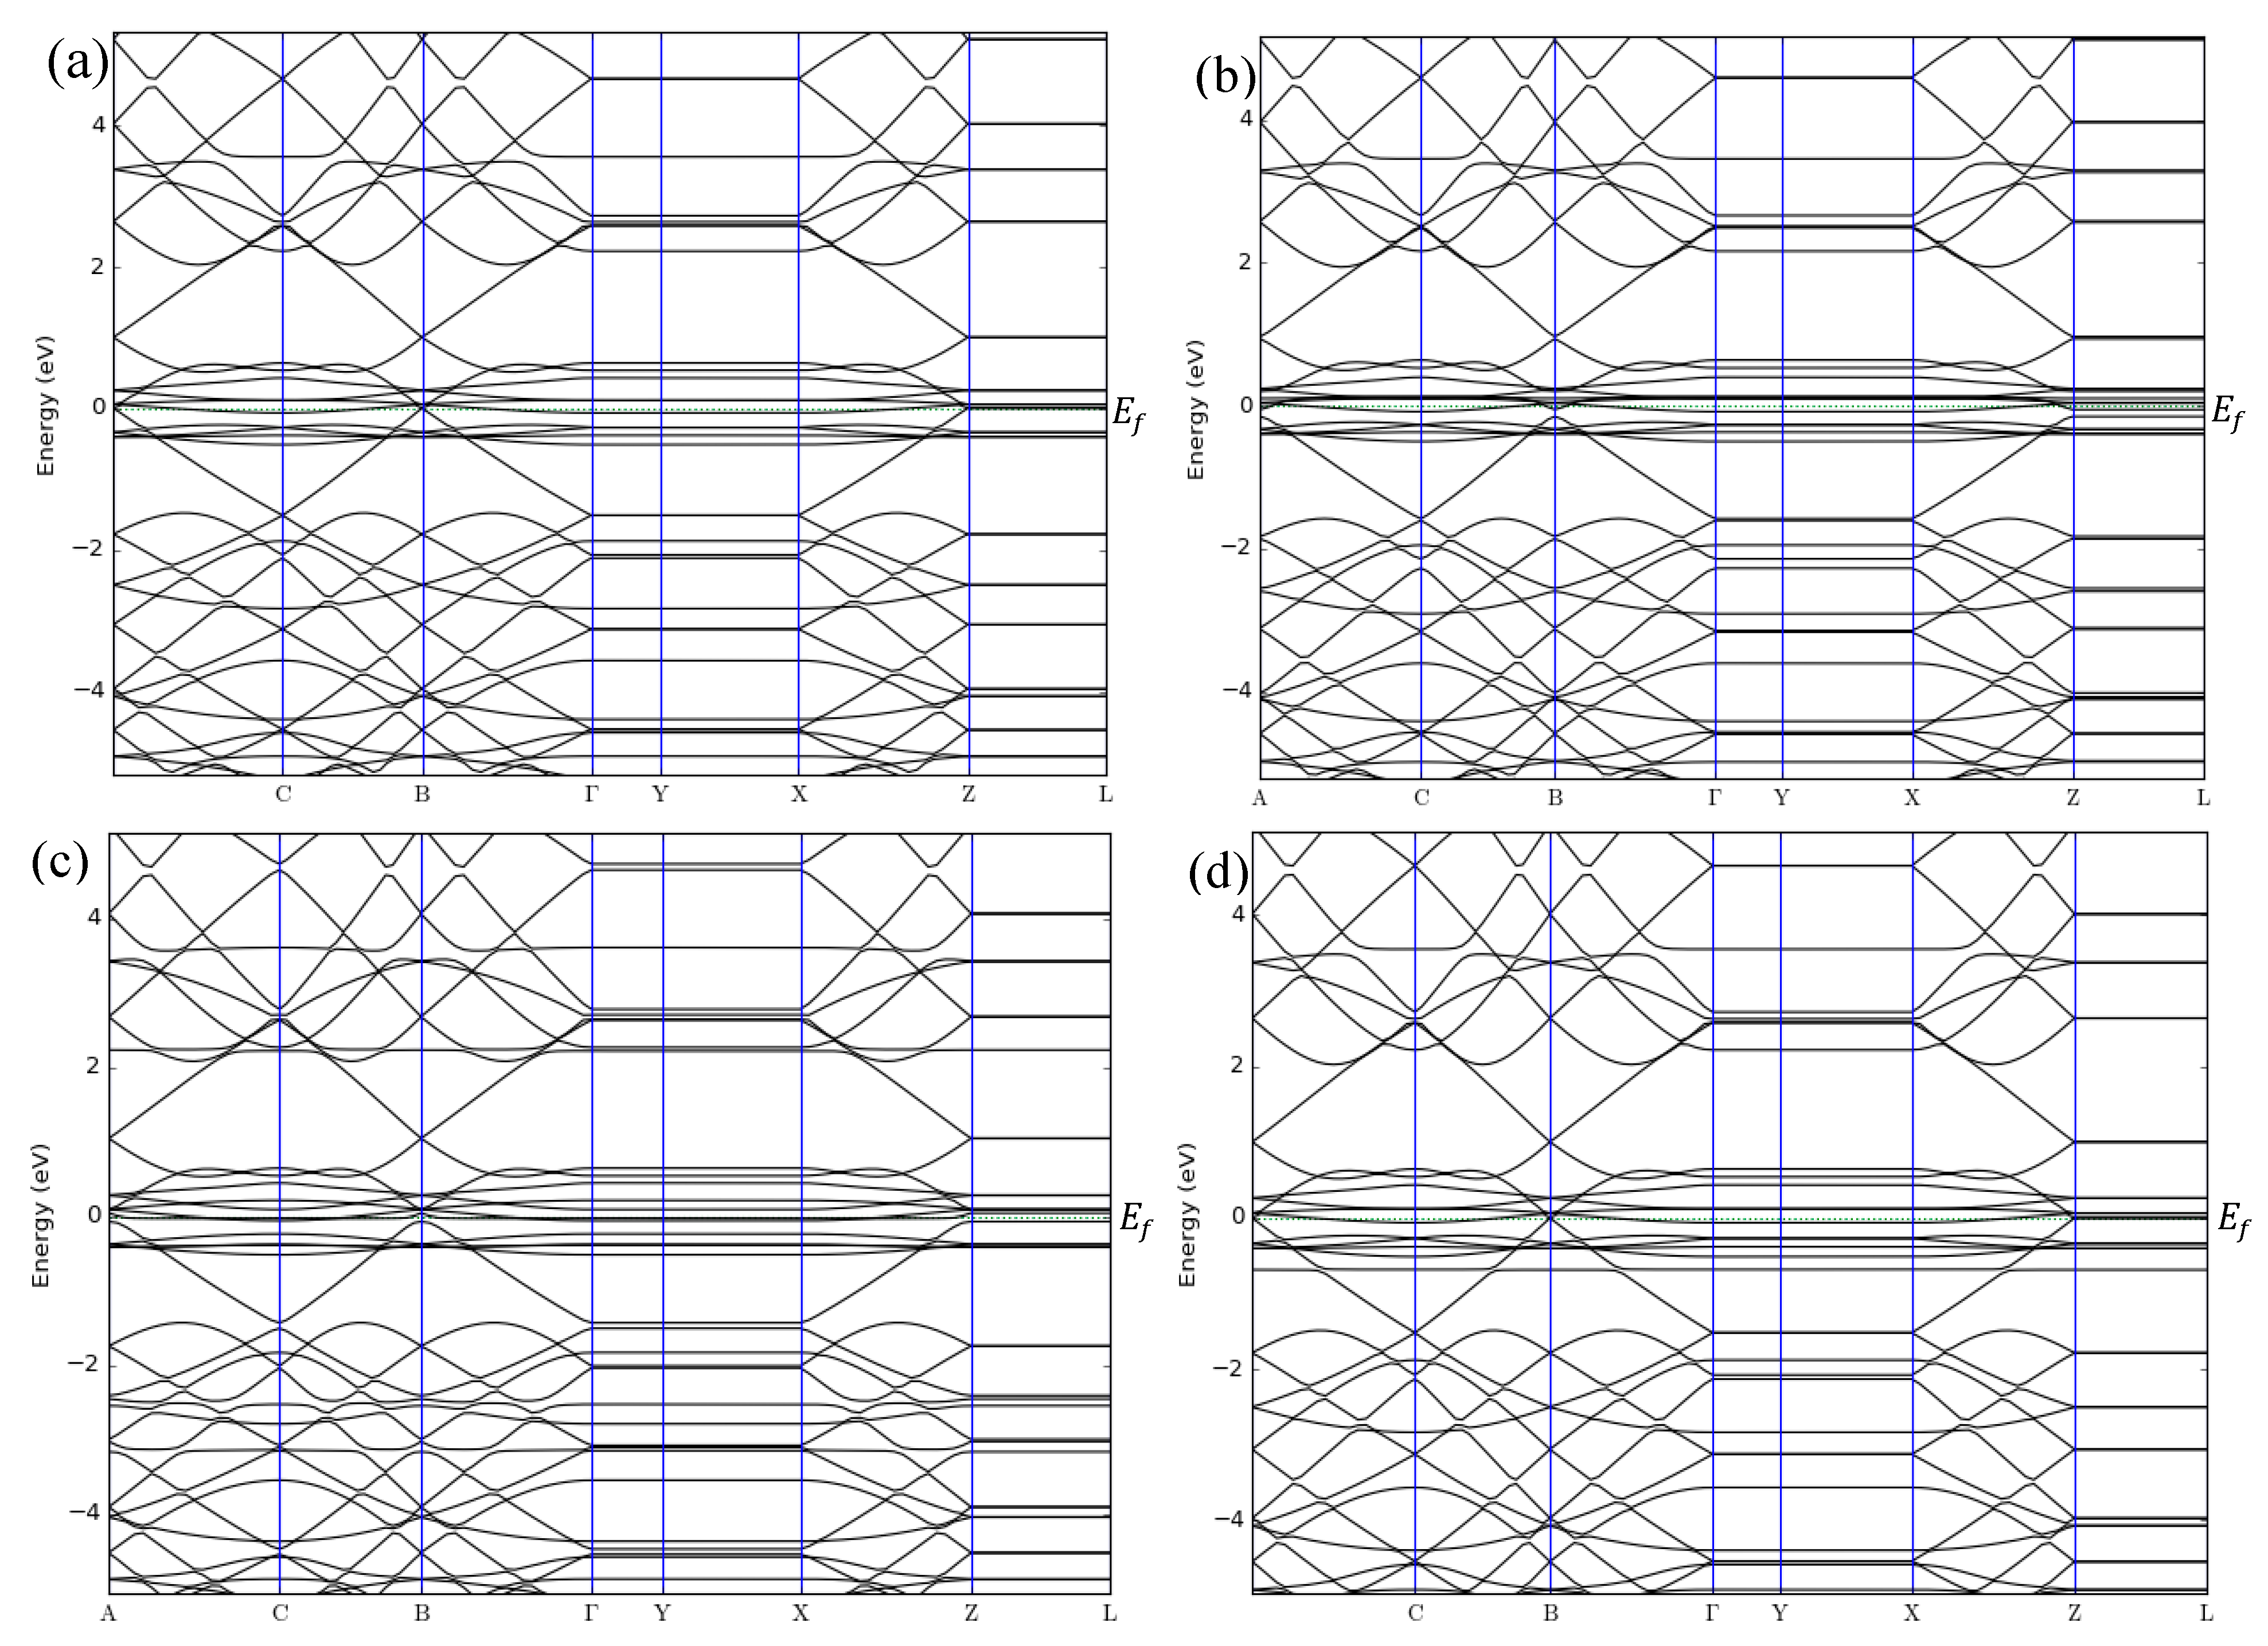
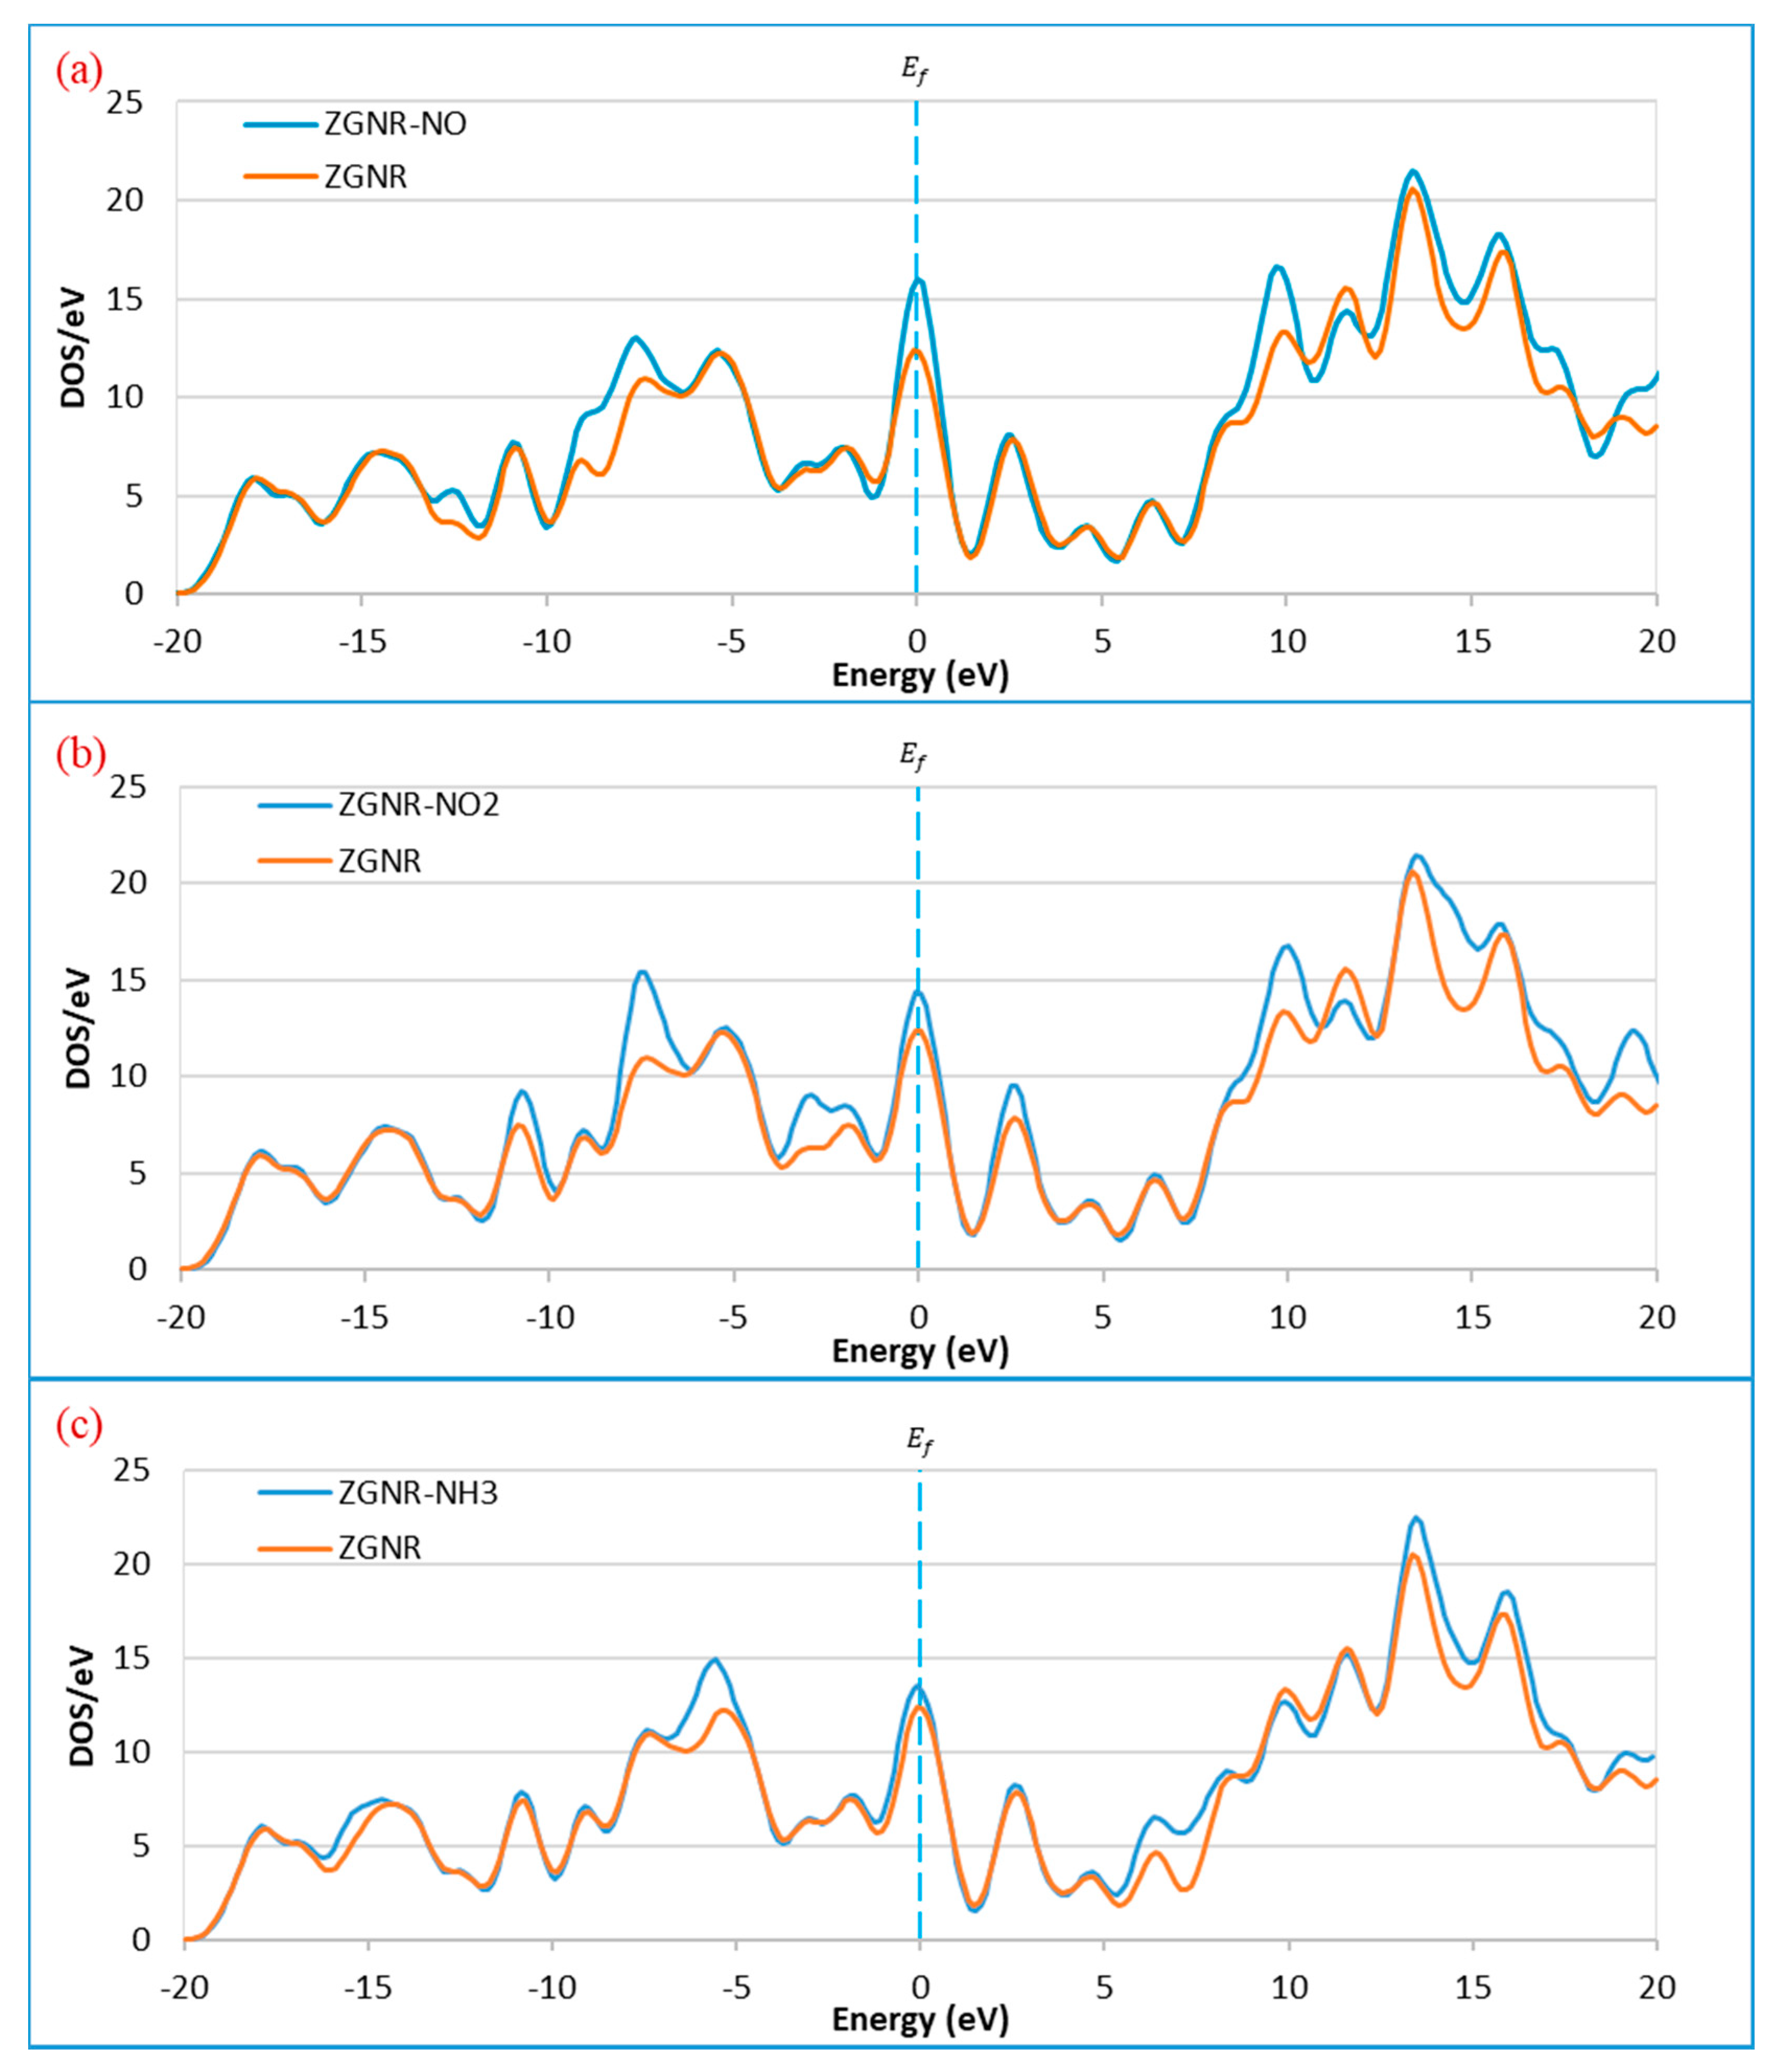
4. Discussion
5. Conclusions
Author Contributions
Acknowledgments
Conflicts of Interest
References
- Novoselov, K.; Geim, A.K.; Morozov, S.; Jiang, D.; Zhang, Y.; Dubonos, S.V.; Grigorieva, I.V.; Firsov, A.A. Electric Field Effect in Atomically Thin Carbon Films. Science 2004, 306, 666–669. [Google Scholar] [CrossRef] [PubMed]
- Bolotin, K.I.; Ghahari, F.; Shulman, M.D.; Stormer, H.L.; Kim, P. Observation of the fractional quantum Hall effect in graphene. Nature 2009, 462, 196–199. [Google Scholar] [CrossRef] [PubMed]
- Xia, F.; Mueller, T.; Lin, Y.-M.; Valdes-Garcia, A.; Avouris, P. Ultrafast graphene photodetector. Nat. Nanotechnol. 2009, 4, 839–843. [Google Scholar] [CrossRef]
- Kim, K.S.; Zhao, Y.; Jang, H.; Lee, S.Y.; Kim, J.M.; Kim, K.S.; Ahn, J.-H.; Kim, P.; Choi, J.-Y.; Hong, B.H. Large-scale pattern growth of graphene films for stretchable transparent electrodes. Nature 2009, 457, 706–710. [Google Scholar] [CrossRef] [PubMed]
- Leenaerts, O.; Partoens, B.; Peeters, F.M. Adsorption of H2O, NH3, CO, NO2, and NO on graphene: A first-principles study. Phys. Rev. B 2008, 77, 125416. [Google Scholar] [CrossRef]
- Zhang, Y.-H.; Chen, Y.-B.; Zhou, K.-G.; Liu, C.; Zeng, J.; Zhang, H.-L.; Peng, Y. Improving gas sensing properties of graphene by introducing dopants and defects: A first-principles study. Nanotechnology 2009, 20, 185504. [Google Scholar] [CrossRef]
- Dai, J.; Yuan, J.; Giannozzi, P. Gas adsorption on graphene doped with B, N, Al, and S: A theoretical study. Appl. Phys. Lett. 2009, 95, 232105. [Google Scholar] [CrossRef]
- Robinson, J.T.; Perkins, F.K.; Snow, E.S.; Wei, Z.; Sheehan, P. Reduced Graphene Oxide Molecular Sensors. Nano Lett. 2008, 8, 3137–3140. [Google Scholar] [CrossRef]
- Shao, L.; Chen, G.; Ye, H.; Niu, H.; Wu, Y.; Zhu, Y.; Ding, B. Sulfur dioxide molecule sensors based on zigzag graphene nanoribbons with and without Cr dopant. Phys. Lett. A 2014, 378, 667–671. [Google Scholar] [CrossRef]
- Anasthasiya, A.N.A.; Khaneja, M.; Jeyaprakash, B.G. Electronic Structure Calculations of Ammonia Adsorption on Graphene and Graphene Oxide with Epoxide and Hydroxyl Groups. J. Electron. Mater. 2017, 46, 5642–5656. [Google Scholar] [CrossRef]
- Yang, L.; Cohen, M.L.; Louie, S.G. Magnetic Edge-State Excitons in Zigzag Graphene Nanoribbons. Phys. Rev. Lett. 2008, 101, 186401. [Google Scholar] [CrossRef] [PubMed]
- Zhang, Y.; Tan, Y.-W.; Stormer, H.L.; Kim, P. Experimental observation of the quantum Hall effect and Berry’s phase in graphene. Nature 2005, 438, 201–204. [Google Scholar] [CrossRef] [PubMed]
- Han, M.Y.; Özyilmaz, B.; Zhang, Y.; Kim, P.; Oezyilmaz, B. Energy Band-Gap Engineering of Graphene Nanoribbons. Phys. Rev. Lett. 2007, 98, 206805. [Google Scholar] [CrossRef] [PubMed]
- Reina, G.; Gonzalez-Dominguez, J.M.; Criado, A.; Vázquez, E.; Bianco, A.; Prato, M. Promises, facts and challenges for graphene in biomedical applications. Chem. Soc. Rev. 2017, 46, 4400–4416. [Google Scholar] [CrossRef]
- Yan, Q.; Huang, B.; Yu, J.; Zheng, F.; Zang, J.; Wu, J.; Gu, B.-L.; Liu, F.; Duan, W. Intrinsic Current−Voltage Characteristics of Graphene Nanoribbon Transistors and Effect of Edge Doping. Nano Lett. 2007, 7, 1469–1473. [Google Scholar] [CrossRef]
- Huang, B.; Yan, Q.; Zhou, G.; Wu, J.; Gu, B.-L.; Duan, W.; Liu, F. Making a field effect transistor on a single graphene nanoribbon by selective doping. Appl. Phys. Lett. 2007, 91, 253122. [Google Scholar] [CrossRef]
- Cervantes-Sodi, F.; Csányi, G.; Piscanec, S.; Ferrari, A.C. Edge-functionalized and substitutionally doped graphene nanoribbons: Electronic and spin properties. Phys. Rev. B 2008, 77, 165427. [Google Scholar] [CrossRef]
- Zhang, Z.; Liu, B.; Hwang, K.-C.; Gao, H. Surface-adsorption-induced bending behaviors of graphene nanoribbons. Appl. Phys. Lett. 2011, 98, 121909. [Google Scholar] [CrossRef]
- Huang, B.; Li, Z.; Liu, Z.; Zhou, G.; Hao, S.; Wu, J.; Gu, B.-L.; Duan, W. Adsorption of Gas Molecules on Graphene Nanoribbons and Its Implication for Nanoscale Molecule Sensor. J. Phys. Chem. C 2008, 112, 13442–13446. [Google Scholar] [CrossRef]
- Saffarzadeh, A. Modeling of gas adsorption on graphene nanoribbons. J. Appl. Phys. 2010, 107, 114309. [Google Scholar] [CrossRef]
- Fiori, G.; Iannaccone, G. Simulation of Graphene Nanoribbon Field-Effect Transistors. IEEE Electron Device Lett. 2007, 28, 760–762. [Google Scholar] [CrossRef]
- Wang, T.; Huang, D.; Yang, Z.; Xu, S.; He, G.; Li, X.; Hu, N.; Yin, G.; He, D.; Zhang, L. A Review on Graphene-Based Gas/Vapor Sensors with Unique Properties and Potential Applications. Nano-Micro Lett. 2015, 8, 95–119. [Google Scholar] [CrossRef] [PubMed]
- Kim, J.-H.; Mirzaei, A.; Kim, H.W.; Kim, H.; Phan, V.; Kim, S.S. A Novel X-ray Radiation Sensor Based on Networked SnO2 Nanowires. Appl. Sci. 2019, 9, 4878. [Google Scholar] [CrossRef]
- Al-Sulaiti, L.A.; Salah, B.; Ayesh, A.I. Investigation of flexible polymer-Tl2O3 nanocomposites for X-ray detector applications. Appl. Surf. Sci. 2019, 489, 351–357. [Google Scholar] [CrossRef]
- Ayesh, A.I.; Salah, B.; Al-Sulaiti, L.A. Production and characterization of flexible semiconducting polymer-nanoparticle composites for X-ray sensors. Radiat. Phys. Chem. 2020, 167, 108233. [Google Scholar] [CrossRef]
- Aghaei, S.M.; Monshi, M.M.; Calizo, I. A theoretical study of gas adsorption on silicene nanoribbons and its application in a highly sensitive molecule sensor. RSC Adv. 2016, 6, 94417–94428. [Google Scholar] [CrossRef]
- Liu, H.; Zhu, W.; Han, Y.; Yang, Z.; Huang, Y. Single-Nanowire Fuse for Ionization Gas Detection. Sensors 2019, 19, 4358. [Google Scholar] [CrossRef]
- Gancarz, M.; Nawrocka, A.; Rusinek, R. Identification of Volatile Organic Compounds and Their Concentrations Using a Novel Method Analysis of MOS Sensors Signal. J. Food Sci. 2019, 84, 2077–2085. [Google Scholar] [CrossRef]
- Rusinek, R.; Siger, A.; Gawrysiak-Witulska, M.; Rokosik, E.; Malaga-Toboła, U.; Gancarz, M. Application of an electronic nose for determination of pre-pressing treatment of rapeseed based on the analysis of volatile compounds contained in pressed oil. Int. J. Food Sci. Technol. 2019. [Google Scholar] [CrossRef]
- Ayesh, A.I.; Alyafei, A.A.; Anjum, R.S.; Mohamed, R.M.; Abuharb, M.B.; Salah, B.; El-Muraikhi, M. Production of sensitive gas sensors using CuO/SnO2 nanoparticles. Appl. Phys. A 2019, 125, 550. [Google Scholar] [CrossRef]
- Lee, C.-T.; Lee, H.-Y.; Chiu, Y.-S. Performance improvement of nitrogen oxide gas sensors using Au catalytic metal on SnO2/WO3 complex nanoparticle sensing layer. IEEE Sens. J. 2016, 16, 7581–7585. [Google Scholar] [CrossRef]
- Di Natale, C.; Paolesse, R.; Martinelli, E.; Capuano, R. Solid-state gas sensors for breath analysis: A review. Anal. Chim. Acta 2014, 824, 1–17. [Google Scholar] [CrossRef] [PubMed]
- Fine, G.F.; Cavanagh, L.M.; Afonja, A.; Binions, R. Metal Oxide Semi-Conductor Gas Sensors in Environmental Monitoring. Sensors 2010, 10, 5469–5502. [Google Scholar] [CrossRef] [PubMed]
- Wetchakun, K.; Samerjai, T.; Tamaekong, N.; Liewhiran, C.; Siriwong, C.; Kruefu, V.; Wisitsoraat, A.; Tuantranont, A.; Phanichphant, S. Semiconducting metal oxides as sensors for environmentally hazardous gases. Sens. Actuators B Chem. 2011, 160, 580–591. [Google Scholar] [CrossRef]
- Marquis, B.T.; Vetelino, J.F. A semiconducting metal oxide sensor array for the detection of NOx and NH3. Sens. Actuators B Chem. 2001, 77, 100–110. [Google Scholar] [CrossRef]
- Xia, H.; Kong, F.; Wang, S.; Zhu, B.; Guo, X.; Zhang, J.; Wang, Y.; Wu, S. Au-doped WO3-based sensor for NO2 detection at low operating temperature. Sens. Actuators B Chem. 2008, 134, 133–139. [Google Scholar] [CrossRef]
- Yang, L.; Marikutsa, A.V.; Rumyantseva, M.; Konstantinova, E.; Khmelevsky, N.; Gaskov, A. Quasi Similar Routes of NO2 and NO Sensing by Nanocrystalline WO3: Evidence by In Situ DRIFT Spectroscopy. Sensors 2019, 19, 3405. [Google Scholar] [CrossRef] [PubMed]
- Xia, Y.; Wang, J.; Xu, J.-L.; Li, X.; Xie, D.; Xiang, L.; Komarneni, S. Confined Formation of Ultrathin ZnO Nanorods/Reduced Graphene Oxide Mesoporous Nanocomposites for High-Performance Room-Temperature NO2 Sensors. ACS Appl. Mater. Interfaces 2016, 8, 35454–35463. [Google Scholar] [CrossRef]
- Jalil, A.R.; Chang, H.; Bandari, V.K.; Robaschik, P.; Zhang, J.; Siles, P.F.; Li, G.; Bürger, D.; Grimm, D.; Liu, X.; et al. Fully Integrated Organic Nanocrystal Diode as High Performance Room Temperature NO2 Sensor. Adv. Mater. 2016, 28, 2971–2977. [Google Scholar] [CrossRef]
- Kanzawa, K.; Kitano, J. A semiconductor device manufacturer’s efforts for controlling and evaluating atmospheric pollution. In Proceedings of the SEMI Advanced Semiconductor Manufacturing Conference and Workshop, Cambridge, MA, USA, 13–15 November 1995; pp. 190–193. [Google Scholar]
- Chang, Y.-C.; Bai, H.; Li, S.-N.; Kuo, C.-N. Bromocresol Green/Mesoporous Silica Adsorbent for Ammonia Gas Sensing via an Optical Sensing Instrument. Sensors 2011, 11, 4060–4072. [Google Scholar] [CrossRef]
- Toxicological Profile for Ammonia, U.S. Department of Health and Human Services. Available online: https://www.atsdr.cdc.gov/toxprofiles/tp126.pdf (accessed on September 2004).
- Perdew, J.P.; Burke, K.; Ernzerhof, M. Generalized Gradient Approximation Made Simple. Phys. Rev. Lett. 1996, 77, 3865–3868. [Google Scholar] [CrossRef] [PubMed]
- Grimme, S. Semiempirical GGA-type density functional constructed with a long-range dispersion correction. J. Comput. Chem. 2006, 27, 1787–1799. [Google Scholar] [CrossRef] [PubMed]
- Gao, W.; Xiao, P.; Henkelman, G.; Liechti, K.; Huang, R. Interfacial adhesion between graphene and silicon dioxide by density functional theory with van der Waals corrections. J. Phys. D Appl. Phys. 2014, 47, 255301. [Google Scholar] [CrossRef]
- Liu, D.; Gui, Y.; Ji, C.; Tang, C.; Zhou, Q.; Li, J.; Zhang, X. Adsorption of SF6 decomposition components over Pd (1 1 1): A density functional theory study. Appl. Surf. Sci. 2019, 465, 172–179. [Google Scholar] [CrossRef]
- Neugebauer, J.; Scheffler, M. Adsorbate-substrate and adsorbate-adsorbate interactions of Na and K adlayers on Al(111). Phys. Rev. B 1992, 46, 16067–16080. [Google Scholar] [CrossRef]
- Manna, B.; Raha, H.; Chakrabarti, I.; Guha, P.K. Selective Reduction of Oxygen Functional Groups to Improve the Response Characteristics of Graphene Oxide-Based Formaldehyde Sensor Device: A First Principle Study. IEEE Trans. Electron Devices 2018, 65, 1–8. [Google Scholar] [CrossRef]
- Bo, Z.; Guo, X.; Wei, X.; Yang, H.; Yan, J.; Cen, K. Density functional theory calculations of NO2 and H2S adsorption on the group 10 transition metal (Ni, Pd and Pt) decorated graphene. Phys. E Low-Dimens. Syst. Nanostruct. 2019, 109, 156–163. [Google Scholar] [CrossRef]
- Mulliken, R.S. Electronic Population Analysis on LCAO–MO Molecular Wave Functions. I. J. Chem. Phys. 1955, 23, 1833–1840. [Google Scholar] [CrossRef]
- Son, Y.-W.; Cohen, M.L.; Louie, S.G. Energy Gaps in Graphene Nanoribbons. Phys. Rev. Lett. 2006, 97, 216803. [Google Scholar] [CrossRef]
- Nakada, K.; Fujita, M.; Dresselhaus, G.; Dresselhaus, M.S. Edge state in graphene ribbons: Nanometer size effect and edge shape dependence. Phys. Rev. B 1996, 54, 17954–17961. [Google Scholar] [CrossRef]
- Toda, K.; Furue, R.; Hayami, S. Recent progress in applications of graphene oxide for gas sensing: A review. Anal. Chim. Acta 2015, 878, 43–53. [Google Scholar] [CrossRef]
- Chatterjee, S.G.; Chatterjee, S.; Ray, A.K.; Chakraborty, A.K. Graphene–metal oxide nanohybrids for toxic gas sensor: A review. Sens. Actuators B Chem. 2015, 221, 1170–1181. [Google Scholar] [CrossRef]
- Peng, Y.; Li, J. Ammonia adsorption on graphene and graphene oxide: A first-principles study. Front. Environ. Sci. Eng. 2013, 7, 403–411. [Google Scholar] [CrossRef]
- Hosseingholipourasl, A.; Ahmadi, M.T.; Ismail, R.; Gharaei, N. Analytical modelling and simulation of gas adsorption effects on graphene nanoribbon electrical properties. Mol. Simul. 2017, 44, 551–557. [Google Scholar]
- Ko, G.; Kim, H.-Y.; Ahn, J.; Park, Y.-M.; Lee, K.-Y.; Kim, J. Graphene-based nitrogen dioxide gas sensors. Curr. Appl. Phys. 2010, 10, 1002–1004. [Google Scholar] [CrossRef]
- Ahmadi, M.T.; Ismail, R.; Anwar, S. Handbook of Research on Nanoelectronic Sensor Modeling and Applications; IGI Global: Hershey, PA, USA, 2017. [Google Scholar]
- Akbari, E.; Afroozeh, A.; Tan, M.L.P.; Arora, V.K.; Ghadiry, M.; Yusof, R.; Ahmadi, M.T.; Enzevaee, A.; Rahmani, M. Analytical assessment of carbon allotropes for gas sensor applications. Measurement 2016, 92, 295–302. [Google Scholar] [CrossRef]
- Tang, S.; Cao, Z. Adsorption of nitrogen oxides on graphene and graphene oxides: Insights from density functional calculations. J. Chem. Phys. 2011, 134, 44710. [Google Scholar] [CrossRef] [PubMed]
- Guo, L.; Hao, Y.-W.; Li, P.-L.; Song, J.-F.; Yang, R.-Z.; Fu, X.-Y.; Xie, S.-Y.; Zhao, J.; Zhang, W. Improved NO2 Gas Sensing Properties of Graphene Oxide Reduced by Two-beam-laser Interference. Sci. Rep. 2018, 8, 4918. [Google Scholar] [CrossRef] [PubMed]


| Gas | D (Å) | ||
|---|---|---|---|
| NO | −0.273 | 2.88 | −0.104 |
| NO2 | −0.225 | 3.11 | 0.040 |
| NH3 | −0.092 | 3.03 | −0.018 |
| Gas | D (Å) | ||
|---|---|---|---|
| NO | −0.318 | 2.66 | −0.132 |
| NO2 | −0.212 | 3.15 | 0.031 |
| NH3 | −0.124 | 3.15 | −0.128 |
| Gas | D (Å) | ||
|---|---|---|---|
| NO | −0.641 | 2.24 | −0.146 |
| NO2 | −0.618 | 1.74 | 0.074 |
| NH3 | −0.244 | 2.18 | −0.137 |
| Gas | D (Å) | ||
|---|---|---|---|
| NO | −0.625 | 1.98 | −0.118 |
| NO2 | −0.953 | 1.68 | 0.092 |
| NH3 | −0.219 | 2.45 | −0.141 |
© 2020 by the authors. Licensee MDPI, Basel, Switzerland. This article is an open access article distributed under the terms and conditions of the Creative Commons Attribution (CC BY) license (http://creativecommons.org/licenses/by/4.0/).
Share and Cite
Salih, E.; Ayesh, A.I. Enhancing the Sensing Performance of Zigzag Graphene Nanoribbon to Detect NO, NO2, and NH3 Gases. Sensors 2020, 20, 3932. https://doi.org/10.3390/s20143932
Salih E, Ayesh AI. Enhancing the Sensing Performance of Zigzag Graphene Nanoribbon to Detect NO, NO2, and NH3 Gases. Sensors. 2020; 20(14):3932. https://doi.org/10.3390/s20143932
Chicago/Turabian StyleSalih, Ehab, and Ahmad I. Ayesh. 2020. "Enhancing the Sensing Performance of Zigzag Graphene Nanoribbon to Detect NO, NO2, and NH3 Gases" Sensors 20, no. 14: 3932. https://doi.org/10.3390/s20143932
APA StyleSalih, E., & Ayesh, A. I. (2020). Enhancing the Sensing Performance of Zigzag Graphene Nanoribbon to Detect NO, NO2, and NH3 Gases. Sensors, 20(14), 3932. https://doi.org/10.3390/s20143932