1. Introduction
While visibility can range from 6 to 15 m in the deep ocean, this range can be reduced to 1 to 6 m in near-shore water. In ports, estuaries, and other human-occupied waters, visibility can be less than 1 m [
1]. The SONAR (sound navigation and ranging) system is the most widely adopted solution for remote sensing and is very useful for underwater observation and surveillance in coastal waters with poor visibility due to sediments [
2,
3,
4,
5]. Sector-scanning sonars are a device used to capture two-dimensional images and are widely used for vehicle navigation, obstacle avoidance, and general inspectional surveys of the surrounding environment by unmanned underwater vehicles (UUV) [
6,
7,
8].
A scanning sonar utilizes reverberation to detect targets. The reverberation can occur from the volume of the sea (volume reverberation), from the sea surface (sea surface reverberation), and the sea bottom surface (sea bottom reverberation) [
9,
10,
11]. These three types of reverberation signals are indistinguishable due to the randomness in the signal. As the level of reverberation decreases with range, the rate of positioning errors increases, which can decrease the performance of in-vehicle navigation. Because of this navigation deficiency, more robust object detection and additional information regarding object movement are necessary to ensure obstacle avoidance. In some cases, special equipment must be added to capture accurate images of the surroundings [
1,
12,
13].
Extracting useful information from reverberation signals is an important issue in sonar signal processing. Since the reverberation is correlated with the reflection from the target, it is necessary to remove the reverberation or to increase the signal level to efficiently detect the reflection from the target. There are many algorithms to improve detection where reverberation exists. Karine et al. [
14] proposed a space–time adaptive processing method for low-frequency sonar. Song et al. [
15,
16,
17] used a time-reversal mirror for reverberation nulling to cancel the reverberation. Guillaume et al. [
18,
19] suggested an algorithm using principal component inverse (PCI) algorithm to improve the detection in the presence of reverberation. Past research exists regarding blind source separation (BSS) technology, including Cong et al.’s [
20] presentation of a Bean-space-based BSS algorithm to improve target echo. Research efforts to increase the reflection signal strength were also carried out. Xu et al. [
21] attempted to increase the strength of the reflection signal by using a sliding window. Although the research to separate the target reflection signal from echo improved the detection capability to some extent, it focuses on post-processing the signal rather than enhancing the quality of raw data. If we can capture high-resolution raw data, the detection capability can be significantly improved.
Atherton [
22] claimed that any method to enhance the raw data quality in shallow water, regions with strong currents, and an uneven or sloped sea bottom must consider the following five points:
Lessens surface multipath;
Reduces surface reverberation;
Head stability;
Head position and alignment;
Decreases slant range distortion.
Current techniques to improve the raw data while satisfying the points above include using a narrower vertical beam or tilt transducer, and installing the sonar on a drop mount, pole mount, or spreader bar; however, the sensors and equipment must be adapted to each situation. Continuous acquisitions of images require accurately moving the sensor, which is very difficult in practice.
To overcome the limitations of the current methods and to improve the quality of raw data, in this paper, we propose two technical methods (hula hoop motion (HHM) and control posture) to be used with new techniques using an underwater walking robot: the CRABSTER (CR200).
2. Limitations of Existing Methods
We analyzed the acquired sonar image from the HEMIRE [
23,
24] remotely operated vehicle (ROV) operation in turbid water in 2010 and the vertical/horizontal image acquired by tripod and pole-mount deployment from the sonar test conducted at the pier of the South Sea Research Institute of KIOST (Korea Institute of Ocean Science and Technology), collected from 3 April to 6 April 2012, to determine the limitations of sonar operation.
2.1. Specifications of Sector-Scanning Sonar
Figure 1 shows the operational equipment for sector-scanning sonar. The sector-scanning sonar used in this research was a high-resolution scanning sonar made by Kongsberg Mesotech (Kongsberg, Canada).
Table 1 lists the specifications and
Figure 2 illustrates the acoustic coverage of the sonar [
22]. It is operable up to a depth of 3000 m and uses a frequency of 675 kHz. It takes 36 seconds for a full 360° scan if the step size is 1.8° at 100 m range. Polar images were obtained by a sequential scan of 0.9° horizontal and 30° vertical beam width. It is assumed that the side lobes do not affect the horizontal image analysis.
2.2. Limitations of Existing Methods
2.2.1. Multipath and Sea Surface Reverberation
Multipath noise and sea surface reverberation significantly affect the resolution when acquiring the images of a target at the seabed in shallow water [
22].
Figure 3 demonstrates three possible paths that multipath noises can occur. When a thermocline is present, the number of paths can increase to five. In our field tests, the depth was about 7 m. The operation range of the sonar on the tripod was 50 m. The step size was 0.225°. The top image in
Figure 3 shows the target located at 33 m from the sonar. The closest target from the sonar (target 1) is shown as a sonar image of a H-beam and has the strongest reflection signal. The images of targets 2 and 3 are less clear as the paths become longer compared to target 1. The middle image in
Figure 3 was taken when the sonar was moved closer to the target (a distance of 10 m). Targets 2 and 3 are not shown here, which means that targets 2 and 3 in the top image are the results of multipath noise. The actual picture of the beam taken by a diver is shown at the left of the third row of
Figure 3. The bottom plot of
Figure 3 illustrates three possible paths. If the target is at the same level as the sonar, we can draw an isosceles triangle with the apex being the point where the vertical beam intersects the surface. This implies that the multipath noise can be eliminated if the apex is located at the halfway point of the sonar range.
The sonar image in
Figure 4 shows a representative case of sea surface reverberation. Again, the water depth was 7 m. The sonar operation range was 50 m with a step size of 0.225°. The green arrow on the sonar image indicates the at-risk region where sea surface reverberation can occur. To the right of the sonar image are the actual pictures of a fish-cultivation farm and a float bridge connecting the farm with the land. The farm and the bridge are shown as artifacts in the sonar image (marked by the dotted ellipses and arrows). The mechanism of surface reverberation is illustrated in the bottom drawing of
Figure 5. The reverberation starts at approximately 17 m from the sonar. The structure above the surface is mirrored and superimposed with the underwater image due to the reverberation.
Figure 3 and
Figure 4 show the limitations in acquiring a high-resolution underwater image in shallow water due to multipath noise and surface reverberation. To overcome these limitations, several methods were attempted: multiple mapping at ranges where the surface reverberation and multipath noise do not occur, using a reduced vertical beam size, or scanning in the direction of the surface by tilting the sensor head [
22]. It takes considerable time and effort to gather sonar data, and additional scanning sonars with a narrow vertical angle were required.
2.2.2. Head Stability and Alignment
The following three techniques should be considered for acquiring high-resolution sonar images using a tripod in shallow water, regions with a strong current, or an uneven or sloped sea bottom. First, the sonar head must be stabilized by minimizing the current-induced oscillation. Second, the sonar must be properly aligned to provide the necessary posture (elevation, inclination angle, direction angle, etc.). Finally, the sonar must be arbitrarily located. In an environment with weak or no tidal current, it is possible to maintain the image quality even if the tripod is on an uneven or sloped seafloor because the sonar head is aligned with the gravitation due to the gimbal mechanism; however, as shown in
Figure 5, it was difficult for us to install the sonar head in a stable position on a sloped floor parallel to the ground, and also not easy to suppress the oscillation due to the strong current. There are several ways to do achieve stability: by deploying sensors from a fixed structure on the surface or barge using a spreader bar, using a fixed tripod instead of the gimbal, and installing a stabilization fin to remove the vortex behind the sonar using a drop cable deployment in a strong current environment; however, it is difficult to maneuver a sonar and maintain a desired posture and position in an uneven or sloped sea bottom with a strong current, even if these methods are used.
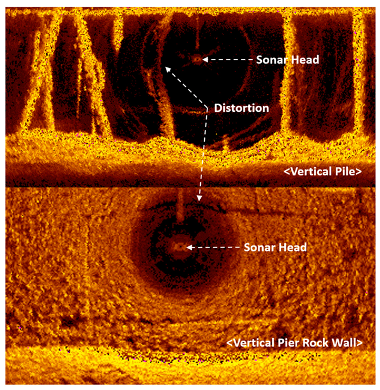
2.2.3. Slant Range Distortion
Sector-scanning sonar is used to inspect slopes and vertical structures such as beams, dams, and bridges. For these applications, the sonar head is installed vertically, and close to the target surface. Both sector-scanning sonar and side-scanning sonar have a problem that creates an illusion of deformation of the object adjacent to the sonar, which is called slant range distortion. This is caused by displaying the 3D data on a 2D monitor, and is generated from the side lobe of the acoustic sensor [
22]. The top image of
Figure 6 shows an image of vertical piles supporting a pier, and shows the distortion that occurs in the pile near the sonar head. The image below shows a vertical pier rock wall and that the shadow of the stonework at 12 o’clock is curved from the sonar head. Conventionally, the problem is solved by overlapping the normal image acquired at a distance and removing the distorted image.
2.2.4. Sonar Operation with General ROV
If a sector-scanning sonar is usually installed on an underwater robot or vehicle, it is highly useful to detect objects, avoid obstacles, and acquire the necessary information for navigation [
6]. By using the precision position sensor installed in a remotely operated vehicle (ROV), it is possible not only to know the position of the acquired image but also to continuously obtain the image by moving to the desired position. As shown in
Figure 7, the work-class ROV has the advantage of estimating the pose of the manipulator and can maneuver it by observing the shadow of the manipulator; however, once the position of the sonar is fixed to the ROV frame, it is difficult to change the position during operation, and, in the case of a work-class ROV operation, an additional sonar is required to cover the full 360° due to its size. The most general issue is that the standard form of the ROV is a shape of a rectangular box, so it is hard to move the ROV along the desired course while also maintaining the desired heading and altitude under an environment with a strong current.
2.3. Strategies to Overcome the Limitations of Conventional Sonar Operation Methods
Previous sections list the issues regarding reverberation and distortion due to the limitations of conventional sonar operation. To overcome these limitations, the environmental aspects such as shallow water, regions with a strong current, and an uneven or sloped sea bottom must be considered together. In this paper, we suggest strategies to improve the acquisition of high-resolution sonar images in the following way:
To continuously provide an inclined angle in a rotating sonar scanning direction;
To realize positioning, alignment, target tracking, and anti-oscillation by controlling the platform where the sonar is installed;
To acquire an efficient 360° omnidirectional image using a single sonar.
3. A New Concept of Sensor Operation Strategy
3.1. Seabed Image-Obtaining Strategies using an Underwater Walking Robot
Figure 8 shows a strategy for overcoming the conventional technical problems summarized in
Section 2.3 using the CR200 under four environmental conditions (shallow water, regions with a strong current, and an uneven or sloped sea bottom) and efficiently obtaining a precise seabed image. HHM, expressed as a function of CR200, represents the technology corresponding to improvement 1 in
Section 2.3. This technology selectively separates the sea surface reverberation from the bottom reverberation to reduce noise caused by both multipath and reverberation, and to minimize the slant range distortion that occurs when a support ship, a large structure, or an ice shelf are located close to the sonar, perpendicular to the up position. The second function of CR200, the control posture, is a technology that provides the desired posture and position to the sonar. As described in improvement 2 in
Section 2.3, with this technology, the oscillation of the sonar can be suppressed and the ROV can move to the desired course while maintaining a certain altitude and heading. The last technology, described in improvement 3 in
Section 2.3, maximizes the efficiency of image acquisition. This enables the sonar installed on the ROV to acquire the image of the seafloor of the widest area in one scanning, while minimizing the shadow section caused by the interference of the ROV body itself.
3.2. Introduction of Multi-Legged Underwater Robot CR200
The CR200 was developed in 2013 for exploration and scientific research on the seabed in areas where the current is very strong, such as the West Sea in Korea [
26]. It is designed to investigate the seabed in detail and to be suitable for precise underwater work, featuring six legs, which consist of multiple joints instead of a propeller type actuator. The six legs consist of four dedicated legs with four degrees of freedom and two robotic arms with seven degrees of freedom, allowing it to walk on the seafloor like a crab and perform underwater work using its arms.
The specifications of the CR200 are as follows: it is 2.42 m long, 2.45 m wide, and 1.2 m high; it can lift its own body by 1 meter. The total weight is 650 kg; it can be operated up to a water depth of 200 m; the input power is 150 to 190 VDC (voltage direct current); the body structure of the CR200 has a streamlined form to minimize the effect of the current [
27].
Table 2 shows the mechanical specifications of the CR200.
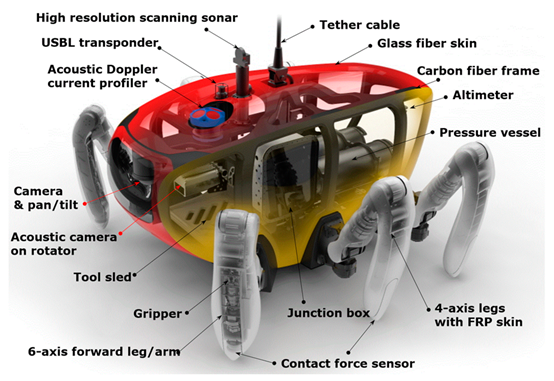
The body frame of the CR200 and the composition of the equipment mounted inside are shown in
Figure 9. It is equipped with an attitude and heading reference system (AHRS), a gyrocompass for measuring posture and a tool sled to be used as storage for various subsea tooling and sample collection. The equipment used for the underwater operation was an acoustic doppler current profiler (ADCP), which measures the direction and speed of current for a specific water layer, an ultra-short baseline (USBL) responder, which was used to measure the position of the robot, and several optical cameras for optical image acquisition. An acoustic camera for identifying objects within 10 m in a turbulent environment around the robot was mounted in the center of the body and a sector-scanning sonar that investigates a relatively large area was installed at the top to make it easy to acquire a 360° image.
3.3. The Function of Control Posture
Control posture is a technology that provides the required posture and position for the sensors, and was covered in detail in previous research, so in this paper, we lightly introduce the topic. There were previous studies on the “posture and walking control method of CR200 for precise underwater exploration using acoustic instrument” [
28], “CR200 and an acoustic camera for survey of underwater cultural heritage” [
29], and “Head alignment of a single-beam scanning sonar installed on a CR200” [
30], and we demonstrated the capability of this technology through studies.
Figure 10 shows the concept image of how the CR200 applies a tilt angle to the sector-scanning sonar.
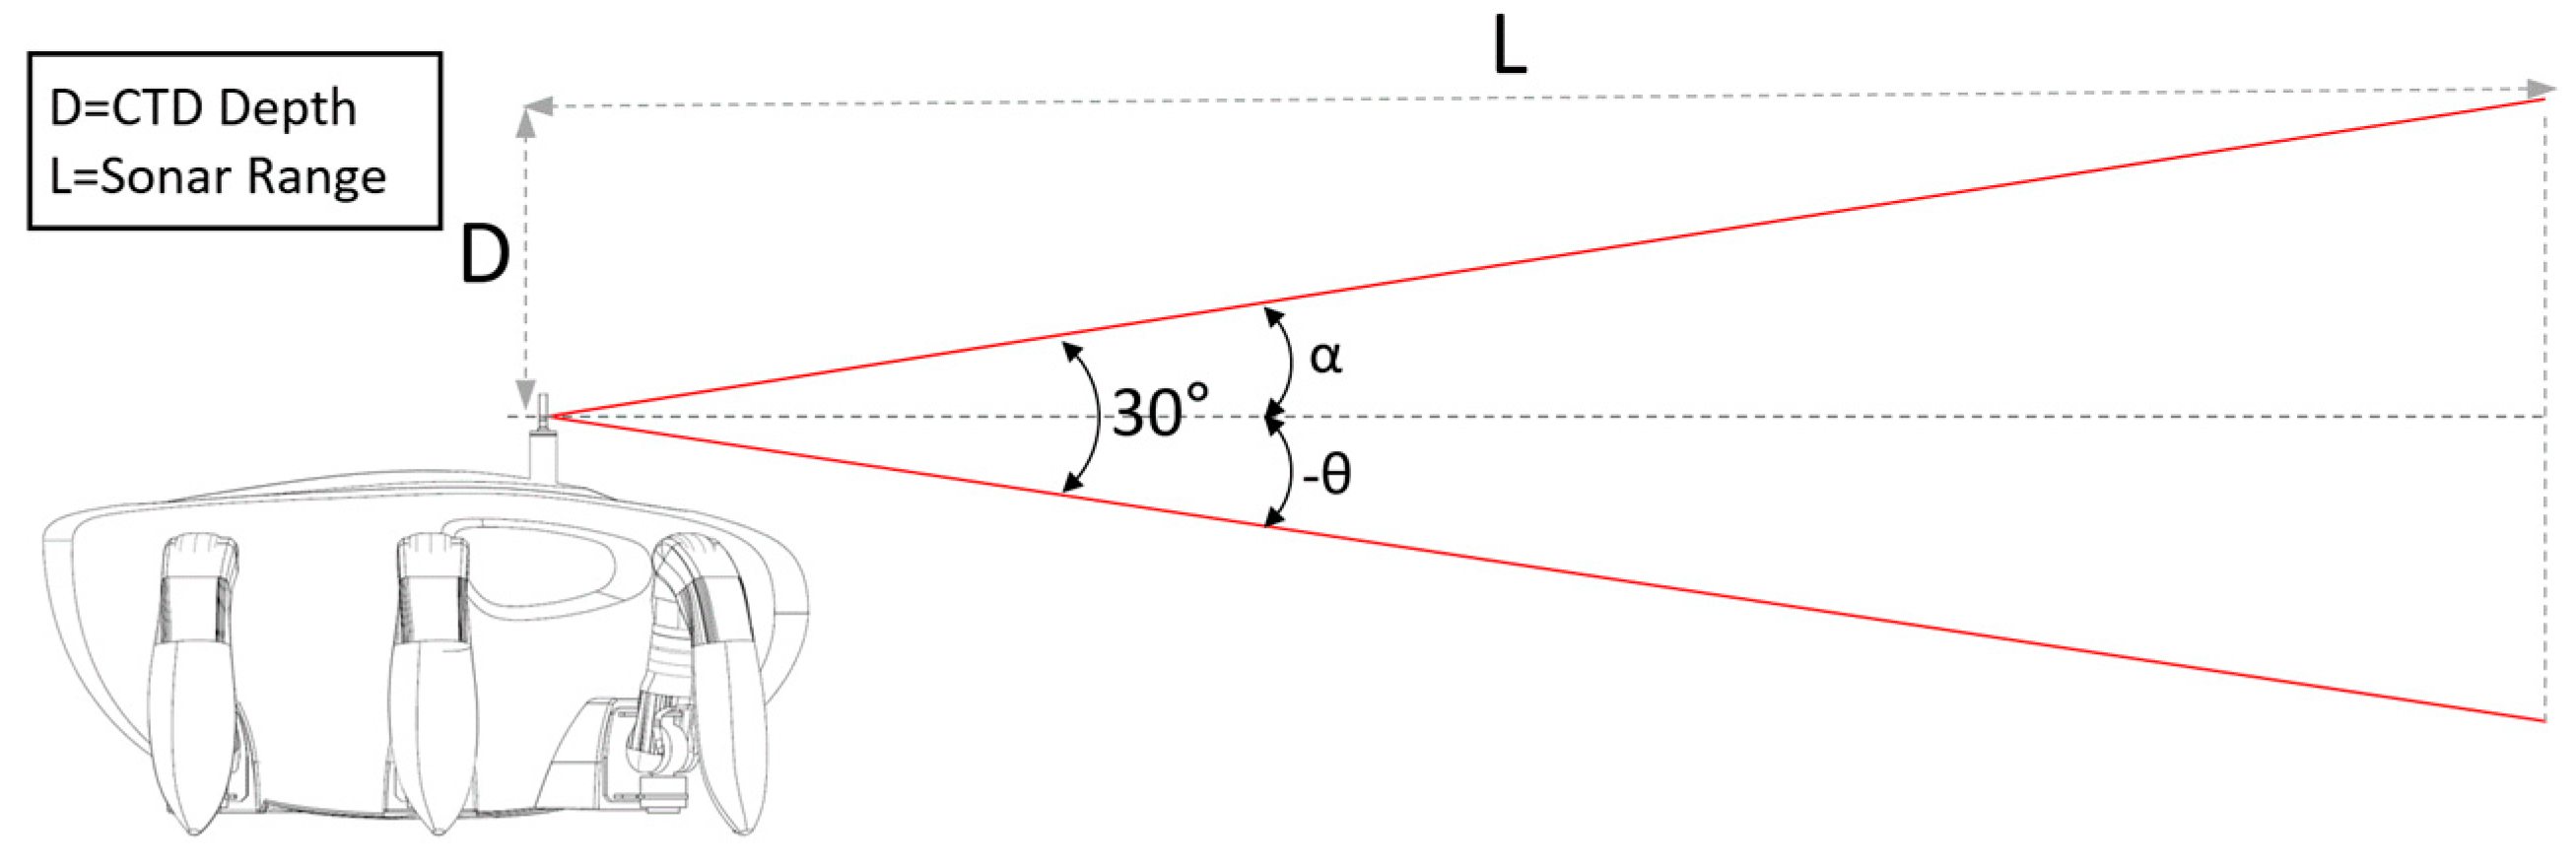
3.4. Controlling of the HHM Inclination Angle
According to reference [
25], the pitch angle, α, can be calculated by Equation (1), where D is a constant obtained by subtracting the altitude of CR200 from the water depth; this value can also be taken from the conductivity-temperature-depth (CTD) sensor. As shown in
Figure 11, the vertical beam angle of the sensor is 30°, and as described in
Section 2.2, the length is 25 m, which is useful to minimize noise as a result of multipath when the sonar range is 50 m. According to the equation, the α value can be calculated to avoid noise caused by multipath, which, depending on the change of the water depth and the resulting tilting angle, can be given to sonar and used as an input to the HHM inclination angle.
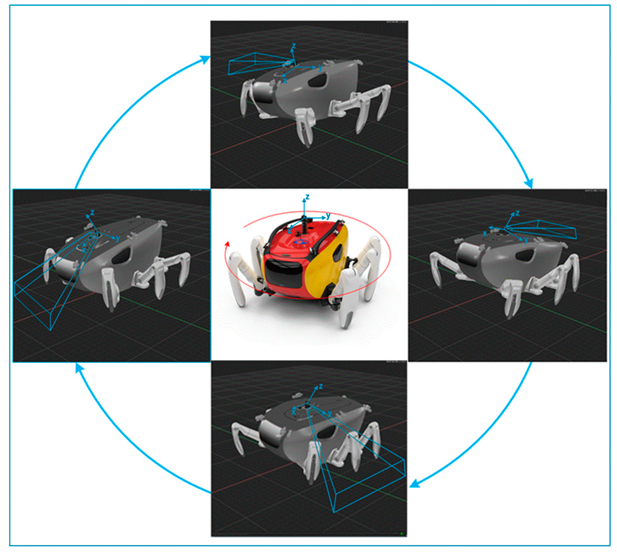
3.5. Kinematic Model of the CR200
The coordinate system of CR200 is shown in
Figure 12. The position vector of the end of the leg relative to the center of the body (
) to generate the desired displacement of the body position (
) can be obtained by the following equation [
28]:
where
is the transformation matrix from the body coordinate system to the end of the i-th leg coordinate system;
is a transformation matrix that takes into account the positional displacement (
) of the body-centered coordinate system viewed from a fixed coordinate system during posture transformation;
is a transformation matrix from the rotation coordinate system to the body coordinate system considering the rotation transformation (
) defined in the rotation coordinate system during the change of the body posture; the subscript
init represents the initial value. If we define sensor coordinates at the center of the scanning sonar header shown in
Figure 12, the end of the leg with respect to the sensor can be written as follows:
With the desired tilting angle displacement of the sensor head, the transformation matrix from the body coordinates to the end of the leg can be obtained by Equation (4). By controlling the body posture displacement with respect to the end of the legs, we get the desired posture displacement of the sensor head with respect to the fixed (ground) coordinates.
Figure 13 shows the results of a downward HHM simulation toward the center of the sensor head in the direction the sector-scanning sonar is scanning. We performed a water tank test to confirm the simulation results before the sea trial. This test was conducted in a facility at the KRISO (Korea Research and Institute of Ship and Ocean Engineering) and sonar images were acquired through the downward HHM function [
31].
4. Review of the Results of Acquisition Data from Sea Trial
In this section, we describe the sea trial and its results to verify the CR200 function discussed in
Section 3.1. The sea trial was conducted from 16 April to 15 May, 2015 [
33], in the Mado area, located in the West Sea of Korea, with a water depth of 4 to 6 m.
Figure 14 and
Figure 15 show the support barge and control room of the CR200. The size of the barge was 34 m by 14 m, and was capable of accommodating a crane for the launch and recovery of the CR200 and housing the control room. Because the region was an area where artifacts were being excavated, we randomly placed samples for testing and conducted a mission to explore and collect them.
4.1. Analysis of Acquired Sonar Images
Figure 16 shows a sector-scanning sonar image obtained in a horizontal position on 30 April, 2015. The sonar was run at a 50-meter operation range, a height of 1.6 m, and a step size of 0.225°. As seen in
Section 2, the structure on the sea surface and object in the seabed overlapped because of the shallow water depth. In the center of the image, the top of the CR200 is shown and, at 6 o’clock, the bottom of the support barge and two boats moored to the barge appeared. Other objects in the image are the four anchor lines of the barge and an octopus trap at 2 o’clock; a trace of the CR200 on the seabed can also be seen.
4.2. HHM Effect of CR200
Figure 17,
Figure 18 and
Figure 19 are sonar images obtained from the same location on 1 May, 2015.
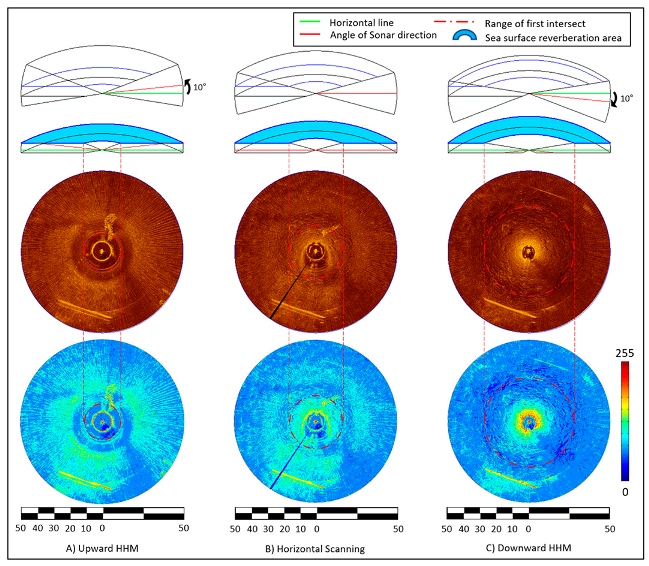
Figure 17 shows the result of the CR200 continuously applying an upward 10° HHM in the sonar head scanning direction during the sector-scanning sonar operation. The sonar was run with at a 50-meter operation range, a height of 1.6 m, a step size of 0.225°, and a water depth of 4 to 5 m. The radius of the vertical beam intersection is 5.14 m, as calculated by Equation (1), considering the water depth as 4 m; this is indicated by a white dotted line on the image. The first sea surface return appeared as a strong reflected signal, almost overlapping the white dotted line shown in the vertical beam intersection radius. The radial pattern, one of the sea surface reverberation noises, is generated by acoustic refraction [
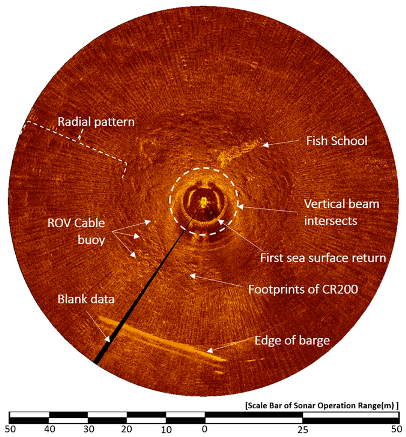
22]. With this radial pattern, the presence or absence of sea surface reverberation noise can be easily distinguished with the naked eye. The range of the radius is displayed at 10 o’clock, and the sea bottom reverberation image is hardly seen in most areas due to the radial pattern. From 6 to 8 o’clock, the ROV cable buoy on the surface and edge of the support barge can be seen, and 12 to 1 o’clock shows a school of fish, which was detected by volume reverberation noise.
Figure 17 presents another sonar image that the CR200 acquired in the horizontal position. The vertical beam intersections appear from a radius of 8.95, calculated from a depth of 4 m according to Equation (1). A footprint of CR200 can be seen, which was not seen in
Figure 16, and at 1 to 2 o’clock, a fish school, the volume reverberation, appears as well. The cable buoy of the ROV faded but was seen clearly in
Figure 16.
Figure 19 shows the result of the CR200 continuously applying a downward 10° HHM in the sonar head scanning direction during the sector-scanning sonar operation; conditions were the same as
Figure 17. According to Equation (1), the vertical beam intersection is 27.42 m at a water depth of 4 m, which is 18.47 m larger than when upward at 10° HHM. The radial pattern noise discerned by the naked eye was significantly reduced. In addition, the image of the seabed, which is bottom reverberation, appears in detail, showing the footprint of the CR200 right down the barge.
4.3. Decreases Slant Range Distortion
Figure 20 and
Figure 21 show images acquired on 1 May 2015, and illustrate the slant range distortion noise. The sonar was run at a 40-meter operation range, a height of 1.6 m, a step size of 0.225°, and at a water depth of 4 m. Since the bottom of the barge was located 0.8 m below the water level, it was quite close to the top of the sector-scanning sonar head. The distance between them was 1.6 m. The objects marked in white boxes were seen on the seafloor and are the footprints of CR200, the CR200 itself, and the mooring lines of the barge anchor; whereas the objects marked in yellow boxes were seen on the sea surface, they are the first sea-surface return signal, the hull of the barge, and other boats. The blue boxes mark deformation caused by slant range distortion.
Figure 21 shows the result of the CR200 continuously applying downward 6° HHM in the sonar head scanning direction during the sector-scanning sonar operation; conditions were the same as
Figure 20. The first sea surface return image shown in
Figure 20 disappeared and the footprints of CR200 are seen right under the barge. The image of a hull of a boat on the surface at 6 o’clock that was previously seen has also disappeared. This confirms that the HHM function is effective in avoiding slant range distortion caused by an object close to the sensor head of the CR200.
4.4. Image Synthesis Technique Using Differential Global Positioning System (DGPS)
As described in
Section 2.2, when a sector-scanning sonar survey is performed using a general ROV, it is difficult to acquire an image for the entire 360-degree direction, and there is a limit in maintaining the set direction and proceeding toward the target.
Figure 22 shows the results of the exploration of the seabed, based on the position of the differential global positioning system (DGPS) of the barge while the CR200 accumulated a detailed image of the seafloor, acquired by the downward HHM at a shallow water depth.
Figure 1 shows the first step to calculate the relative position of the CR200 using DGPS information for the A and B positions of the bottom of the barge. The next step was to synthesize images 2 and 3 one by one, and it was possible to operate in real-time, as shown in the screenshot of the Hypack’s navigation program. This operation suggests that it is possible to accurately measure the location of the seabed or the object on the seabed using only DGPS information of the underwater structure without an additional underwater location tracking system. Considering the deepwater depth case, both upward and downward HHMs were acquired at a fixed position; the former applies to the calculation of underwater sonar center positions, and the latter applies to the collection of submarine information. In this way, location measurements based on the DGPS information are possible in deep water.
4.5. Analysis of Experimental Results
We analyzed the difference between the effects of the upward, horizontal, and downward HHM using Equation (1), and
Table 3 displays the results. The vertical beam size of the sonar used in the analysis was calculated to be 30°, and it was assumed that there was no side lobe effect.
Table 3 shows the range of the first intersection and sea surface reverberation area at an operating range of 4 to 10 m water depth. When the sea surface reverberation area is 100% in the horizontal state, the ratio of the sea surface reverberation area to the HHM inclination angle is shown. The sensor operating radius used in the calculation of the table is 50 m, and the operating depth was the value obtained by subtracting the sensor head altitude value of 1.6 m. In particular, the multipath noise was generated when a range of the first intersection exists within the first half of the sonar operation range, as detailed in
Section 2.2. It can eliminate multipath and reduce sea surface reverberation by having it exist at a distance of more than 25 m. This is a fundamental improvement of the sonar image.
For a more specific example, when the sonar is being operated at a 4 m water depth in a horizontal attitude, the sea surface reverberation presents from a radius of 8.95 m. When this area is assumed to be 100%, the sea surface reverberation area of 28% is reduced for images acquired by applying the 10° downward HHM to avoid multipath.
Figure 23 visually shows the values in
Table 3. The X-axis is the angle of HHM and the Y-axis is the range of the first intersection. The 25-meter range is marked in red, and multipath noise was removed by selecting the angle of the HHM above the 25-meter crossing point in each depth graph.
Figure 24 shows the sonar images obtained from the experiments in
Section 4, and the applied 10° upward HHM, horizontal, and 10° downward HHM to the sonar from the left, respectively. Using the AutoCAD program, the interference area of the water surface was displayed as a blue donut on the top of the sonar image, and the sonar scanning angle was represented by a red line. The blue background image at the bottom shows the brightness of the sonar pixels divided into 0 to 255 color distributions. A radial pattern noise on the surface of the water can be seen, and it was also confirmed that the red color with the highest color intensity was concentrated on the seabed near the CR200 in the image with the 10° downward HHM applied (right image). It shows the improvement effect of the sonar image for the three different postures.
5. Conclusions
In this study, we proposed several strategies for use with the CR200 to acquire precise and efficient images through both the HHM and the control posture function of the CR200. To verify the strategies suggested, a sea trial was conducted to acquire the sonar image, and by analyzing the results from the sea trial, a positive result was confirmed.
Two main effects can be confirmed through the HHM function. First, it is a technology for selectively separating sea surface reverberation and sea bottom reverberation. If you want to see sea bottom reverberation, applying a downward HHM can reduce sea surface reverberation noise, multipath noise, and minimize slant range distortion. Second, the CR200 was able to acquire 360° omnidirectional images with one sector scanning sonar. Moreover, by applying the downward HHM, it was possible to minimize the shadow area and increase image acquisition efficiency.
The control posture function is a technology that provides attitude and position to the sonar under four environmental conditions (shallow water, regions with a strong current, an uneven sea bottom, or a sloped sea bottom) and in
Section 3.3, a previous study was introduced to replace the detailed explanation. This is a technology that allows the platform to move to the desired course while maintaining a certain altitude and heading.
The next study will be to improve the accuracy and efficiency of sensor data by linking the robot’s degrees of freedom to various marine measurement sensors. The technology described in this study is expected to be highly useful for mine search and identification in shallow water, the separation and acquisition of seabed and ice shelf data in polar exploration, detailed investigation of offshore structures, and search and investigation of wrecks and cultural heritage.
Author Contributions
Conceptualization, H.B. and B.-H.J.; methodology, H.B., B.-H.J., and M.D.N.; validation, H.B., B.-H.J., and M.D.N.; formal analysis, H.B. and B.-H.J.; investigation, H.B.; writing—original draft preparation, H.B. and B.-H.J.; writing—review and editing, B.H.J. and M.D.N.; visualization, H.B.; supervision, B.-H.J. and M.D.N.; funding acquisition, H.B. All authors have read and agreed to the published version of the manuscript.
Funding
This research was supported by a grant from the Endowment Project of “Development of core technologies of underwater robot ICT for polar under-ice-shelf exploration and remote monitoring” funded by the Korea Research Institute of Ships and Ocean engineering (PES3580).
Acknowledgments
I sincerely thank Mark W. Atherton and Brian Abbott for sharing their research materials and advice.
Conflicts of Interest
The authors declare no conflict of interest.
References
- Sutton, J.L. Underwater Acoustic Imaging. Proc. IEEE 1979, 67, 554–566. [Google Scholar] [CrossRef]
- Silva, S.R. Advances in SONAR Technology; IntechOpen: London, UK, 2009. [Google Scholar] [CrossRef]
- Royal, J. The Illyrian Coastal Exploration Program (2010-14): The Roman and Late-Roman Finds; Independently Published: Raleigh, NC, USA, 2018. [Google Scholar] [CrossRef]
- Blondel, P. The Handbook of Sidescan Sonar; Praxis Publishing: Chichester, UK, 2009. [Google Scholar] [CrossRef]
- Beveridge, A. Forensic Investigation of Explosions, 2nd ed.; CRC Press: Boca Raton, FL, USA, 2012; pp. 236–239. [Google Scholar]
- Ruiz, I.T.; Lane, D.M.; Chantler, M.J. A Comparison of Inter-frame Feature Measures for Robust Object Classification in Sector Scan Sonar Image Sequences. IEEE J. Ocean. Eng. 1999, 24, 458–469. [Google Scholar] [CrossRef][Green Version]
- Chew, J.L.; Chitre, M. Object Detection with Sector Scanning Sonar. In Proceedings of the Oceans’13 MTS/IEEE, San Diego, CA, USA, 23–27 September 2013. [Google Scholar] [CrossRef]
- Gross, P.; Andrew, P. The Application of Sector Scanning Sonar and Multibeam Imaging Sonar for Underwater Security. In Proceedings of the OCEANS 2007, Vancouver, BC, Canada, 29 September–4 October 2007. [Google Scholar] [CrossRef]
- Waite, A.D. Sonar for Practising Engineers, 3rd ed.; John Wiley & Sons: West Sussex, UK, 2002. [Google Scholar]
- Caruthers, J.W. Chapter 8 Reverberation. In Fundamentals of Marine Acoustics; Elsevier Scientific Publishing Company: Amsterdam, The Netherlands; pp. 113–124.
- Eyring, C.F.; Christensen, R.J.; Raitt, R.W. Reverberation in the Sea. J. Acoust. Soc. Am. 1948, 20, 415–422. [Google Scholar] [CrossRef]
- Lo, K.W.; Ferguson, B.G. Automatic Detection and Tracking of a Small Surface Watercraft in Shallow Water using a High-Frequency Active Sonar. IEEE Trans. Aerosp. Electron. Syst. 2004, 40, 1377–1388. [Google Scholar] [CrossRef]
- Furusawa, M.; Tang, Y. Sea Bottom and Surface Reverberations in Scanning Sonar. In Proceedings of the Oceans ‘04 MTS/IEEE Techno-Ocean ’04, Kobe, Japan, 9–12 November 2004. [Google Scholar] [CrossRef]
- Mio, K.; Chocheyras, Y.; Doisy, Y. Space time adaptive processing for low frequency sonar. In Proceedings of the OCEANS 2000 MTS/IEEE Conference and Exhibition, Conference Proceedings, Providence, RI, USA, 11–14 September 2000; pp. 1315–1319. [Google Scholar] [CrossRef]
- Song, H.C.; Kim, S.; Hodgkiss, W.S.; Kuperman, W.A. Environmentally adaptive reverberation nulling using a time reversal mirror. J. Acoust. Soc. Am. 2004, 116, 762–768. [Google Scholar] [CrossRef]
- Song, H.C.; Hodgkiss, W.S.; Kuperman, W.A.; Roux, T.A.; Stevenson, M. Experimental demonstration of adaptive reverberation nulling using time reversal. J. Acoust. Soc. Am. 2005, 118, 1381–1387. [Google Scholar] [CrossRef]
- Song, H.C.; Hodgkiss, W.S.; Kuperman, W.A.; Sabra, K.G.; Akal, T. Passive Reverberation Nulling for Target Enhancement. J. Acoust. Soc. Am. 2007, 122, 3296–3303. [Google Scholar] [CrossRef] [PubMed]
- Ginolhac, G.; Jourdain, G. Detection in present of reverberation. In Proceedings of the OCEANS 2000 MTS/IEEE Conference and Exhibition, Providence, RI, USA, 11–14 September 2000; pp. 1043–1046. [Google Scholar] [CrossRef]
- Ginolhac, G.; Jourdain, G. Principal Component Inverse Algorithm for Detection in the Presence of Reverberation. IEEE J. Ocean. Eng. 2002, 27, 523–526. [Google Scholar] [CrossRef]
- Cong, F.; Hu, Y.; Shi, X.; Chen, C.H.; Lin, L. Blind signal separation and Reverberation Canceling with active Sonar Data. In Proceedings of the Eighth International Symposium on Signal Processing and Its Applications, Sydney, Australia, 28–31 August 2005; pp. 523–526. [Google Scholar] [CrossRef]
- Xu, C.; Zhang, X.; Xu, Z. Detection in present of reverberation Combined with Blind Source Separation and Beamforming. In Proceedings of the 2010 2nd International Conference on Advanced Computer Control, Shenyang, China, 27–29 March 2010; pp. 158–162. [Google Scholar] [CrossRef]
- Atherton, M.W. Echoes and Images, in the Encyclopedia of Side-Scan and Scanning Sonar Operations; OysterInk Publications: Vancouver, BC, Canada, 2011. [Google Scholar]
- Baek, H.; Park, J.Y.; Shim, H.; Jun, B.H.; Lee, P.M. Operational Improvement of Hemire ROV for Deep-sea Survey and Application to Exploration of Ferromanganese Crusts of Wester Pacific Seamount. J. Ocean Eng. Technol. 2018, 32, 287–295. [Google Scholar] [CrossRef]
- Lee, P.M.; Jun, B.H.; Baek, H.; Kim, B.; Shim, H.; Park, J.Y.; Yoo, S.; Jeong, W.Y.; Baek, S.; Kim, W.S. Explorations of Hydrothermal Vents in Southern Mariana Arc Submarine Volcanoes using ROV Hemire. J. Ocean Eng. Technol. 2016, 30, 389–399. [Google Scholar] [CrossRef]
- Baek, H.; Jun, B.H.; Park, J.Y.; Kim, B.R.; Lee, P.M. Application of High Resolution Scanning Sonar with Multi-Legged Underwater Robot. In Proceedings of the Oceans’13 MTS/IEEE, San Diego, CA, USA, 23–27 September 2013. [Google Scholar] [CrossRef]
- Jun, B.H.; Shim, H.; Kim, B.H.; Park, J.Y.; Baek, H.; Yoo, S.; Kang, H.; Lee, G.M.; Lee, P.M. First Field-Test of Seabed Walking Robot CR200. In Proceedings of the 2013 Oceans—San Diego, San Diego, CA, USA, 23–27 September 2013. [Google Scholar] [CrossRef]
- Jun, B.H.; Shim, H.; Park, J.Y.; Kim, B.; Lee, P.M. A New Concept and Technologies of Multi-Legged Underwater Robot for High Tidal Current. In Proceedings of the 2011 IEEE Symposium on Underwater Technology and Workshop on Scientific Use of Submarine Cables and Related Technologies, Tokyo, Japan, 5–8 April 2011. [Google Scholar] [CrossRef]
- Shim, H.; Yoo, S.; Lee, G.M.; Baek, H.; Jun, B.H. Posture and Walking Control Method of CR200 for Precise Underwater Exploration. In Proceedings of the Korean Marine Robot Technology Society, Changwon, Korea, 13 September 2013; pp. 114–118. [Google Scholar]
- Park, J.Y.; Shim, H.W.; Baek, H.; Yoo, S.; Jun, B.H.; Lee, P.M. Multi-legged ROV Crabster and an acoustic camera for survey of underwater cultural heritages. In Proceedings of the Oceans 2015—MTS/IEEE Washington, Washington, DC, USA, 19–22 October 2015. [Google Scholar] [CrossRef]
- Park, J.Y.; Lee, G.M.; Shim, H.W.; Baek, H.; Lee, P.M.; Jun, B.H. Head Alignment of a Single-beam Scanning SONAR installed on a Multi-legged Underwater Robot. In Proceedings of the MTS/IEEE OCEANS 2012, Hampton Roads, VA, USA, 14–19 October 2012. [Google Scholar] [CrossRef]
- Yoo, S.; Jun, B.H.; Shim, H.W.; Park, J.Y.; Baek, H.; Kim, B.H.; Lee, G.M.; Kang, H.; Jeong, W.Y.; Baek, S.H.; et al. Preliminary Water Tank Test of a Multi-legged Underwater Robot for Seabed Explorations. In Proceedings of the Oceans 2015—MTS/IEEE Washington, Washington, DC, USA, 19–22 October 2015. [Google Scholar] [CrossRef]
- Baek, H.; Yoo, S.; Jun, B.H. Application of Scanning Sonar using Multi-Legged Underwater Robot’s Degree of Freedom. In Proceedings of the Oceans 2015—MTS/IEEE Washington, Washington, DC, USA, 19–22 October 2015. [Google Scholar] [CrossRef]
- Jun, B.H.; Lee, P.M.; Jung, Y.H. Experience on Underwater Artefact Search Using Underwater Walking Robot Crabster CR200. In Proceedings of the Oceans 2015—MTS/IEEE Washington, Washington, DC, USA, 19–22 October 2015. [Google Scholar] [CrossRef]
Figure 1.
General sector-scanning sonar image acquisition methods: (a) Horizontal image acquired by tripod deployment; (b) Vertical image acquired by pole-mount deployment.
Figure 1.
General sector-scanning sonar image acquisition methods: (a) Horizontal image acquired by tripod deployment; (b) Vertical image acquired by pole-mount deployment.
Figure 2.
Sector-scanning sonar acoustic coverage [
22].
Figure 2.
Sector-scanning sonar acoustic coverage [
22].
Figure 3.
Multipath as seen in the sonar image.
Figure 3.
Multipath as seen in the sonar image.
Figure 4.
Influence of sea surface reverberation [
25].
Figure 4.
Influence of sea surface reverberation [
25].
Figure 5.
Disadvantages of the tripod with a gimbal in a strong current.
Figure 5.
Disadvantages of the tripod with a gimbal in a strong current.
Figure 6.
Slant range distortion.
Figure 6.
Slant range distortion.
Figure 7.
Sector-scanning sonar application of a work-class remotely operated vehicle (ROV).
Figure 7.
Sector-scanning sonar application of a work-class remotely operated vehicle (ROV).
Figure 8.
Two main functions of the CRABSTER (CR200) for the acquisition of efficient and precise seabed images.
Figure 8.
Two main functions of the CRABSTER (CR200) for the acquisition of efficient and precise seabed images.
Figure 9.
Equipment configuration of CR200.
Figure 9.
Equipment configuration of CR200.
Figure 10.
Tilt angle adjustment to the sector-scanning sonar concept for the CR200 [
25].
Figure 10.
Tilt angle adjustment to the sector-scanning sonar concept for the CR200 [
25].
Figure 11.
Hula hoop motion (HHM) inclination angle of the scanning sonar.
Figure 11.
Hula hoop motion (HHM) inclination angle of the scanning sonar.
Figure 12.
The coordinate system of the CR200 and installation of the scanning sonar [
32].
Figure 12.
The coordinate system of the CR200 and installation of the scanning sonar [
32].
Figure 13.
Simulation results of the downward HHM [
32].
Figure 13.
Simulation results of the downward HHM [
32].
Figure 14.
CR200 system on the barge.
Figure 14.
CR200 system on the barge.
Figure 15.
Inside of the control and power van.
Figure 15.
Inside of the control and power van.
Figure 16.
Sonar image of the CR200 in the first sea trial [
32].
Figure 16.
Sonar image of the CR200 in the first sea trial [
32].
Figure 17.
Result image of the 10° upward HHM.
Figure 17.
Result image of the 10° upward HHM.
Figure 18.
Result image of the horizontal posture.
Figure 18.
Result image of the horizontal posture.
Figure 19.
Result image of the 10° downward HHM.
Figure 19.
Result image of the 10° downward HHM.
Figure 20.
Horizontal sonar image under the support barge.
Figure 20.
Horizontal sonar image under the support barge.
Figure 21.
The 6° downward HHM sonar image under the support barge.
Figure 21.
The 6° downward HHM sonar image under the support barge.
Figure 22.
Application of the sonar mosaic image using the differential global positioning system (DGPS) information [
32].
Figure 22.
Application of the sonar mosaic image using the differential global positioning system (DGPS) information [
32].
Figure 23.
Correlation between the angle of HHM and sonar operation range.
Figure 23.
Correlation between the angle of HHM and sonar operation range.
Figure 24.
Comparison of scanning images and diagrams of surface reverberation zones according to each HHM [
32].
Figure 24.
Comparison of scanning images and diagrams of surface reverberation zones according to each HHM [
32].
Table 1.
Specifications of sector-scanning sonar.
Table 1.
Specifications of sector-scanning sonar.
| Model | 1171 High-Resolution Scanning Sonar |
|---|
| Depth rating | 3000 m |
| Frequency | 675 kHz |
| Beam width | 0.9° × 30°~ Fan | 1.7° × 1.7° Cone |
| Range | 0.5–100 m |
| Range resolution | ≥19 mm |
| Scan speed | 11 s/360° @ 10 m & 1.8° step
36 s/360° @ 100 m & 1.8° step |
| Scan Width | 360° continuous |
| Step size | ≥0.225° |
| Pulse lengths | 25–2500 µs |
| Power | 33 W, 22–60 VDC (voltage direct current) |
Table 2.
Specification of the CR200.
Table 2.
Specification of the CR200.
| Parameter | Value |
|---|
| Size [m] | 2.42 (L) × 2.45 (W) × 1.16 (H) |
Weight [Kg]
Frame weight [Kg] | 682 (air)/188 (water)
62 |
| Max. ground clearance [m] | Over 0.5 |
| Number of legs | 6 |
| Max. walking speed [m/s] | 0.5 |
| Max. depth of water [m] | 200 |
| Max. endurable current [m/s] | 3 |
| Power supply [V] | 150–190 (DC) |
Table 3.
Correlation between the angle of HHM and sonar operation range.
Table 3.
Correlation between the angle of HHM and sonar operation range.
| Motion | Upward HHM | Horizontal | Downward HHM |
|---|
| Degree | 10 | 8 | 6 | 4 | 2 | 0 | 2 | 4 | 6 | 8 | 10 |
|---|
| 4 m | Range of first intersect (m) | 5.14 | 5.65 | 6.25 | 6.97 | 7.85 | 8.95 | 10.39 | 12.34 | 15.15 | 19.54 | 27.42 |
| Sea surface reverberation area (m2) | 7766 | 7749 | 7727 | 7697 | 7656 | 7597 | 7510 | 7129 | 6650 | 5487 | 1262 |
| Percentage of Area (%) | 102 | 101 | 101 | 101 | 100 | 100 | 98 | 97 | 93 | 87 | 72 |
| 5 m | Range of first intersect (m) | 7.29 | 8.00 | 8.85 | 9.87 | 11.12 | 12.69 | 14.72 | 17.48 | 21.46 | 27.68 | 38.85 |
| Sea surface reverberation area (m2) | 7683 | 7648 | 7603 | 7543 | 7461 | 7344 | 7169 | 6889 | 6403 | 5442 | 3108 |
| Percentage of Area (%) | 104 | 104 | 103 | 102 | 101 | 100 | 97 | 93 | 87 | 74 | 42 |
| 6 m | Range of first intersect (m) | 9.43 | 10.36 | 11.46 | 12.77 | 14.39 | 16.42 | 19.05 | 22.63 | 27.77 | 35.83 | 50.28 |
| Sea surface reverberation area (m2) | 7570 | 7512 | 7437 | 7337 | 7199 | 7002 | 6709 | 6241 | 5427 | 3818 | −89 |
| Percentage of Area (%) | 108 | 107 | 106 | 104 | 102 | 100 | 95 | 89 | 77 | 54 | −1 |
| 7 m | Range of first intersect (m) | 11.58 | 12.72 | 14.06 | 15.68 | 17.66 | 20.15 | 23.38 | 27.77 | 34.09 | 43.97 | 61.71 |
| Sea surface reverberation area (m2) | 7428 | 7341 | 7228 | 7077 | 6870 | 6574 | 6132 | 5427 | 4200 | 1778 | −4109 |
| Percentage of Area (%) | 122 | 121 | 119 | 116 | 113 | 100 | 101 | 89 | 69 | 29 | −67 |
| 8 m | Range of first intersect (m) | 13.72 | 15.07 | 16.67 | 18.58 | 20.93 | 23.88 | 27.71 | 32.92 | 40.40 | 52.11 | 73.14 |
| Sea surface reverberation area (m2) | 7258 | 7136 | 6977 | 6765 | 6473 | 6057 | 5437 | 555+ | 2723 | −678 | −8948 |
| Percentage of Area (%) | 119 | 117 | 115 | 111 | 106 | 100 | 89 | 73 | 44 | −11 | −147 |
| 9 m | Range of first intersect (m) | 15.86 | 17.43 | 19.27 | 21.49 | 24.20 | 27.62 | 32.04 | 38.06 | 46.71 | 60.26 | 84.57 |
| Sea surface reverberation area (m2) | 7059 | 6895 | 6683 | 6399 | 6010 | 5454 | 4624 | 3300 | 996 | −3552 | −14608 |
| Percentage of Area (%) | 116 | 113 | 110 | 105 | 99 | 100 | 76 | 54 | 16 | −58 | −241 |
| 10 m | Range of first intersect (m) | 18.01 | 19.78 | 21.88 | 24.39 | 27.47 | 31.35 | 36.37 | 43.20 | 53.03 | 68.40 | 96 |
| Sea surface reverberation area (m2) | 6831 | 6620 | 6346 | 5980 | 5479 | 4762 | 3694 | 1987 | −980 | −6842 | −21088 |
| Percentage of Area (%) | 143 | 138 | 133 | 125 | 115 | 100 | 77 | 41 | −20 | −143 | −442 |
© 2020 by the authors. Licensee MDPI, Basel, Switzerland. This article is an open access article distributed under the terms and conditions of the Creative Commons Attribution (CC BY) license (http://creativecommons.org/licenses/by/4.0/).


