Ultrasound Measurement of Skeletal Muscle Contractile Parameters Using Flexible and Wearable Single-Element Ultrasonic Sensor


1
Department of Systems and Computer Engineering, Carleton University, Ottawa, ON K1S 5B6, Canada
2
Department of Medical Equipment Technology, Majmaah University, Majmaah 11952, Saudi Arabia
*
Author to whom correspondence should be addressed.
Sensors 2020, 20(13), 3616; https://doi.org/10.3390/s20133616
Submission received: 10 May 2020
/
Revised: 17 June 2020
/
Accepted: 23 June 2020
/
Published: 27 June 2020
(This article belongs to the Section Wearables)
Abstract
:Skeletal muscle is considered as a near-constant volume system, and the contractions of the muscle are related to the changes in tissue thickness. Assessment of the skeletal muscle contractile parameters such as maximum contraction thickness (), contraction time (), contraction velocity (), sustain time (), and half-relaxation () provides valuable information for various medical applications. This paper presents a single-element wearable ultrasonic sensor (WUS) and a method to measure the skeletal muscle contractile parameters in A-mode ultrasonic data acquisition. The developed WUS was made of double-layer polyvinylidene fluoride (PVDF) piezoelectric polymer films with a simple and low-cost fabrication process. A flexible, lightweight, thin, and small size WUS would provide a secure attachment to the skin surface without affecting the muscle contraction dynamics of interest. The developed WUS was employed to monitor the contractions of gastrocnemius (GC) muscle of a human subject. The GC muscle contractions were evoked by the electrical muscle stimulation (EMS) at varying EMS frequencies from 2 Hz up to 30 Hz. The tissue thickness changes due to the muscle contractions were measured by utilizing a time-of-flight method in the ultrasonic through-transmission mode. The developed WUS demonstrated the capability to monitor the tissue thickness changes during the unfused and fused tetanic contractions. The tetanic progression level was quantitatively assessed using the parameter of the fusion index (FI) obtained. In addition, the contractile parameters (, , , , and ) were successfully extracted from the measured tissue thickness changes. In addition, the unfused and fused tetanus frequencies were estimated from the obtained FI-EMS frequency curve. The WUS and ultrasonic method proposed in this study could be a valuable tool for inexpensive, non-invasive, and continuous monitoring of the skeletal muscle contractile properties.
1. Introduction
The analysis of the skeletal muscle mechanical characteristics is of great interest for a wide range of medical applications. The measurement of changes in the muscle physical parameters during contractions provides valuable information. For instance, the assessment of muscle helps in investigating the muscle fatigue [1,2], diagnosing the neuromuscular diseases [3,4], evaluating the progression of treatment and rehabilitation [5,6,7], evaluating the efficiency and effectiveness of physical training [6], estimating the injury risks [8,9], and controlling the prosthetic devices [10,11,12,13]. The skeletal muscle is considered as a near-constant volume system; therefore, the changes in muscle length due to contractions are paralleled by the changes in muscle thickness [9,14]. Monitoring of the change in muscle thickness during contractions would be a useful tool to assess the muscle contractile properties [9,15]. Several studies have provided evidence that the relative changes of the muscle contractile parameters were associated with the skeletal muscle atrophy [16,17], the percentage of muscle fiber types [18,19], general and local muscle fatigue [9,20,21,22,23,24,25], and muscle force production [26,27,28]. Various measurement techniques have been explored and employed for the assessment of muscle functions. The common non-invasive methods include surface electromyography (SEMG), mechanomyography (MMG), and ultrasound imaging.
SEMG is a conventional modality to monitor muscle activity and has been extensively used as a gold standard for assessing muscle electrical parameters for decades [29]. The signal of SEMG represents the sum of the electrical activities generated by the muscles located near the biopotential electrodes attached to the skin surface. The increase of contraction force is a result of the increase of the motor unit recruitment and the firing frequency of activated motor units [30]. The quantification of the muscle mechanical parameters from the SEMG signal has some limitation due to the relationship complexity between the biological electrical signal and the mechanical activity of the muscles, especially for a deeper muscle as the SEMG detects the electrical activity of muscles located near the electrodes [29,31,32]. SEMG measures the muscle electrical activity, but might not provide the direct measurement of the muscle mechanical function [33].
MMG is the measurement of the muscle mechanical activity at the skin surface that results from the voluntary or electrically evoked contraction [33,34,35]. There are several types of sensors employed in the MMG measurement technique such as: piezoelectric sensors, microphones, accelerometers, and laser distance sensors [9,35,36,37]. Piezoelectric contact sensors and microphones are mechanically coupled to the skin surface near the muscle of interest, usually using an elastic band or external support to measure skin surface displacement or vibration [38,39,40]. Accelerometers detect the local motion at the skin surface due to the muscle contraction by measuring the acceleration in one or more axes of the motion directions [41,42,43,44]. Laser displacement sensors (LDS) are a non-contact sensor that measures the distance between the laser-beam head and the skin surface above the muscle of interest [36]. LDS allows a high-resolution measurement of the skin surface displacement due to the muscle contraction [45,46,47,48]. In the MMG measurement, the motion artifacts could be resulted from the sensor lateral displacement at the skin surface and/or the bulk motion of the limb/body where the MMG sensors are attached [49,50]. In addition, the investigations of MMG measurement reliability were reported by [42,43,51,52,53,54,55].
As one of the MMG methods, tensiomyography (TMG) was developed to quantify the muscle contractile properties by measuring the muscle radial displacement during the electrically evoked muscle contraction [15]. The TMG performs the examination of the electrically evoked contractions and exclusively through isometric contraction [56]. The TMG method employs a high-precision displacement sensor. The displacement sensor tip is pressed onto the skin surface with a controlled pre-tension while the sensor body is attached to a fixed support [18]. TMG sensor measures the displacements of the skin surface due to the electrically evoked muscle twitch. Thus, the TMG directly measures the skin surface displacement [57]. The displacement–time curve could be further analyzed to extract the contractile parameters such as maximum muscle displacement, contraction time, sustain time, and relaxation time. During the TMG measurement, the subject is required to be still on the examination table to minimize the limb or body movements in order to reduce the motion artifacts in the measurement [58]. The TMG has gained popularity in recent years as a quantitative and consistent tool for the assessment of the muscle contractile properties among the other MMG methods [9,59].
Ultrasound could provide real-time dynamic images of the internal tissue structure, including skeletal muscles, non-invasively with high spatial and temporal resolutions [60]. This allows a measurement of the internal tissue thickness even for deeper muscle [61,62]. Ultrasound imaging has been widely used in the assessment of skeletal muscle function and tracking the muscle thickness changes during static and dynamic contractions [61,63,64,65,66,67,68,69,70,71,72,73,74,75,76,77]. These studies were based on B-mode ultrasound images captured by a clinical ultrasound imaging system with an ultrasound imaging probe composed of multiple-element piezoelectric ultrasonic transducer (UT). A bulky size of the ultrasonic probe may cause undesired motion over the skin surface during the muscle contraction, especially in that involving limb movement [65,69,72,78]. Such an undesired probe motion could cause an inaccurate estimation of the underlying tissue thickness. A special zig or holder was often used to attach the ultrasonic probe steadily on the desired location to monitor the muscle of interest. However, the pressure exerted on the skin surface by the ultrasonic probe weight and/or the attachment method would restrict the underlying tissue’s natural motion and muscle contraction [79].
Instead of B-mode ultrasound imaging, A-mode ultrasound measurement using a single-element UT made of piezoceramic was proposed as a cost-effective and wearable alternative for the ultrasonic measurement of the muscle thickness changes [80]. A-mode measurement is one-dimensional along the tissue depth and capable of measuring the tissue thickness with a single-element UT [81,82]. Thus, the A-mode single-element UT can be made into a smaller size, which could make the UT attachment more accessible and stable at the desired location on the skin surface. The work of Guo et al. [80,83] might be one of the earliest studies using a single-element UT for tracking the thickness changes during the skeletal muscle contraction. They demonstrated the tracking of the extensor carpi radialis muscle that controls the movement at the wrist. The ultrasonic measurement in their result showed a higher accuracy of tracking the wrist extension in comparison to the SEMG measurement. The study by Sun et al. [84] showed that the single-element UT, that was developed by Hettiarachchi et al. [85], could effectively assess muscle fatigue from the measured muscle thickness changes. Yang et al. [75,86] presented the finger motion prediction from A-mode ultrasound signals using single-element UTs. These studies demonstrated the feasibility of using the A-mode UTs for tracking the muscle motion and thickness changes during contraction. The single-element UTs employed in the above-mentioned studies [75,80,84,86,87] were made of piezoelectric ceramic which is a rigid and inflexible material. The piezoelectric ceramics such as lead zirconate titanate (PZT) are commonly used as a UT material due to their superior electromechanical performance. Therefore, the issue of inconsistent placement of the single-element UTs to the skin may still persist. Guo et al. [80,83] indicated in their work that the ultrasonic tracking errors increased when the dynamic movement of the wrist joint extension increased from 20 to 50 cycle/min. In addition, Shahshahani et al. [87] noted that the placement of a single-element UT was challenging to track the diaphragm wall motion for the respiratory activity monitoring. The single-element UT could be placed firmly on the skin surface using a body-worn band. However, this approach might introduce inevitable compression to the local muscles and may affect their contraction/relaxation behavior.
Comparing with the rigid UTs, a flexible, thin, and lightweight UT may have an advantage for UT attachment to the skin surface since it could be conformably attached to the curved skin surface. The microelectromechanical system (MEMS) technology has recently emerged for fabricating a relatively flexible UT array for medical imaging. Yang et al. [88] and Wang et al. [89] introduced fabricated piezoelectric micromachined (PMUT) arrays by mounting diced PZT piezoceramic into patterned cavities on a flexible polyimide film. Similarly, Mastronardi et al. [90] and Sun et al. [91] used aluminum nitride (AlN) as a piezoelectric material instated of PZT, to be embedded onto a flexible polyimide substrate, enabling more flexible and thinner PMUT. Singh et al. [92], Sadeghpour et al. [93], and Hu et al. [94] exploited the island-bridge technique by mounting small pieces of PZT elements into a microfabricated array of silicon islands that were connected with flexible polyamide joints. Cheng et al. [95] and Chong et al. [96] fabricated a flexible UT array based on capacitive micromachined (CMUT) using a concave bottom electrode. In addition, Gerardo et al. [97] described a method to reduce the fabrication cost for CMUT using polymeric materials that have the potential of fabricating a flexible CMUT.
Several studies examined the wearable and flexible UTs for tracking the internal tissue motion on human subjects. Lanata et al. [98] presented the monitoring of the heart wall motion using a wearable UT. The piezoelectric transducer was based on the flexible polyvinylidene fluoride (PVDF) polymer, which was integrated into a flexible belt wrapped around the chest. Their results showed the potential for the continuous monitoring of the cardiopulmonary activity. Wang et al. [99] demonstrated the monitoring of blood pressure by measuring the arterial wall motion using a stretchable and thin UT [94]. Their stretchable UT offers the capability of measuring human tissue up to a depth of 4 cm, and they demonstrated the estimation of the blood pressure at the carotid, brachial, radial, and pedal arteries using the ultrasonic wall-tracking technique.
The aim of this study is to investigate the feasibility of the developed single-element wearable ultrasonic sensor (WUS) for assessing the contractile parameters of electrically evoked skeletal muscle in A-mode ultrasound measurement. The WUS was made of polymer piezoelectric PVDF film due to its flexibility and low-cost fabrication process for the WUS. The low-cost and simple fabrication process allows the WUS to be disposable, which could be beneficial for medical applications. Monitoring of the electrically evoked skeletal muscle contractions, tetanic contraction progression, and the extraction of the muscle contractile parameters were demonstrated using the developed WUS.
2. Methodology
We have been developing a flexible and wearable ultrasonic sensor made of the PVDF polymer piezoelectric film [100,101]. The PVDF piezoelectric film offers mechanical flexibility, thinness, broadband response, and the close matching acoustic impedance to the biological soft tissue, which are suitable features for an ultrasonic sensor to perform continuous monitoring of the tissue motion. However, the PVDF has inherent disadvantages of the relatively weak piezoelectric effect, low dielectric constant, high dielectric loss, and low electromechanical coupling coefficient, compared to piezoelectric ceramics, which causes a poor signal-to-noise ratio (SNR) of the received ultrasonic signals reflected from deeper tissue boundaries or propagated in thicker tissue. One approach to improve the ultrasonic pulse strength of the PVDF WUS is to employ the multiple-layer PVDF films design [101,102,103]. Hence, for the experiments conducted in this study, we have designed and constructed the WUSs using double-layer PVDF films as described in Section 2.1.
In our previous works, the developed WUS measurement capability was successfully demonstrated in monitoring the tissue thickness changes up to the depth of 34 mm due to the muscle contraction in the ultrasonic pulse-echo (PE) mode [101,104,105,106,107,108]. Furthermore, cardiac motion at the tissue depth of 30 mm was successfully monitored by the WUS [101]. In this study, we would like to investigate the feasibility of the ultrasonic method for monitoring a thicker soft tissue (greater than 100 mm) and assess the skeletal muscle contractile parameters using the developed double-layer PVDF WUSs in the ultrasonic through-transmission (TT) mode.
In the PE mode, ultrasound travels twice the distance (round trip) of the measured tissue thickness since the ultrasound is transmitted and received by the same WUS. While the TT mode uses two WUSs, the ultrasound just travels from the transmitter WUS to the receiver WUS making a single trip. Since ultrasound attenuates during the propagation within the tissue due to the absorption, scattering, and/or diffraction, the TT mode has an advantage for the measurement of a thick tissue as it exhibits a superior SNR in comparison with the PE mode. Indeed, we were not able to observe the target ultrasound signals to measure the total thickness of the lower leg in the PE mode under our experimental configuration described in Section 2.2.
The detail of WUS design and construction is given in Section 2.1. The developed WUSs were attached to the lower leg of a human subject to monitor the gastrocnemius (GC) muscle contraction, as explained in Section 2.2. The experiments were conducted with one healthy human subject (male, age 32) as a feasibility study to verify the proof of concept of the proposed WUSs and measurement method of muscle contractile parameters. The GC muscle was evoked by electrical muscle stimulation (EMS), and the tissue thickness changes were continuously measured in order to estimate the muscle contractile parameters. The subject gave the informed consent for inclusion before participating in the study. The study was conducted in accordance with the protocol approved by the Carleton University’s Research Ethics Board-B (protocol # 10496 12-0382).
2.1. Wearable Ultrasonic Sensor
The WUS was constructed using basic equipment and ordinary hand tools, such as scalpels and soldering device, and did not require advanced technology such as microfabrication processing and equipment used in MEMS-based UT fabrication [88,89,90,92,96]. The piezoelectric PVDF film was chosen to construct the WUS operated in the thickness mode. When an alternating voltage is applied along the thickness direction of the PVDF film, the thickness of the PVDF film increases and decreases periodically according to the frequency of the alternative voltage applied, which will lead to generation of ultrasound waves and vice versa for detection of ultrasound waves [109]. The WUS design consisted of multiple layers, as shown in the schematic of Figure 1a. The WUS had two layers of 52-µm-thick PVDF films as an active piezoelectric element. The PVDF piezoelectric film having silver nanoparticle ink electrodes was obtained from Measurement Specialties (Model: 2-1004346-0, Measurement Specialties Inc., Hampton, VA. USA). The PVDF film was cut into a desired size of the WUS having the active ultrasonic area and the interconnection area, as shown in Figure 1b. The active ultrasonic area is the functional part of the sensor to transmit and receive ultrasound where the electrode layers at the top and bottom surface of the PVDF layer were overlapped. The interconnection area is the part where the lead wires attached to the electrode layers, and there was no overlapping between the electrode layers at the top and bottom surface of the PVDF layer.
The uniformity of the thickness of the silver ink electrode layer was measured 10 ± 1 µm within the active ultrasonic area. The two pieces of the PVDF films were arranged in antiparallel polarization direction and bonded at the inner electrode layers by using a low-viscosity epoxy of 7.5 µm as a bonding layer. Considerations were taken to ensure the uniformity of the epoxy thickness and eliminating the trapped air microbubbles. Both the top and bottom outer electrode layers, next to the acoustic insulator layer and the ultrasonic sensing area, respectively, were connected to the ground electrical terminal. The inner electrode layers, between the two PVDF films, were bonded together and connected to the active voltage source terminal. Thus, the two PVDF films were connected electrically in parallel and acoustically in series with their piezoelectric polarization directions antiparallel. The double-layer PVDF films configuration reduces the input electrical impedance of the sensor, which consequently increases the intensity of the output ultrasonic wave from the available driving voltage source [102]. A flexible brass film for electromagnetic shielding to reduce the environmental noises and a polyimide film for WUS structure protection and electrical insulation were applied to wrap the entire structure of WUS except for the ultrasonic sensing area where the ultrasound is transmitted or received. The electromagnetic shielding and protection layers were removed from the ultrasonic sensing area in order to avoid the ultrasonic attenuation and reflection within these layers. At the backside of the double-layer PVDF films, a piece of paper as an acoustic insulator layer was inserted without bonding between the electromagnetic shielding and the electrode layers. Thus, the WUS was air-backed to eliminate the ultrasonic backward reflection, reduce the sensor thickness, and to improve the electromechanical performance. The developed WUS dimensions were 50 mm × 24 mm with a total thickness of 350 µm. The area of the ultrasonic sensing area was 20 mm × 20 mm. Figure 1c shows photos of the constructed WUS used in this study.
2.2. Experimental Configuration
The tissue thickness changes due to GC muscle contraction evoked by the EMS at a lower leg of a healthy male subject were measured using the WUSs in the ultrasonic TT mode. As shown in Figure 2 of the experimental setup, the transmitter WUS was attached to the medial side of the GC muscle at the back of the tibia and fibula bones, whereas the receiver WUS was placed on the opposite side. A medical ultrasonic gel couplant was applied between the skin surfaces and the WUSs. In order to maintain the stability of the WUSs attachment during the measurement, the WUSs and the electric wires were fixed by non-elastic adhesive tapes. Considerations were taken to avoid exerting pressure by the applied adhesive tape so that it would not impede the movements of the underlying tissues including the muscle contraction. The pulsed ultrasound generated by the transmitter WUS propagated through the tissues toward the receiver WUS. The distance, which is the tissue thickness between the transmitter and the receiver WUSs, was estimated by measuring the time-of-flight (TOF) of ultrasound. Average sound speed of 1540 m/s was assumed for soft tissue, including muscles.
Figure 3 shows the schematic diagram of the ultrasonic measurement configuration to monitor the electrically evoked GC muscle contraction. The contractions of the GC muscle were evoked by an EMS device (Model: EMS 7500, Compass Health, Middleburg Heights, OH, USA) at EMS frequencies of 2, 6, 8, 10, 12 and 30 Hz with an electric pulse width of 300 µs. The amplitude of the stimulation pulse was adjusted to the comfort level of the human subject depending on the EMS frequency employed.
The WUSs were operated by an ultrasonic pulser/receiver (Model: DPR300, JSR Ultrasonics, Pittsford, NY, USA). The pulse repetition rate (PRR) was 1 kHz, controlled by a function generator. Therefore, one frame of the ultrasonic radio-frequency (RF) signal was acquired every 1 ms. The ultrasonic RF signals received by the receiver WUS were filtered by the pulser/receiver built-in analog band-pass filter of 1–22.5 MHz bandwidth. Then, the received ultrasonic RF signals were digitized at a sampling frequency of 125 MHz and stored by the data acquisition (DAQ) system (Model: ATS 9440, Alazartech, Montreal, QC, Canada) connected to a personal computer (PC). It is noted that the sampling frequency of 125 MHz was the highest of the DAQ system employed, which was much higher than the Nyquist frequency of the received pulsed ultrasound since the real-time measurement was not the focus of this study. In the future study, the lower sampling frequency will be considered and tested for real-time monitoring and signal analysis. The ultrasonic RF signals were acquired for 8 seconds, including a short period without EMS at the beginning of the acquisition at each EMS frequency. Hence, a total of 8000 frames of the RF signals were acquired at each EMS frequency.
For the preprocessing of the acquired ultrasonic RF signals, a moving average of 15 frames was applied to the digitized RF signals to remove the random noise and improve the SNR of the desired signals. The moving averaging of 15 frames at the PRR of 1 kHz was equivalent to the frame rate of 66.6 Hz, which was twice greater than the maximum EMS frequency of 30 Hz in the experiments conducted. Thus, the motion smoothening effect on the measured tissue motion could be negligible. It is noted that no increase of the noise level was observed on the received ultrasonic RF signals after applying the EMS. Figure 4a shows an example of the received ultrasonic RF pulses at relaxed (TOF = 74.95 µs) and contracted (TOF = 77.98 µs) states of the GC muscle indicated by the dashed line and the solid line, respectively. The received ultrasonic pulses were clearly observed in the acquired ultrasound RF signals with high SNR. The TOFs of the ultrasonic pulses were obtained using the peak detection technique of the negative peaks of the received ultrasonic pulses. The tissue thicknesses were calculated as 115.4 and 120.1 mm at the relaxed and contracted states, respectively, using each measured TOF and the assumed ultrasound speed of 1540 m/s. The average center frequency and the bandwidth of the received ultrasonic RF pulses were 1.25 and 1.36 MHz, respectively, as seen in Figure 4b.
3. Results and Discussions
3.1. Monitoring of Muscle Tetanic Contractions
Figure 5 shows the changes in tissue thickness obtained during the evoked GC muscle contraction by the EMS at different EMS frequencies. The periodical change of the tissue thickness corresponding to EMS frequency was clearly observed from the GC muscle contraction at the EMS frequency from 2 to 12 Hz. At the EMS frequencies of 2 and 4 Hz, the GC muscle was able to relax completely between the intervals of two consecutive twitches. However, the partial relaxations between the consecutive twitches were seen at the EMS frequencies of 6 to 12 Hz, indicating the progression of tetanic contraction of the GC muscle. No relaxation was observed at the EMS frequency of 30 Hz under our experimental conditions. From the monitored thickness changes at each EMS frequency, the tetanic contraction progression level can be quantified using a fusion index (FI) [110,111,112]. The FI is defined (in %) by:
where a is the difference between the initial thickness (before the EMS applied) and the minimal thickness during the contraction, whereas b is the difference between the initial thickness and the maximal thickness during contraction, as illustrated in Figure 6. Thus, the FI of 0% means the twitch contraction with complete relaxation of the muscle, and that of 100% means the completely fused tetanic contraction.
The FI value at each EMS frequency was obtained by taking the average of the calculated FI values between each electrical stimulation interval, after two seconds of initiating the EMS. Figure 7 presents the FI value, denoted by the cross mark, with the standard deviation (SD), denoted by the error bar, obtained at each EMS frequency. As seen in Figure 5a,b at the EMS frequencies of 2 and 4 Hz, respectively, the GC muscle had a complete relaxation between the consecutive stimuli, which indicates the FI of 0%. As the EMS frequency increased to 6 Hz and 8 Hz, the muscle would progress a partial relaxation represented by the FI values of 8.6 ± 4.4% and 15.7 ± 9.1% (mean ± SD), respectively. At 10 and 12 Hz, the tetanic contraction progressed further, and the FI values became 83.8 ± 1.2% and 95.3 ± 0.5%, respectively. The FI value of 100% was assigned at 30 Hz since no muscular relaxation between the consecutive stimuli was observed at 30 Hz, as shown in Figure 5g. In general, the unfused and fused tetanus is considered at FI value greater than 10% and 90%, respectively [113]. Therefore, based on the S-shaped (sigmoid function) curve fitting (solid line) of the obtained FI-EMS frequency relationships shown in Figure 7, the minimum stimulation frequencies necessary to evoke the unfused and fused tetanus were given at FI values of 10% and 90%, respectively, Thus, the GC muscle would be evoked to the unfused and fused tetanic contraction at EMS frequencies of 6.7 and 10.7 Hz, respectively, under our experimental conditions employed.
3.2. Muscle Contractile Parameters
The monitored muscle contractions of the GC muscle were further analyzed by extracting the contractile parameters from a single twitch contraction such as maximum thickness changes, , contraction time, , contraction velocity, , sustain time, , and half-relaxation time, [9,15]. Figure 8 shows the extraction of the contractile parameters from a chosen single contraction twitch of the monitored GC muscle at each EMS frequency in the range from 2 to 10 Hz, which were not fused tetanus state in our experiments. At the EMS frequency of 2 Hz, the was 2.24 mm from the relaxed state to the maximum contracted state. The during which the thickness increased from 10% to 90% of the was 38 ms. During the , was 47.21 mm/s. The during which the GC muscle sustained the 50% of the was 117.5 ms. After reaching the maximum thickness, the thickness began to decrease, which indicates the relaxation period. The during which the thickness decreased from 90% to 50% of the was 62.9 ms. Table 1 lists the average contractile parameters obtained from the multiple twitches of the electrically evoked GC muscle contractions at each applied EMS frequency, shown in Figure 5. Averaging was taken from the twitches observed after the first two seconds of initiating the EMS, where the twitches became stables.
In Table 1, a coefficient of variation, CV, in percentage (CV = Mean / SD × 100) is also presented for each contractile parameters. The CV values for , , and were 8.1% or less, and those for were 11% or less. The CV values for showed greater values (8.3%–21.5%) comparing with the other parameters. It was reported in the TMG measurements with multiple subjects that the parameter exhibited high variability and was indicated as an unreliable parameter, whereas and were more reliable parameters with low variability [59]. Though our CV values were estimated from the multiples twitches with only a single subject, a similar tendency of the measurement variability was shown in our results.
Several studies have presented the measurement of the GC muscle contractile parameters [7,16,114,115,116,117,118]. However, the lack of a standardized measurement protocol led to a variety of measurement conditions that limits the comparison between the muscle contractile parameters, as discussed in [59,119,120,121]. The sensor position, EMS conditions (amplitude, pulse width, and inter-electrode distance), and individual differences (gender, age, body mass, and physical activity level) impose difficulties for the direct comparison between the values of the contractile parameters. Therefore, the comparison of the parameter values obtained in this study with those in other studies would not be applicable due to the different measurement conditions employed and is beyond the scope of this study. In future work, we will examine the reliability and repeatability of the WUS measurement method and compare the results with those published values under the same measurement conditions.
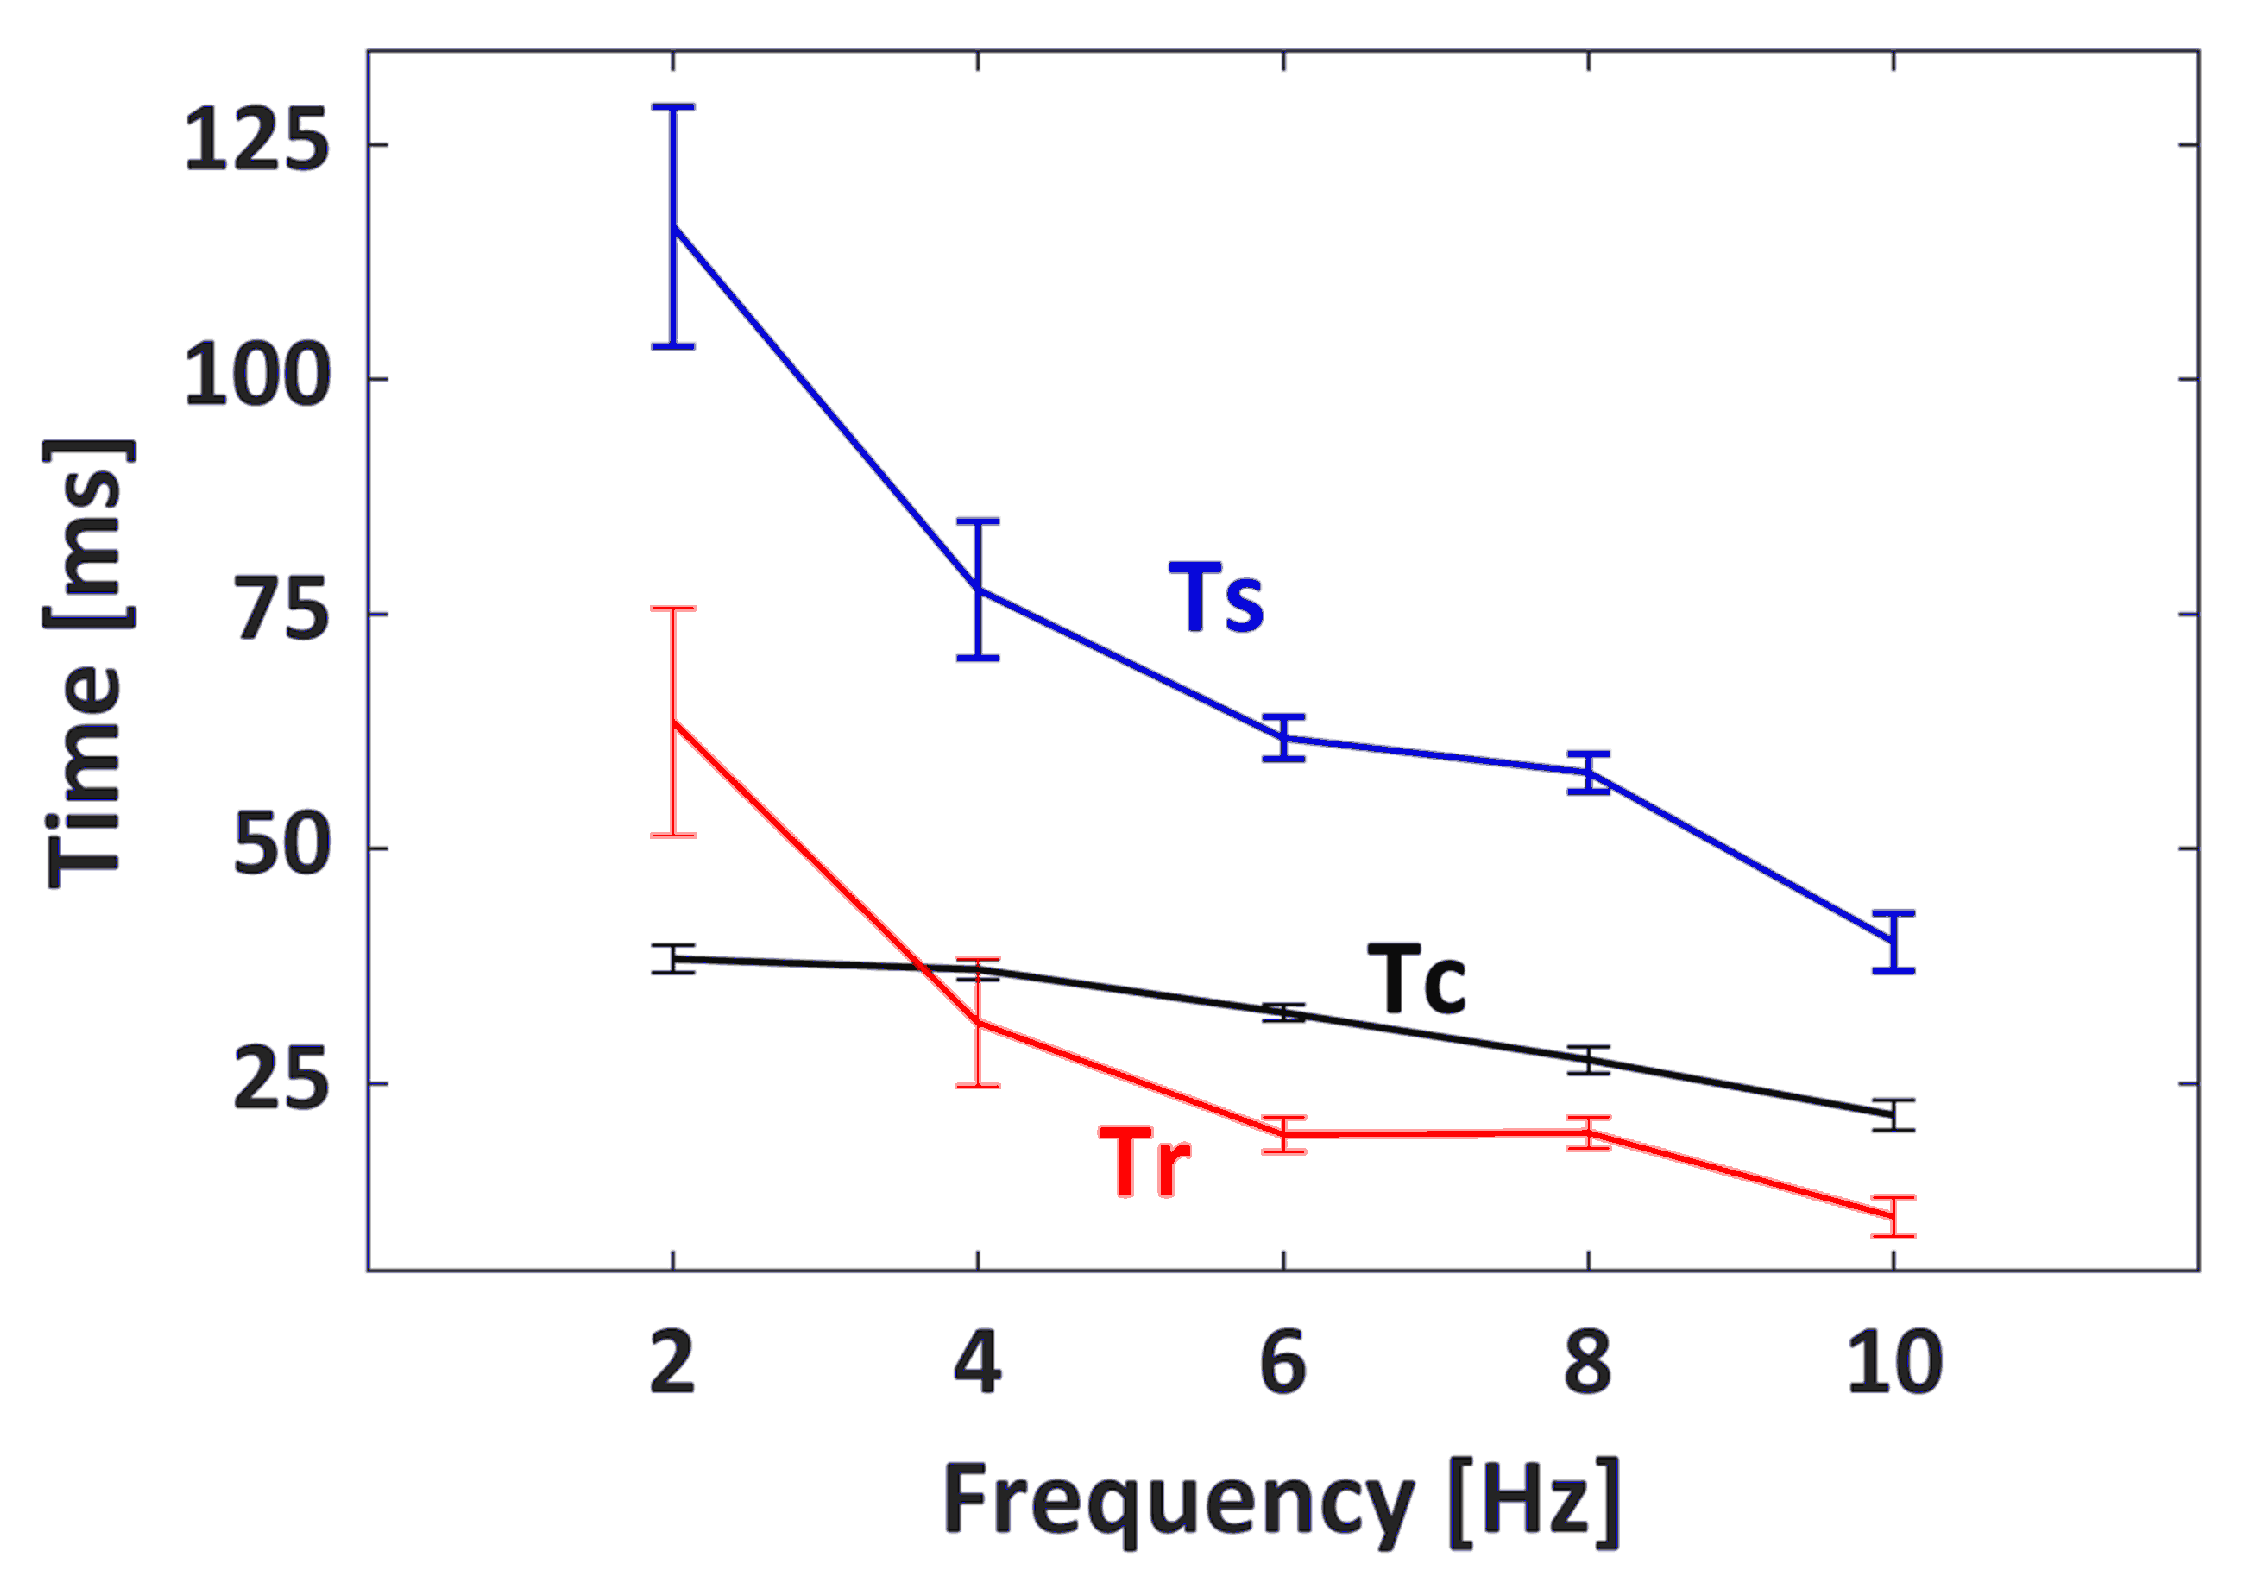
The values of , , and with respect to EMS frequencies from 2 to 10 Hz are presented in Figure 9. It was observed from these extracted contractile parameters that the contraction and relaxation periods of the GC muscle became shorter as the EMS frequency increase. As the EMS frequency increased from 2 to 10 Hz, the average values decreased from 38.25 to 21.62 ms, and the average values decreased from 63.49 to 10.80 ms. In addition, the GC muscle sustained a shorter contraction as the frequency progressed further, which was indicated by the average of 116.28 ms at 2 Hz compared to of 40.07 ms at 10 Hz.
The conducted in vivo monitoring of the tetanic contraction demonstrates the ability of the developed WUS and the ultrasonic method for the continuous and quantitative assessment of the skeletal muscle contractile properties. The novel ultrasonic technique presented in this work allows the measurement of the skeletal muscle contractile parameters beyond the limitations of TMG method, such as fixed posture and/or limited measurement location, which is one of the current popular tools for assessment of the muscle contractile properties [9]. The developed WUS could offer the advantage of the ultrasonic A-mode method by measuring the internal thickness changes of the tissue where the TMG method may not be feasible. The ultrasonic measurement method using the developed WUS could provide a practical alternative with less strict posture conditions, in comparison with the TMG. The proposed WUS and ultrasound method of the measurement of the skeletal muscle contractile parameters would be applied for various medical applications, for instance: monitoring the treatment progression before and after ligament reconstruction surgery [6,7,117], investigation of the fast and slow muscle fibers ratio in muscle [15,16,18], assessment of muscle fatigue [20,122], and physical training effectiveness [9,123]. In addition, the FI-EMS frequency curve would be used to investigate the degree of muscle fatigue [110] and to evaluate the muscle fiber type and fiber composition ratio [111].
In addition, the WUS offers the measurement of both the voluntary and electrically evoked contractions. In previous works, the developed WUS feasibility was demonstrated in monitoring voluntary skeletal muscle contraction [100,101,104,124,125], measurement of arterial diameter [108], and monitoring of mechanical properties of plantar soft tissue [105]. The developed WUS is an inexpensive, flexible, and thin ultrasonic sensor which would provide the ability of the continuous monitoring of the skeletal muscle contractile properties. Additionally, it facilitates the potential of future exploring the skeletal muscle contractile parameters of voluntary contractions during various physical activities.
4. Conclusions and Future Perspectives
In this paper, the developed flexible, lightweight, thin, and small WUSs were tested for monitoring the eclectically evoked skeletal muscle contractions of a human subject. The WUSs were designed and constructed using two 52-µm thick PVDF films bonded using a low-viscosity epoxy. The two PVDF films were connected electrically in parallel and acoustically in series with their piezoelectric polarization directions antiparallel for the improvement of the electromechanical performance.
The capability of the developed WUS in measuring the skeletal muscle contractile parameters was demonstrated by the in vivo monitoring of the electrically evoked contractions of the GC muscle at varying EMS frequencies from 2 up to 30 Hz. The tissue thickness changes due to GC muscle contractions were successfully obtained at each EMS frequency by utilizing the ultrasonic TT mode in A-mode data acquisition, where two WUSs employed as transmitter and receiver. The total thickness changes of the tissues between the WUSs due to the muscle contraction were measured using an ultrasound TOF method. The developed WUS was capable of monitoring the progression of the tetanic contraction of the GC muscle at the varying EMS frequencies. The tetanic contraction progression was quantified by the fusion index (FI) estimated from the monitored tissue thickness changes at each EMS frequency. In addition, the fused and unfused tetanus frequencies were estimated from the obtained FI-EMS frequency curve. Furthermore, the muscle contractile parameters such as maximum thickness changes, , contraction time, , contraction velocity, , sustain time, , and half-relaxation time, were successfully extracted from the monitored contraction of the GC muscle. As the EMS frequency increased from 2 to 10 Hz, it was observed that the duration of , , and decreased.
This paper demonstrated for the first time, to the best of our knowledge, the monitoring of the tetanic contractions progression of in vivo human skeletal muscle evoked by the EMS using the single-element WUSs in A-mode ultrasonic measurement. It is our expectation that the WUS and ultrasonic method presented in this study would be a valuable tool for inexpensive, non-invasive, and continuous monitoring of the skeletal muscle contractile properties. In addition, it is of our belief that the proposed ultrasound method and the wearability of the developed ultrasonic sensor could have advantages over the conventional methods, such as the reduction of motion artifacts and the reliability during the measurements for both the static and dynamic muscle contractions. Following the encouraging finding presented in this study, the next stage of future work would focus on the reliability and repeatability investigation of the proposed WUS measurement method in comparison with other conventional methods such as TMG and LDS. In addition, more subjects would be recruited in the future evaluation study of the WUS measurement method of the skeletal muscle contractile parameters.
Author Contributions
Conceptualization, I.A. and Y.O.; methodology, I.A. and Y.O.; validation, I.A. and Y.O.; formal analysis, I.A.; investigation, I.A.; resources, Y.O.; writing—original draft preparation, I.A.; writing—review and editing, I.A. and Y.O.; visualization, I.A.; supervision, Y.O.; funding acquisition, Y.O. All authors have read and agreed to the published version of the manuscript.
Funding
This work was supported by Natural Sciences and Engineering Research Council of Canada.
Acknowledgments
Ibrahim AlMohimeed acknowledges his fellowship awarded by Majmaah University.
Conflicts of Interest
The authors declare no conflict of interest.
References
- Yoshitake, Y.; Ue, H.; Miyazaki, M.; Moritani, T. Assessment of lower-back muscle fatigue using electromyography, mechanomyography, and near-infrared spectroscopy. Eur. J. Appl. Physiol. 2001, 84, 174–179. [Google Scholar] [CrossRef] [PubMed]
- Ng, M.Y.; Pourmajidian, M.; Hamzaid, N.A. Mechanomyography sensors for detection of muscle activities and fatigue during Fes-evoked contraction. In Proceedings of the IEEE International Functional Electrical Stimulation Society Annual Conference (IFESS), Kuala Lumpur, Malaysia, 17–19 September 2014; pp. 1–3. [Google Scholar] [CrossRef]
- Akataki, K.; Mita, K.; Itoh, K.; Suzuki, N.; Watakabe, M. Acoustic and electrical activities during voluntary isometric contraction of biceps brachii muscles in patients with spastic cerebral palsy. Muscle Nerve 1996, 19, 1252–1257. [Google Scholar] [CrossRef]
- Pedersen, S.W.; Bäckman, E.; Öberg, B. Characteristics of tetanic muscle contraction in Parkinson patients. Acta Neurol. Scand. 1991, 84, 250–255. [Google Scholar] [CrossRef] [PubMed]
- Barreiro, E.; Gea, J. Respiratory and Limb Muscle Dysfunction in COPD. J. Chronic Obstr. Pulm. Dis. (COPD) 2015, 12, 413–426. [Google Scholar] [CrossRef]
- Dias, P.S.; Fort, J.S.; Marinho, D.A.; Santos, A.; Marques, M.C. Tensiomyography in Physical Rehabilitation of High Level Athletes. Open Sports Sci. J. 2010, 3, 47–48. [Google Scholar] [CrossRef]
- Alvarez-Diaz, P.; Alentorn-Geli, E.; Ramon, S.; Marin, M.; Steinbacher, G.; Rius, M.; Seijas, R.; Ballester, J.; Cugat, R. Effects of anterior cruciate ligament reconstruction on neuromuscular tensiomyographic characteristics of the lower extremity in competitive male soccer players. Knee Surg. Sports Traumatol. Arthrosc. 2015, 23, 3407–3413. [Google Scholar] [CrossRef]
- Alentorn-Geli, E.; Alvarez-Diaz, P.; Ramon, S.; Marin, M.; Steinbacher, G.; Boffa, J.J.; Cuscó, X.; Ballester, J.; Cugat, R. Assessment of neuromuscular risk factors for anterior cruciate ligament injury through tensiomyography in male soccer players. Knee Surg. Sports Traumatol. Arthrosc. 2015, 23, 2508–2513. [Google Scholar] [CrossRef]
- Macgregor, L.J.; Hunter, A.M.; Orizio, C.; Fairweather, M.M.; Ditroilo, M. Assessment of Skeletal Muscle Contractile Properties by Radial Displacement: The Case for Tensiomyography. Sports Med. 2018, 48, 1607–1620. [Google Scholar] [CrossRef] [Green Version]
- Ding, H.; He, Q.; Zeng, L.; Zhou, Y.; Shen, M.; Dan, G. Motion intent recognition of individual fingers based on mechanomyogram. Pattern Recognit. Lett. 2017, 88, 41–48. [Google Scholar] [CrossRef]
- Lyons, K.R.; Joshi, S.S.; Joshi, S.S.; Lyons, K.R. Upper Limb Prosthesis Control for High-Level Amputees via Myoelectric Recognition of Leg Gestures. IEEE Trans. Neural Syst. Rehabil. Eng. 2018, 26, 1056–1066. [Google Scholar] [CrossRef]
- Lobo-Prat, J.; Kooren, P.N.; Stienen, A.H.A.; Herder, J.L.; Koopman, B.F.J.M.; Veltink, P.H. Non-invasive control interfaces for intention detection in active movement-assistive devices. J. Neuro Eng. Rehabil. 2014, 11, 168. [Google Scholar] [CrossRef] [PubMed] [Green Version]
- Novak, D.; Riener, R. A survey of sensor fusion methods in wearable robotics. Robot. Auton. Syst. 2015, 73, 155–170. [Google Scholar] [CrossRef]
- Baskin, R.; Paolini, P. Volume change and pressure development in muscle during contraction. Am. J. Physiol. Leg. Content 1967, 213, 1025–1030. [Google Scholar] [CrossRef] [PubMed] [Green Version]
- Valenčič, V.; Knez, N. Measuring of Skeletal Muscles’ Dynamic Properties. Artif. Organs 1997, 21, 240–242. [Google Scholar] [CrossRef] [PubMed]
- Pišot, R.; Narici, M.V.; Šimunič, B.; De Boer, M.; Seynnes, O.; Jurdana, M.; Biolo, G.; Mekjavić, I.B. Whole muscle contractile parameters and thickness loss during 35-day bed rest. Eur. J. Appl. Physiol. 2008, 104, 409–414. [Google Scholar] [CrossRef]
- Than, C.; Tosovic, D.; Seidl, L.; Mark Brown, J. The effect of exercise hypertrophy and disuse atrophy on muscle contractile properties: A mechanomyographic analysis. Eur. J. Appl. Physiol. 2016, 116, 2155–2165. [Google Scholar] [CrossRef]
- Dahmane, R.; Valenčič, V.; Knez, N.; Eržen, I. Evaluation of the ability to make non-invasive estimation of muscle contractile properties on the basis of the muscle belly response. Med. Biol. Eng. Comput. 2001, 39, 51–55. [Google Scholar] [CrossRef]
- Dahmane, R.; Djordjevič, S.; Šimunič, B.; Valenčič, V. Spatial fiber type distribution in normal human muscle. J. Biomech. 2005, 38, 2451–2459. [Google Scholar] [CrossRef]
- García-manso, J.M.; Rodríguez-Ruiz, D.; Rodríguez-Matoso, D.; de Saa, Y.; Sarmiento, S.; Quiroga, M. Assessment of muscle fatigue after an ultra-endurance triathlon using tensiomyography (TMG). J. Sports Sci. 2011, 29, 619–625. [Google Scholar] [CrossRef]
- Carrasco, L.; Sañudo, B.; de Hoyo, M.; Pradas, F.; Silva, M.E.D. Effectiveness of low-frequency vibration recovery method on blood lactate removal, muscle contractile properties and on time to exhaustion during cycling at VO2max power output. Eur. J. Appl. Physiol. 2011, 111, 2271–2279. [Google Scholar] [CrossRef] [Green Version]
- García-Manso, J.M.; Rodríguez-Matoso, D.; Sarmiento, S.; de Saa, Y.; Vaamonde, D.; Rodríguez-Ruiz, D.; Silva-Grigoletto, M.E.D. Effect of high-load and high-volume resistance exercise on the tensiomyographic twitch response of biceps brachii. J. Electromyogr. Kinesiol. 2012, 22, 612–619. [Google Scholar] [CrossRef] [PubMed] [Green Version]
- Macgregor, L.J.; Ditroilo, M.; Smith, I.J.; Fairweather, M.M.; Hunter, A.M. Reduced Radial Displacement of the Gastrocnemius Medialis Muscle After Electrically Elicited Fatigue. J. Sport Rehabil. 2016, 25, 241–247. [Google Scholar] [CrossRef] [PubMed]
- de Paula Simola, R.Á.; Raeder, C.; Wiewelhove, T.; Kellmann, M.; Meyer, T.; Pfeiffer, M.; Ferrauti, A. Muscle mechanical properties of strength and endurance athletes and changes after one week of intensive training. J. Electromyogr. Kinesiol. 2016, 30, 73–80. [Google Scholar] [CrossRef] [PubMed] [Green Version]
- Cè, E.; Longo, S.; Limonta, E.; Coratella, G.; Rampichini, S.; Esposito, F. Peripheral fatigue: New mechanistic insights from recent technologies. Eur. J. Appl. Physiol. 2020, 120, 17–39. [Google Scholar] [CrossRef]
- Hunter, A.M.; Galloway, S.D.; Smith, I.J.; Tallent, J.; Ditroilo, M.; Fairweather, M.M.; Howatson, G. Assessment of eccentric exercise-induced muscle damage of the elbow flexors by tensiomyography. J. Electromyogr. Kinesiol. 2012, 22, 334–341. [Google Scholar] [CrossRef]
- Loturco, I.; Gil, S.; Laurino, C.F.D.S.; Roschel, H.; Kobal, R.; Cal Abad, C.C.; Nakamura, F.Y. Differences in Muscle Mechanical Properties Between Elite Power and Endurance Athletes. J. Strength Cond. Res. 2015, 29, 1723–1728. [Google Scholar] [CrossRef]
- Valenzuela, P.L.; Montalvo, Z.; Sánchez-Martínez, G.; Torrontegi, E.; De La Calle-Herrero, J.; Domínguez-castells, R.; Maffiuletti, N.A.; De La Villa, P. Relationship between skeletal muscle contractile properties and power production capacity in female Olympic rugby players. Eur. J. Sport Sci. 2018, 18, 677–684. [Google Scholar] [CrossRef]
- Papagiannis, G.I.; Triantafyllou, A.I.; Roumpelakis, I.M.; Zampeli, F.; Eleni, P.G.; Koulouvaris, P.; Papadopoulos, E.C.; Papagelopoulos, P.J.; Babis, G.C. Methodology of surface electromyography in gait analysis: Review of the literature. J. Med. Eng. Technol. 2019, 43, 59–65. [Google Scholar] [CrossRef]
- Devasahayam, S.R. The Electromyogram. In Signals and Systems in Biomedical Engineering; Springer: Boston, MA, USA, 2013; Chapter 11; pp. 253–279. [Google Scholar] [CrossRef]
- Kuriki, H.U.; de Azevedo, F.M.; Takahashi, L.S.O.; Mello, E.M.; Negrao Filho, R.d.F.; Alves, N. The Relationship Between Electromyography and Muscle Force. In EMG Methods for Evaluating Muscle and Nerve Function; Schwartz, M., Ed.; IntechOpen: London, UK, 2012; Chapter 3; pp. 31–54. [Google Scholar] [CrossRef] [Green Version]
- Chowdhury, R.; Reaz, M.; Ali, M.; Bakar, A.; Chellappan, K.; Chang, T. Surface Electromyography Signal Processing and Classification Techniques. Sensors 2013, 13, 12431–12466. [Google Scholar] [CrossRef]
- Ibitoye, M.O.; Hamzaid, N.A.; Zuniga, J.M.; Abdul Wahab, A.K. Mechanomyography and muscle function assessment: A review of current state and prospects. Clin. Biomech. 2014, 29, 691–704. [Google Scholar] [CrossRef]
- Orizio, C.; Liberati, D.; Locatelli, C.; Grandis, D.D.; Veicsteinas, A. Surface mechanomyogram reflects muscle fibres twitches summation. J. Biomech. 1996, 29, 475–481. [Google Scholar] [CrossRef]
- Islam, M.A.; Sundaraj, K.; Ahmad, R.B.; Ahamed, N.U.; Ali, M.A. Mechanomyography sensor development, related signal processing, and applications: A systematic review. IEEE Sens. J. 2013, 13, 2499–2516. [Google Scholar] [CrossRef]
- Orizio, C. Surface Mechanomyogram. In Electromyography, 1st ed.; Merlett, R., Parker, P., Eds.; John Wiley & Sons, Inc.: Hoboken, NJ, USA, 2005; Chapter 11; pp. 305–322. [Google Scholar] [CrossRef]
- Talib, I.; Sundaraj, K.; Lam, C.K.; Sundaraj, S. A systematic review of muscle activity assessment of the biceps brachii muscle using mechanomyography. J. Musculoskelet. Neuronal Interact. 2018, 18, 446–462. [Google Scholar] [PubMed]
- Watakabe, M.; Mita, K.; Akataki, K.; Itoh, Y. Mechanical behaviour of condenser microphone in mechanomyography. Med Biol. Eng. Comput. 2001, 39, 195–201. [Google Scholar] [CrossRef] [PubMed]
- Beck, T.W.; Housh, T.J.; Johnson, G.O.; Weir, J.P.; Cramer, J.T.; Coburn, J.W.; Malek, M.H. Comparison of a piezoelectric contact sensor and an accelerometer for examining mechanomyographic amplitude and mean power frequency versus torque relationships during isokinetic and isometric muscle actions of the biceps brachii. J. Electromyogr. Kinesiol. 2006, 16, 324–335. [Google Scholar] [CrossRef]
- Qi, L.; Wakeling, J.M.; Ferguson-Pell, M. Spectral properties of electromyographic and mechanomyographic signals during dynamic concentric and eccentric contractions of the human biceps brachii muscle. J. Electromyogr. Kinesiol. 2011, 21, 1056–1063. [Google Scholar] [CrossRef]
- Jaskólska, A.; Madeleine, P.; Jaskólski, A.; Kisiel-Sajewicz, K.; Arendt-Nielsen, L. A comparison between mechanomyographic condenser microphone and accelerometer measurements during submaximal isometric, concentric and eccentric contractions. J. Electromyogr. Kinesiol. 2007, 17, 336–347. [Google Scholar] [CrossRef]
- Stock, M.S.; Beck, T.W.; DeFreitas, J.M.; Dillon, M.A. Linearity and reliability of the mechanomyographic amplitude versus dynamic constant external resistance relationships for the biceps brachii. Physiol. Meas. 2010, 31, 1487–1498. [Google Scholar] [CrossRef]
- Stock, M.S.; Beck, T.W.; DeFreitas, J.M.; Dillon, M.A. Linearity and reliability of the mechanomyographic amplitude versus dynamic torque relationships for the superficial quadriceps femoris muscles. Muscle Nerve 2010, 41, 342–349. [Google Scholar] [CrossRef]
- Hendrix, C.R.; Housh, T.J.; Camic, C.L.; Zuniga, J.M.; Johnson, G.O.; Schmidt, R.J. Comparing electromyographic and mechanomyographic frequency-based fatigue thresholds to critical torque during isometric forearm flexion. J. Neurosci. Methods 2010, 194, 64–72. [Google Scholar] [CrossRef]
- Uchiyama, T.; Shinohara, K. System identification of mechanomyograms detected with an acceleration sensor and a laser displacement meter. In Proceedings of the IEEE Engineering in Medicine and Biology Society, Boston, MA, USA, 30 August–3 September 2011; pp. 7131–7134. [Google Scholar] [CrossRef]
- Tosovic, D.; Than, C.; Brown, J.M.M. The effects of accumulated muscle fatigue on the mechanomyographic waveform: Implications for injury prediction. Eur. J. Appl. Physiol. 2016, 116, 1485–1494. [Google Scholar] [CrossRef]
- Seidl, L.; Tosovic, D.; Brown, J.M. Test-Retest Reliability and Reproducibility of Laser-versus Contact- Displacement Sensors in Mechanomyography: Implications for Musculoskeletal Research. J. Appl. Biomech. 2017, 33, 130–136. [Google Scholar] [CrossRef]
- Than, C.; Seidl, L.; Tosovic, D.; Brown, J.M. Test-retest reliability of laser displacement mechanomyography in paraspinal muscles while in lumbar extension or flexion. J. Electromyogr. Kinesiol. 2018, 41, 60–65. [Google Scholar] [CrossRef]
- Beck, T.W.; DeFreitas, J.M.; Stock, M.S. The linearity and reliability of the mechanomyographic amplitude versus submaximal isometric force relationship. Physiol. Meas. 2009, 30, 1009–1016. [Google Scholar] [CrossRef]
- Posatskiy, A.O.; Chau, T. The effects of motion artifact on mechanomyography: A comparative study of microphones and accelerometers. J. Electromyogr. Kinesiol. 2012, 22, 320–324. [Google Scholar] [CrossRef]
- Ryan, E.D.; Cramer, J.T.; Housh, T.J.; Beck, T.W.; Herda, T.J.; Hartman, M.J. Inter-individual variability in the torque-related patterns of responses for mechanomyographic amplitude and mean power frequency. J. Neurosci. Methods 2007, 161, 212–219. [Google Scholar] [CrossRef]
- Herda, T.J.; Ryan, E.D.; Beck, T.W.; Costa, P.B.; DeFreitas, J.M.; Stout, J.R.; Cramer, J.T. Reliability of mechanomyographic amplitude and mean power frequency during isometric step and ramp muscle actions. J. Neurosci. Methods 2008, 171, 104–109. [Google Scholar] [CrossRef]
- Al-Zahrani, E.; Gunasekaran, C.; Callaghan, M.; Gaydecki, P.; Benitez, D.; Oldham, J. Within-day and between-days reliability of quadriceps isometric muscle fatigue using mechanomyography on healthy subjects. J. Electromyogr. Kinesiol. 2009, 19, 695–703. [Google Scholar] [CrossRef]
- Cè, E.; Rampichini, S.; Limonta, E.; Esposito, F. Reliability of the Electromechanical Delay Components Assessment during the Relaxation Phase. Physiol. J. 2013, 2013, 517838. [Google Scholar] [CrossRef] [Green Version]
- Cè, E.; Rampichini, S.; Esposito, F. Novel insights into skeletal muscle function by mechanomyography: From the laboratory to the field. Sport Sci. Health 2015, 11, 1–28. [Google Scholar] [CrossRef]
- García-García, O.; Cuba-Dorado, A.; Álvarez-Yates, T.; Carballo-López, J.; Iglesias-Caamaño, M. Clinical utility of tensiomyography for muscle function analysis in athletes. Open Access J. Sports Med. 2019, 10, 49–69. [Google Scholar] [CrossRef] [PubMed] [Green Version]
- Križaj, D.; Šimunič, B.; Žagar, T. Short-term repeatability of parameters extracted from radial displacement of muscle belly. J. Electromyogr. Kinesiol. 2008, 18, 645–651. [Google Scholar] [CrossRef] [PubMed]
- Wiewelhove, T.; Raeder, C.; de Paula Simola, R.A.; Schneider, C.; Döweling, A.; Ferrauti, A. Tensiomyographic Markers Are Not Sensitive for Monitoring Muscle Fatigue in Elite Youth Athletes: A Pilot Study. Front. Physiol. 2017, 8, 406. [Google Scholar] [CrossRef] [PubMed] [Green Version]
- Saúl Martín-Rodríguez and Irineu Loturco and Angus M. Hunter and David Rodríguez-Ruiz and Diego Munguia-Izquierdo. Reliability and Measurement Error of Tensiomyography to Assess Mechanical Muscle Function. J. Strength Cond. Res. 2017, 31, 3524–3536. [Google Scholar] [CrossRef] [PubMed]
- Nazarian, L.N. The Top 10 Reasons Musculoskeletal Sonography Is an Important Complementary or Alternative Technique to MRI. Am. J. Roentgenol. 2008, 190, 1621–1626. [Google Scholar] [CrossRef] [Green Version]
- Hodges, P.; Pengel, L.; Herbert, R.; Gandevia, S. Measurement of muscle contraction with ultrasound imaging. Muscle Nerve 2003, 27, 682–692. [Google Scholar] [CrossRef]
- Kwah, L.K.; Pinto, R.Z.; Diong, J.; Herbert, R.D. Reliability and validity of ultrasound measurements of muscle fascicle length and pennation in humans: A systematic review. J. Appl. Physiol. 2013, 114, 761–769. [Google Scholar] [CrossRef] [Green Version]
- Shi, J.; Zheng, Y.; Chen, X.; Xie, H. Modeling the relationship between wrist angle and muscle thickness during wrist flexion-extension based on the bone-muscle lever system: A comparison study. Med. Eng. Phys. 2009, 31, 1255–1260. [Google Scholar] [CrossRef]
- Chen, X.; Zheng, Y.P.; Guo, J.Y.; Shi, J. Sonomyography (smg) control for powered prosthetic hand: A Study with normal subjects. Ultrasound Med. Biol. 2010, 36, 1076–1088. [Google Scholar] [CrossRef]
- Koo, T.K.; Wong, C.; Zheng, Y. Reliability of Sonomyography for Pectoralis Major Thickness Measurement. J. Manip. Physiol. Ther. 2010, 33, 386–394. [Google Scholar] [CrossRef]
- Whittaker, J.L.; Stokes, M. Ultrasound Imaging and Muscle Function. J. Orthop. Sports Phys. Therapy 2011, 41, 572–580. [Google Scholar] [CrossRef] [PubMed]
- Chen, X.; Zheng, Y.P.; Guo, J.Y.; Zhu, Z.; Chan, S.C.; Zhang, Z. Sonomyographic responses during voluntary isometric ramp contraction of the human rectus femoris muscle. Eur. J. Appl. Physiol. 2012, 112, 2603–2614. [Google Scholar] [CrossRef] [PubMed] [Green Version]
- Zhou, G.; Zheng, Y.P. Human motion analysis with ultrasound and sonomyography. In Proceedings of the IEEE Engineering in Medicine and Biology Society, San Diego, CA, USA, 28 August–1 September 2012; pp. 6479–6482. [Google Scholar] [CrossRef]
- Dieterich, A.V.; Pickard, C.M.; Strauss, G.R.; Deshon, L.E.; Gibson, W.; McKay, J. Muscle thickness measurements to estimate gluteus medius and minimus activity levels. Manual Ther. 2014, 19, 453–460. [Google Scholar] [CrossRef] [PubMed] [Green Version]
- Li, J.; Zhou, Y.; Lu, Y.; Zhou, G.; Wang, L.; Zheng, Y.P. The sensitive and efficient detection of quadriceps muscle thickness changes in cross-sectional plane using ultrasonography: A feasibility investigation. IEEE J. Biomed. Health Inform. 2014, 18, 628–635. [Google Scholar] [CrossRef]
- Qiu, S.; Feng, J.; Xu, J.; Xu, R.; Zhao, X.; Zhou, P.; Qi, H.; Zhang, L.; Ming, D. Sonomyography Analysis on Thickness of Skeletal Muscle during Dynamic Contraction Induced by Neuromuscular Electrical Stimulation: A Pilot Study. IEEE Trans. Neural Syst. Rehabilit. Eng. 2017, 25, 59–67. [Google Scholar] [CrossRef]
- Chen, X.; Zhang, X.; Shi, W.; Wang, J.; Xiang, Y.; Zhou, Y.; Yang, W.Z. Ultrasonic Measurement of Dynamic Muscle Behavior for Poststroke Hemiparetic Gait. BioMed Res. Int. 2017, 2017, 8208764. [Google Scholar] [CrossRef]
- Zhou, G.Q.; Zheng, Y.P.; Zhou, P. Measurement of Gender Differences of Gastrocnemius Muscle and Tendon Using Sonomyography during Calf Raises: A Pilot Study. BioMed Res. Int. 2017, 2017, 6783824. [Google Scholar] [CrossRef] [Green Version]
- Jahanandish, M.H.; Fey, N.P.; Hoyt, K. Lower Limb Motion Estimation Using Ultrasound Imaging: A Framework for Assistive Device Control. IEEE J. Biomed. Health Inform. 2019, 23, 2505–2514. [Google Scholar] [CrossRef]
- Yang, X.; Yan, J.; Liu, H. Comparative Analysis of Wearable A-mode Ultrasound and sEMG for Muscle-Computer Interface. IEEE Trans. Biomed. Eng. 2019. [Google Scholar] [CrossRef]
- Macedo Fraiz, G.; Herminia Gallo, L.; Iraci Rabito, E.; Silveira Gomes, A.R.; Madalozzo Schieferdecker, M.E. Relationship between muscle thickness and calf circumference in healthy older women. Arch. Gerontol. Geriatr. 2020, 86, 103942. [Google Scholar] [CrossRef]
- Abraham, A.; Drory, V.E.; Fainmesser, Y.; Lovblom, L.E.; Bril, V. Quantitative sonographic evaluation of muscle thickness and fasciculation prevalence in healthy subjects. Muscle Nerve 2020, 61, 234–238. [Google Scholar] [CrossRef] [PubMed]
- Silver, J.; Ono, Y.; Adler, A. An ultrasonic technique for imaging of tissue motion due to muscle contraction. In Proceedings of the IEEE International Ultrasonics Symposium, Rome, Italy, 20–23 September 2009; pp. 2441–2444. [Google Scholar] [CrossRef]
- Abraham, A.; Drory, V.E.; Fainmesser, Y.; Algom, A.A.; Lovblom, L.E.; Bril, V. Muscle thickness measured by ultrasound is reduced in neuromuscular disorders and correlates with clinical and electrophysiological findings. Muscle Nerve 2019, 60, 687–692. [Google Scholar] [CrossRef] [PubMed]
- Guo, J.Y.; Zheng, Y.P.; Huang, Q.H.; Chen, X. Dynamic monitoring of forearm muscles using one-dimensional sonomyography system. J. Rehabil. Res. Dev. 2008, 45, 187–196. [Google Scholar] [CrossRef] [PubMed] [Green Version]
- Kuehne, T.E.; Yitzchaki, N.; Jessee, M.B.; Graves, B.S.; Buckner, S.L. A comparison of acute changes in muscle thickness between A-mode and B-mode ultrasound. Physiol. Meas. 2019, 40, 115004. [Google Scholar] [CrossRef]
- Wagner, D.R.; Thompson, B.J.; Anderson, D.A.; Schwartz, S. A-mode and B-mode ultrasound measurement of fat thickness: A cadaver validation study. Eur. J. Clin. Nutr. 2019, 73, 518–523. [Google Scholar] [CrossRef]
- Guo, J.Y.; Zheng, Y.P.; Huang, Q.H.; Chen, X.; He, J.F.; Chan, H.L. Performances of One-Dimensional Sonomyography and Surface Electromyography in Tracking Guided Patterns of Wrist Extension. Ultrasound Med. Biol. 2009, 35, 894–902. [Google Scholar] [CrossRef] [Green Version]
- Sun, X.; Li, Y.; Liu, H. Muscle fatigue assessment using one-channel single-element ultrasound transducer. In Proceedings of the International IEEE/EMBS Conference on Neural Engineering (NER), Shanghai, China, 25–28 May 2017; pp. 122–125. [Google Scholar] [CrossRef]
- Hettiarachchi, N.; Ju, Z.; Liu, H. A New Wearable Ultrasound Muscle Activity Sensing System for Dexterous Prosthetic Control. In Proceedings of the IEEE International Conference on Systems, Man, and Cybernetics, Kowloon, Hongkong, China, 9–12 October 2015; pp. 1415–1420. [Google Scholar] [CrossRef]
- Yang, X.; Sun, X.; Zhou, D.; Li, Y.; Liu, H. Towards Wearable A-Mode Ultrasound Sensing for Real-Time Finger Motion Recognition. IEEE Trans. Neural Syst. Rehabil. Eng. 2018, 26, 1199–1208. [Google Scholar] [CrossRef] [Green Version]
- Shahshahani, A.; Laverdiere, C.; Bhadra, S.; Zilic, Z. Ultrasound Sensors for Diaphragm Motion Tracking: An Application in Non-Invasive Respiratory Monitoring. Sensors 2018, 18, 2617. [Google Scholar] [CrossRef] [Green Version]
- Yang, Y.; Tian, H.; Yan, B.; Sun, H.; Wu, C.; Shu, Y.; Wang, L.G.; Ren, T.L. A flexible piezoelectric micromachined ultrasound transducer. RSC Adv. 2013, 3, 24900. [Google Scholar] [CrossRef]
- Wang, Z.; Xue, Q.T.; Chen, Y.Q.; Shu, Y.; Tian, H.; Yang, Y.; Xie, D.; Luo, J.W.; Ren, T.L. A Flexible Ultrasound Transducer Array with Micro-Machined Bulk PZT. Sensors 2015, 15, 2538–2547. [Google Scholar] [CrossRef] [Green Version]
- Mastronardi, V.M.; Guido, F.; Amato, M.; De Vittorio, M.; Petroni, S. Piezoelectric ultrasonic transducer based on flexible AlN. Microelectron. Eng. 2014, 121, 59–63. [Google Scholar] [CrossRef]
- Sun, S.; Zhang, M.; Gao, C.; Liu, B.; Pang, W. Flexible Piezoelectric Micromachined Ultrasonic Transducers Towards New Applications. In Proceedings of the IEEE International Ultrasonics Symposium (IUS), Kobe, Japan, 22–25 October 2018; pp. 1–4. [Google Scholar] [CrossRef]
- Singh, R.S.; Culjat, M.; Lee, M.; Bennett, D.; Natarjan, S.; Cox, B.; Brown, E.; Grundfest, W.; Lee, H. Conformal Ultrasound Imaging System. In Acoustical Imaging; Springer: Dordrecht, The Netherlands, 2011; Volume 30, pp. 211–222. [Google Scholar] [CrossRef]
- Sadeghpour, S.; Lips, B.; Kraft, M.; Puers, R. Flexible Soi-Based Piezoelectric Micromachined Ultrasound Transducer (PMUT) Arrays. In Proceedings of the Solid-State Sensors, Actuators Microsystems Eurosensors XXXIII (Transducers Eurosensors XXXIII), Berlin, Germany, 23–27 June 2019; pp. 250–253. [Google Scholar] [CrossRef]
- Hu, H.; Zhu, X.; Wang, C.; Zhang, L.; Li, X.; Lee, S.; Huang, Z.; Chen, R.; Chen, Z.; Wang, C.; et al. Stretchable ultrasonic transducer arrays for three-dimensional imaging on complex surfaces. Sci. Adv. 2018, 4, eaar3979. [Google Scholar] [CrossRef] [PubMed] [Green Version]
- Cheng, C.H.; Chao, C.; Shi, X.; Leung, W.W. A flexible capacitive micromachined ultrasonic transducer (CMUT) array with increased effective capacitance from concave bottom electrodes for ultrasonic imaging applications. In Proceedings of the IEEE Ultrasonics Symposium, Rome, Italy, 20–23 September 2009; pp. 996–999. [Google Scholar] [CrossRef]
- Chong, P.F.; Shi, X.; Cheng, C.H. A novel flexible capacitive micromachined ultrasonic transducer (CMUT) array with isolated metallic islands riveted to a polymer film. In Proceedings of the IEEE International Conference on Nano/Micro Engineered and Molecular Systems, Suzhou, China, 7–10 April 2013; Volume 1, pp. 923–926. [Google Scholar] [CrossRef]
- Gerardo, C.D.; Cretu, E.; Rohling, R. Fabrication and testing of polymer-based capacitive micromachined ultrasound transducers for medical imaging. Microsyst. Nanoeng. 2018, 4, 1–12. [Google Scholar] [CrossRef] [PubMed]
- Lanata, A.; Scilingo, E.P.; De Rossi, D. A Multimodal Transducer for Cardiopulmonary Activity Monitoring in Emergency. IEEE Trans. Inf. Technol. Biomed. 2010, 14, 817–825. [Google Scholar] [CrossRef]
- Wang, C.; Li, X.; Hu, H.; Zhang, L.; Huang, Z.; Lin, M.; Zhang, Z.; Yin, Z.; Huang, B.; Gong, H.; et al. Monitoring of the central blood pressure waveform via a conformal ultrasonic device. Nat. Biomed. Eng. 2018, 2, 687–695. [Google Scholar] [CrossRef]
- AlMohimeed, I. Development of Wearable Ultrasonic Sensor s for Monitoring Muscle Contraction. Master’s Thesis, Carleton University, Ottawa, ON, Canada, 2013. [Google Scholar]
- AlMohimeed, I.; Agarwal, M.; Ono, Y. Wearable Ultrasonic Sensor Using Double-Layer PVDF Films for Monitoring Tissue Motion. In Proceedings of the IEEE Canadian Conference on Electrical & Computer Engineering (CCECE), Quebec City, QC, Canada, 13–16 May 2018; pp. 1–4. [Google Scholar] [CrossRef]
- Swartz, R.G.; Plummer, J.D. On the Generation of High-Frequency Acoustic Energy with Polyvinylidene Fluoride. IEEE Trans. Sonics Ultrason. 1980, 27, 295–302. [Google Scholar] [CrossRef]
- Zhang, Q.; Lewin, P.; Bloomfield, P. PVDF transducers-a performance comparison of single-layer and multilayer structures. IEEE Trans. Ultrason. Ferroelectr. Freq. Control 1997, 44, 1148–1156. [Google Scholar] [CrossRef]
- Turkistani, H.; AlMohimeed, I.; Ono, Y. Continuous Monitoring of Muscle Thickness Changes During Isometric Contraction Using a Wearable Ultrasonic Sensor. In Proceedings of the Canadian Medical and Biological Engineering Society (CMBES), Ottawa, ON, Canada, 21–24 May 2013; Volume 36. [Google Scholar]
- Trindade, B.M.; Ono, Y.; Lemaire, E.D.; AlMohimeed, I. Development of a wearable ultrasonic sensor and method for continuous monitoring of mechanical properties of plantar soft tissue for diabetic patients. In Proceedings of the IEEE International Ultrasonics Symposium, Chicago, IL, USA, 3–6 September 2014; pp. 2112–2115. [Google Scholar] [CrossRef]
- Huang, A.; Ono, Y.; Liu, K. Ultrasonic monitoring of skeletal muscle response to electrical stimulation of peripheral nerve. In Proceedings of the IEEE International Ultrasonics Symposium, Chicago, IL, USA, 3–6 September 2014; pp. 1053–1056. [Google Scholar] [CrossRef]
- Huang, A.; Ono, Y. Estimation of wrist flexion angle from muscle thickness changes measured by a flexible ultrasonic sensor. In Proceedings of the IEEE-EMBS International Conference on Biomedical and Health Informatics (BHI), Las Vegas, NV, USA, 24–27 February 2016; pp. 188–191. [Google Scholar] [CrossRef]
- Huang, A.; Yoshida, M.; Ono, Y.; Rajan, S. Continuous measurement of arterial diameter using wearable and flexible ultrasonic sensor. In Proceedings of the IEEE Ultrasonics Symposium, Washington, DC, USA, 6–9 September 2017; pp. 1–4. [Google Scholar] [CrossRef]
- Marc Lethiecq and Franck Levassort and Dominique Certon and Louis Pascal Tran-Huu-Hue. Piezoelectric Transducer Design for Medical Diagnosis and NDE. In Piezoelectric and Acoustic Materials for Transducer Applications; Springer: Boston, MA, USA, 2008; Chapter 10; pp. 191–215. [Google Scholar] [CrossRef]
- Orizio, C.; Gobbo, M.; Diemont, B. Changes of the force–frequency relationship in human tibialis anterior at fatigue. J. Electromyogr. Kinesiol. 2004, 14, 523–530. [Google Scholar] [CrossRef]
- Celichowski, J.; Grottel, K. The relationship between fusion index and stimulation frequency in tetani of motor units in rat medial gastrocnemius. Arch. Ital. Biol. 1995, 133, 81–87. [Google Scholar]
- Watanabe, S.; Kitawaki, T.; Oka, H. Mathematical equation of fusion index of tetanic contraction of skeletal muscles. J. Electromyogr. Kinesiol. 2010, 20, 284–289. [Google Scholar] [CrossRef] [Green Version]
- Watanabe, S.; Fukuhara, S.; Fujinaga, T.; Oka, H. Estimating the minimum stimulation frequency necessary to evoke tetanic progression based on muscle twitch parameters. Physiol. Meas. 2017, 38, 466–476. [Google Scholar] [CrossRef] [PubMed]
- Ditroilo, M.; Smith, I.J.; Fairweather, M.M.; Hunter, A.M. Long-term stability of tensiomyography measured under different muscle conditions. J. Electromyogr. Kinesiol. 2013, 23, 558–563. [Google Scholar] [CrossRef] [PubMed]
- De Paula Simola, R.Á.; Harms, N.; Raeder, C.; Kellmann, M.; Meyer, T.; Pfeiffer, M.; Ferrauti, A. Tensiomyography reliability and prediction of changes in muscle force following heavy eccentric strength exercise using muscle mechanical properties. Sports Technol. 2015, 8, 58–66. [Google Scholar] [CrossRef]
- Alvarez-Diaz, P.; Alentorn-Geli, E.; Ramon, S.; Marin, M.; Steinbacher, G.; Boffa, J.J.; Cuscó, X.; Ares, O.; Ballester, J.; Cugat, R. Effects of anterior cruciate ligament injury on neuromuscular tensiomyographic characteristics of the lower extremity in competitive male soccer players. Knee Surg. Sports Traumatol. Arthrosc. 2016, 24, 2264–2270. [Google Scholar] [CrossRef]
- Alentorn-Geli, E.; Alvarez-Diaz, P.; Ramon, S.; Marin, M.; Steinbacher, G.; Rius, M.; Seijas, R.; Ares, O.; Cugat, R. Assessment of gastrocnemius tensiomyographic neuromuscular characteristics as risk factors for anterior cruciate ligament injury in male soccer players. Knee Surg. Sports Traumatol. Arthrosc. 2014, 23, 2502–2507. [Google Scholar] [CrossRef]
- Zubac, D.; Paravlić, A.; Koren, K.; Felicita, U.; Šimunič, B. Plyometric exercise improves jumping performance and skeletal muscle contractile properties in seniors. J. Musculoskelet. Neuronal Interact. 2019, 19, 38–49. [Google Scholar]
- Jones, A.D.; Hind, K.; Wilson, H.; Johnson, M.I.; Francis, P. A standardised protocol for the assessment of lower limb muscle contractile properties in football players using Tensiomyography. Adv. Skelet. Muscle Funct. Assess. 2017, 1, 13–16. [Google Scholar]
- Wilson, H.V.; Jones, A.; Johnson, M.I.; Francis, P. The effect of inter-electrode distance on radial muscle displacement and contraction time of the biceps femoris, gastrocnemius medialis and biceps brachii, using tensiomyography in healthy participants. Physiol. Meas. 2019, 40, 075007. [Google Scholar] [CrossRef]
- Piqueras-Sanchiz, F.; Martín-Rodríguez, S.; Pareja-Blanco, F.; Baraja-Vegas, L.; Blázquez-Fernández, J.; Bautista, I.J.; García-García, Ó. Mechanomyographic Measures of Muscle Contractile Properties are Influenced by Electrode Size and Stimulation Pulse Duration. Sci. Rep. 2020, 10, 1–9. [Google Scholar] [CrossRef]
- Wiewelhove, T.; Raeder, C.; Meyer, T.; Kellmann, M.; Pfeiffer, M.; Ferrauti, A. Markers for Routine Assessment of Fatigue and Recovery in Male and Female Team Sport Athletes during High-Intensity Interval Training. PLoS ONE 2015, 10, e0139801. [Google Scholar] [CrossRef]
- Rusu, L.D.; Cosma, G.G.H.; Cernaianu, S.M.; Marin, M.N.; Rusu, P.F.A.; Ciocanescu, D.P.; Neferu, F.N. Tensiomyography method used for neuromuscular assessment of muscle training. J. Neuro Eng. Rehabil. 2013, 10, 67. [Google Scholar] [CrossRef] [PubMed] [Green Version]
- AlMohimeed, I.; Turkistani, H.; Ono, Y. Development of wearable and flexible ultrasonic sensor for skeletal muscle monitoring. In Proceedings of the IEEE International Ultrasonics Symposium (IUS), Prague, Czech Republic, 21–25 July 2013; pp. 1137–1140. [Google Scholar] [CrossRef]
- Yeung, E.; AlMohimeed, I.; Ono, Y. Estimation of Tissue Thickness Changes Due to Electrical Muscle Stimulation Using Wearable Ultrasonic Sensor in Pulse Echo Mode. In Proceedings of the IEEE Sensors, Montreal, QC, Canada, 27–30 October 2019; pp. 1–4. [Google Scholar] [CrossRef]
Figure 1.
The developed flexible, single-element, wearable ultrasonic sensor (WUS). A schematic design of the WUS (a), a schematic of the single polyvinylidene fluoride (PVDF) film with electrodes before the bonding (b), and photos of the constructed WUS (c).
Figure 1.
The developed flexible, single-element, wearable ultrasonic sensor (WUS). A schematic design of the WUS (a), a schematic of the single polyvinylidene fluoride (PVDF) film with electrodes before the bonding (b), and photos of the constructed WUS (c).
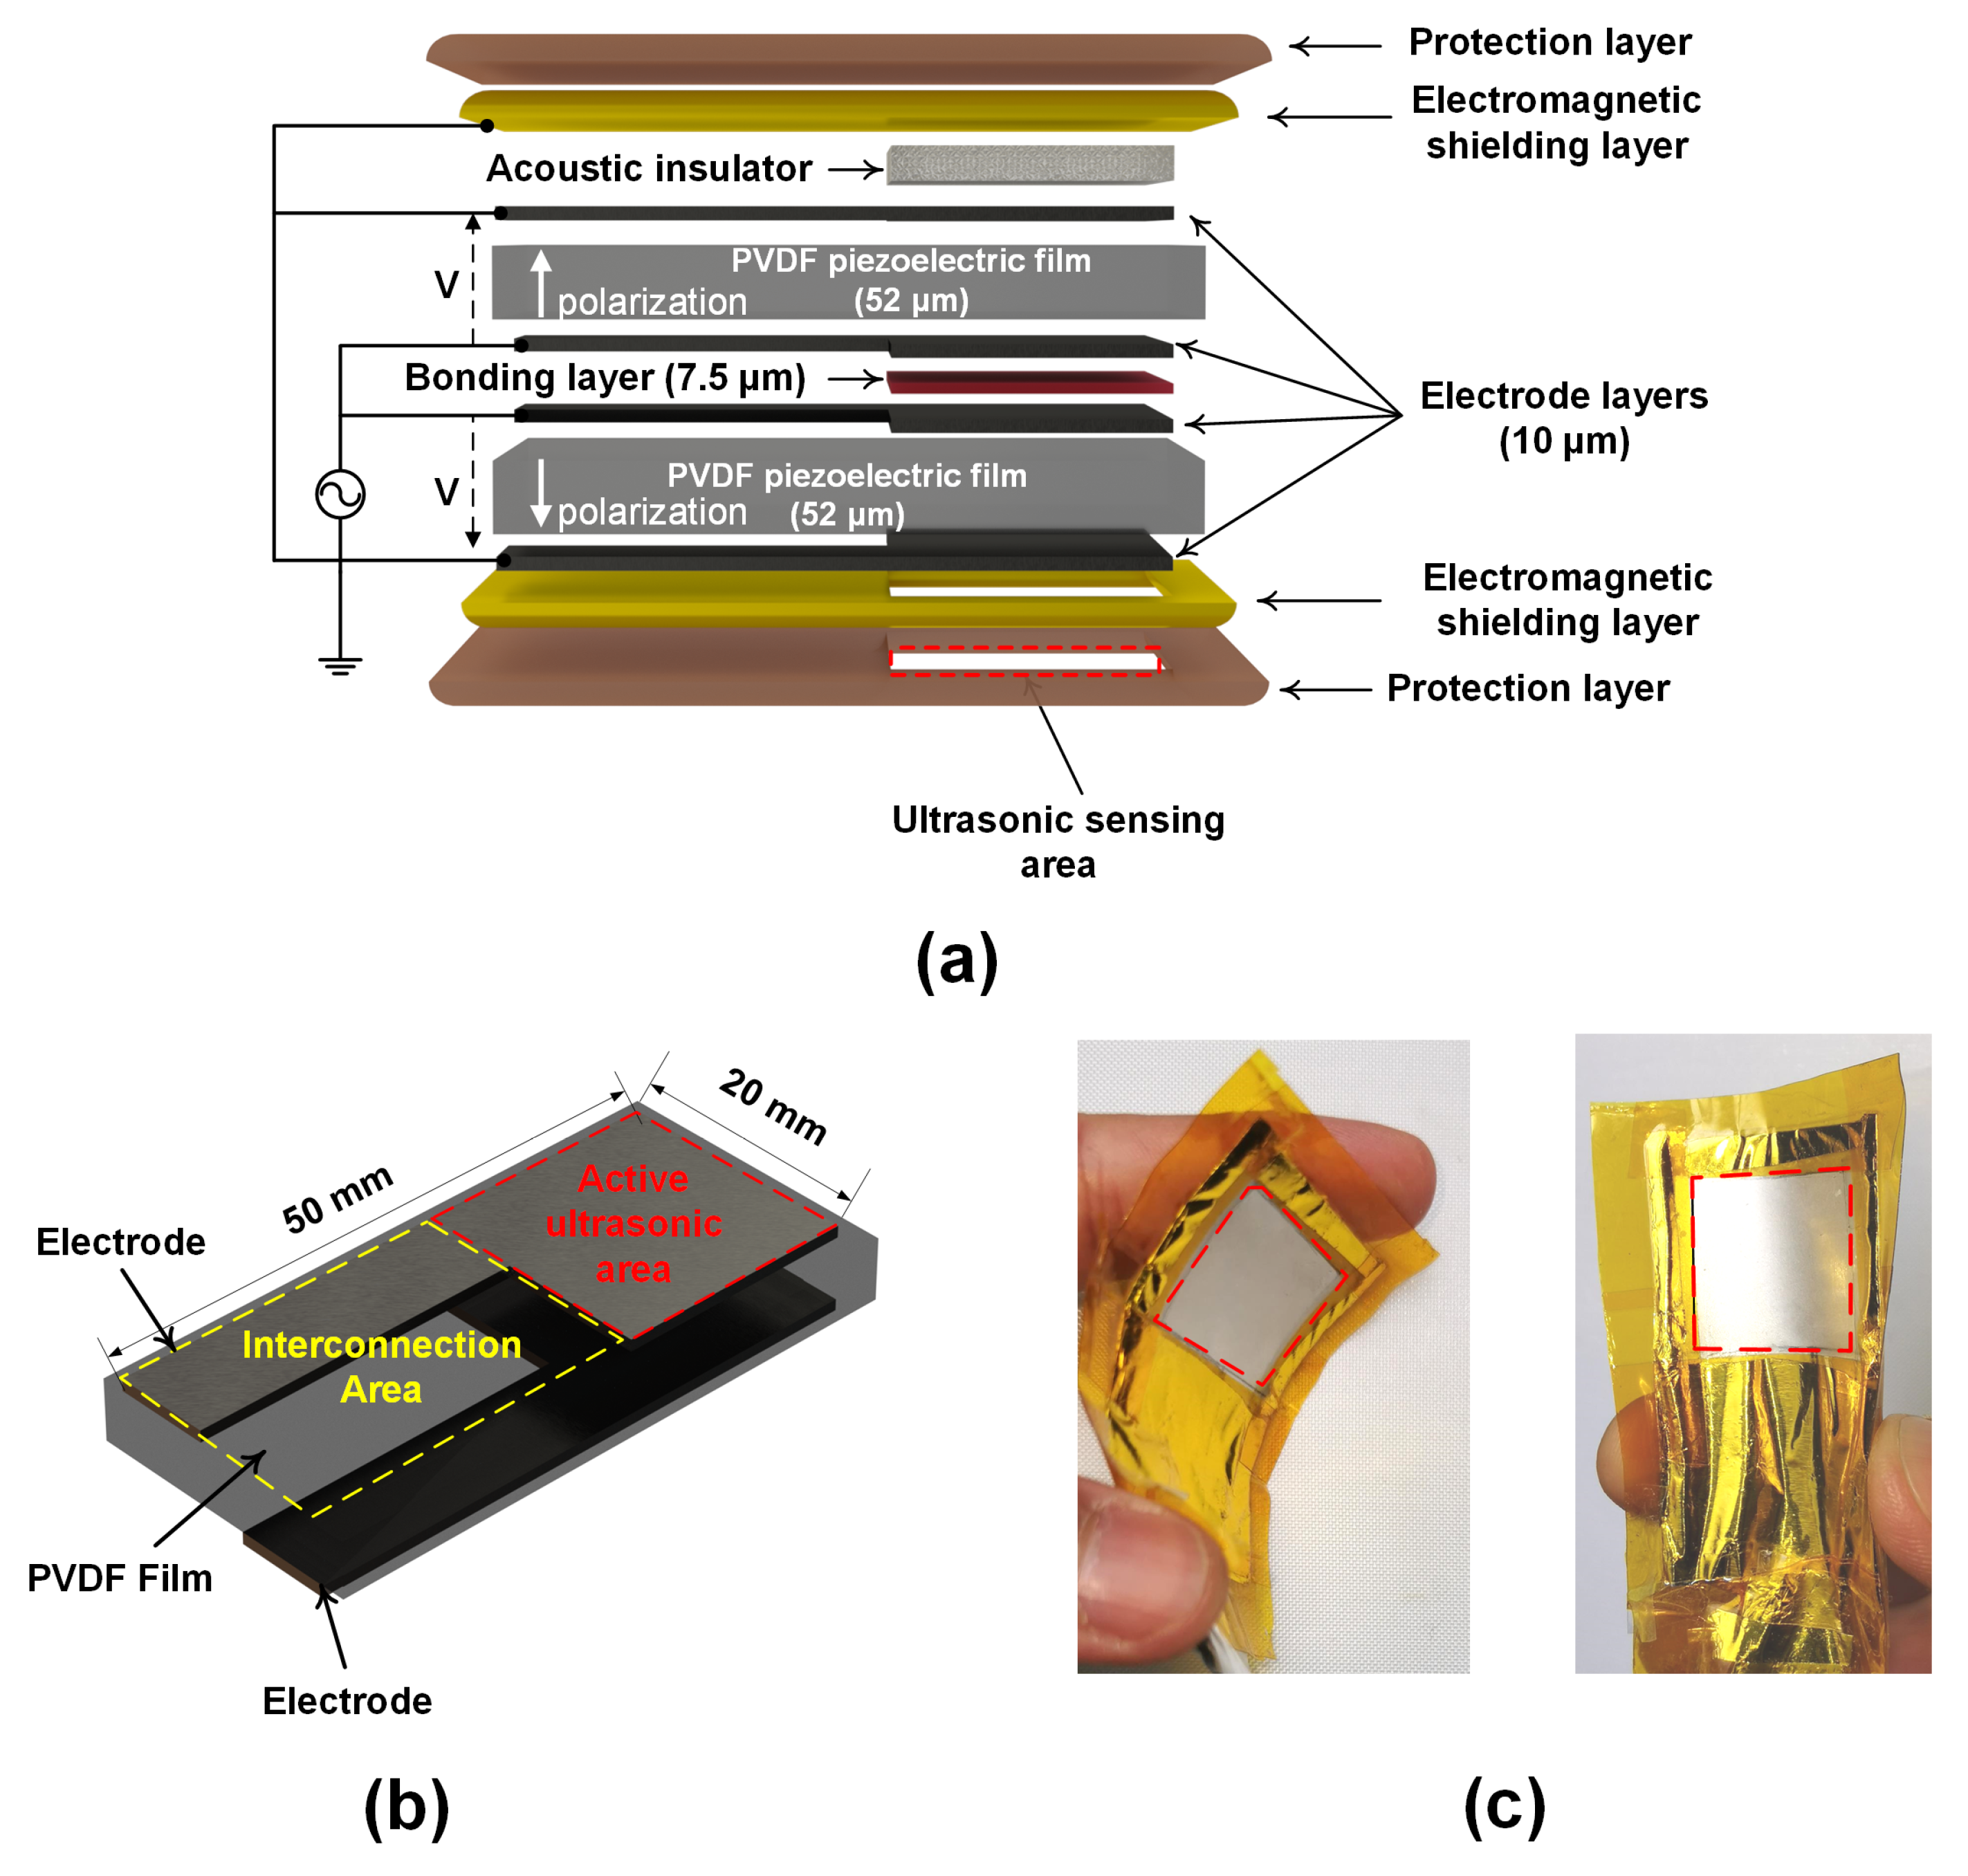
Figure 2.
Photos of the experimental setup for monitoring the tetanic contractions of the gastrocnemius (GC) muscle in ultrasonic through-transmission (TT) mode. The two WUSs (transmitter and receiver) and electrical muscle stimulation (EMS) electrodes were attached to the skin surface of a lower leg.
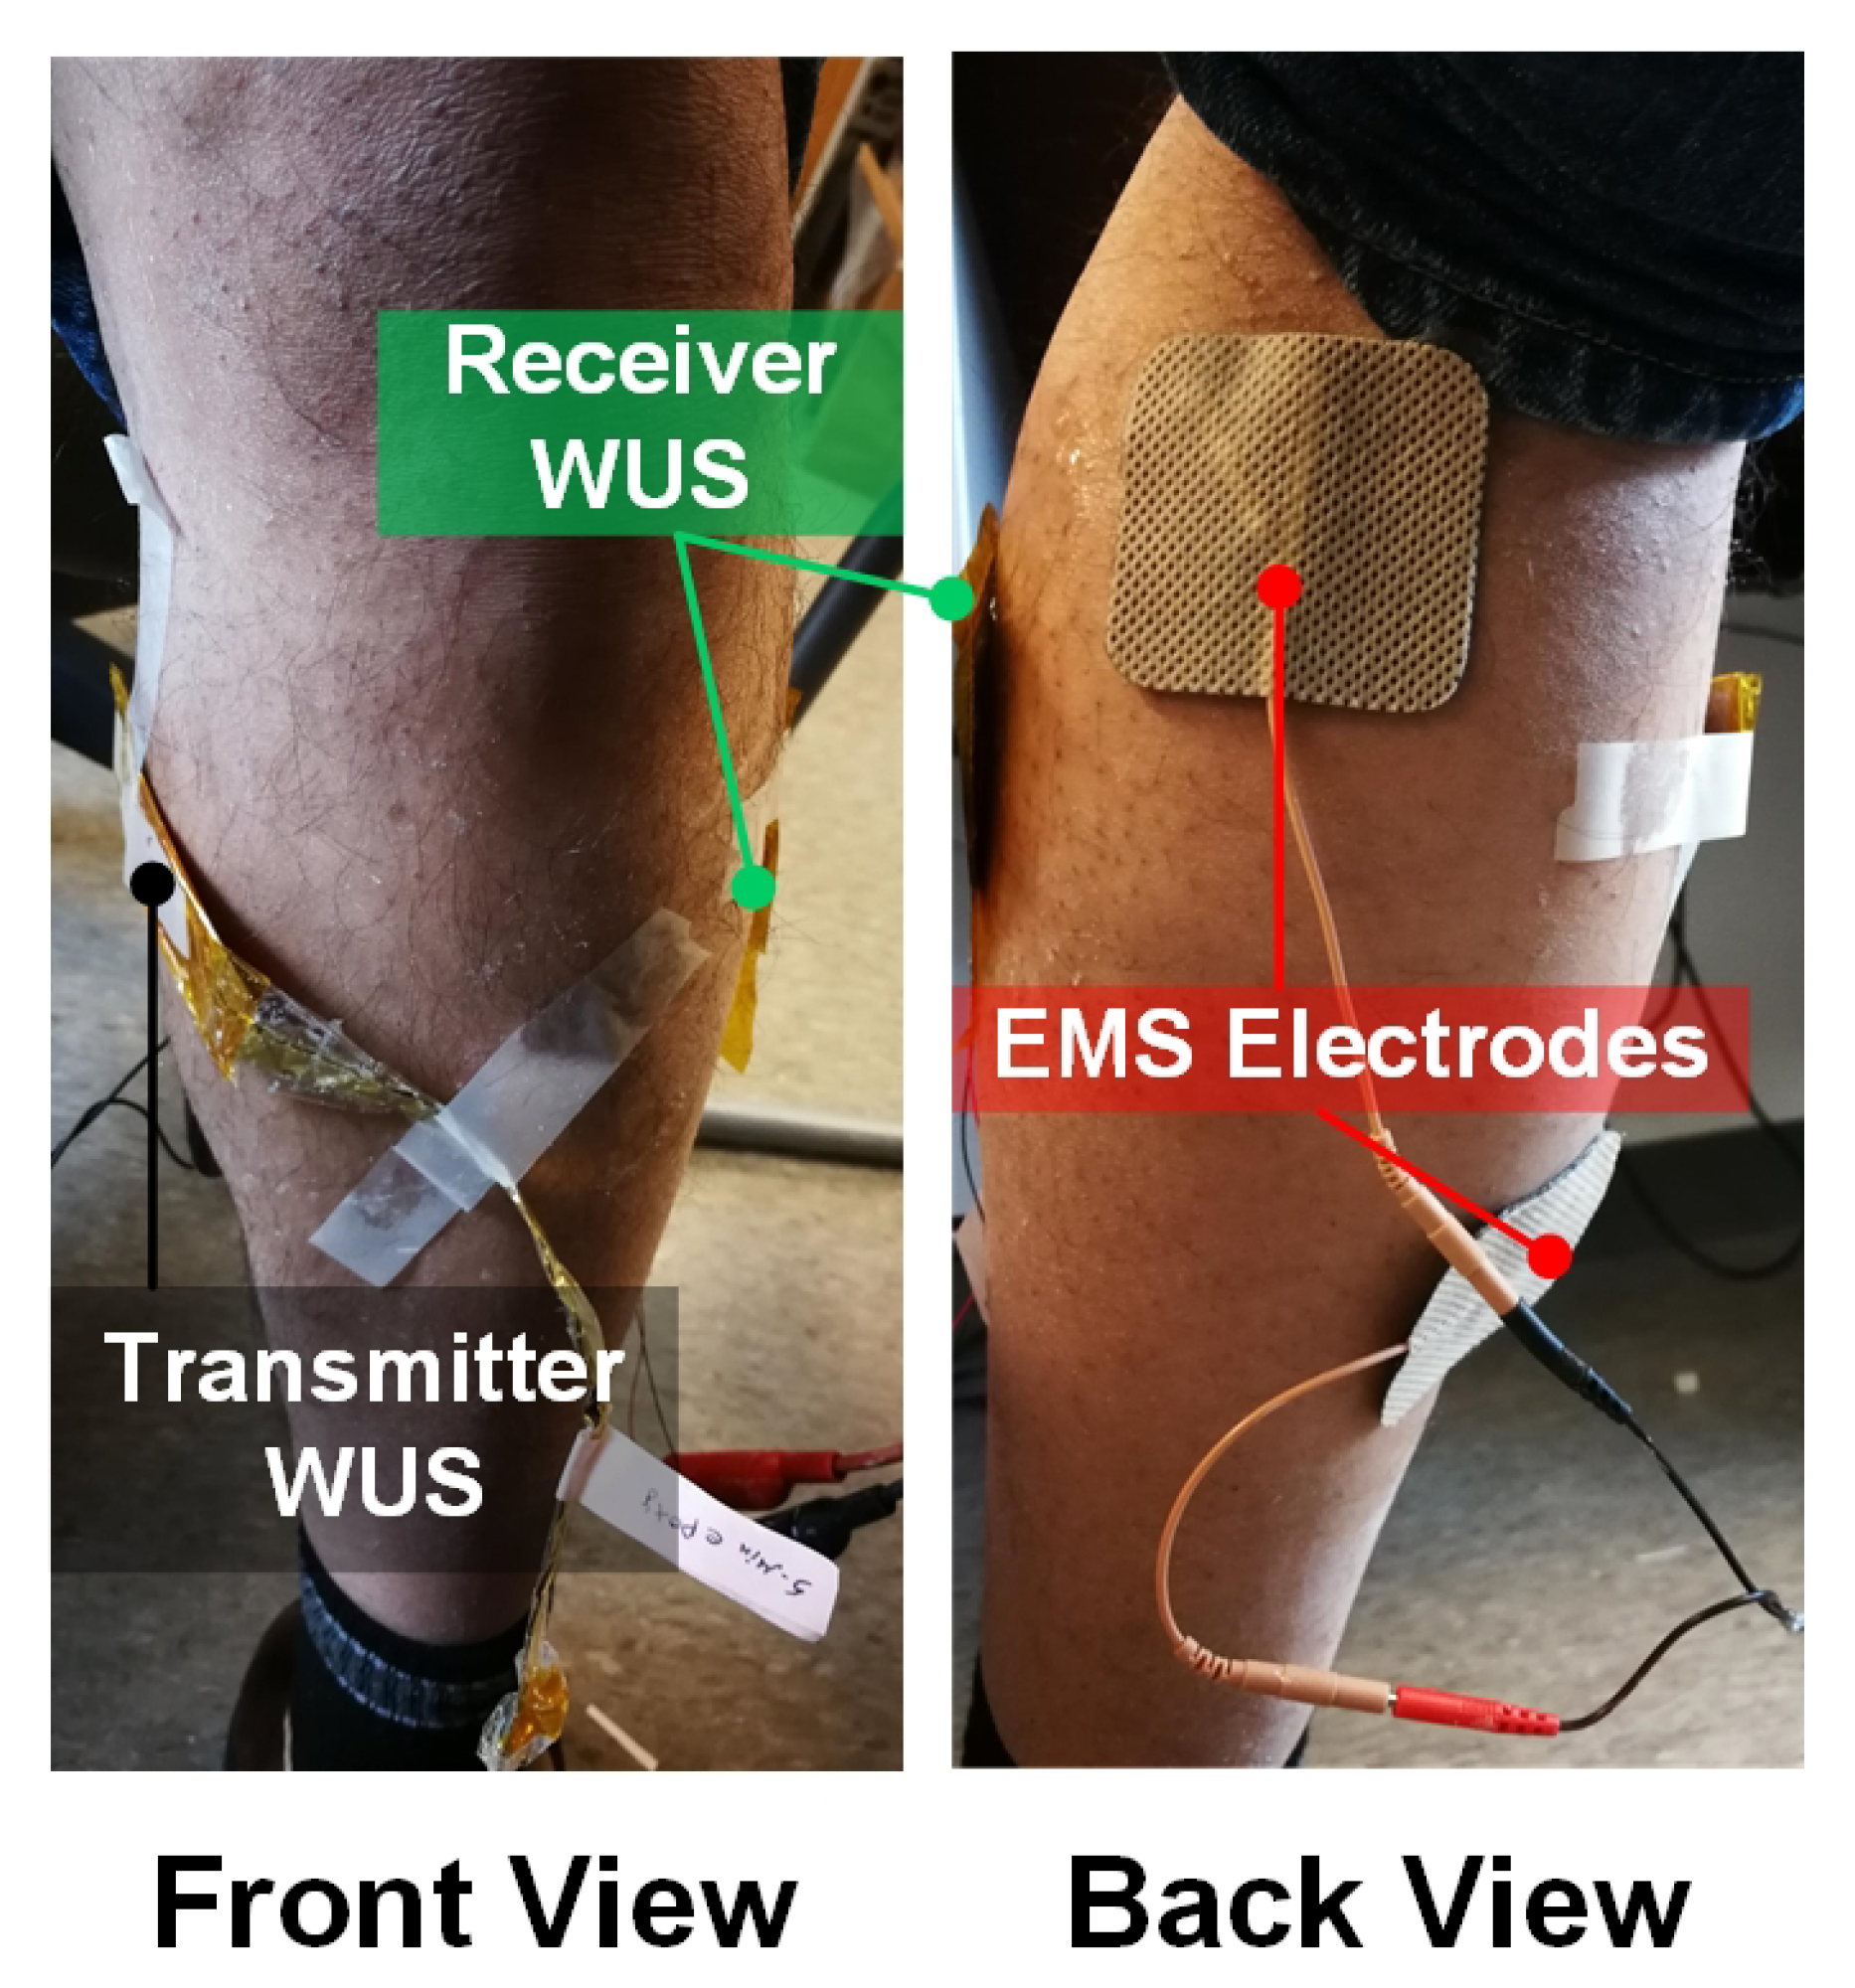
Figure 3.
A schematic of the measurement configuration of GC muscle contractions at a lower leg. The muscle contraction was evoked by EMS, and the tissue thickness changes were measured using two developed WUSs in the TT mode.
Figure 3.
A schematic of the measurement configuration of GC muscle contractions at a lower leg. The muscle contraction was evoked by EMS, and the tissue thickness changes were measured using two developed WUSs in the TT mode.
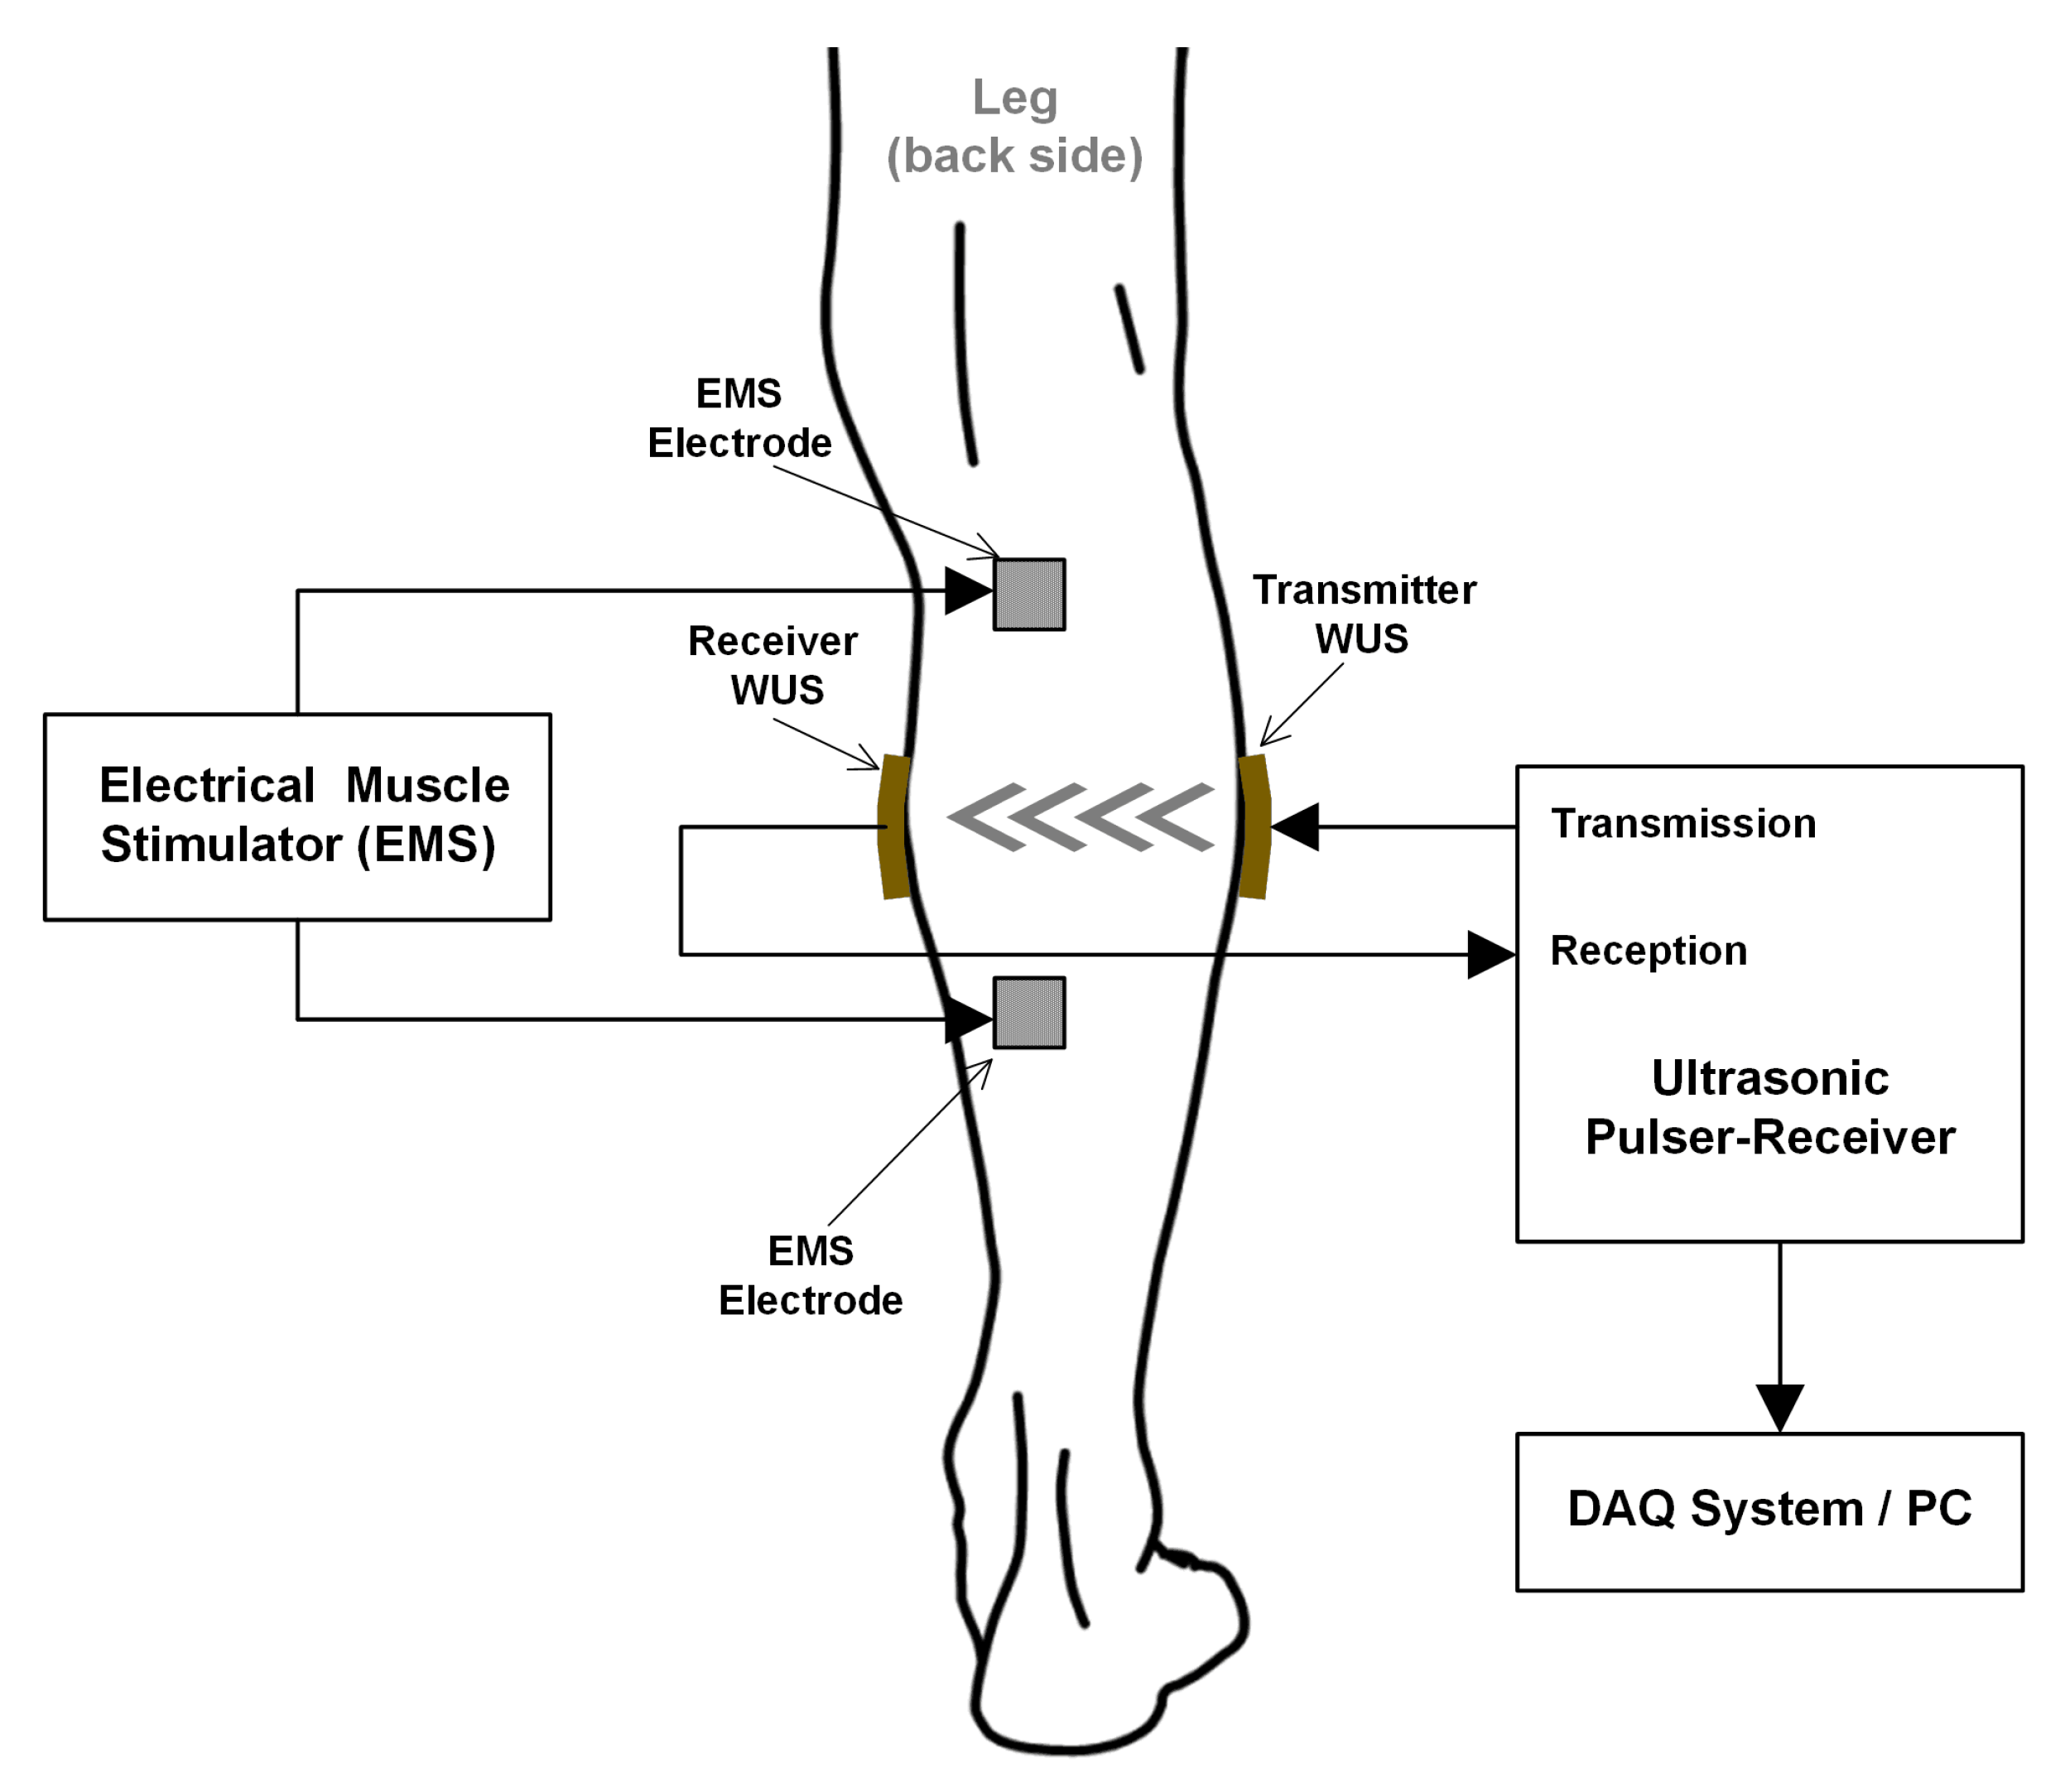
Figure 4.
The received ultrasonic radio-frequency (RF) signals using the developed WUSs in the TT mode (a) and their frequency spectra (b). The dashed line indicates a relaxed state of the GC muscle, where the solid line indicates a contracted state.
Figure 4.
The received ultrasonic radio-frequency (RF) signals using the developed WUSs in the TT mode (a) and their frequency spectra (b). The dashed line indicates a relaxed state of the GC muscle, where the solid line indicates a contracted state.

Figure 5.
Tissue thickness changes, measured by the WUSs, due to the electrically evoked contraction of GC muscle at EMS frequencies of: 2 Hz (a), 4 Hz (b), 6 Hz (c), 8 Hz (d), 10 Hz (e), 12 Hz (f), and 30 Hz (g).
Figure 5.
Tissue thickness changes, measured by the WUSs, due to the electrically evoked contraction of GC muscle at EMS frequencies of: 2 Hz (a), 4 Hz (b), 6 Hz (c), 8 Hz (d), 10 Hz (e), 12 Hz (f), and 30 Hz (g).
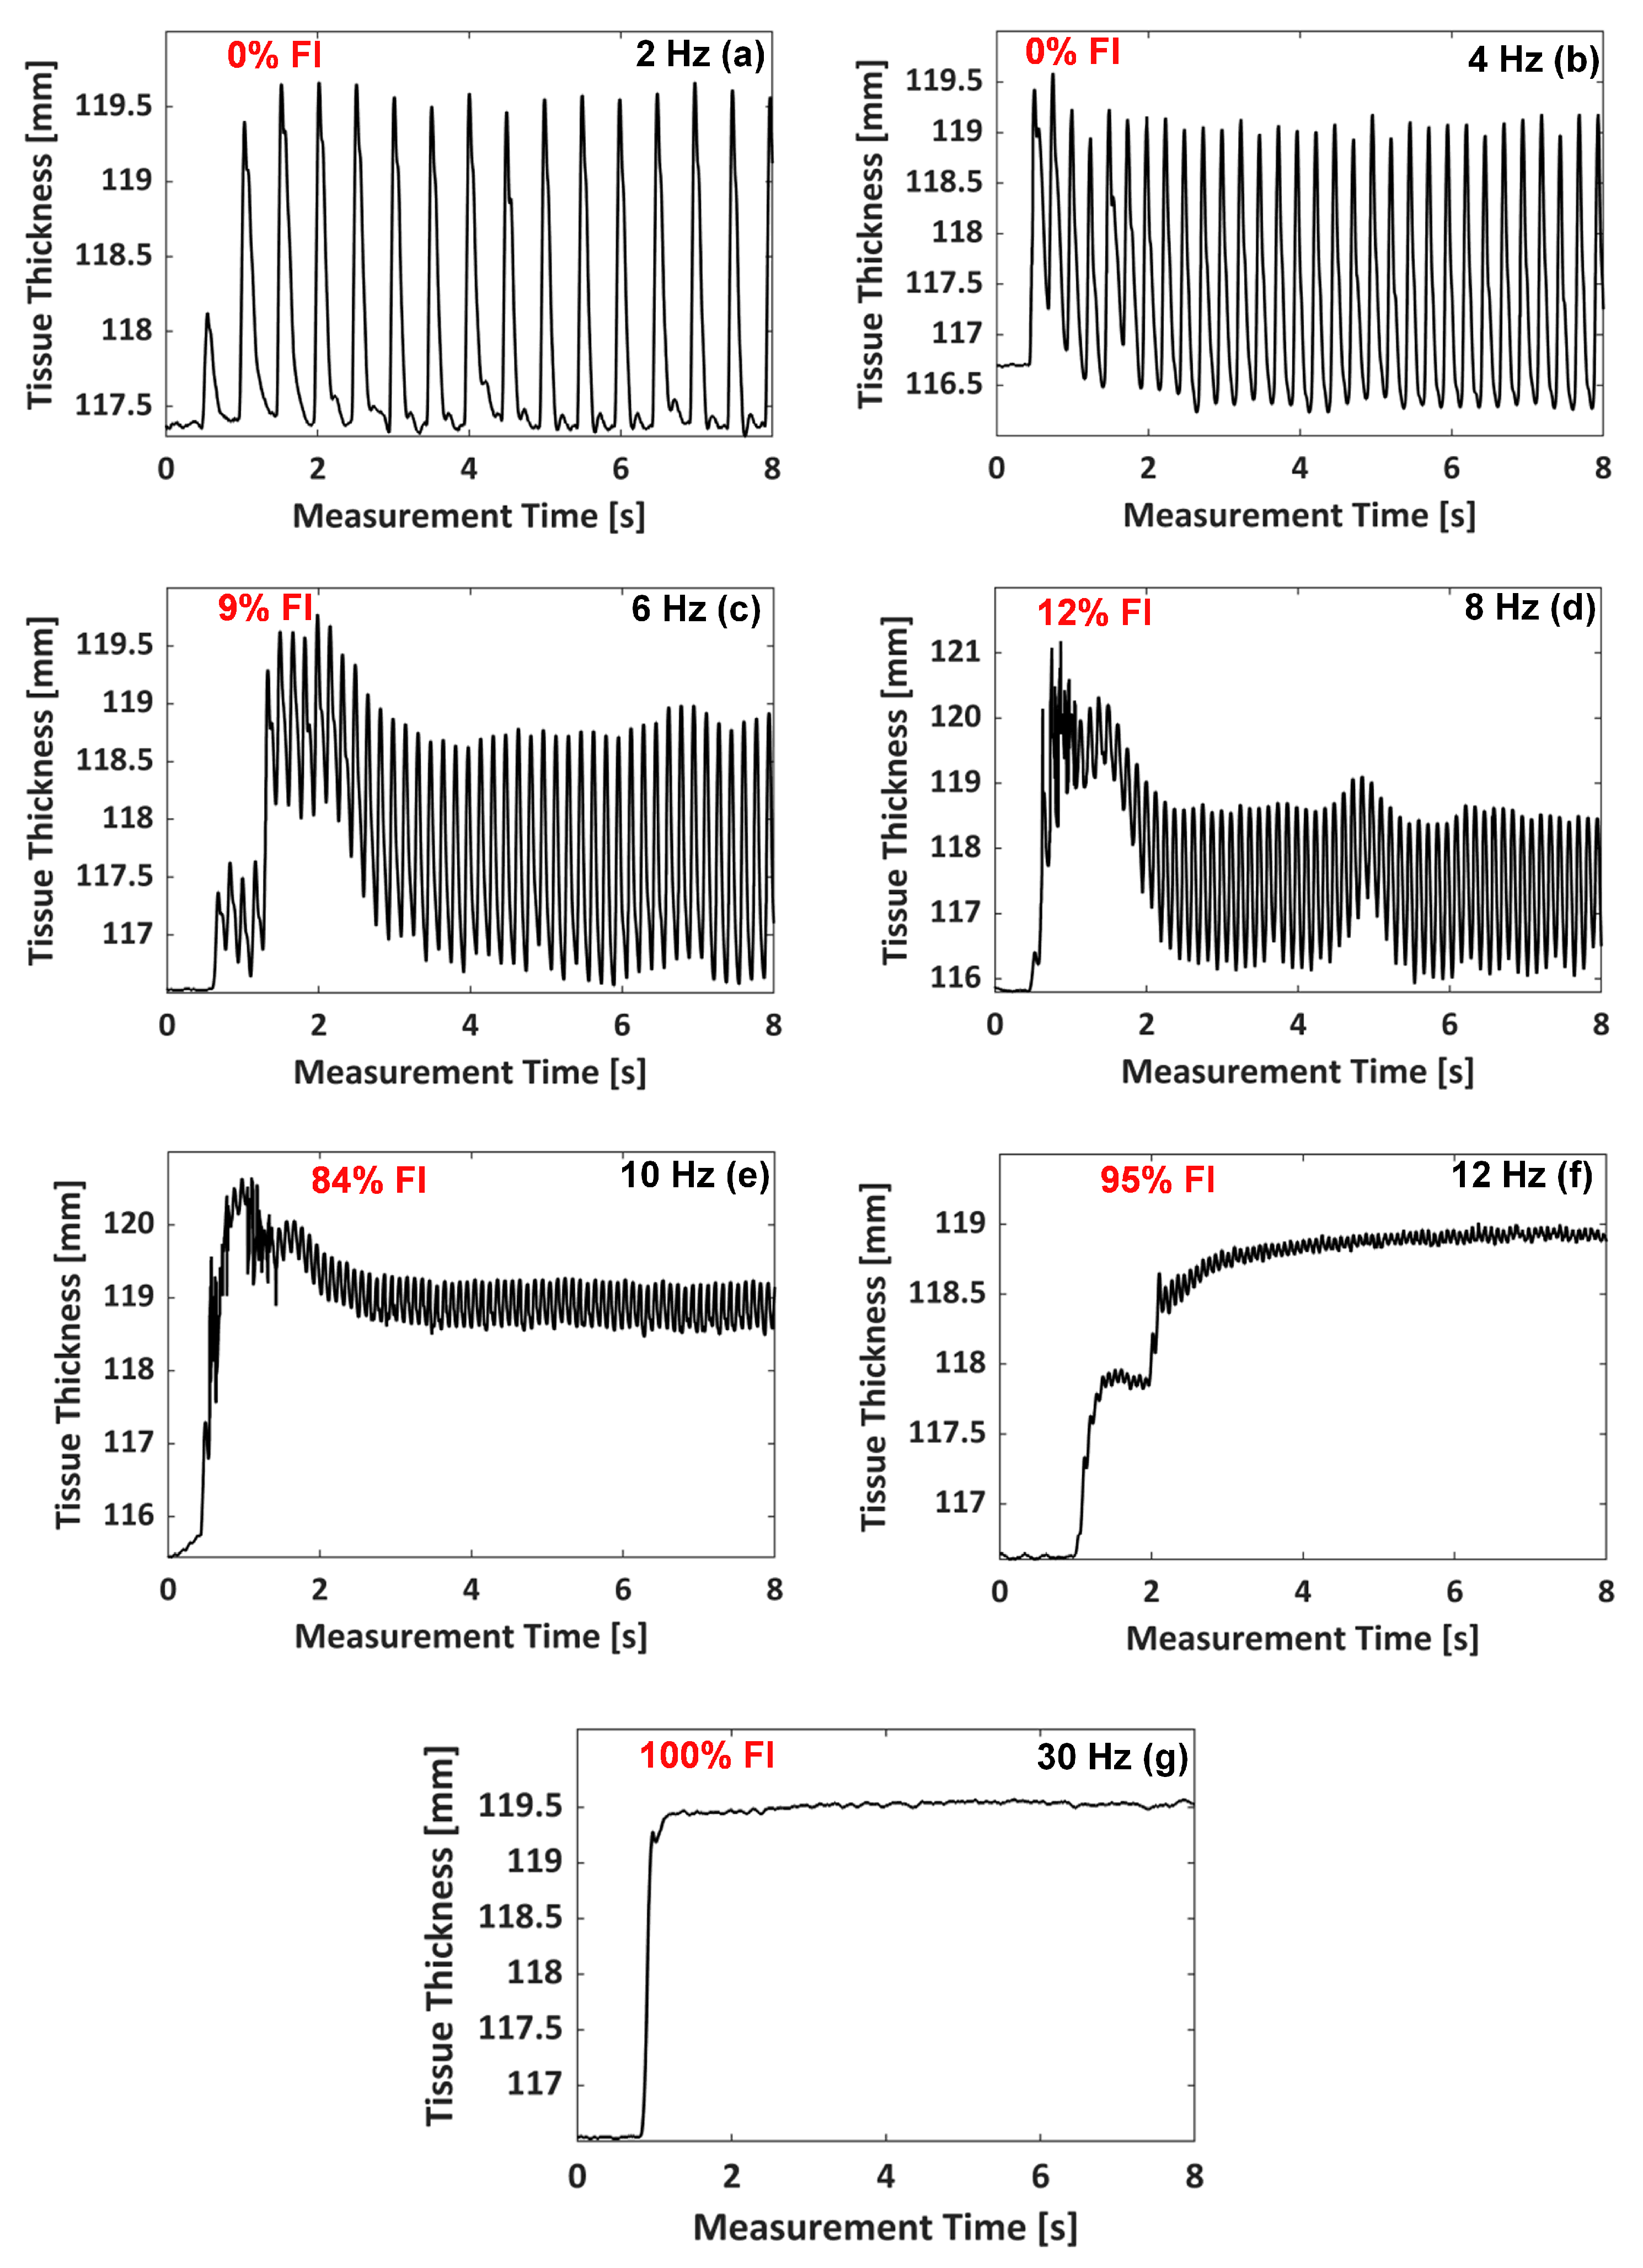
Figure 6.
Definition of fusion index (FI) quantifying the tetanic contraction progression level [110,111,112].

Figure 7.
FI value (cross mark) with the standard deviation (error bar) at each EMS frequency, obtained from the results shown in Figure 5. FI-EMS frequency curve denoted by the solid line was obtained by curve fitting of a sigmoid function.
Figure 7.
FI value (cross mark) with the standard deviation (error bar) at each EMS frequency, obtained from the results shown in Figure 5. FI-EMS frequency curve denoted by the solid line was obtained by curve fitting of a sigmoid function.
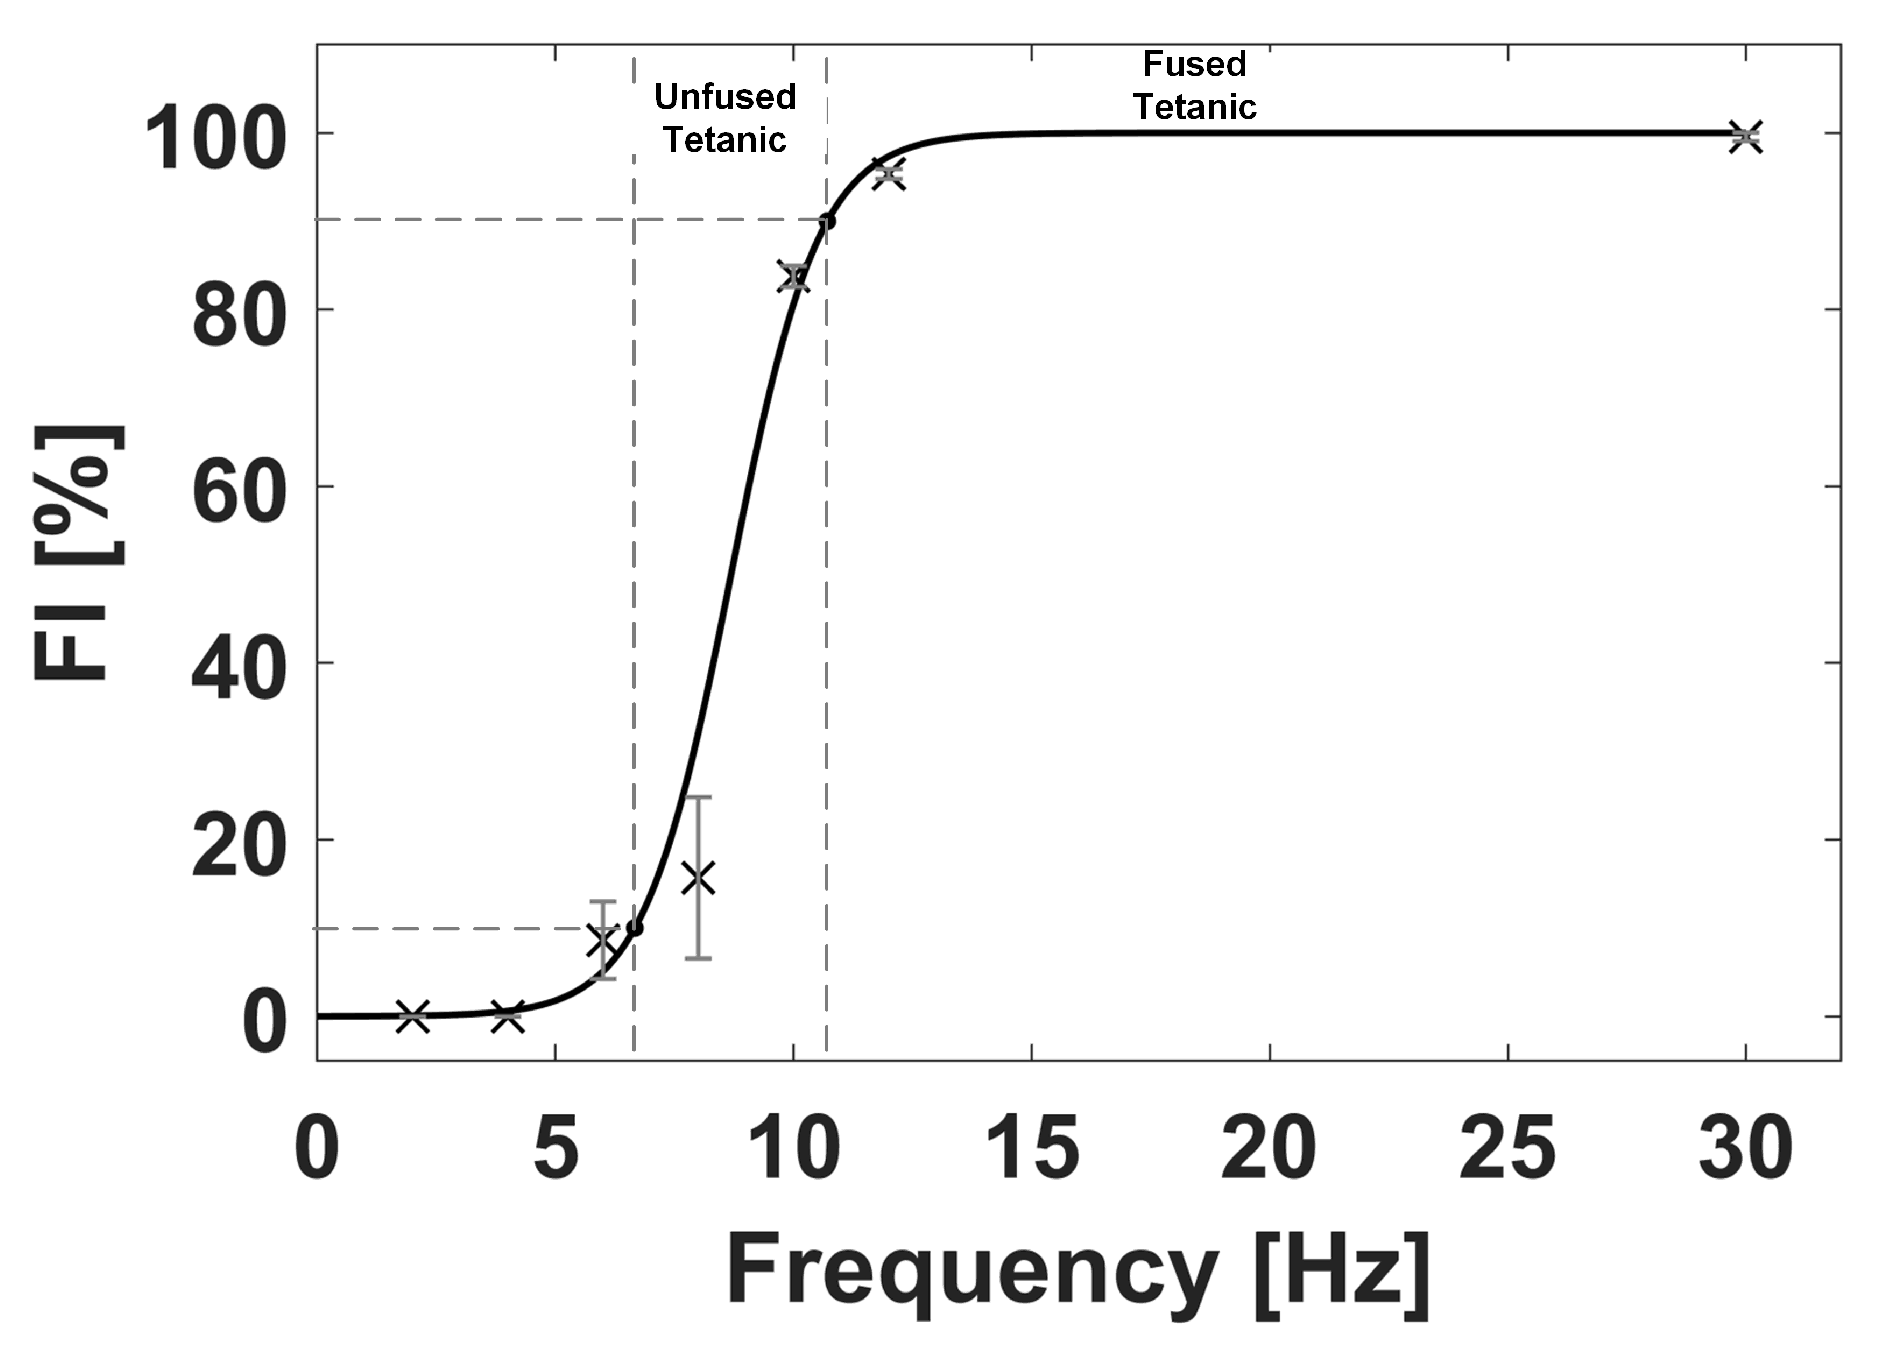
Figure 8.
Extracted contractile parameters from a chosen single contraction twitch of the GC muscle evoked at EMS frequencies of: 2 Hz (a), 4 Hz (b), 6 Hz (c), 8 Hz (d), and 10 Hz (e).
Figure 8.
Extracted contractile parameters from a chosen single contraction twitch of the GC muscle evoked at EMS frequencies of: 2 Hz (a), 4 Hz (b), 6 Hz (c), 8 Hz (d), and 10 Hz (e).
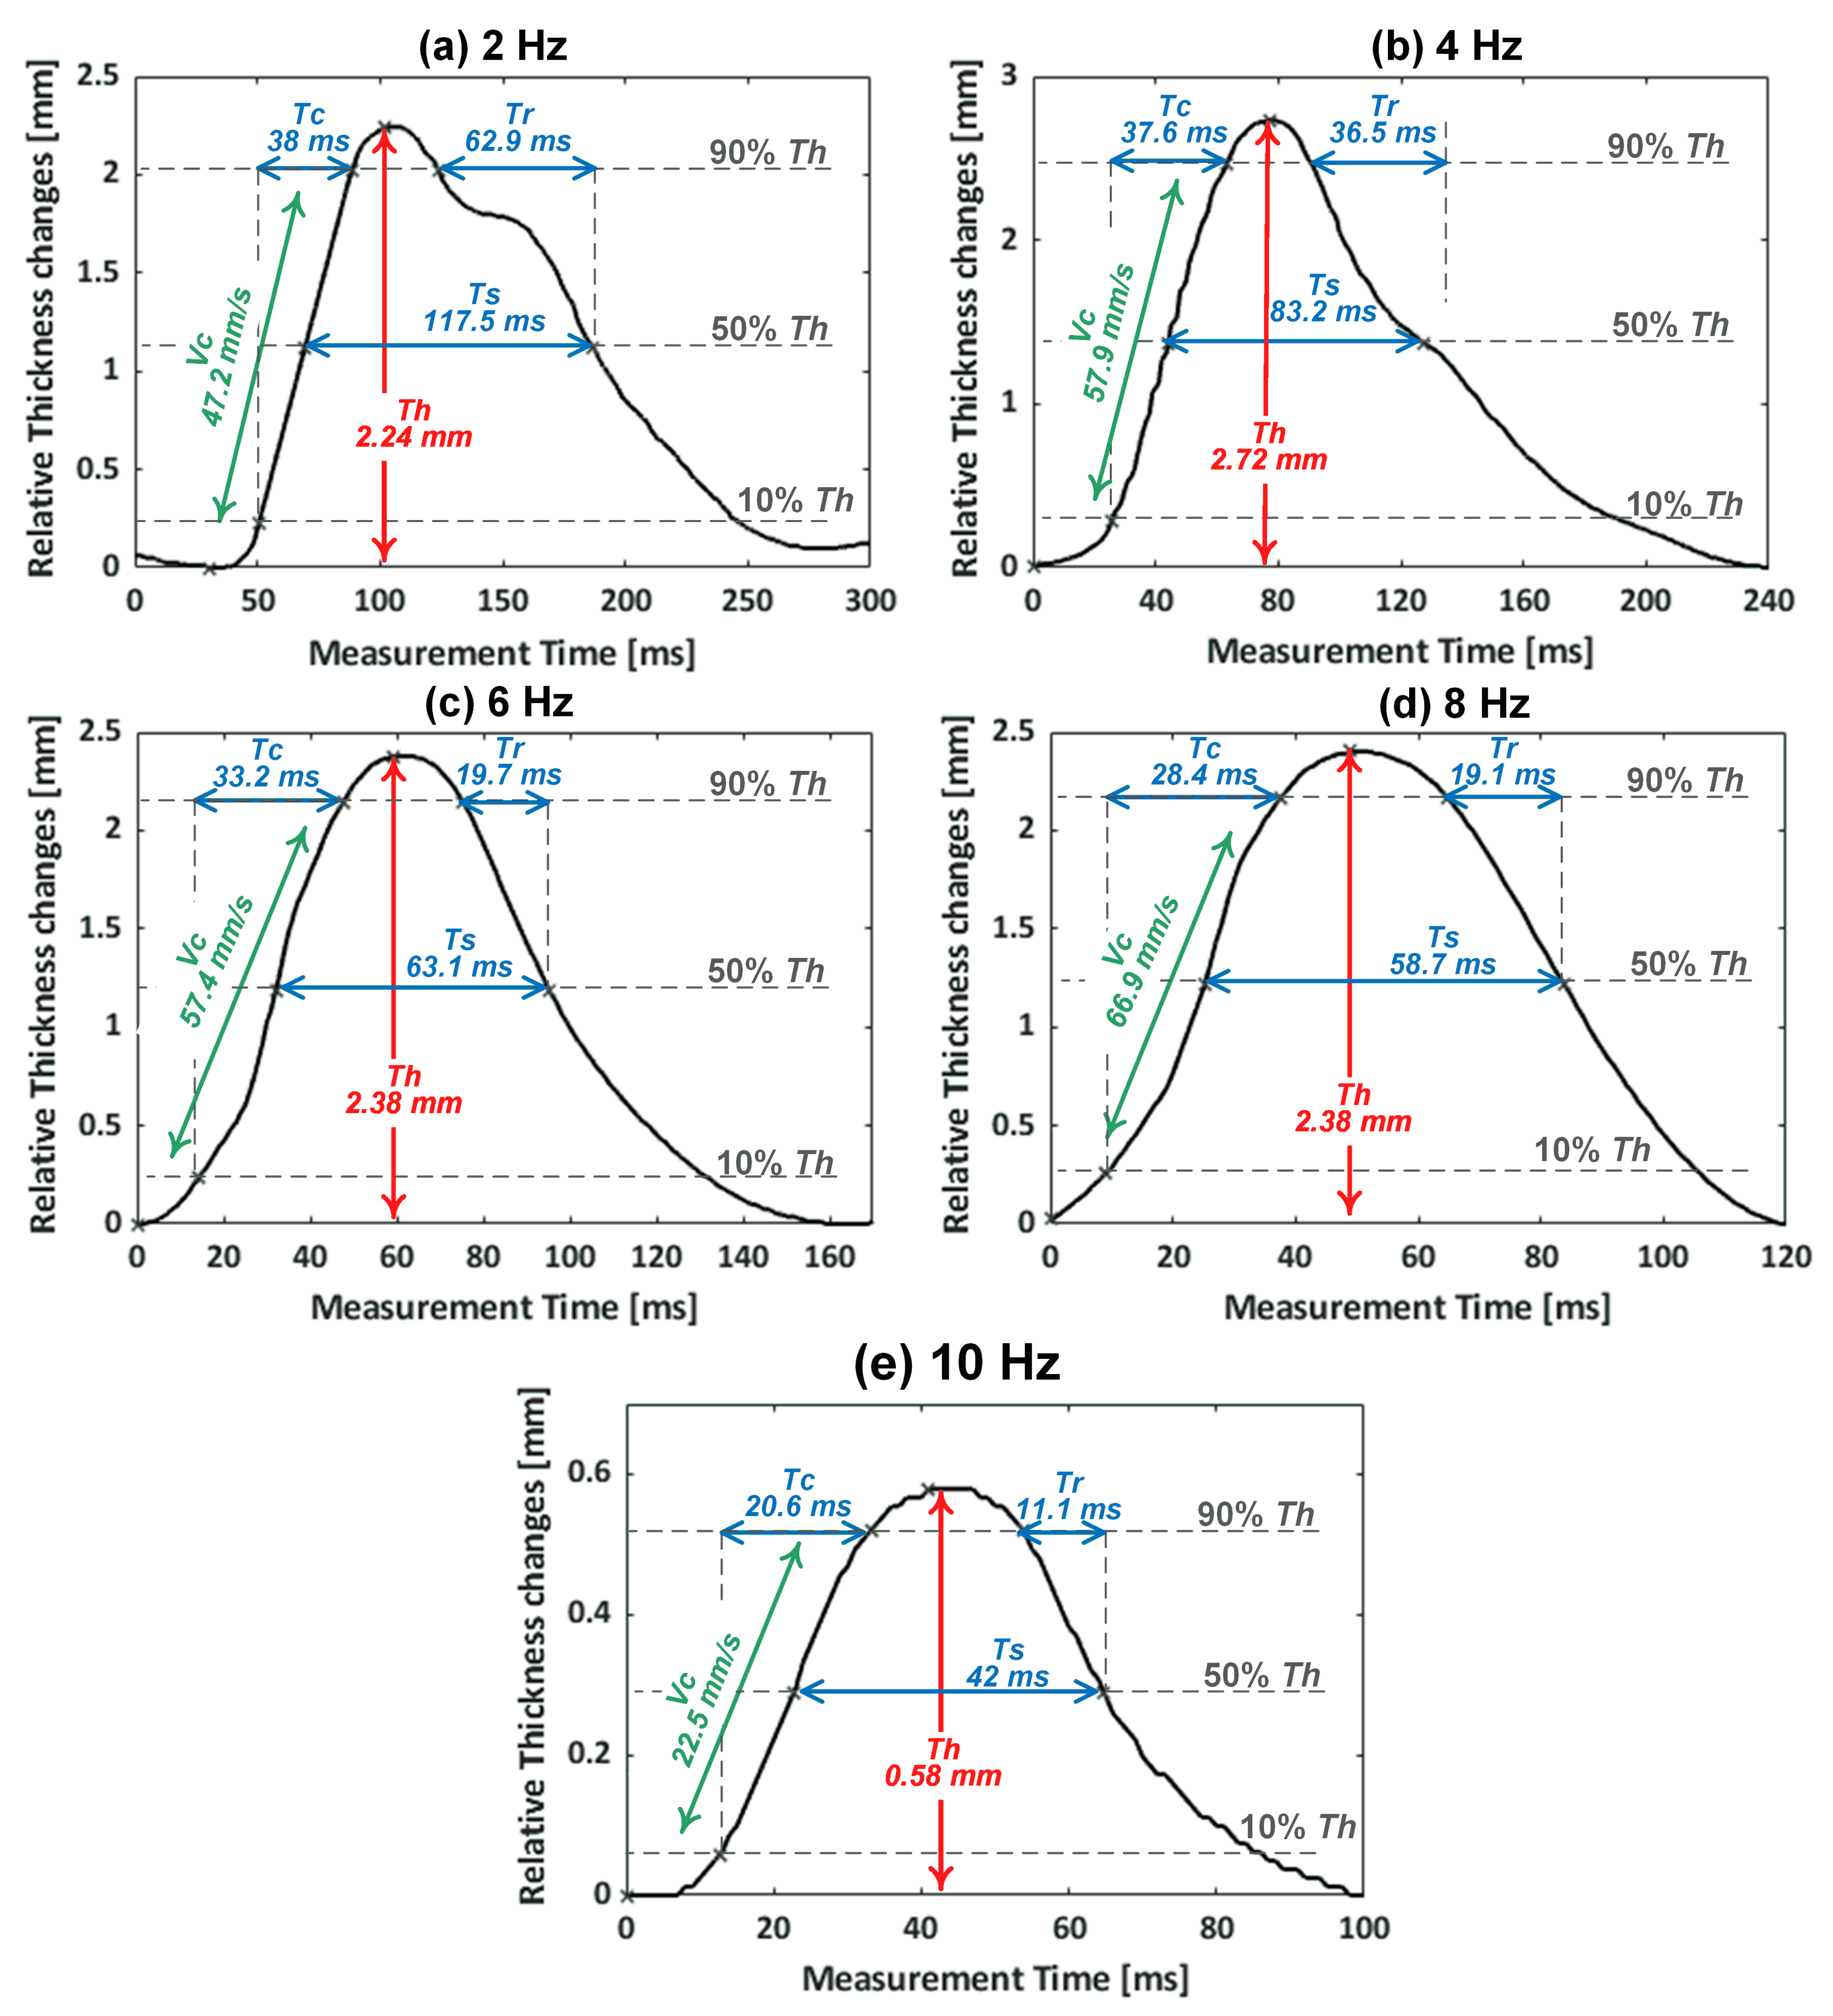
Figure 9.
The average contractile parameters of , , and of the monitored muscle contractions with respect to the EMS frequencies. The error bar indicates the standard deviation.
Figure 9.
The average contractile parameters of , , and of the monitored muscle contractions with respect to the EMS frequencies. The error bar indicates the standard deviation.

Table 1.
Average values with the standard deviation (SD) and coefficient of variation (CV) of the contractile parameters from the monitored tetanic contraction of GC muscle at the EMS frequencies.
Table 1.
Average values with the standard deviation (SD) and coefficient of variation (CV) of the contractile parameters from the monitored tetanic contraction of GC muscle at the EMS frequencies.
| EMS | Extracted Parameters Mean ± SD (CV) | ||||
|---|---|---|---|---|---|
| (mm) | (mm/s) | (ms) | (ms) | (ms) | |
| 2 Hz | 2.20 ± 0.08 (3.6%) | 46.13 ± 2.76 (6%) | 38.25 ± 1.50 (3.9%) | 116.28 ± 12.75 (11%) | 63.49 ± 12.12 (19.1%) |
| 4 Hz | 2.77 ± 0.09 (3.2%) | 59.68 ± 2.05 (3.4%) | 37.12 ± 1.05 (2.8%) | 77.57 ± 7.29 (9.4%) | 31.46 ± 6.76 (21.5%) |
| 6 Hz | 2.04 ± 0.15 (7.4%) | 50.22 ± 3.68 (7.3%) | 32.54 ± 0.88 (2.7%) | 61.77 ± 2.23 (3.6%) | 19.54 ± 1.81 (9.3%) |
| 8 Hz | 2.36 ± 0.19 (8.1%) | 68.56 ± 5.47 (8.0%) | 27.51 ± 1.41 (5.1%) | 58.10 ± 2.00 (3.4%) | 19.72 ± 1.64 (8.3%) |
| 10 Hz | 0.59 ± 0.03 (5.1%) | 22.03 ± 1.58 (7.2%) | 21.62 ± 1.58 (7.3%) | 40.07 ± 3.07 (7.7%) | 10.80 ± 2.08 (19.3%) |
© 2020 by the authors. Licensee MDPI, Basel, Switzerland. This article is an open access article distributed under the terms and conditions of the Creative Commons Attribution (CC BY) license (http://creativecommons.org/licenses/by/4.0/).
Share and Cite
MDPI and ACS Style
AlMohimeed, I.; Ono, Y. Ultrasound Measurement of Skeletal Muscle Contractile Parameters Using Flexible and Wearable Single-Element Ultrasonic Sensor. Sensors 2020, 20, 3616. https://doi.org/10.3390/s20133616
AMA Style
AlMohimeed I, Ono Y. Ultrasound Measurement of Skeletal Muscle Contractile Parameters Using Flexible and Wearable Single-Element Ultrasonic Sensor. Sensors. 2020; 20(13):3616. https://doi.org/10.3390/s20133616
Chicago/Turabian StyleAlMohimeed, Ibrahim, and Yuu Ono. 2020. "Ultrasound Measurement of Skeletal Muscle Contractile Parameters Using Flexible and Wearable Single-Element Ultrasonic Sensor" Sensors 20, no. 13: 3616. https://doi.org/10.3390/s20133616
Note that from the first issue of 2016, this journal uses article numbers instead of page numbers. See further details here.