Abstract
DNA aptamers are short nucleotide oligomers selected to bind a target ligand with affinity and specificity rivaling that of antibodies. These remarkable features recommend aptamers as candidates for analytical and therapeutic applications that traditionally use antibodies as biorecognition elements. Numerous traditional and emerging analytical techniques have been proposed and successfully implemented to utilize aptamers for sensing purposes. In this work, we exploited the analytical capabilities offered by the kinetic exclusion assay technology to measure the affinity of fluorescent aptamers for their thrombin target and quantify the concentration of analyte in solution. Standard binding curves constructed by using equilibrated mixtures of aptamers titrated with thrombin were fitted with a 1:1 binding model and provided an effective Kd of the binding in the sub-nanomolar range. However, our experimental results suggest that this simple model does not satisfactorily describe the binding process; therefore, the possibility that the aptamer is composed of a mixture of two or more distinct Kd populations is discussed. The same standard curves, together with a four-parameter logistic equation, were used to determine “unknown” concentrations of thrombin in mock samples. The ability to identify and characterize complex binding stoichiometry, together with the determination of target analyte concentrations in the pM–nM range, supports the adoption of this technology for kinetics, equilibrium, and analytical purposes by employing aptamers as biorecognition elements.
1. Introduction
Aptamers are short nucleotide oligomers selected and isolated by the Systematic Evolution of Ligands by Exponential Enrichment (SELEX) technique [1,2,3,4] to present high specificity and affinity for a large variety of targets ranging from ions [5,6,7,8] and small molecules [9,10,11,12] to whole cells [13,14,15]. Their ability to selectively recognize and bind targets recommends them as promising alternatives to antibodies for scientific and medical purposes [9,13,16,17,18,19,20,21,22,23,24,25]. Aptamers have been investigated as potential analytical and diagnostic tools with approaches and technologies that traditionally employ antibodies as recognition elements. Compared to antibodies, DNA aptamers are cost effective, present similar specificity and affinity for targets, have greater stability either lyophilized or in solution at room temperature, and are readily amenable to chemical modifications [17,25,26,27,28].
Numerous traditional and emerging analytical techniques have been proposed for aptamer-based qualitative and quantitative assessments of molecular and cellular interactions [23,25,28,29,30,31,32]. Aptamer-thrombin systems that use the 15-mer [33] and/or 29-mer [34] aptamer as biorecognition elements are among the most used in scientific investigations focused on affinity and concentration determination [29,35,36,37,38,39,40,41], which is justified by the essential physiological role of thrombin [42]. Nonetheless, both aptamers are far from fully characterized in terms of affinity and binding models [35]. For example, the reported affinity of the 29-mer aptamer varies by more than four orders of magnitude, and is also strongly dependent on the instrumental method and adopted binding model [29,34,35,36,37,39,40,41]. Only a few studies reported affinities in the nM range [40,41], close to the ~0.5 nM first reported by Tasset [34], while many others indicated affinities up to a few hundred times larger [29,35,36,37,39]. It is not clear if such discrepancies originate in the instrumentation and mathematical models employed, or whether particular experimental conditions and methodologies also influence the measurements [35]. To better understand the aptamer-thrombin interactions and pave the way towards analytical applications, we used the kinetics exclusion assay (KinExA) technology, developed by Sapidyne, Inc. (Boise, ID, USA) to determine the 29-mer aptamer affinity for thrombin, and thrombin concentration in solutions.
This technology provides highly accurate analyses of molecular interactions in true solution phase systems [43,44,45,46,47,48,49,50,51,52,53,54]. The principle of operation relies on specifically assessing only the unbound partner in a mixture of bound and unbound molecules [55,56,57,58]. The KinExA instrument is an automatic solution-handling system equipped with a sensitive and versatile fluorescence detection system [55,59,60,61]. To perform measurements, a small volume of a bi-molecular reaction mixture is flowed into a low-volume flow cell over a solid phase consisting of small beads functionalized to specifically bind one of the partners [52,56,62]. The contact time between the beads and solution is brief enough that any dissociation of the bi-molecular complex is insignificant. The beads specifically capture a small fraction of the free partner, proportional to total free molecule in solution, which is quantified by either intrinsic fluorescence of the captured molecules or by using fluorescent secondary probes (i.e., specific labels, anti-tag, or anti-species secondary antibody) that do not participate in the primary interaction in the solution phase [63,64]. Depending on the experiment goals, the resulting fluorescence signal measured directly on the beads is analyzed using various binding models and protocols to determine kinetics, affinity, or concentration [48,50,55,58,65,66,67,68,69].
Although this technology has been chiefly used with antibodies as biorecognition elements [46,54,55,56,70], the only restriction on recognition molecules is that at least one of them needs to be fluorescently detectable, either directly or indirectly [55]. We used this technology to interrogate an aptamer-thrombin binding system, and our protocols make full use of the advantages offered by the KinExA technology in terms of automation, accuracy, reliability, and adaptability. In addition, the use of aptamers enables using a complementary DNA on a solid phase [71,72,73,74] to specifically capture the free aptamer in solution (unbound to the target thrombin). By introducing a fluorescently-labeled aptamer as a specific biorecognition element for thrombin, the detection of the unbound aptamer can be achieved without using a secondary label. Our results demonstrate that the KinExA platform is directly applicable to aptamers for determining their affinity for target, whether simple or complex binding stoichiometries are considered, and for measuring concentration of target molecules.
2. Materials and Methods
The 29 nucleotide thrombin-specific aptamer (sequence 5′-AGTCCGTGGTAGGGCAGGTTGGGGTGACT-3′), identified by Tasset et al. [34] was obtained by custom order from Integrated DNA Technologies, Inc. (IDT, Coralville, IA, USA). At our request, the supplier provided the aptamer modified at the 5′ end by the addition of the fluorophore Alexa Fluor 647 to enable direct fluorescent detection. For the capture DNA (cDNA) strand, we selected a 16-nucleotide sequence complementary to bases 11–26, with two additional thymine residues and biotin at the 3′ end (5′-CACCCCAACCTGCCCTTT-biotin-3′). This material was also obtained by custom order from IDT. The DNA strands were reconstituted with nuclease-free water to a stock concentration of 100 µM. Sample solutions consisting of fluorescent aptamer (FA) with various concentrations of thrombin (MilliporeSigma, St. Louis, MO, USA) being prepared in sample buffer (SB), consisting of phosphate buffered saline with 0.02% sodium azide (PBS, Sapidyne Instruments) supplemented with 1 mg/mL bovine serum albumin (BSA, Sapidyne Instruments). The running buffer consisted of PBS alone.
2.1. Solid Phase and Sample Preparation, and Data Collection with the KinExA 3200 Instrument
The multi-step preparation of functionalized beads as solid phase for capturing the free FA in solution is shown schematically in Figure 1. Following the manufacturer’s guidance, 1 mL of 20 µg/mL BSA-biotin (MilliporeSigma) in PBS was mixed with 200 mg of polymethylmethacrylate (PMMA) beads of 98 µm average diameter (Sapidyne Instruments). The beads were rotated for two hours at room temperature, after which we performed five steps of gravity pelleting/PBS washing. Next, the beads were exposed to 100 µg/mL egg white avidin (MilliporeSigma) in PBS containing 10 mg/mL BSA and rotated for two hours to functionalize them for anchoring the biotinylated cDNA molecule through the strong biotin-avidin bond. After five steps of gravity pelleting/PBS washing, one vial of beads functionalized with BSA-biotin and avidin (BSA-B-A) was reserved for preliminary control experiments, while another vial underwent a last step of functionalization by immobilizing the biotinylated cDNA on the beads, following similar equilibration and washing procedures in which we used as bathing solution 1 mL of 2 µM biotinylated cDNA in PBS. The cDNA functionalized beads (BSA-B-A-cDNA) were further used for control, equilibrium, and concentration measurement experiments.
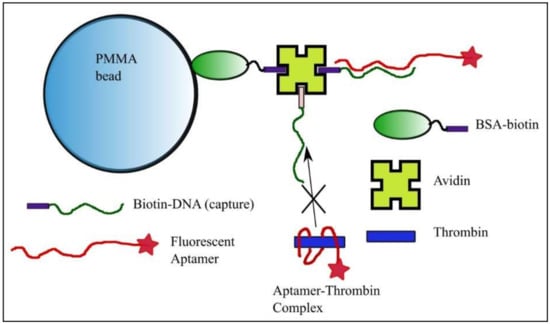
Figure 1.
Bead preparation for equilibrium and concentration measurements with the kinetics exclusion assay technology. Polymethylmethacrylate (PMMA) beads functionalized with bovine serum albumin (BSA)-biotin and avidin serve as anchoring elements for the DNA strand with sequence complementary to a portion of the fluorescent aptamer. The free aptamer is able to bind the complementary strand anchored to the bead, while binding of the aptamer-thrombin complex is prevented.
For the control experiments, we utilized the BSA-B-A and BSA-B-A-cDNA functionalized beads, which were automatically injected into the flow cell of the KinExA 3200 instrument with autosampler (Sapidyne Instruments). The controls included samples consisting of PBS alone (for baseline) or 50 pM FA prepared in SB. The equilibrium measurements (see Figure A1 and the explanations provided in Appendix A) employed a constant concentration of FA (i.e., 10 pM, 50 pM, and 10 nM) in SB, mixed with thrombin at final concentrations up to 1 µM, and equilibrated for at least two hours at room temperature. To demonstrate the potential of the technology for concentration and diagnostic testing using aptamers, we prepared mixtures of FA (50 pM) and thrombin (5 nM, 2.5 nM, and 0.5 nM). These samples were equilibrated at room temperature for two hours.
Aliquots of samples were passed over the functionalized beads in the flow cell of the instrument. A fresh aliquot of functionalized beads was used for each sample and replaced automatically using the default protocol supplied with the instrument. Sample measurement steps consisted of initiation with a flow of 100 µL of PBS, injection of 1 mL of the analytical sample (or control), and injection of 1 mL of PBS, all at a flow rate of 0.5 mL/min. This was followed by a final rinse with 1.5 mL of PBS at a rate of 1.5 mL/min. The fluorescence data from the detector (expressed in volts) was recorded at a rate of one sample/second during the above steps and plotted for data interpretation (see Figure A1 in Appendix A for reference) and further analysis. The same measurement steps were followed throughout for concentration measurements.
2.2. Data Analysis
Details of the signal equation used for fitting the 1:1 binding model [55,59,75,76], n-curve analysis module [54,67,70,76], mixed model [75,77], and logistic equation for concentration determination [61,78] are provided in Appendix A. The data were analyzed and plotted with KinExA Pro software (version 4.4.36, Sapidyne Instruments), and Origin 8.5.1 software (Origin Labs, Northampton, MA, USA).
3. Results and Discussion
In this work, we investigated the suitability of the kinetic exclusion assay technology for measuring an aptamer’s binding affinity for its designated target, and for using the aptamer as a recognition element in a bioassay for thrombin concentration measurements. Our proposed investigative platform employs BSA-B-A-cDNA functionalized beads to capture a fraction of the free FA remaining in equilibrated mixtures of analyte (thrombin) and FA. A potential impediment to this approach would be an unexpected strong, non-specific binding of the aptamer molecules to functionalized beads in the absence of cDNA immobilized on their surface. To address this issue, we performed preliminary investigations of specific and non-specific binding by employing functionalized beads without and with cDNA immobilized on their surface (control and capture beads, respectively) and running the experiments with 1 mL of either FA-free SB or SB containing 50 pM FA.
The analysis of the evolution of the raw fluorescence signal (Figure 2) shows steady, almost identical baselines (~1 V absolute signal value) recorded for both types of beads in the absence of FA in the solutions. When the FA sample reached the flow cell containing control beads, the fluorescence started to slowly increase and reached a maximum value of ~1.1 V (~0.1 V above baseline). Such a small change of the signal was expected since the FA concentration in the flow solution was very low (50 pM). During the rinsing step, the free FA was washed away with the buffer, as inferred from the gradual decrease of the fluorescence signal. The small difference from the baseline recorded at the end of the trace versus baseline indicated a weak, non-specific binding (NSB).
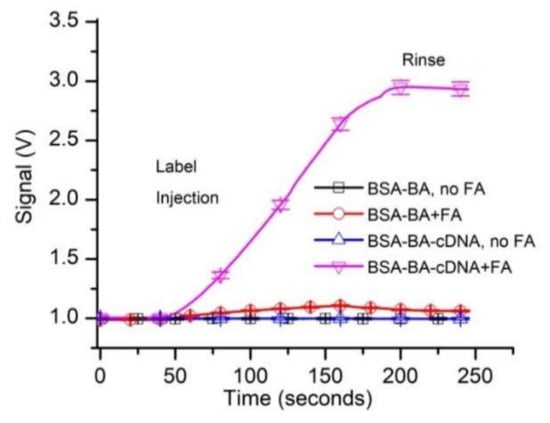
Figure 2.
Preliminary testing of the fluorescent aptamer’s suitability for equilibrium and concentration measurements by kinetic exclusion assay. The tests investigated specific and non-specific binding of 50 pM fluorescent aptamer (FA) to control and capture beads. All the data in the graphs represent experimental values, with the symbols added for identification. Each curve shows the average values of experimental data (n = 3, ±SD).
When the FA-containing sample was flowed over capture beads (BSA-B-A-cDNA), the fluorescence signal increased significantly (Figure 2) and reached an absolute value of ~2.9 V (~1.9 V above baseline). This much larger signal may be explained by a continuous accumulation of the FA in the flow cell as it was captured by the cDNA immobilized on the capture beads. The signal decreased by only a small fraction during the rinsing process, suggesting that the FA bound very strongly to the capturing beads. This was anticipated since the resulting duplex DNA, although relatively short, has a predicted melting temperature of 58.4 °C and the estimated free energy for hybridization is large (∆G = −39 kcal/mole; supplier data).
The specific binding of free FA resulted in a strong increase in the fluorescence signal (~1.9 V above the baseline), while the non-specific binding led to a change in the signal of less than 0.1 V. Consequently, we concluded that the experimental system was adequate for initiating further investigation of affinity and concentration measurements.
Having established the existence of specific FA binding to our functionalized solid phase, we turned our attention to determining the affinity of the aptamer for thrombin from kinetic exclusion assay experiments. We assumed that the FA-thrombin complex will not be able to form a duplex with the cDNA; therefore, specific capture of the complex will be prevented. In accordance with standard practice for n-curve analysis, we set up three experimental curves, for which we adjusted the concentration of the FA in SB (i.e., 10 pM, 50 pM, and 1 nM, respectively), used as a constant binding partner (CBP) for each curve. The thrombin amount in the sample tubes was adjusted (titrated) for final concentrations ranging from 5 pM to 1 µM, and we used up to 18 thrombin concentrations (including no thrombin samples) for the experiments. The 1 nM and 50 pM FA samples were incubated for two hours, and the 10 pM FA samples were incubated for 6.5 h before measurements with the KinExA 3200 instrument, and each sample set was run at least in duplicate. A typical run for the sample set that utilized 50 pM FA as CBP is shown in Figure 3. The plot clearly indicates that the fluorescence signal, indicative of free FA in the equilibrated solutions decreased significantly as the titrant (thrombin) concentration increased. The slope of the traces increased with the amount of free FA in the equilibrated samples (therefore, it decreased as more thrombin was added to the reaction tubes), and confirmed the signal rate’s dependency on the concentration of binding partner [74].
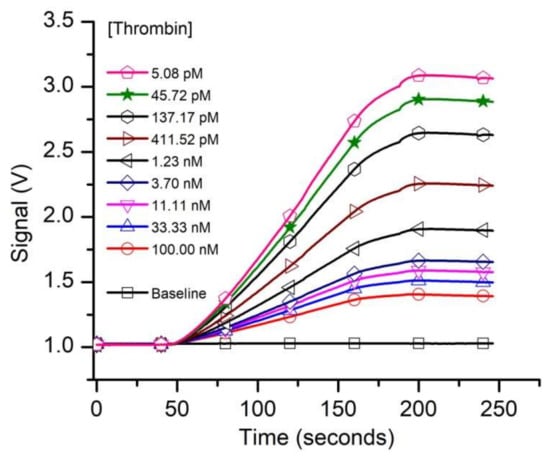
Figure 3.
The evolution of the raw fluorescence signal recorded from capturing the free FA left in solutions equilibrated with various thrombin concentrations. The free FA availability decreased as the titrant concentration in the samples increased. For this experiment we utilized 50 pM FA as constant binding partner (CBP).
The curves corresponding to the three different FA concentrations were simultaneously analyzed with the n-curve analysis module [54,67,70,76] included with the KinExA Pro software package to determine the equilibrium dissociation constant Kd. The calculated percent of free FA vs. thrombin concentration and the theoretical curves for the three FA concentrations for a 1:1 binding model (Equation (A1)) are shown in Figure 4a.
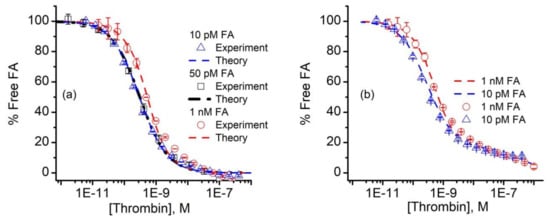
Figure 4.
Analysis of FA binding data. (a) The n-curve analysis provided the calculated percent free FA (symbols) and theoretical simulations (dashed lines) for 10 pM, 50 pM, and 1 nM FA in the thrombin-titrated solutions for a 1:1 binding model. (b) The 10 pM and 1 nM FA signal data (symbols) were fitted with a binding model (dashed lines) that comprised a hypothetical mixture of two competing aptamers, characterized by different Kd values. The experimental data represents average values ± SD (n = 3 for 50 pM FA, and n = 2 for 10 pM and 1 nM FA).
The n-curve analysis provided a Kd of 298 pM (+111/−81 pM), which is in good agreement with previous estimates of the same aptamer-thrombin system of ~0.5 nM [34], or a few nM [40,41]. We also noted that the 10 pM and 50 pM FA curves were nearly identical (Figure 4a), which can only occur when the thrombin concentration corresponding to the 50% inhibition point (approximately 300 pM) of both curves is equal to the Kd [59]. In addition to data overlapping, the 10 pM and 50 pM FA concentrations exhibited a better fit than the 10 nM FA samples. Even so, one may observe a distinct deviation of the data from the 1:1 binding model used for analysis (i.e., Equation (A1)) for the higher thrombin concentrations. All the additional curves we obtained and analyzed showed the same systematic error in the same range. Aware that mixtures of antibodies can generate standard binding curves of similar appearance [75,77], we wondered if the fit discrepancies in Figure 4a could be the result of competition between two or more populations of FA, each with its own affinity for thrombin. To examine this hypothesis, we followed the example provided by Glass et al. [77] and set up a model that accounted for the competition of two FA of differing Kd for thrombin [59,75]. With this competitive binding model, we obtained a qualitatively better fit to the measured data (Figure 4b), which corresponded to a hypothetical two component FA mixture, in which 84% has a calculated Kd for thrombin of 298 pM, and the remaining 16% has a Kd of 500 nM.
A better fit is not sufficient to prove that the dual binding model is the correct one, and we have no reason to believe that the mixture, if it exists, would have only two components. In this regard, we note that the fitted FA activity in Figure 4 was only ~47% for all FA concentrations, suggesting that half of the FA was actually inactive with regard to binding thrombin. Previous investigations on the same aptamer considered either a 1:1 binding model or models that imply multiple binding sites, including cooperativity and induced fit mechanisms [29,35,36,37,38,39,40,41]. Nonetheless, almost all of those approaches report significantly lower affinities, and the possibility of a mixed population was not addressed. The fluorescent label that we added to the aptamer may alter the binding and equilibrium, but most of the studies cited herein as comparison have also used labels or spacers as modifiers. We do not believe that this particular label addition led to such a significant increase in affinity, although this potential effect is worthy of further investigations. The complex binding observed in our case may be inherent to this aptamer, or may originate in a potential duplex formation between a shorter segment of the cDNA and a complementary sequence of the FA outside the thrombin binding site. Either way, it is a strength of the KinExA technology that deviation from 1:1 binding can be discerned in the collected data, which we anticipate will prompt further inquiry into mechanisms that may explain the observed binding curves for this and other aptamers.
Our next experiments aimed at evaluating the FA as a bioassay recognition element using kinetics exclusion assay technology. This task does not require a well-defined Kd, only that we have a reproducible standard curve. To measure thrombin concentration by employing kinetic exclusion assay using aptamers as ligands, we included measurements of mock unknowns (i.e., 5.0 nM, 2.0 nM, and 0.25 nM thrombin concentration) in the 50 pM FA assay. Similar to the experimental results plotted in Figure 3, the resulting raw signal curves (Figure 5a) recorded with the equilibrated mock samples show that the end signal decreased substantially when the thrombin concentration increased, indicating reduced availability of FA in the equilibrated mixtures.
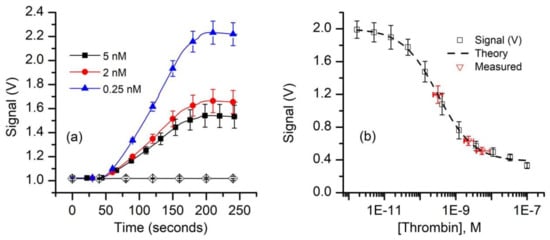
Figure 5.
Equilibrium measurements of thrombin concentration by kinetic exclusion assay. (a) The raw fluorescence signal recorded for thrombin concentrations of 0.25 nM, 2 nM, and 5 nM (n = 3, ± SD) in equilibrated mixtures at a constant FA concentration of 50 pM. The symbols were added to facilitate curve discrimination and identification. (b) The end signal values measured against the baseline for standard and mock samples (symbols) were plotted and fitted (dashed line) with the four-parameter logistic equation (Equation (A2)) to determine the unknowns. The range of concentrations represented by the x error bars on the “measured” data points represent concentrations corresponding to the average measured signal (n = 3) ±SD of the measured signals.
Since the 1:1 binding model (Equation (A1)) proved unsatisfactory to best describe the experimental data, we used the four-parameter logistic (Hill slope) equation (Equation (A2)) [61,78] to fit the signal data for the standard curve (Figure 5b). The best fit parameter values calculated with this model are: upper asymptotic value B1 = 2.0 V, lower asymptotic plateau (NSB) B2 = 0.38 V, inflection point B3 = 0.32 nM, and a Hill slope B4 = 0.87. These parameters were also used to compute the “unknown” concentrations from the average values of the respective signals using Equation (A3). Our calculations provided average concentration values equal to 5.4 nM for the 5 nM sample, 2.2 nM for the 2.0 nM sample, and 0.32 nM for the 0.25 nM sample (Figure 5b). It is interesting that although only one of the samples (i.e., 0.25 nM thrombin) had a concentration near the middle of the curve, while the more concentrated samples were intentionally outside this region, the determined average concentration values were satisfactory. As expected, the uncertainty in the determined concentration is larger and asymmetrical for the higher concentrations because of the more gradual slope and curvature of the standard curve at these concentrations. From the signal curve (Figure 5b) one may easily observe that for this FA concentration, visible changes in the binding signal occurs for thrombin concentrations in the pM range; further optimizations of the FA concentration in relation to affinity may provide improved sensitivity, even in the sub-pM range [59].
4. Conclusions
This work strongly supports the hypothesis that the kinetic exclusion assay technology is suitable for kinetics and equilibrium measurements employing aptamers as specific biorecognition elements. Our experimental results demonstrate that both aptamer characterization and analyte concentration measurements are achievable through this methodology. All the advantages presented by this technology are anticipated to be maintained when aptamers are used as ligands for analytes. The KinExA technology does not suffer from surface matrix affinity effects [45,79], mass transport limitations, or mobility effects [55,80], does not require radioactive labels, avoids any surface-immobilization procedure that may alter binding constants compared to those measured in true solution phase, is highly accurate for repeated readings [81], and has no molecular weight limitations [55,82,83]. Multiple studies have revealed its superiority to SPR or ELISA in terms of accuracy, sensitivity, versatility, and reliability [45,48,49,76,81,82,84]. The instrument may assess, in various formats, the binding of partners ranging from ions [82,83] and small molecules [50,85,86] to large structures (e.g., whole cells, including fixed cells) [49,76,85,87], which makes aptamers an excellent choice for numerous kinetics, equilibrium, and concentration measurements by using the KinExA technology. The ability to identify complex binding stoichiometries may provide valuable insights into fundamental analyses of aptamer–analyte interactions, while its high sensitivity and accuracy recommend this technique for numerous bioanalytical applications.
Author Contributions
M.H.S. and D.F. contributed to conceptualization, methodology, investigation, formal analysis, validation, and writing of the manuscript. All authors have read and agreed to the published version of the manuscript.
Funding
This research was funded by the National Science Foundation, grant number 1554166; M.S. received financial support for graduate studies from the Boise State University Biomolecular Sciences PhD program, and from the Post 9/11 GI Bill (Chapter 33).
Acknowledgments
Technical support for the KinExA 3200 instrument with Autosampler and data analysis was kindly provided by Sapidyne Instruments, Boise, ID, USA.
Conflicts of Interest
The funders had no role in the design of the study; in the collection, analyses, or interpretation of data; in the writing of the manuscript, or in the decision to publish the results.
Appendix A
Kinetics Exclusion Assay Principles
The principles of measurement and the anticipated evolution of the fluorescence signals during the various steps of the adapted protocol are briefly presented in Figure A1. The instrument automatically handles the packing of beads and the injection of all the required solutions into the microfluidic system, while monitoring the fluorescence signal of the label captured by the beads. In our case, the beads (Figure A1, panel A) are functionalized for capturing the free FA by following the procedures presented in Materials and Methods and Figure 1, and introduced into the flow cell. The reactants (FA and thrombin) are equilibrated in reaction tubes in which we kept constant the concentration of FA and varied the amount of thrombin (Figure A1, panel B). The concentration of free FA in pre-equilibrated solutions is in inverse proportion to the amount of thrombin added to the reaction tube. A fraction of the free FA is captured by the functionalized beads upon injection into the flow cell (Figure A1, panel C). For otherwise identical settings, the amount of captured FA is proportional to the amount of free FA; more thrombin in the equilibrated sample leads to less FA available for capture. FA injection after bead handling leads to an immediate increase in fluorescence signal owing to specific capture on the beads (Figure A1, panel D). The subsequent rinsing step washes away any non-captured FA, with the end signal representing only captured FA. This end signal is proportional to the amount of free FA that was injected in the previous step. It is assumed that the FA-thrombin complex (bound FA) will not bind to the cDNA, and the rate of dissociation of the pre-equilibrated complex is slow enough to be negligible during the brief residence time in the flow cell. Consequently, the end signal represents only binding of a fraction of FA free in equilibrated FA-thrombin solutions. An affinity value may be derived from further analysis of the relative changes in the end signal versus baseline (Figure A1, panel D) of a series of equilibrated solutions [55,59].

Figure A1.
Using aptamers as biorecognition elements for kinetic exclusion assay measurements. (A) A pack of beads functionalized with cDNA for FA capture is introduced in the flow cell. (B) Samples consisting of constant FA concentrations and variable thrombin amounts are equilibrated in test tubes. (C) Aliquots of equilibrated samples are flowed over the beads in the flow cell and a fraction of free FA is captured. This fraction is inversely proportional to the amount of thrombin added during the equilibration step. (D) The expected evolution of the fluorescence signal in response to different concentrations of free FA in solution. FA injection produces an increasing fluorescence signal owing to its capture and accumulation onto beads. The end signal recorded after the unbound FA is rinsed from the flow cell is proportional to the amount of free FA present in the equilibrated sample (not complexed with thrombin). For identical label (FA) concentrations in equilibrated solutions, the end signal decreases as the concentration of the target molecule (thrombin) increases, indicative of a reduced availability of the free, unbound label.
Signal Equations and Modeling
The instrument end signal as a function of concentration for a 1:1 binding model is described by Equation (A1) [55,59,75,76]:
where Sig100% represents the end signal recorded in the absence of thrombin in the mixture, NSB is the end signal corresponding to non-specific binding (or the signal when all of the aptamer is complexed with thrombin), and [FA]0 and [T]0 are the initial concentrations of FA and thrombin in the mixtures. This equation is fitted by the method of least squares to the experimental data obtained by using FA as CPB and thrombin as titrant. The n-curve analysis simultaneously fits Equation (A1) to multiple signal curves generated by using different CBP concentrations [54,67,70,76].
For the two-population aptamer mixture, the total concentration of FA, [FA]0, is assumed to be composed of two fractions [FA]1 = f × [FA]0, and [FA]2 = (1 − f) × [FA]0, where f is the fraction of the tightest binder in the population. We assumed that an FA molecule will provide the same signal irrespective of the population to which it belongs. For this fit, we used the 298 pM reported in the KinExA n-curve analysis as the tighter Kd, and varied both the fraction f of the tightest binder and the Kd of the second fraction. The competitive equilibrium concentrations of FA1 and FA2 were calculated using a model described elsewhere [75,77]. We scaled the resulting combined free fraction of FA using a maximum binding signal (Sig100%) and offset it using a non-specific binding variable (NSB), as has been reported previously [59,75].
For the mock sample concentration measurement, the standard binding curve was obtained by averaging and fitting with a four-parameter logistic equation [61,78]:
where B1 is the upper asymptotic plateau (maximum signal), B2 is the lower asymptotic plateau (NSB), B3 is the inflection point (the concentration at which the signal is halfway between the extreme values), B4 is the Hill coefficient (slope), and x is the titrant’s concentration.
The same equation, rearranged to solve for x, allows calculation of the unknown concentrations from the corresponding signals:
References
- Tuerk, C.; Gold, L. Systematic evolution of ligands by exponential enrichment: RNA ligands to bacteriophage T4 DNA polymerase. Science 1990, 249, 505–510. [Google Scholar] [CrossRef] [PubMed]
- Ellington, A.D.; Szostak, J.W. In vitro selection of RNA molecules that bind specific ligands. Nature 1990, 346, 818–822. [Google Scholar] [CrossRef] [PubMed]
- Ellington, A.D.; Szostak, J.W. Selection in vitro of single-stranded DNA molecules that fold into specific ligand-binding structures. Nature 1992, 355, 850–852. [Google Scholar] [CrossRef] [PubMed]
- Stoltenburg, R.; Reinemann, C.; Strehlitz, B. SELEX—A (r)evolutionary method to generate high-affinity nucleic acid ligands. Biomol. Eng. 2007, 24, 381–403. [Google Scholar] [CrossRef] [PubMed]
- Li, T.; Dong, S.; Wang, E. Label-free colorimetric detection of aqueous mercury ion (Hg2+) using Hg2+-modulated G-quadruplex-based DNAzymes. Anal. Chem. 2009, 81, 2144–2149. [Google Scholar] [CrossRef]
- Long, F.; Zhu, A.; Shi, H.; Wang, H.; Liu, J. Rapid on-site/in-situ detection of heavy metal ions in environmental water using a structure-switching DNA optical biosensor. Sci. Rep. 2013, 3, 1–7. [Google Scholar] [CrossRef]
- Chung, C.H.; Kim, J.H.; Jung, J.; Chung, B.H. Nuclease-resistant DNA aptamer on gold nanoparticles for the simultaneous detection of Pb2+ and Hg2+ in human serum. Biosens. Bioelectron. 2013, 41, 827–832. [Google Scholar] [CrossRef]
- Qu, H.; Csordas, A.T.; Wang, J.; Oh, S.S.; Eisenstein, M.S.; Soh, H.T. Rapid and label-free strategy to isolate aptamers for metal ions. ACS Nano 2016, 10, 7558–7565. [Google Scholar] [CrossRef]
- Pfeiffer, F.; Mayer, G. Selection and biosensor application of aptamers for small molecules. Front. Chem. 2016, 4, 1–21. [Google Scholar] [CrossRef]
- Stojanovic, M.N.; de Prada, P.; Landry, D.W. Aptamer-based folding fluorescent sensor for cocaine. J. Am. Chem. Soc. 2001, 123, 4928–4931. [Google Scholar] [CrossRef]
- Robati, R.Y.; Arab, A.; Ramezani, M.; Langroodi, F.A.; Abnous, K.; Taghdisi, S.M. Aptasensors for quantitative detection of kanamycin. Biosens. Bioelectron. 2016, 82, 162–172. [Google Scholar] [CrossRef] [PubMed]
- De-los-Santos-Álvarez, N.; Lobo-Castañón, M.J.; Miranda-Ordieres, A.J.; Tuñón-Blanco, P. Modified-RNA aptamer-based sensor for competitive impedimetric assay of neomycin B. J. Am. Chem. Soc. 2007, 129, 3808–3809. [Google Scholar] [CrossRef]
- Sun, D.; Lu, J.; Zhang, L.; Chen, Z. Aptamer-based electrochemical cytosensors for tumor cell detection in cancer diagnosis: A review. Anal. Chim. Acta 2019, 1082, 1–17. [Google Scholar] [CrossRef] [PubMed]
- Herr, J.K.; Smith, J.E.; Medley, C.D.; Shangguan, D.; Tan, W. Aptamer-conjugated nanoparticles for selective collection and detection of cancer cells. Anal. Chem. 2006, 78, 2918–2924. [Google Scholar] [CrossRef] [PubMed]
- Shangguan, D.; Li, Y.; Tang, Z.; Cao, Z.C.; Chen, H.W.; Mallikaratchy, P.; Sefah, K.; Yang, C.J.; Tan, W. Aptamers evolved from live cells as effective molecular probes for cancer study. Proc. Natl. Acad. Sci. USA 2006, 103, 11838–11843. [Google Scholar] [CrossRef]
- Zhu, G.; Chen, X. Aptamer-based targeted therapy. Adv. Drug Deliv. Rev. 2018, 134, 65–78. [Google Scholar] [CrossRef]
- Rozenblum, G.T.; Lopez, V.G.; Vitullo, A.D.; Radrizzani, M. Aptamers: Current challenges and future prospects. Expert Opin. Drug Discov. 2016, 11, 127–135. [Google Scholar] [CrossRef]
- Rusconi, C.P.; Roberts, J.D.; Pitoc, G.A.; Nimjee, S.M.; White, R.R.; Quick, G.; Scardino, E.; Fay, W.P.; Sullenger, B.A. Antidote-mediated control of an anticoagulant aptamer in vivo. Nat. Biotechnol. 2004, 22, 1423–1428. [Google Scholar] [CrossRef]
- Ponce, A.T.; Hong, K.L. A Mini-Review: Clinical development and potential of aptamers for thrombotic events treatment and monitoring. Biomedicines 2019, 7, 55. [Google Scholar] [CrossRef]
- Platella, C.; Riccardi, C.; Montesarchio, D.; Roviello, G.N.; Musumeci, D. G-quadruplex-based aptamers against protein targets in therapy and diagnostics. Biochim. Biophys. Acta Gen. Subj. 2017, 1861, 1429–1447. [Google Scholar] [CrossRef]
- Kaur, H.; Bruno, J.G.; Kumar, A.; Sharma, T.K. Aptamers in the therapeutics and diagnostics pipelines. Theranostics 2018, 8, 4016–4032. [Google Scholar] [CrossRef] [PubMed]
- Sharma, T.K.; Bruno, J.G.; Dhiman, A. ABCs of DNA aptamer and related assay development. Biotechnol. Adv. 2017, 35, 275–301. [Google Scholar] [CrossRef] [PubMed]
- Rotem, D.; Jayasinghe, L.; Salichou, M.; Bayley, H. Protein detection by nanopores equipped with aptamers. J. Am. Chem. Soc. 2012, 134, 2781–2787. [Google Scholar] [CrossRef] [PubMed]
- Ngundi, M.M.; Shriver-Lake, L.C.; Moore, M.H.; Lassman, M.E.; Ligler, F.S.; Taitt, C.R. Array biosensor for detection of ochratoxin A in cereals and beverages. Anal. Chem. 2005, 77, 148–154. [Google Scholar] [CrossRef]
- Zhang, Y.; Lai, B.; Juhas, M. Recent advances in aptamer discovery and applications. Molecules 2019, 24, 941. [Google Scholar] [CrossRef]
- Feng, C.; Dai, S.; Wang, L. Optical aptasensors for quantitative detection of small biomolecules: A review. Biosens. Bioelectron. 2014, 59, 64–74. [Google Scholar] [CrossRef]
- Zhou, J.; Rossi, J. Aptamers as targeted therapeutics: Current potential and challenges. Nat. Rev. Drug Discov. 2017, 16, 181–202. [Google Scholar] [CrossRef]
- Sameiyan, E.; Bagheri, E.; Ramezani, M.; Alibolandi, M.; Abnous, K.; Taghdisi, S.M. DNA origami-based aptasensors. Biosens. Bioelectron. 2019, 143, 111662. [Google Scholar] [CrossRef]
- Deng, B.; Lin, Y.; Wang, C.; Li, F.; Wang, Z.; Zhang, H.; Li, X.-F.; Le, X.C. Aptamer binding assays for proteins: The thrombin example—A review. Anal. Chim. Acta 2014, 837, 1–15. [Google Scholar] [CrossRef]
- Song, S.; Wang, L.; Li, J.; Fan, C.; Zhao, J. Aptamer-based biosensors. TrAC Trends Anal. Chem. 2008, 27, 108–117. [Google Scholar] [CrossRef]
- Jing, M.; Bowser, M.T. Methods for measuring aptamer-protein equilibria: A review. Anal. Chim. Acta 2011, 686, 9–18. [Google Scholar] [CrossRef] [PubMed]
- Chang, A.L.; McKeague, M.; Liang, J.C.; Smolke, C.D. Kinetic and Equilibrium Binding Characterization of Aptamers to Small Molecules using a Label-Free, Sensitive, and Scalable Platform. Anal. Chem. 2014, 86, 3273–3278. [Google Scholar] [CrossRef] [PubMed]
- Bock, L.C.; Griffin, L.C.; Latham, J.A.; Vermaas, E.H.; Toole, J.J. Selection of single-stranded DNA molecules that bind and inhibit human thrombin. Nature 1992, 355, 564–566. [Google Scholar] [CrossRef] [PubMed]
- Tasset, D.M.; Kubik, M.F.; Steiner, W. Oligonucleotide inhibitors of human thrombin that bind distinct epitopes. J. Mol. Biol. 1997, 272, 688–698. [Google Scholar] [CrossRef]
- Mears, K.S.; Markus, D.L.; Ogunjimi, O.; Whelan, R.J. Experimental and mathematical evidence that thrombin-binding aptamers form a 1 aptamer: 2 protein complex. Aptamers 2018, 2, 64–73. [Google Scholar]
- Lin, P.-H.; Chen, R.-H.; Lee, C.-H.; Chang, Y.; Chen, C.-S.; Chen, W.-Y. Studies of the binding mechanism between aptamers and thrombin by circular dichroism, surface plasmon resonance and isothermal titration calorimetry. Colloids Surf. B 2011, 88, 552–558. [Google Scholar] [CrossRef]
- Li, Y.; Guo, L.; Zhang, F.; Zhang, Z.; Tang, J.; Xie, J. High-sensitive determination of human α-thrombin by its 29-mer aptamer in affinity probe capillary electrophoresis. Electrophoresis 2008, 29, 2570–2577. [Google Scholar] [CrossRef]
- Song, M.; Zhang, Y.; Li, T.; Wang, Z.; Yin, J.; Wang, H. Highly sensitive detection of human thrombin in serum by affinity capillary electrophoresis/laser-induced fluorescence polarization using aptamers as probes. J. Chromatogr. A 2009, 1216, 873–878. [Google Scholar] [CrossRef]
- Li, H.-Y.; Deng, Q.-P.; Zhang, D.-W.; Zhou, Y.-L.; Zhang, X.-X. Chemiluminescently labeled aptamers as the affinity probe for interaction analysis by capillary electrophoresis. Electrophoresis 2010, 31, 2452–2460. [Google Scholar] [CrossRef]
- Olmsted, I.R.; Xiao, Y.; Cho, M.; Csordas, A.T.; Sheehan, J.H.; Meiler, J.; Soh, H.T.; Bornhop, D.J. Measurement of aptamer–protein interactions with back-scattering interferometry. Anal. Chem. 2011, 83, 8867–8870. [Google Scholar] [CrossRef]
- Daniel, C.; Roupioz, Y.; Gasparutto, D.; Livache, T.; Buhot, A. Solution-phase vs surface-phase aptamer-protein affinity from a label-free kinetic biosensor. PLoS ONE 2013, 8, e75419. [Google Scholar] [CrossRef] [PubMed]
- Davie, E.W.; Kulman, J.D. An overview of the structure and function of thrombin. Semin. Thromb. Hemost. 2006, 32 (Suppl. S1), 3–15. [Google Scholar] [CrossRef] [PubMed]
- Champagne, K.; Shishido, A.; Root, M.J. Interactions of HIV-1 inhibitory peptide T20 with the gp41 N-HR coiled coil. J. Biol. Chem. 2009, 284, 3619–3627. [Google Scholar] [CrossRef] [PubMed]
- Du, D.; Kato, T.; Suzuki, F.; Park, E.Y. Binding affinity of full-length and extracellular domains of recombinant human (pro)renin receptor to human renin when expressed in the fat body and hemolymph of silkworm larvae. J. Biosci. Bioeng. 2009, 108, 304–309. [Google Scholar] [CrossRef] [PubMed]
- Prieto-Simón, B.; Miyachi, H.; Karube, I.; Saiki, H. High-sensitive flow-based kinetic exclusion assay for okadaic acid assessment in shellfish samples. Biosens. Bioelectron. 2010, 25, 1395–1401. [Google Scholar] [CrossRef] [PubMed]
- Darwish, I.A.; Wani, T.A.; Alanazi, A.M.; Hamidaddin, M.A.; Zargar, S. Kinetic-exclusion analysis-based immunosensors versus enzyme-linked immunosorbent assays for measurement of cancer markers in biological specimens. Talanta 2013, 111, 13–19. [Google Scholar] [CrossRef]
- Köck, K.; Pan, W.J.; Gow, J.M.; Horner, M.J.; Gibbs, J.P.; Colbert, A.; Goletz, T.J.; Newhall, K.J.; Rees, W.A.; Sun, Y.; et al. Preclinical development of AMG 139, a human antibody specifically targeting IL-23. Br. J. Pharmacol. 2015, 172, 159–172. [Google Scholar] [CrossRef]
- Abdiche, Y.N.; Harriman, R.; Deng, X.; Yeung, Y.A.; Miles, A.; Morishige, W.; Boustany, L.; Zhu, L.; Izquierdo, S.M.; Harriman, W. Assessing kinetic and epitopic diversity across orthogonal monoclonal antibody generation platforms. mAbs 2016, 8, 264–277. [Google Scholar] [CrossRef]
- Kusano-Arai, O.; Fukuda, R.; Kamiya, W.; Iwanari, H.; Hamakubo, T. Kinetic exclusion assay of monoclonal antibody affinity to the membrane protein roundabout 1 displayed on baculovirus. Anal. Biochem. 2016, 504, 41–49. [Google Scholar] [CrossRef]
- Li, X.; Kaattari, S.L.; Vogelbein, M.A.; Vadas, G.G.; Unger, M.A. A highly sensitive monoclonal antibody based biosensor for quantifying 3–5 ring polycyclic aromatic hydrocarbons (PAHs) in aqueous environmental samples. Sens. Bio-Sens. Res. 2016, 7, 115–120. [Google Scholar] [CrossRef]
- Wani, T.A.; Zargar, S.; Majid, S.; Darwish, I.A. Analytical application of flow immunosensor in detection of thyroxine and triiodothyronine in serum. ASSAY Drug Dev. Technol. 2016, 14, 535–542. [Google Scholar] [CrossRef] [PubMed]
- Danial, M.; Stauffer, A.N.; Wurm, F.R.; Root, M.J.; Klok, H.-A. Site-specific polymer attachment to HR2 peptide fusion inhibitors against HIV-1 decreases binding association rates and dissociation rates rather than binding affinity. Bioconjug. Chem. 2017, 28, 701–712. [Google Scholar] [CrossRef] [PubMed]
- Fleming, J.K.; Wojciak, J.M. Measuring sphingosine-1-phosphate/protein interactions with the kinetic exclusion assay. In Sphingosine-1-Phosphate: Methods and Protocols; Pébay, A., Turksen, K., Eds.; Methods in Molecular Biology; Springer: New York, NY, USA, 2018; pp. 1–8. ISBN 978-1-4939-7413-9. [Google Scholar]
- Kamat, V.; Rafique, A.; Huang, T.; Olsen, O.; Olson, W. The impact of different human IgG capture molecules on the kinetics analysis of antibody-antigen interaction. Anal. Biochem. 2020, 593, 113580. [Google Scholar] [CrossRef] [PubMed]
- Darling, R.J.; Brault, P.-A. Kinetic exclusion assay technology: Characterization of molecular interactions. ASSAY Drug Dev. Technol. 2004, 2, 647–657. [Google Scholar] [CrossRef]
- Hamidaddin, M.A.; AlRabiah, H.; Darwish, I.A. Development and comparative evaluation of two immunoassay platforms for bioanalysis of crizotinib: A potent drug used for the treatment of non-small cell lung cancer. Talanta 2019, 201, 217–225. [Google Scholar] [CrossRef]
- Darwish, I.A.; AlRabiah, H.; Hamidaddin, M.A. Development of two different formats of heterogeneous fluorescence immunoassay for bioanalysis of afatinib by employing fluorescence plate reader and KinExA 3200 immunosensor. Sci. Rep. 2019, 9, 14742. [Google Scholar] [CrossRef]
- AlRabiah, H.; Hamidaddin, M.A.; Darwish, I.A. Automated flow fluorescent noncompetitive immunoassay for measurement of human plasma levels of monoclonal antibodies used for immunotherapy of cancers with KinExATM 3200 biosensor. Talanta 2019, 192, 331–338. [Google Scholar] [CrossRef]
- Ohmura, N.; Lackie, S.J.; Saiki, H. An immunoassay for small analytes with theoretical detection limits. Anal. Chem. 2001, 73, 3392–3399. [Google Scholar] [CrossRef]
- Glass, T.R.; Saiki, H.; Blake, D.A.; Blake, R.C.; Lackie, S.J.; Ohmura, N. Use of excess solid-phase capacity in immunoassays: Advantages for semicontinuous, near-real-time measurements and for analysis of matrix effects. Anal. Chem. 2004, 76, 767–772. [Google Scholar] [CrossRef]
- Glass, T.R.; Ohmura, N.; Saiki, H. Least detectable concentration and dynamic range of three immunoassay systems using the same antibody. Anal. Chem. 2007, 79, 1954–1960. [Google Scholar] [CrossRef]
- Glass, T.R.; Winzor, D.J. Confirmation of the validity of the current characterization of immunochemical reactions by kinetic exclusion assay. Anal. Biochem. 2014, 456, 38–42. [Google Scholar] [CrossRef] [PubMed]
- Blake, R.C.; Li, X.; Yu, H.; Blake, D.A. Covalent and noncovalent modifications induce allosteric binding behavior in a monoclonal antibody. Biochemistry 2007, 46, 1573–1586. [Google Scholar] [CrossRef] [PubMed]
- Tigue, N.J.; Bamber, L.; Andrews, J.; Ireland, S.; Hair, J.; Carter, E.; Sridharan, S.; Jovanović, J.; Rees, D.G.; Springall, J.S.; et al. MEDI1873, a potent, stabilized hexameric agonist of human GITR with regulatory T-cell targeting potential. OncoImmunology 2017, 6, e1280645. [Google Scholar] [CrossRef] [PubMed]
- KinExA Pro Software. Available online: https://www.sapidyne.com/kinexapro.html (accessed on 25 February 2020).
- Tabrizi, M.A.; Bornstein, G.G.; Klakamp, S.L.; Drake, A.; Knight, R.; Roskos, L. Translational strategies for development of monoclonal antibodies from discovery to the clinic. Drug Discov. Today 2009, 14, 298–305. [Google Scholar] [CrossRef]
- Varkey, R.; Du, Q.; Karnell, J.L.; Xiao, X.; Casey, K.A.; Woods, R.; Rosenthal, K.; Wilson, S.; Dall’Acqua, W.F.; Wu, H.; et al. Discovery and characterization of potent IL-21 neutralizing antibodies via a novel alternating antigen immunization and humanization strategy. PLoS ONE 2019, 14, e0211236. [Google Scholar] [CrossRef] [PubMed]
- Lou, J.; Wen, W.; Conrad, F.; Meng, Q.; Dong, J.; Sun, Z.; Garcia-Rodriguez, C.; Farr-Jones, S.; Cheng, W.L.; Henderson, D.T.; et al. A single tri-epitopic antibody virtually recapitulates the potency of a combination of three monoclonal antibodies in neutralization of botulinum neurotoxin serotype A. Toxins 2018, 10, 84. [Google Scholar] [CrossRef] [PubMed]
- Szabó, E.; Phillips, D.J.; Droste, M.; Marti, A.; Kretzschmar, T.; Shamshiev, A.; Weller, M. Anti-tumor activity of DLX1008, an anti-VEGFA antibody fragment with low picomolar affinity, in human glioma models. J. Pharmacol. Exp. Ther. 2018, 365, 422–429. [Google Scholar] [CrossRef]
- Liddament, M.; Husten, J.; Estephan, T.; Laine, D.; Mabon, D.; Pukac, L.; Lyons, J.; Clarke, A.W.; Doyle, A. Higher Binding Affinity and in vitro Potency of Reslizumab for Interleukin-5 Compared with Mepolizumab. Allergy Asthma Immunol. Res. 2019, 11, 291. [Google Scholar] [CrossRef]
- Huang, Y.; Zhang, L.; Zhang, H.; Li, Y.; Liu, L.; Chen, Y.; Qiu, X.; Yu, D. Development of a Portable SPR Sensor for Nucleic Acid Detection. Micromachines 2020, 11, 526. [Google Scholar] [CrossRef]
- Delport, F.; Pollet, J.; Janssen, K.; Verbruggen, B.; Knez, K.; Spasic, D.; Lammertyn, J. Real-time monitoring of DNA hybridization and melting processes using a fiber optic sensor. Nanotechnology 2012, 23, 065503. [Google Scholar] [CrossRef]
- Zagorodko, O.; Spadavecchia, J.; Serrano, A.Y.; Larroulet, I.; Pesquera, A.; Zurutuza, A.; Boukherroub, R.; Szunerits, S. Highly Sensitive Detection of DNA Hybridization on Commercialized Graphene-Coated Surface Plasmon Resonance Interfaces. Anal. Chem. 2014, 86, 11211–11216. [Google Scholar] [CrossRef] [PubMed]
- Xu, S.; Zhan, J.; Man, B.; Jiang, S.; Yue, W.; Gao, S.; Guo, C.; Liu, H.; Li, Z.; Wang, J.; et al. Real-time reliable determination of binding kinetics of DNA hybridization using a multi-channel graphene biosensor. Nat. Commun. 2017, 8, 14902. [Google Scholar] [CrossRef] [PubMed]
- Ohmura, N.; Tsukidate, Y.; Shinozaki, H.; Lackie, S.J.; Saiki, H. Combinational use of antibody affinities in an immunoassay for extension of dynamic range and detection of multiple analytes. Anal. Chem. 2003, 75, 104–110. [Google Scholar] [CrossRef] [PubMed]
- Xie, L.; Jones, R.M.; Glass, T.R.; Navoa, R.; Wang, Y.; Grace, M.J. Measurement of the functional affinity constant of a monoclonal antibody for cell surface receptors using kinetic exclusion fluorescence immunoassay. J. Immunol. Methods 2005, 304, 1–14. [Google Scholar] [CrossRef]
- Glass, T.R.; Ohmura, N.; Morita, K.; Sasaki, K.; Saiki, H.; Takagi, Y.; Kataoka, C.; Ando, A. Improving an immunoassay response to related polychlorinated biphenyl analytes by mixing antibodies. Anal. Chem. 2006, 78, 7240–7247. [Google Scholar] [CrossRef]
- Gubler, H.; Schopfer, U.; Jacoby, E. Theoretical and experimental relationships between percent inhibition and IC50 data observed in high-throughput screening. J. Biomol. Screen. 2013, 18, 1–13. [Google Scholar] [CrossRef]
- Drake, A.W.; Tang, M.L.; Papalia, G.A.; Landes, G.; Haak-Frendscho, M.; Klakamp, S.L. Biacore surface matrix effects on the binding kinetics and affinity of an antigen/antibody complex. Anal. Biochem. 2012, 429, 58–69. [Google Scholar] [CrossRef]
- Schuck, P.; Zhao, H. The role of mass transport limitation and surface heterogeneity in the biophysical characterization of macromolecular binding processes by SPR biosensing. Methods Mol. Biol. 2010, 627, 15–54. [Google Scholar] [CrossRef]
- Bromage, E.S.; Vadas, G.G.; Harvey, E.; Unger, M.A.; Kaattari, S.L. Validation of an antibody-based biosensor for rapid quantification of 2,4,6-trinitrotoluene (TNT) contamination in ground water and river water. Environ. Sci. Technol. 2007, 41, 7067–7072. [Google Scholar] [CrossRef]
- Blake, D.A.; Jones, R.M.; Blake, R.C., II; Pavlov, A.R.; Darwish, I.A.; Yu, H. Antibody-based sensors for heavy metal ions. Biosens. Bioelectron. 2001, 16, 799–809. [Google Scholar] [CrossRef]
- Sasaki, K.; Oguma, S.; Namiki, Y.; Ohmura, N. Monoclonal antibody to trivalent chromium chelate complex and its application to measurement of the total chromium concentration. Anal. Chem. 2009, 81, 4005–4009. [Google Scholar] [CrossRef] [PubMed]
- Sasaki, K.; Glass, T.R.; Ohmura, N. Validation of accuracy of enzyme-linked immunosorbent assay in hybridoma screening and proposal of an improved screening method. Anal. Chem. 2005, 77, 1933–1939. [Google Scholar] [CrossRef] [PubMed]
- Bedinger, D.H.; Goldfine, I.D.; Corbin, J.A.; Roell, M.K.; Adams, S.H. Differential pathway coupling of the activated insulin receptor drives signaling selectivity by XMetA, an allosteric partial agonist antibody. J. Pharmacol. Exp. Ther. 2015. [Google Scholar] [CrossRef]
- Kariolis, M.S.; Miao, Y.R.; Diep, A.; Nash, S.E.; Olcina, M.M.; Jiang, D.; Jones, D.S., II; Kapur, S.; Mathews, I.I.; Koong, A.C.; et al. Inhibition of the GAS6/AXL pathway augments the efficacy of chemotherapies. J. Clin. Investig. 2017, 127, 183–198. [Google Scholar] [CrossRef] [PubMed]
- Rathanaswami, P.; Babcook, J.; Gallo, M. High-affinity binding measurements of antibodies to cell-surface-expressed antigens. Anal. Biochem. 2008, 373, 52–60. [Google Scholar] [CrossRef]
© 2020 by the authors. Licensee MDPI, Basel, Switzerland. This article is an open access article distributed under the terms and conditions of the Creative Commons Attribution (CC BY) license (http://creativecommons.org/licenses/by/4.0/).