Integrating 3D Model Representation for an Accurate Non-Invasive Assessment of Pressure Injuries with Deep Learning


Abstract
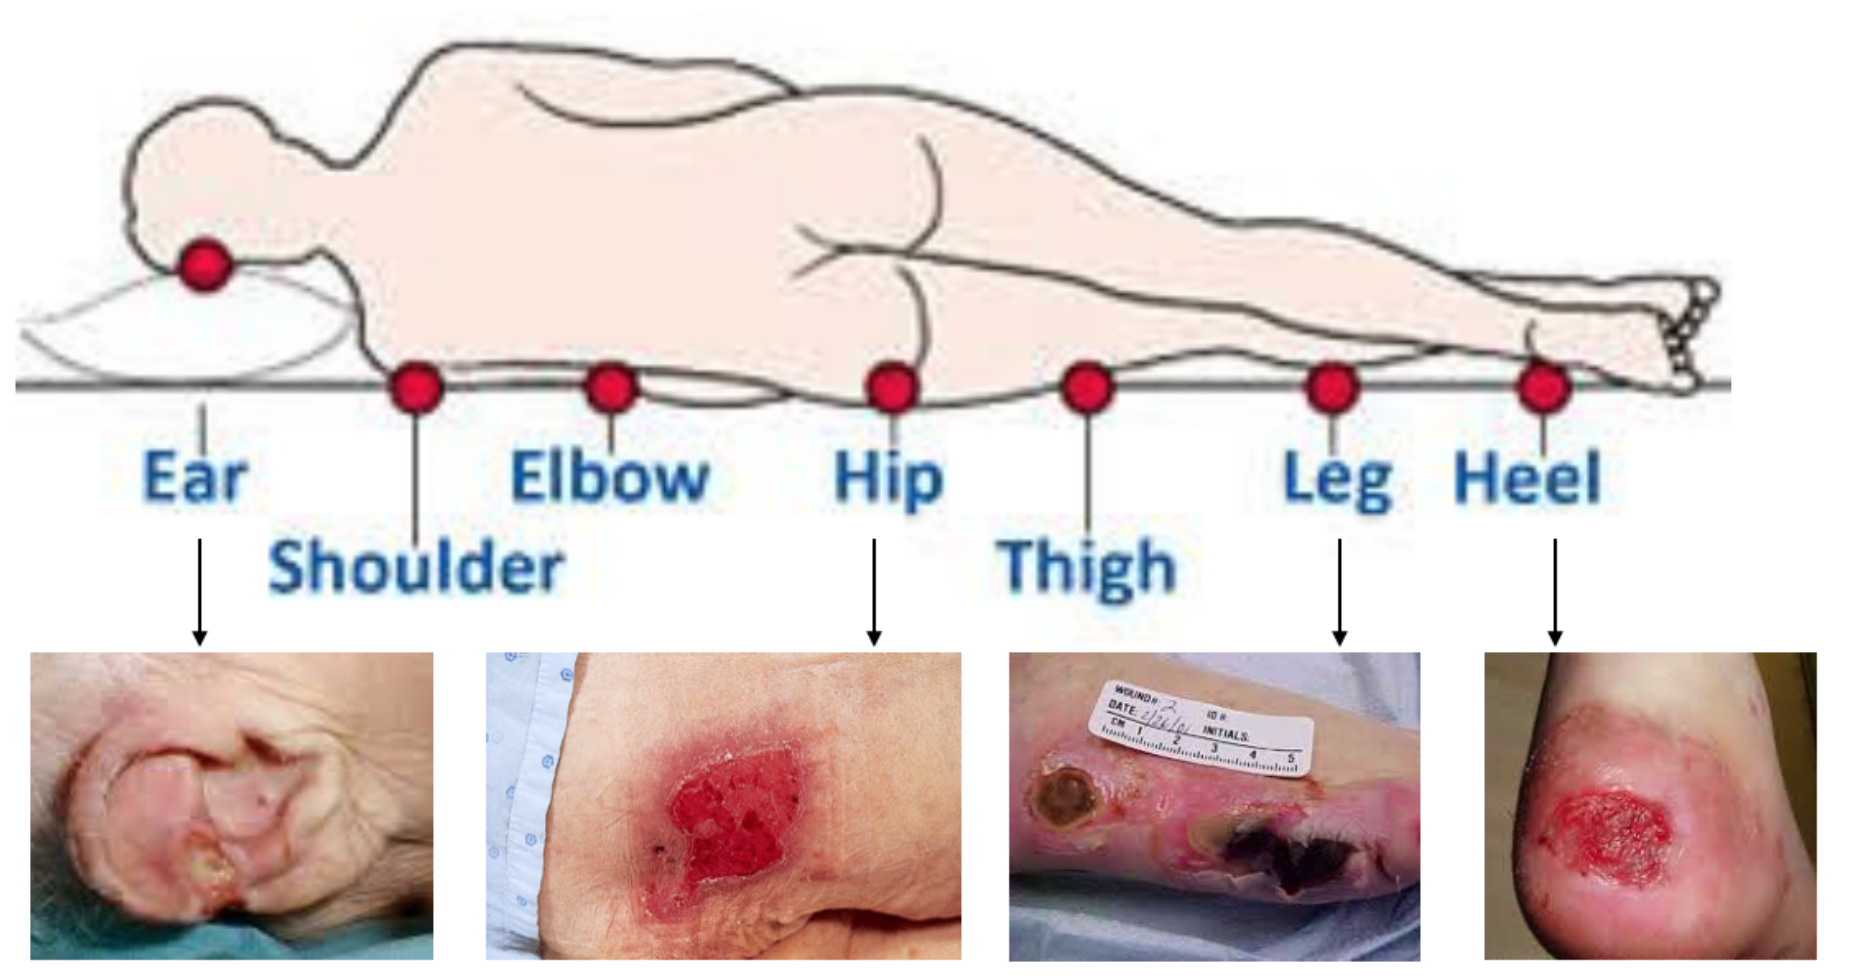
1. Introduction
2. Related Work
3. Materials and Methods
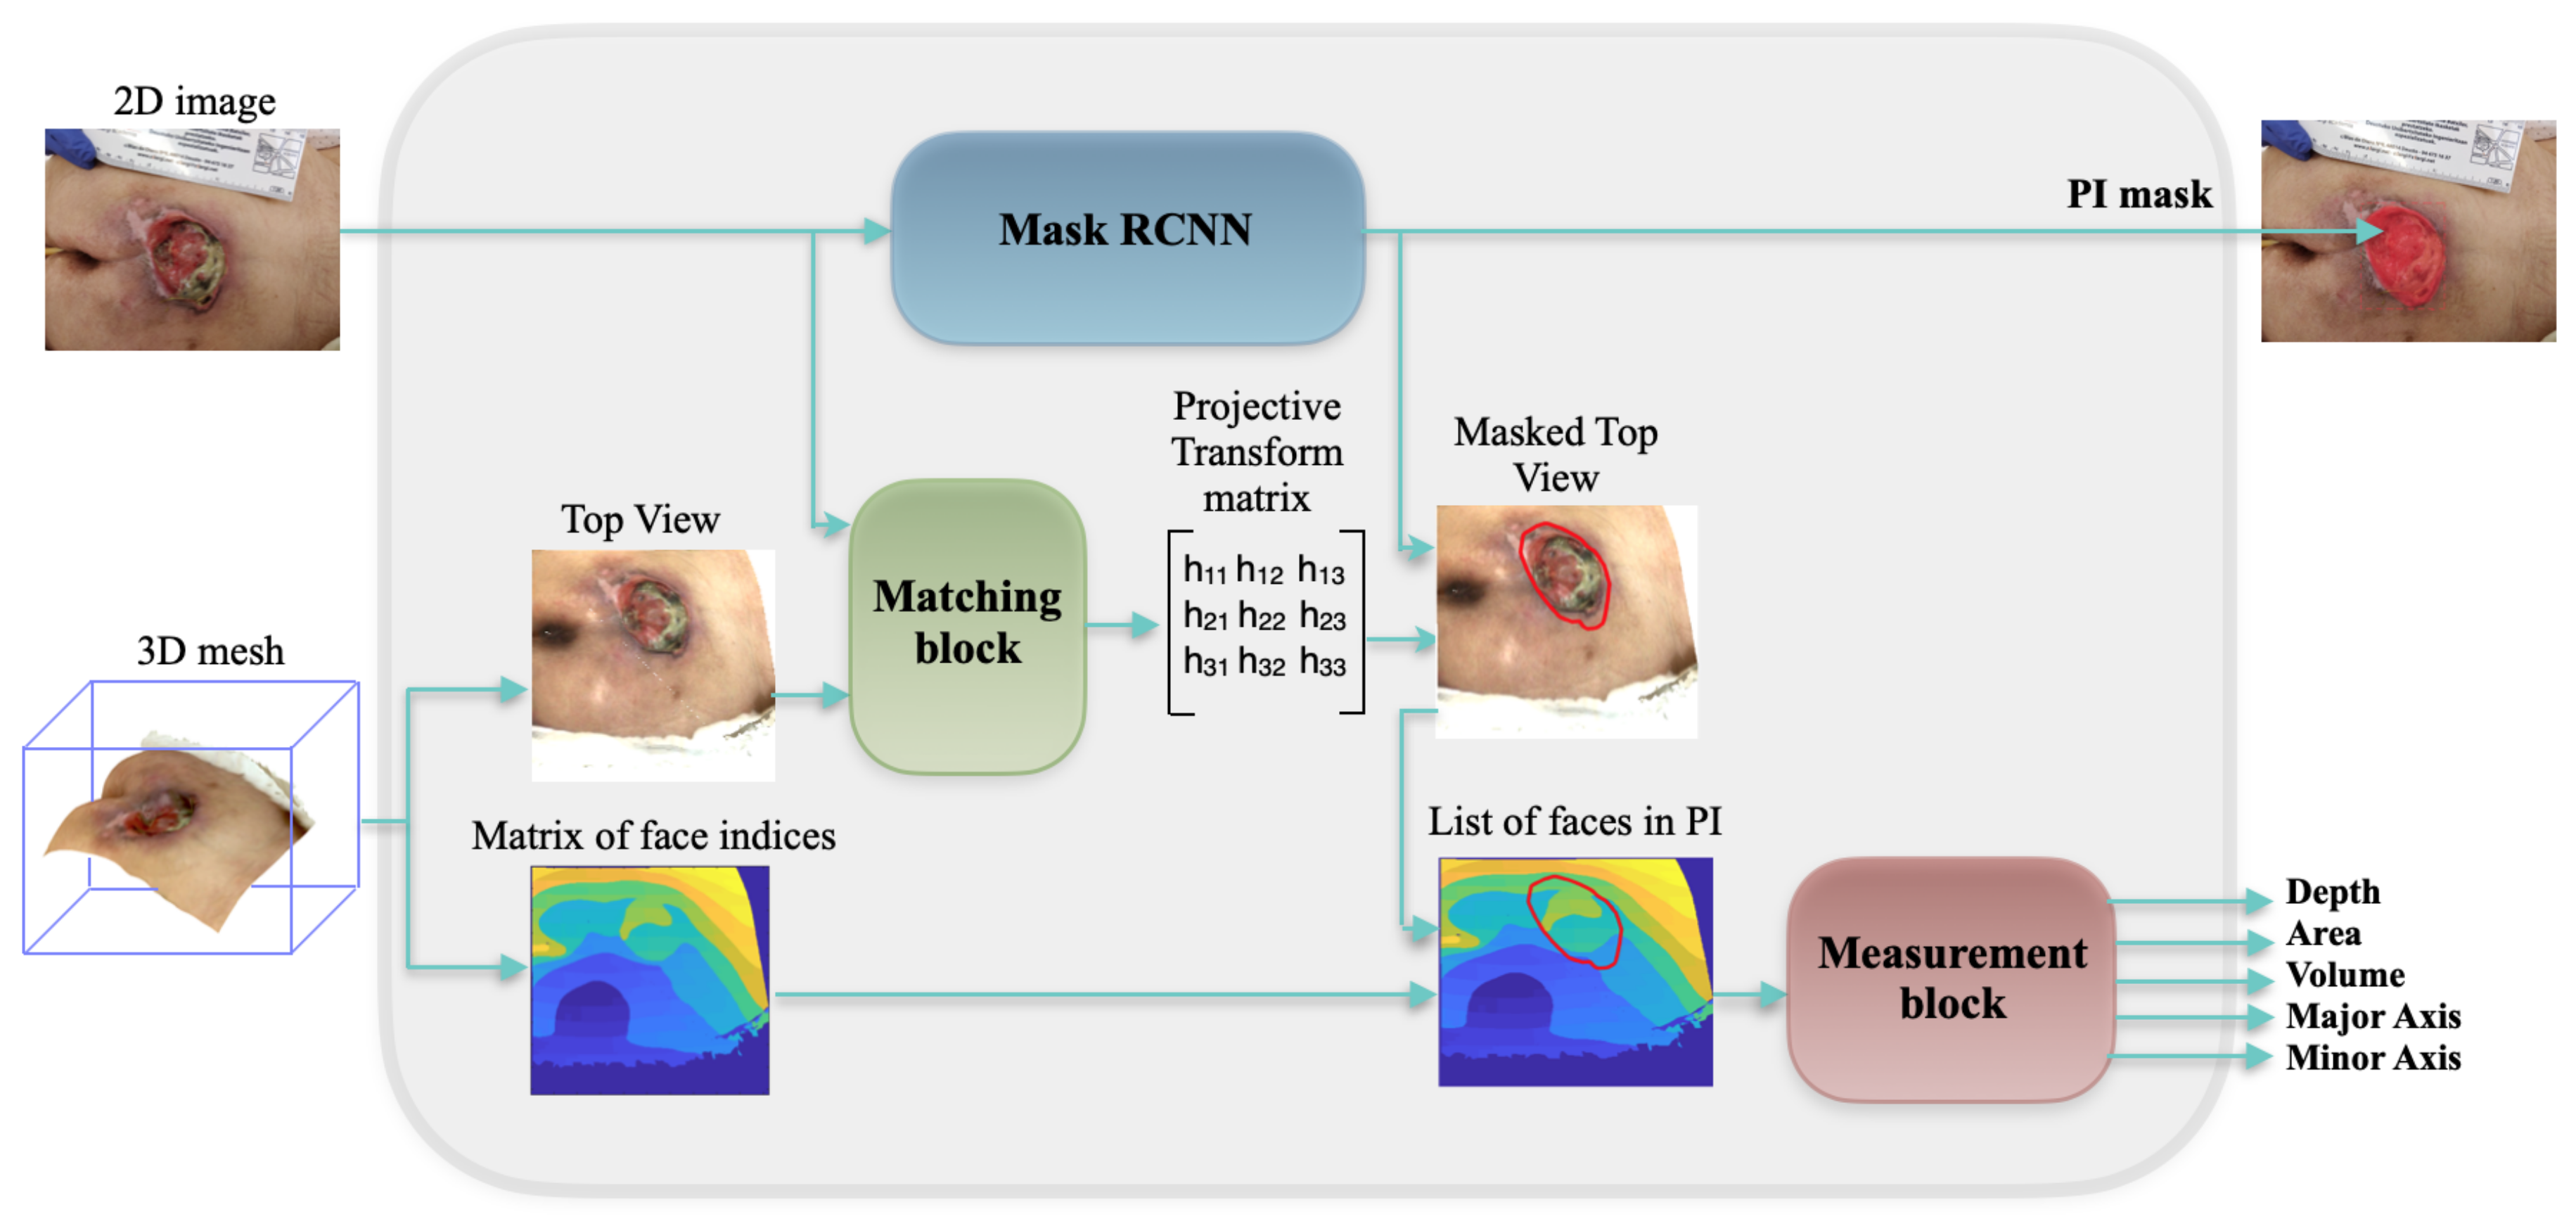
3.1. Global Framework
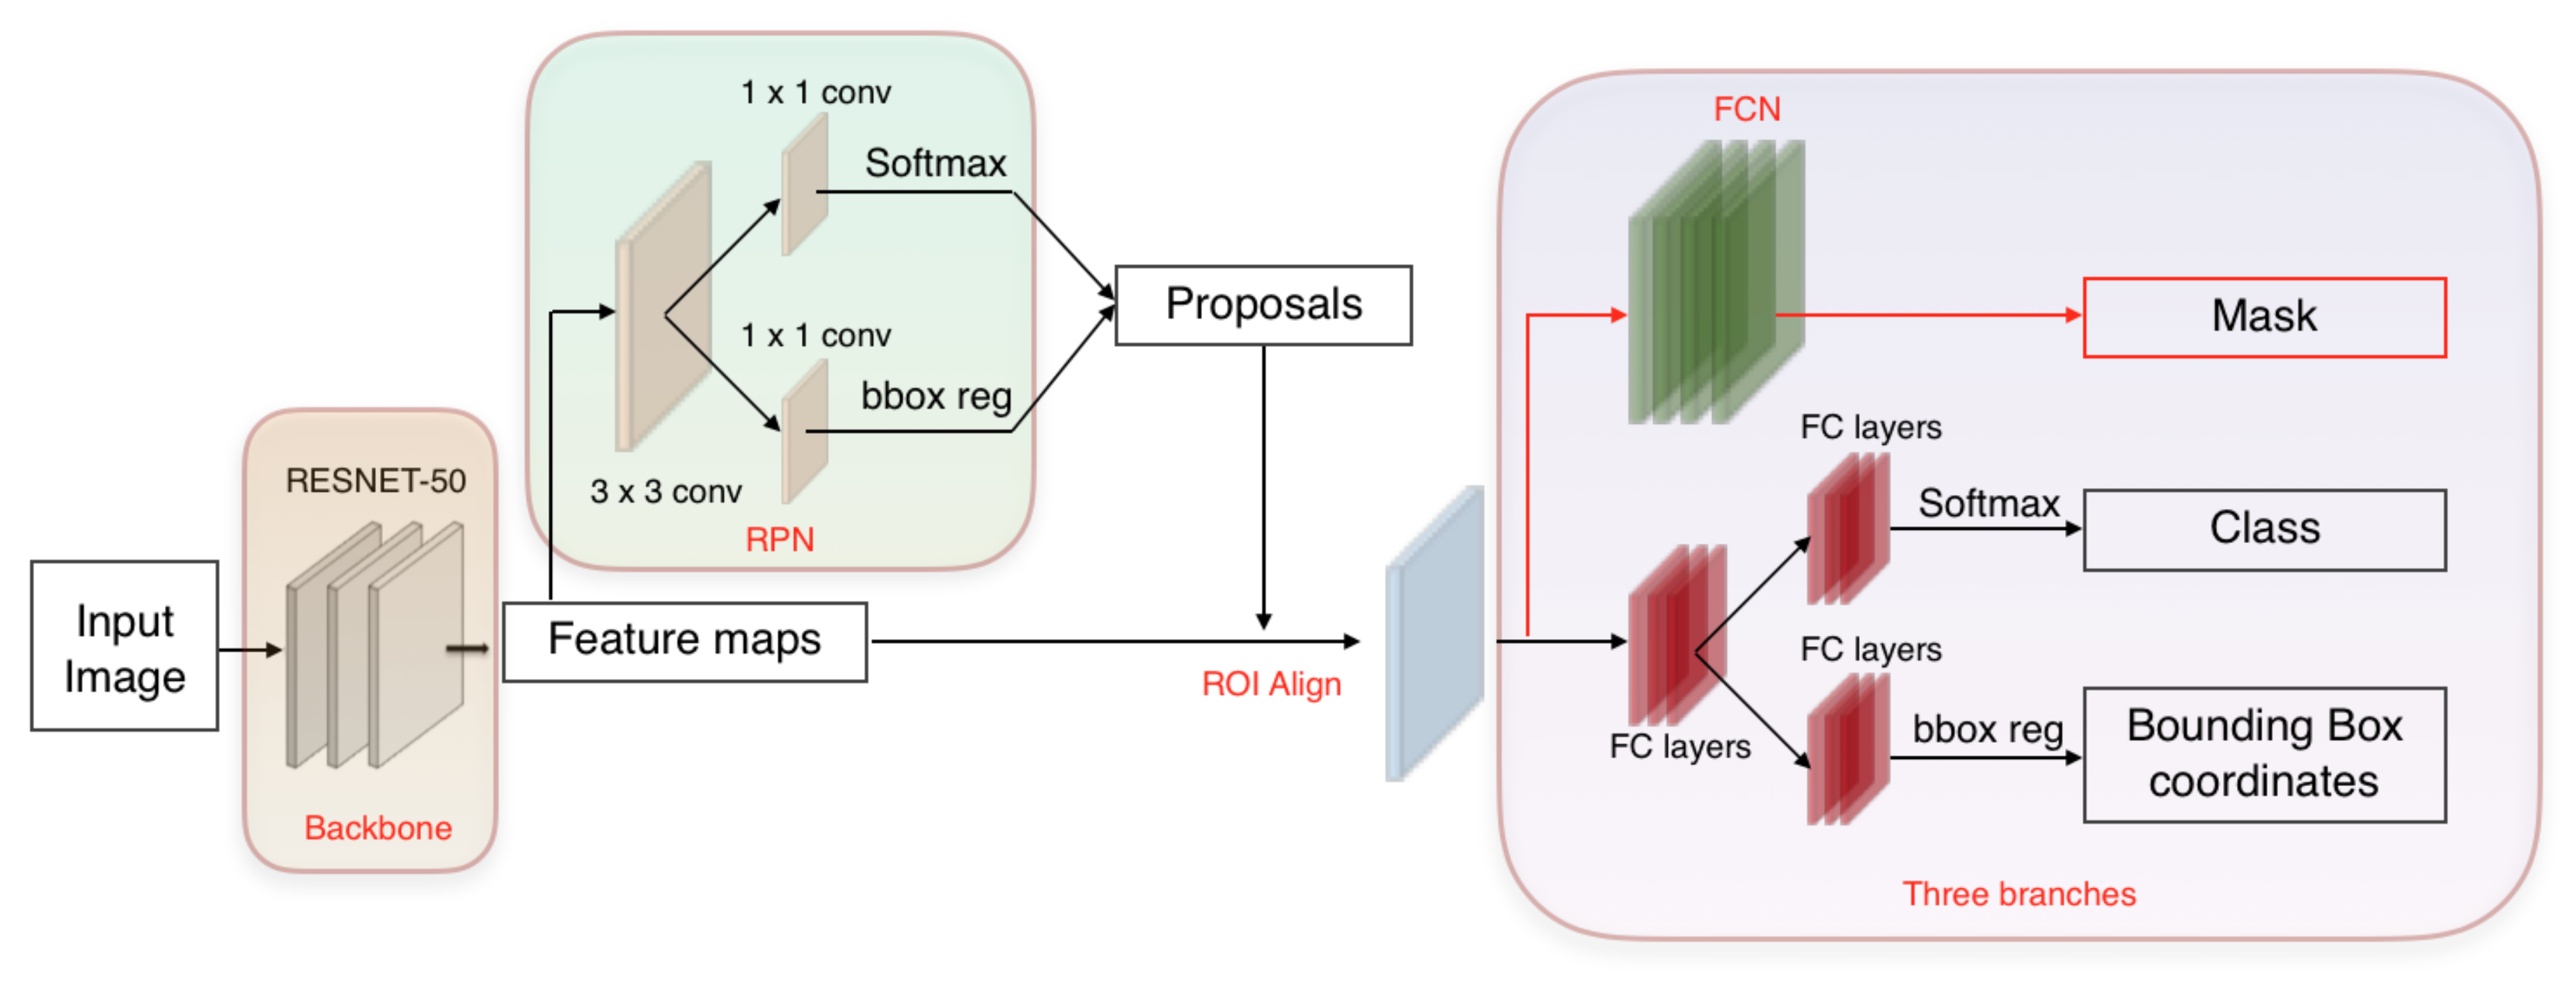
3.2. Mask RCNN
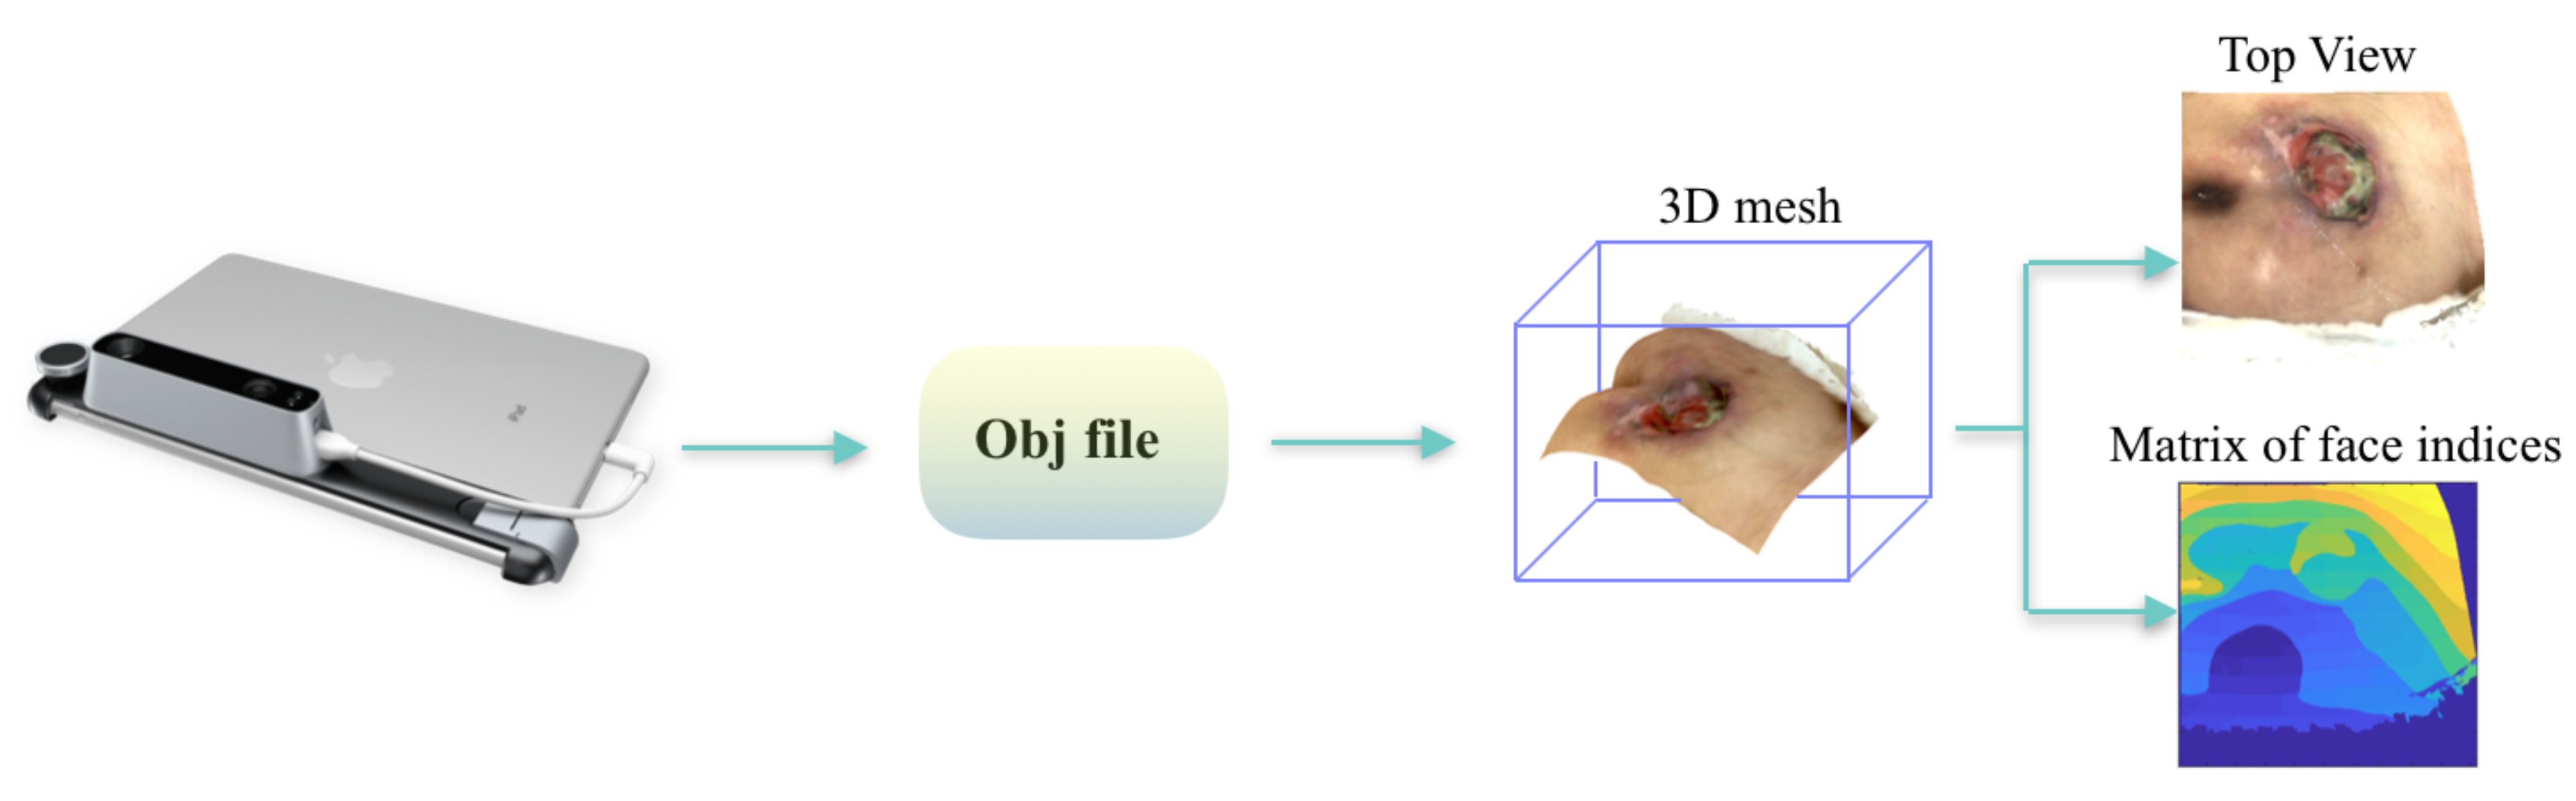
3.3. Mesh Rasterization
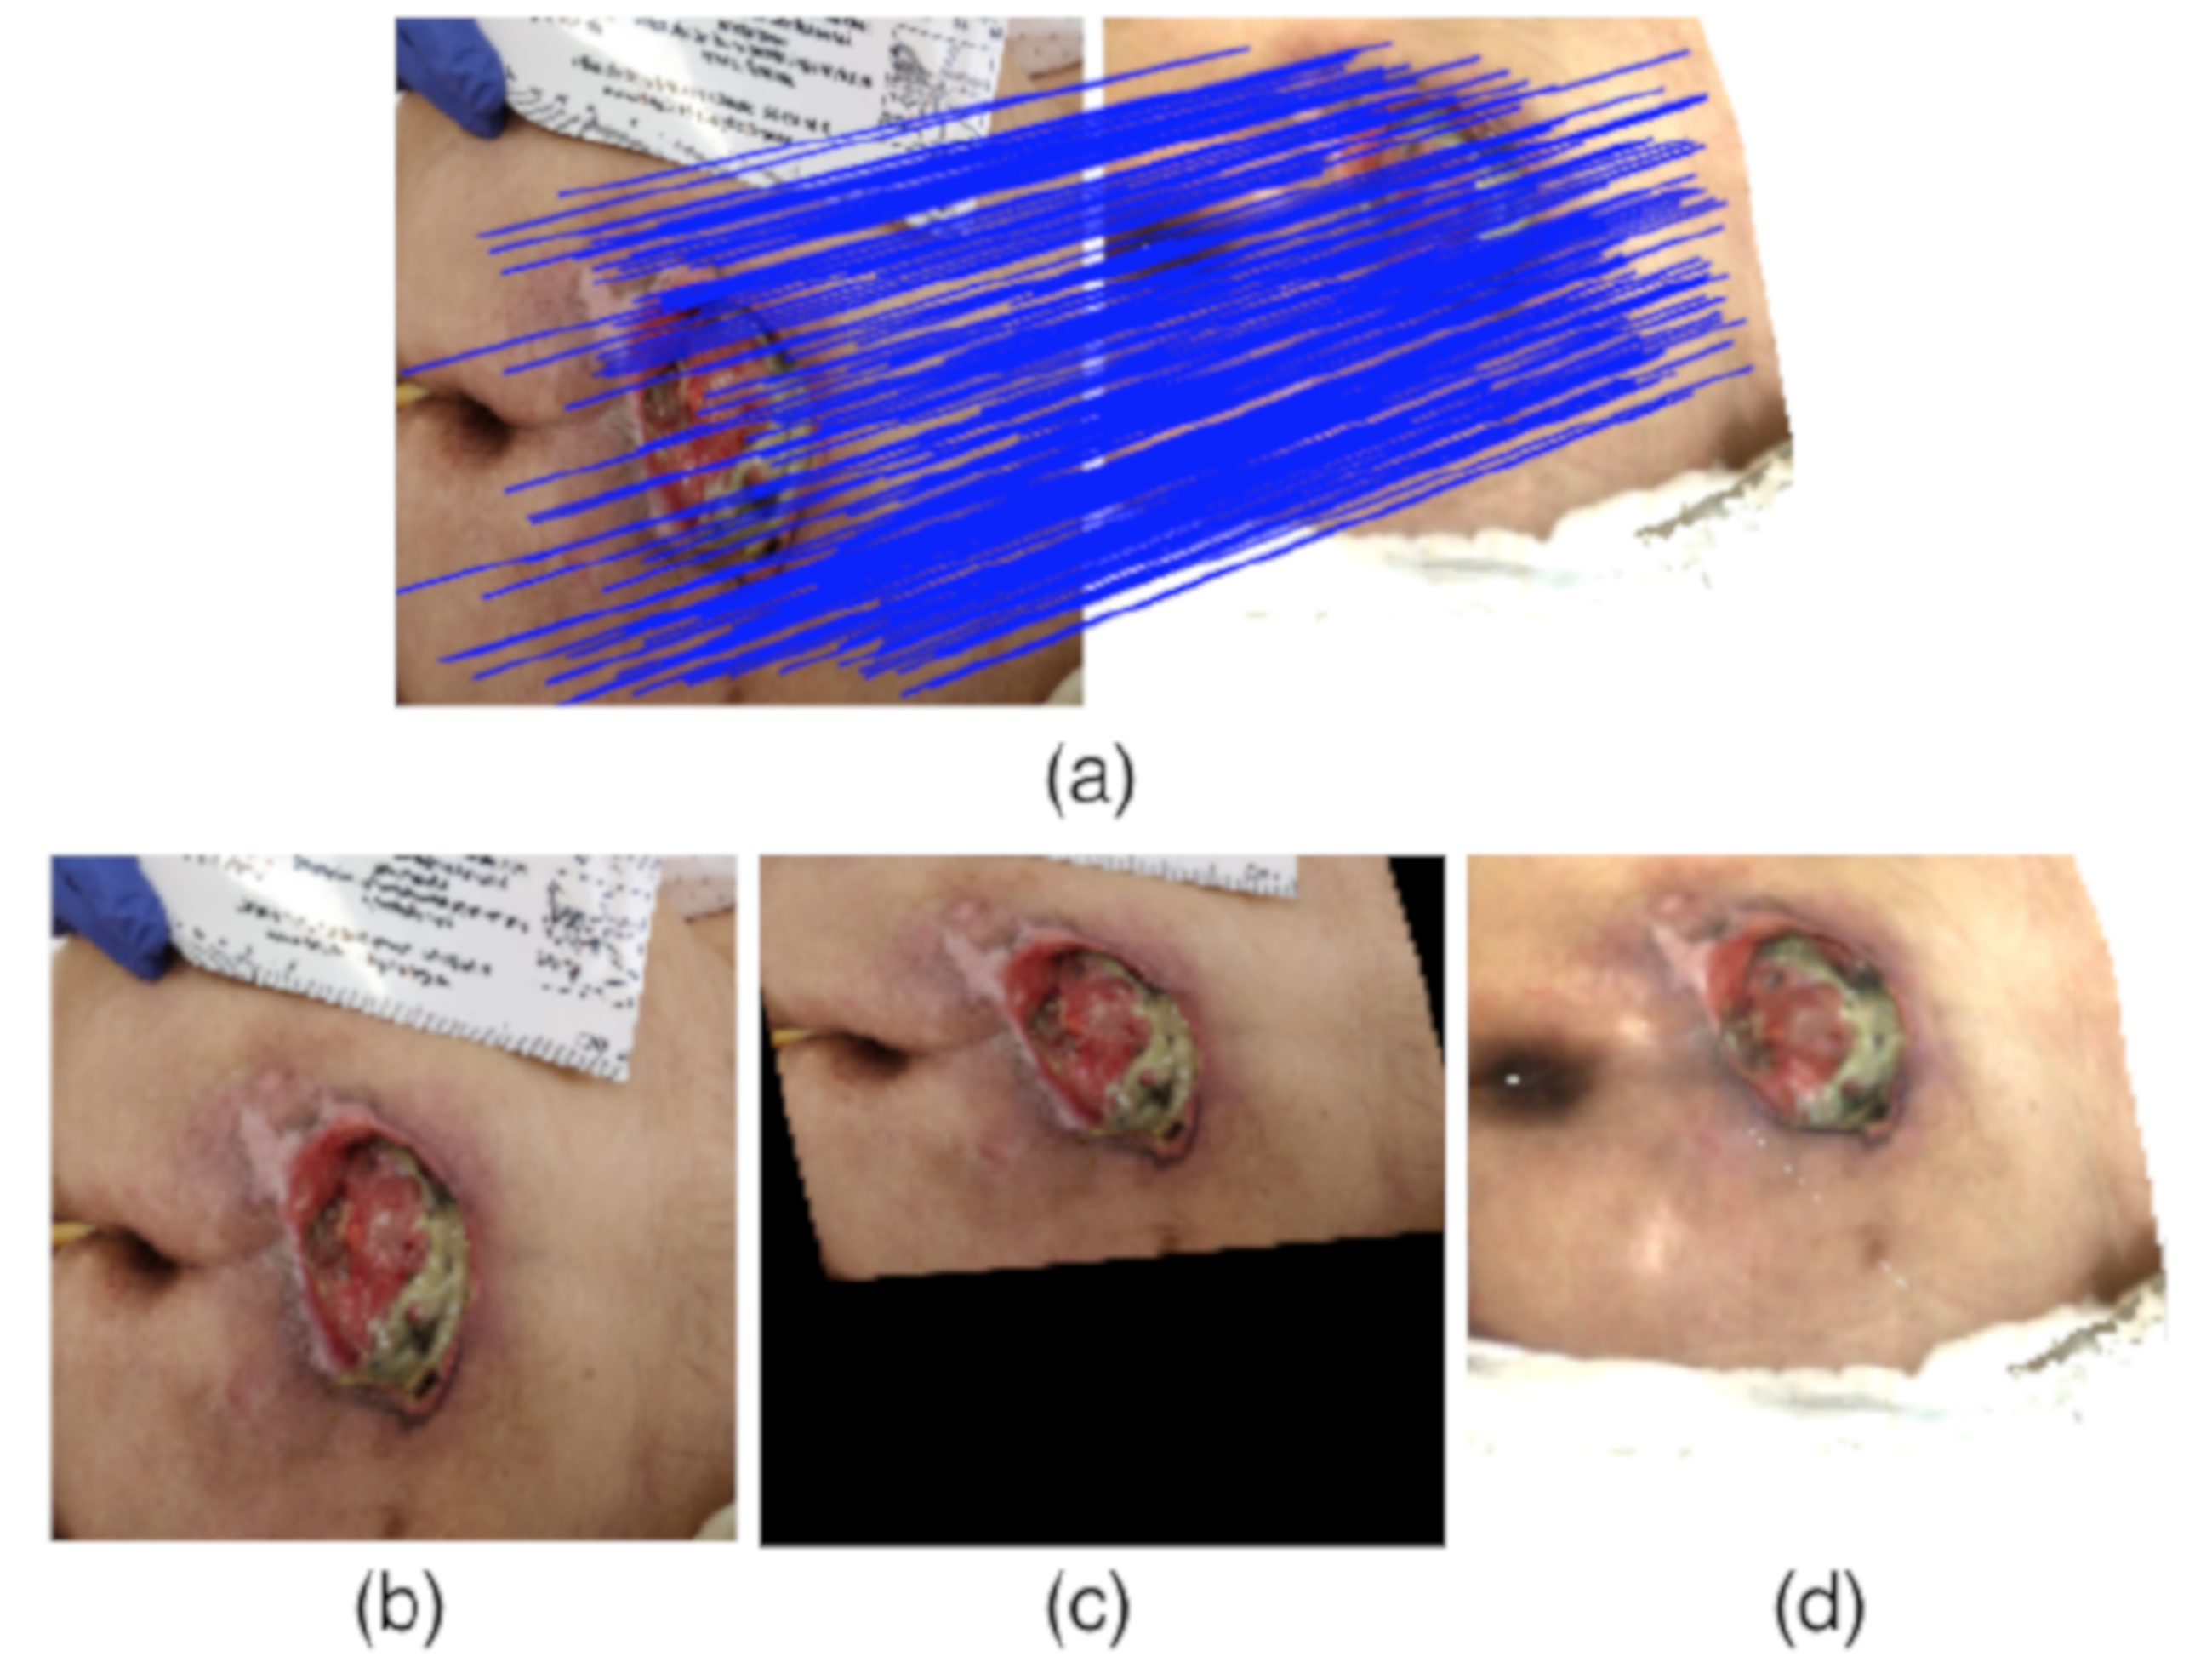
3.4. Matching Block
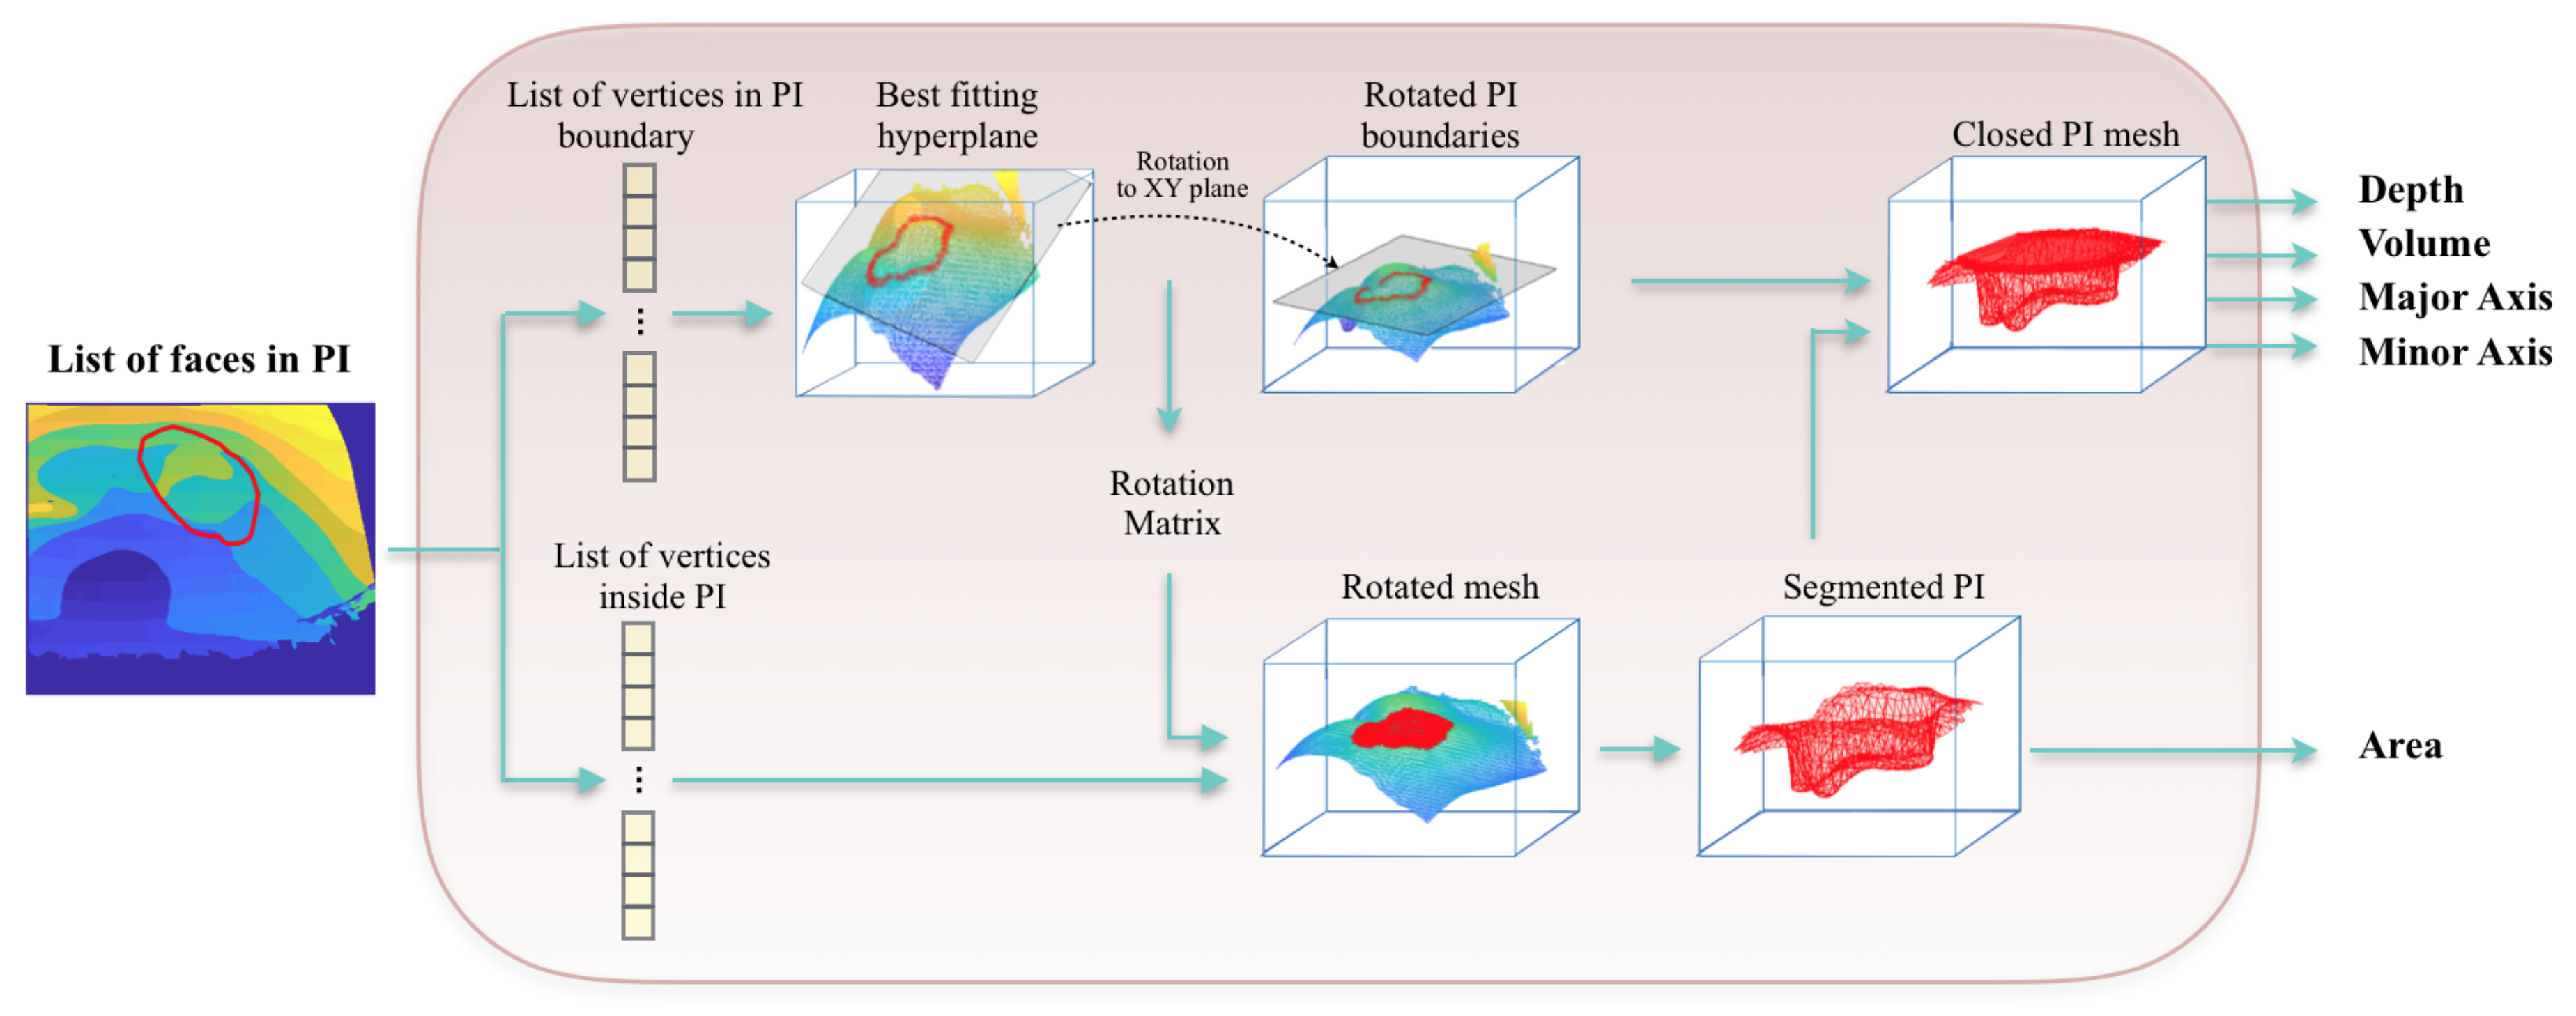
3.5. Measurement Block
4. Experiments and Results
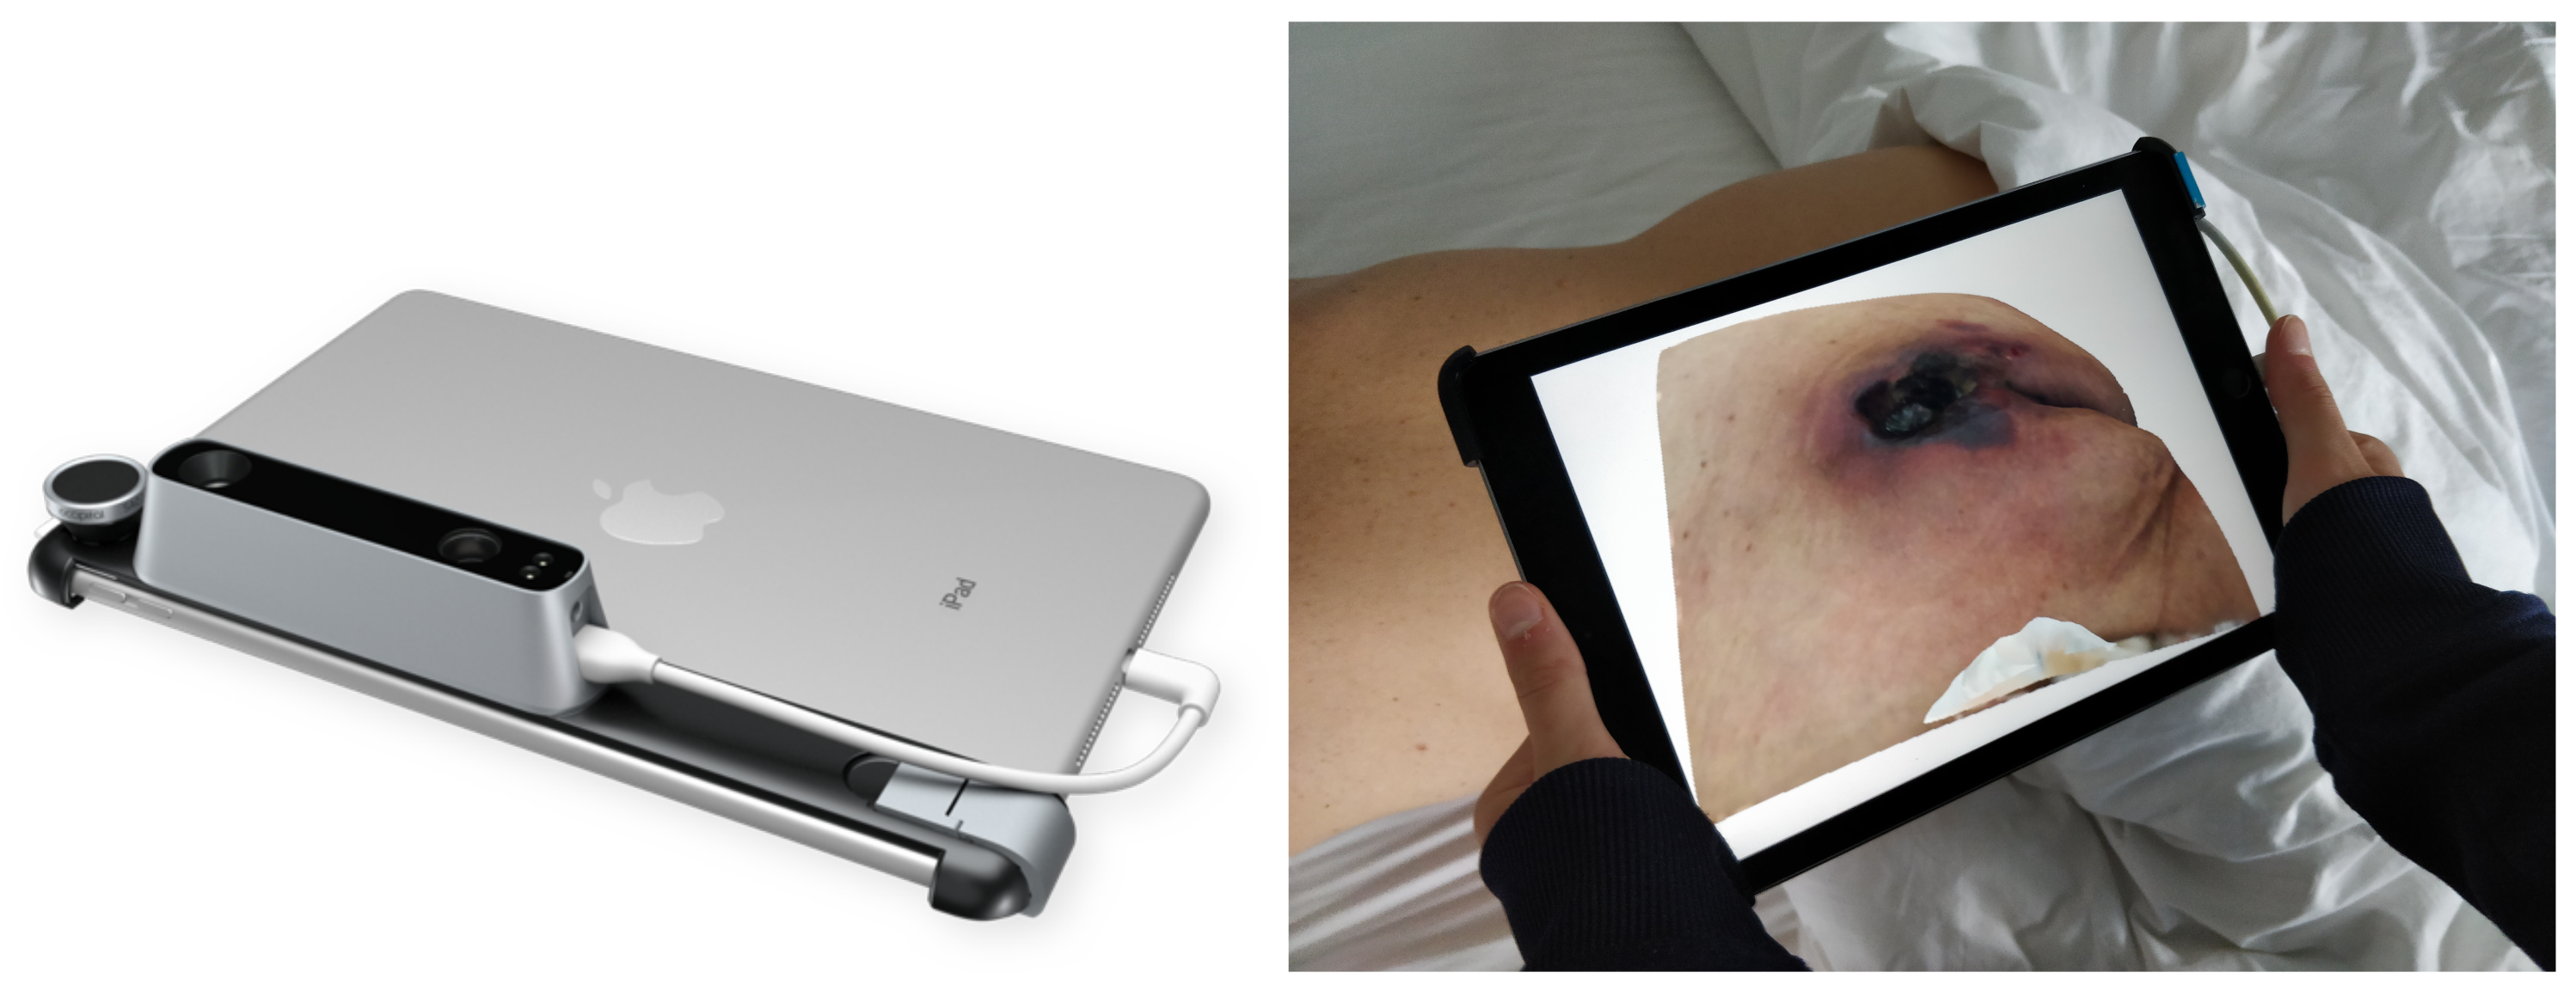
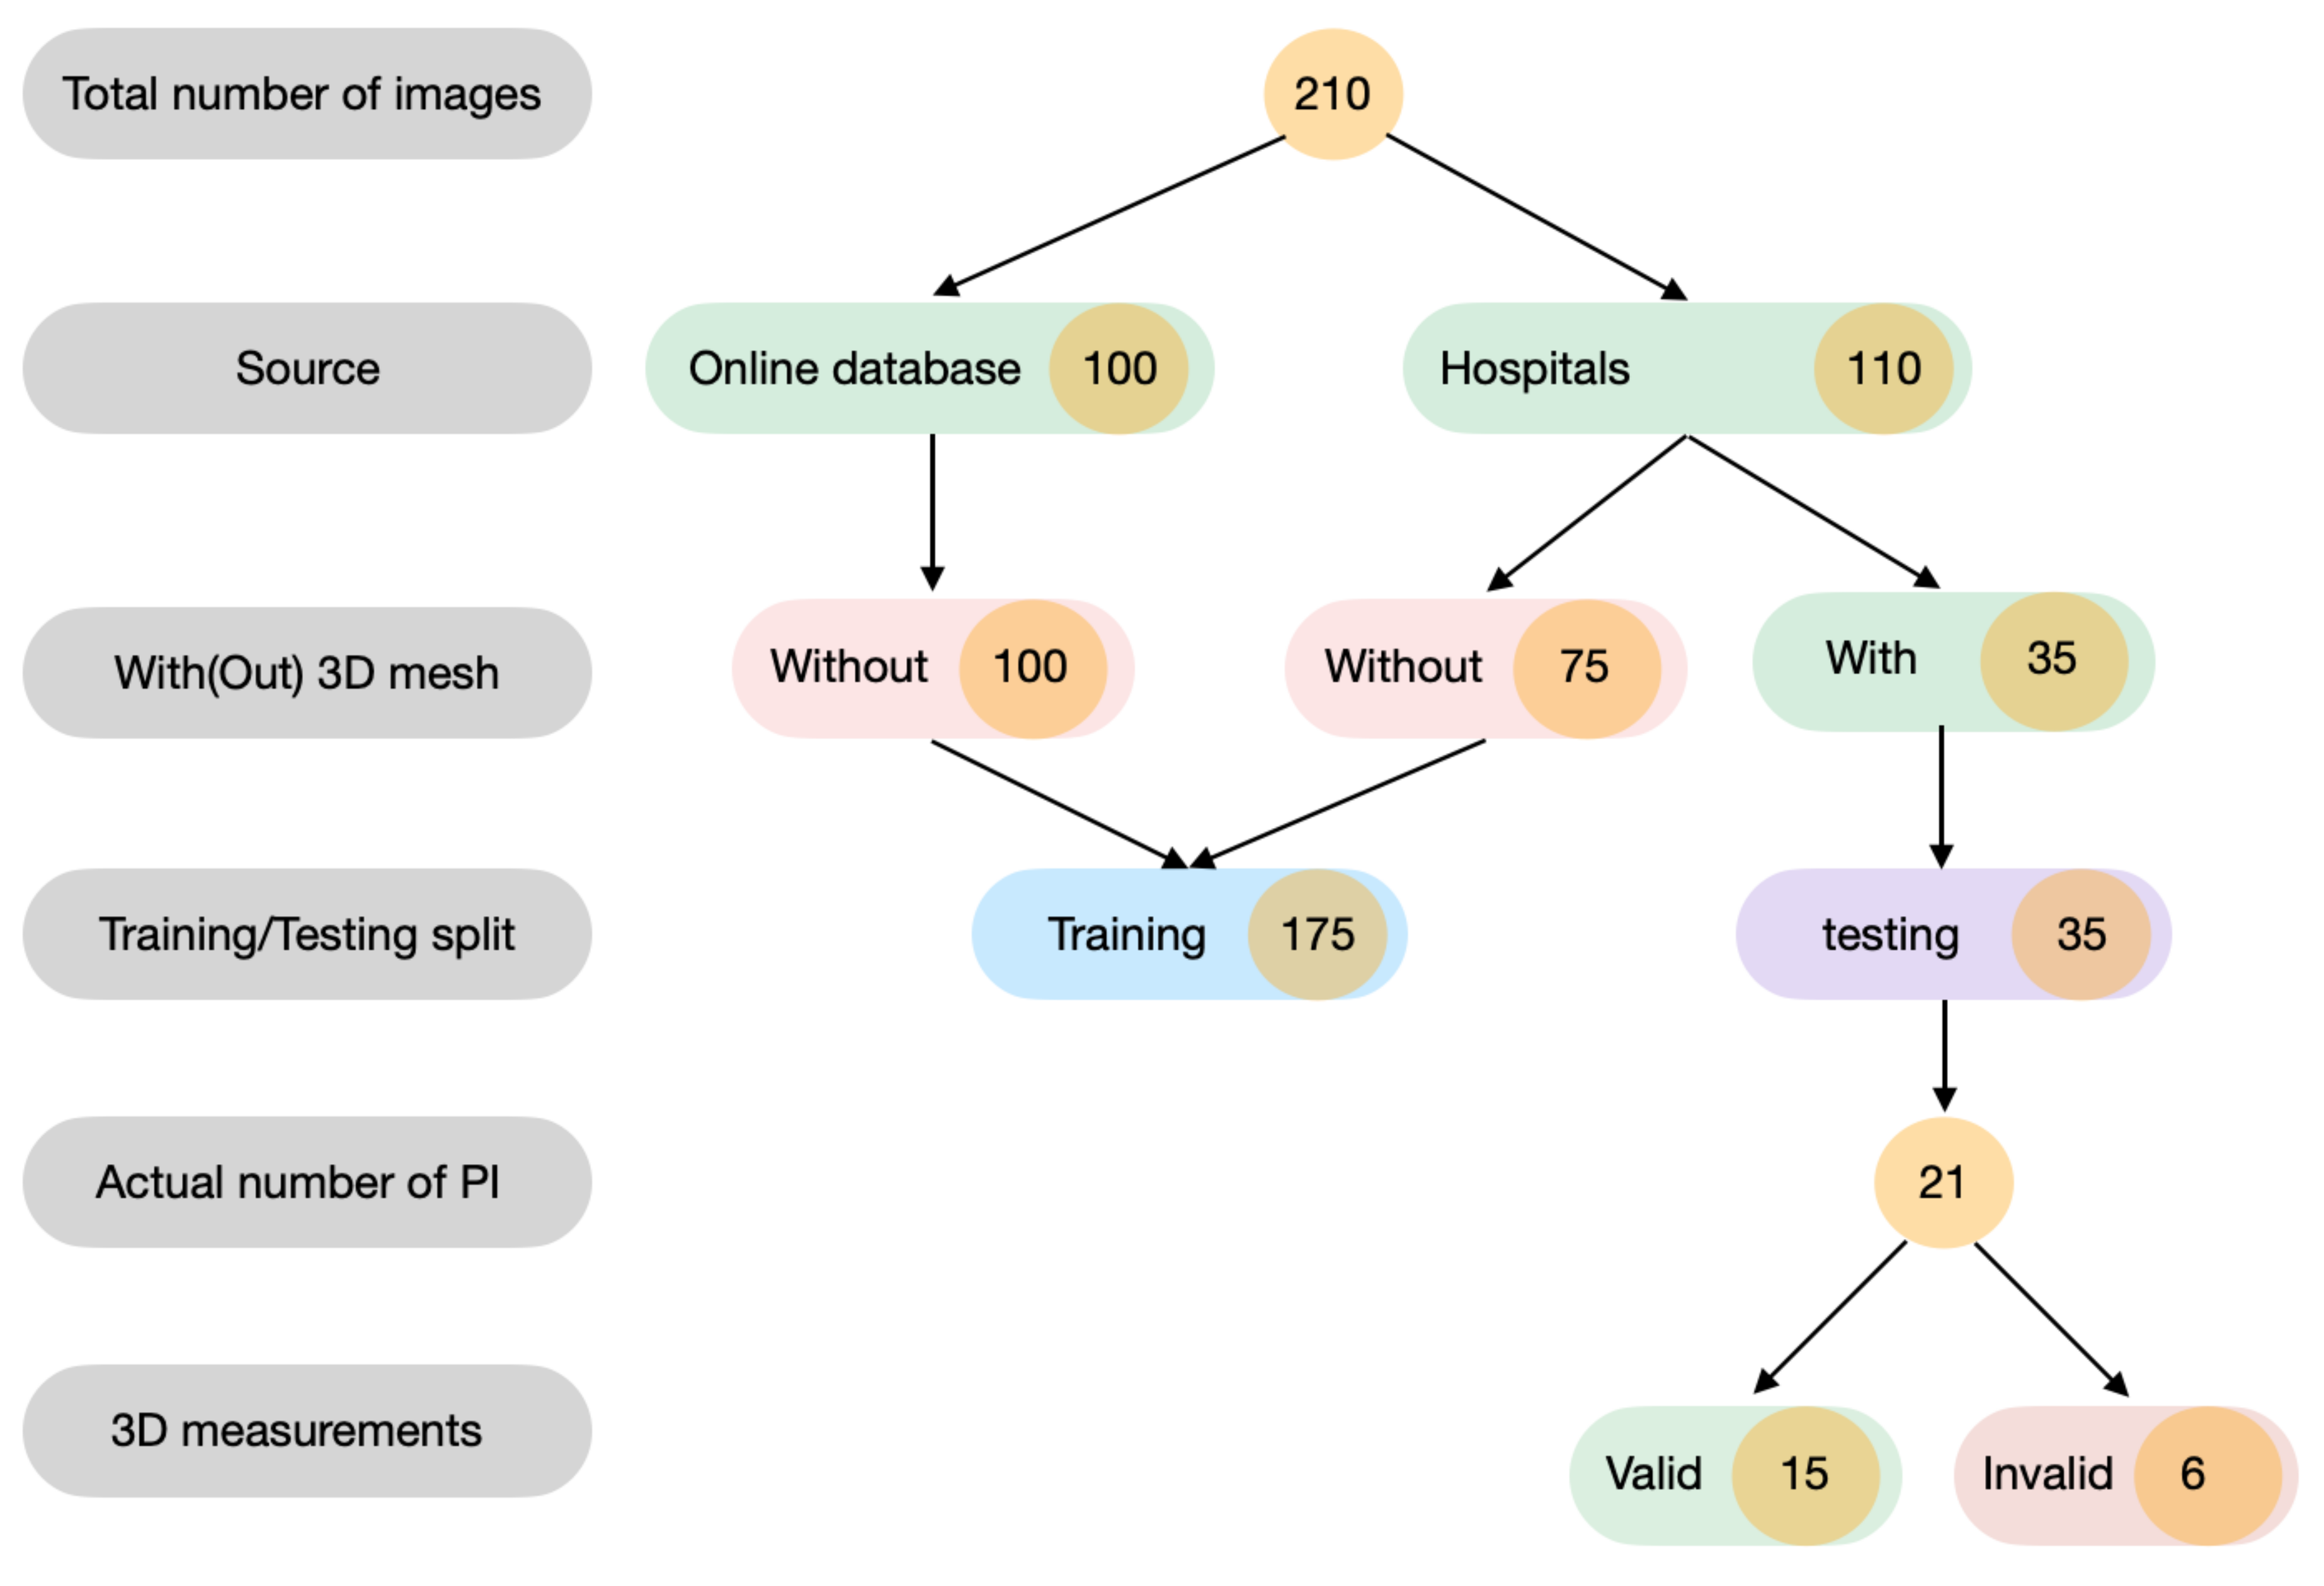
4.1. Data Collection
4.2. Implementation
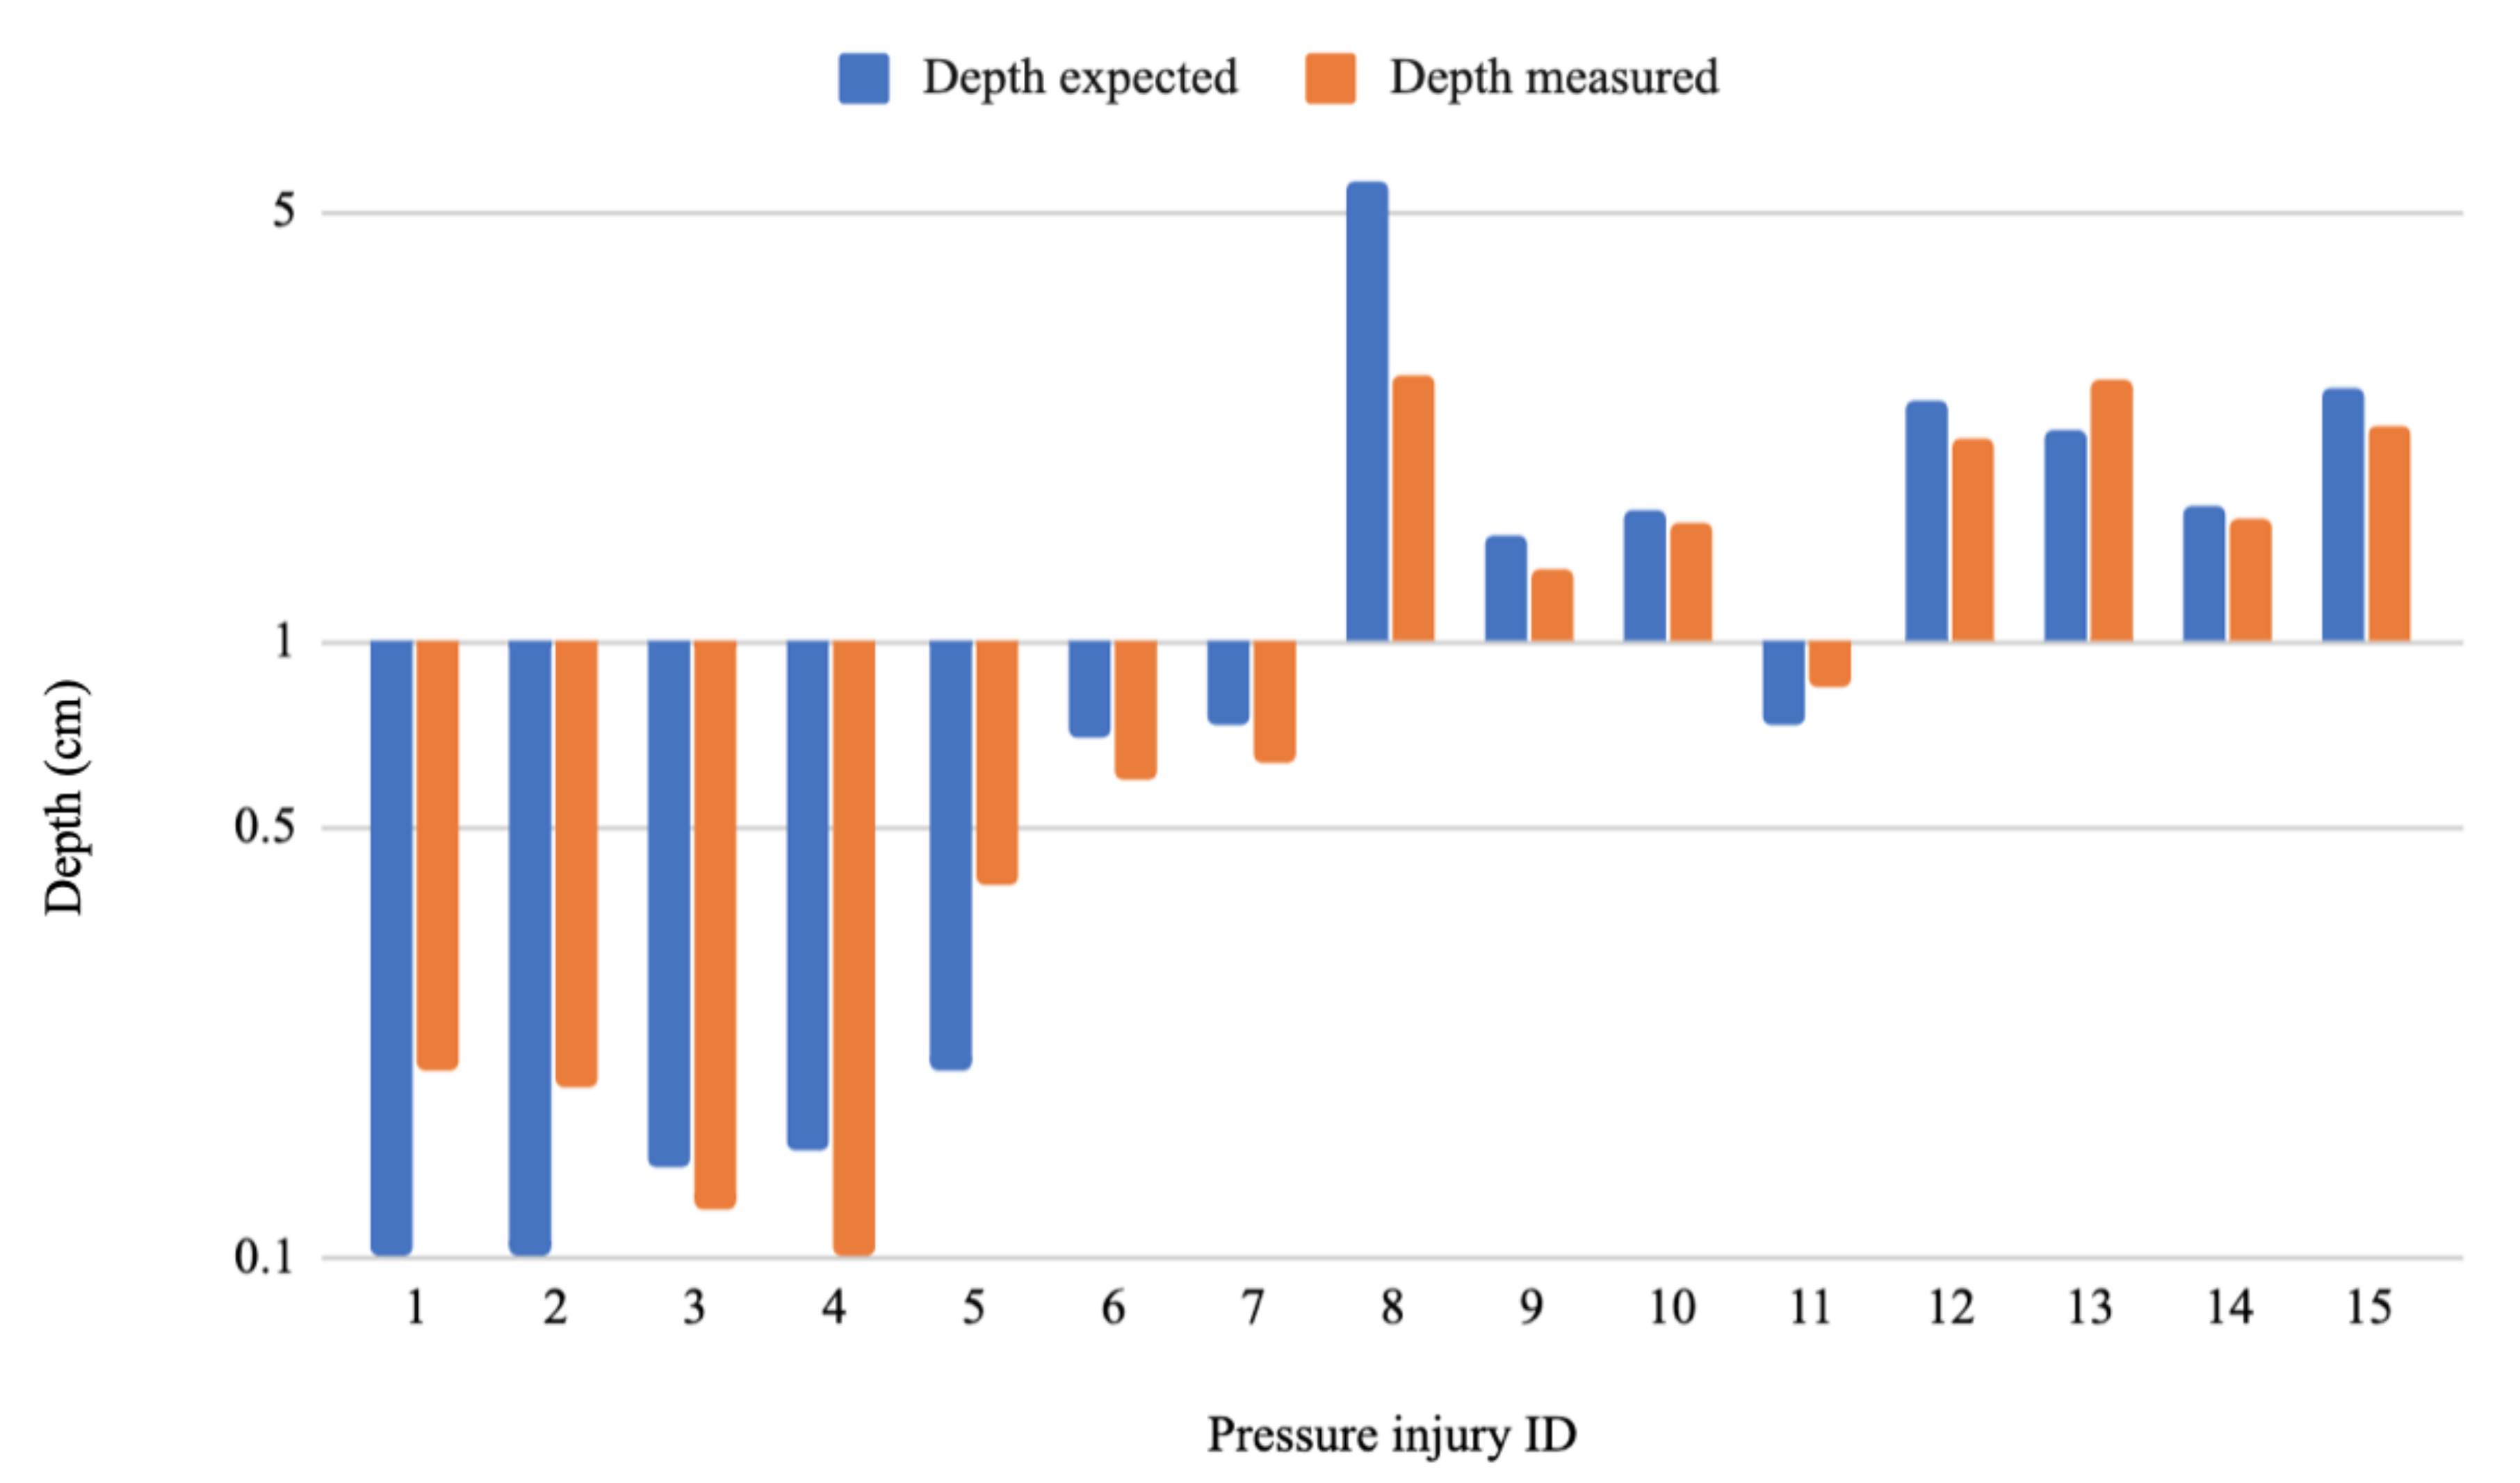
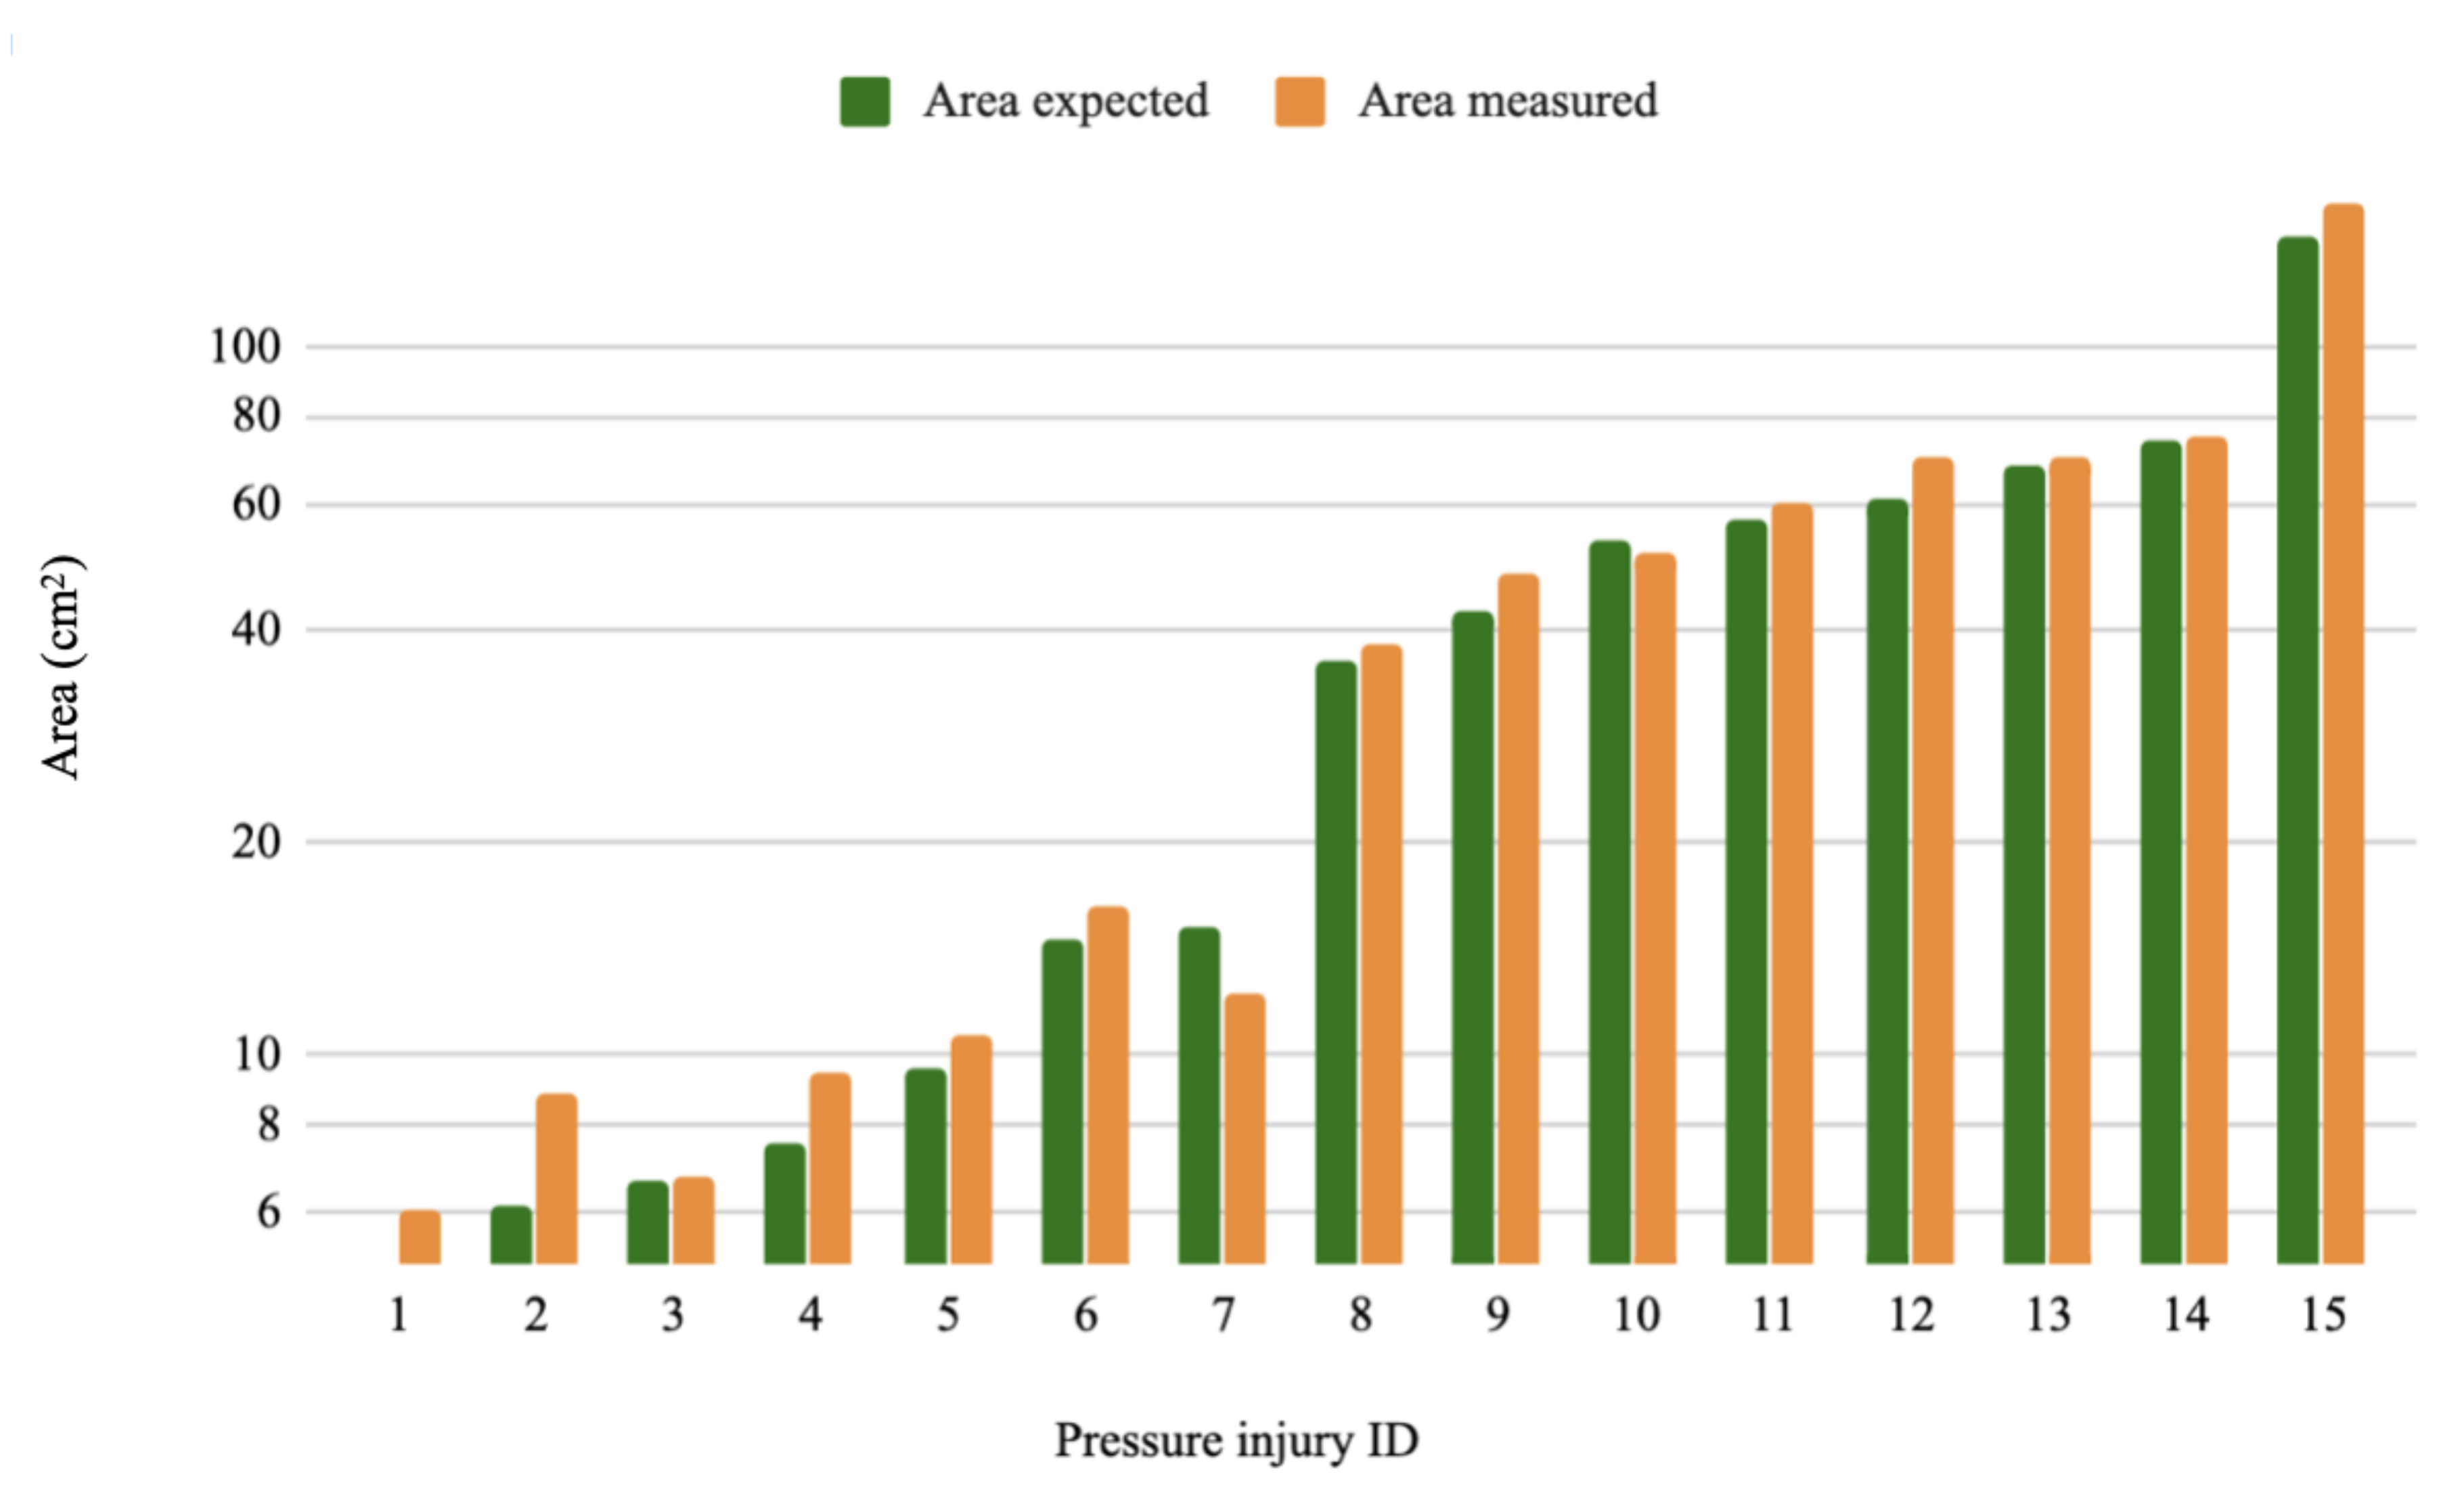
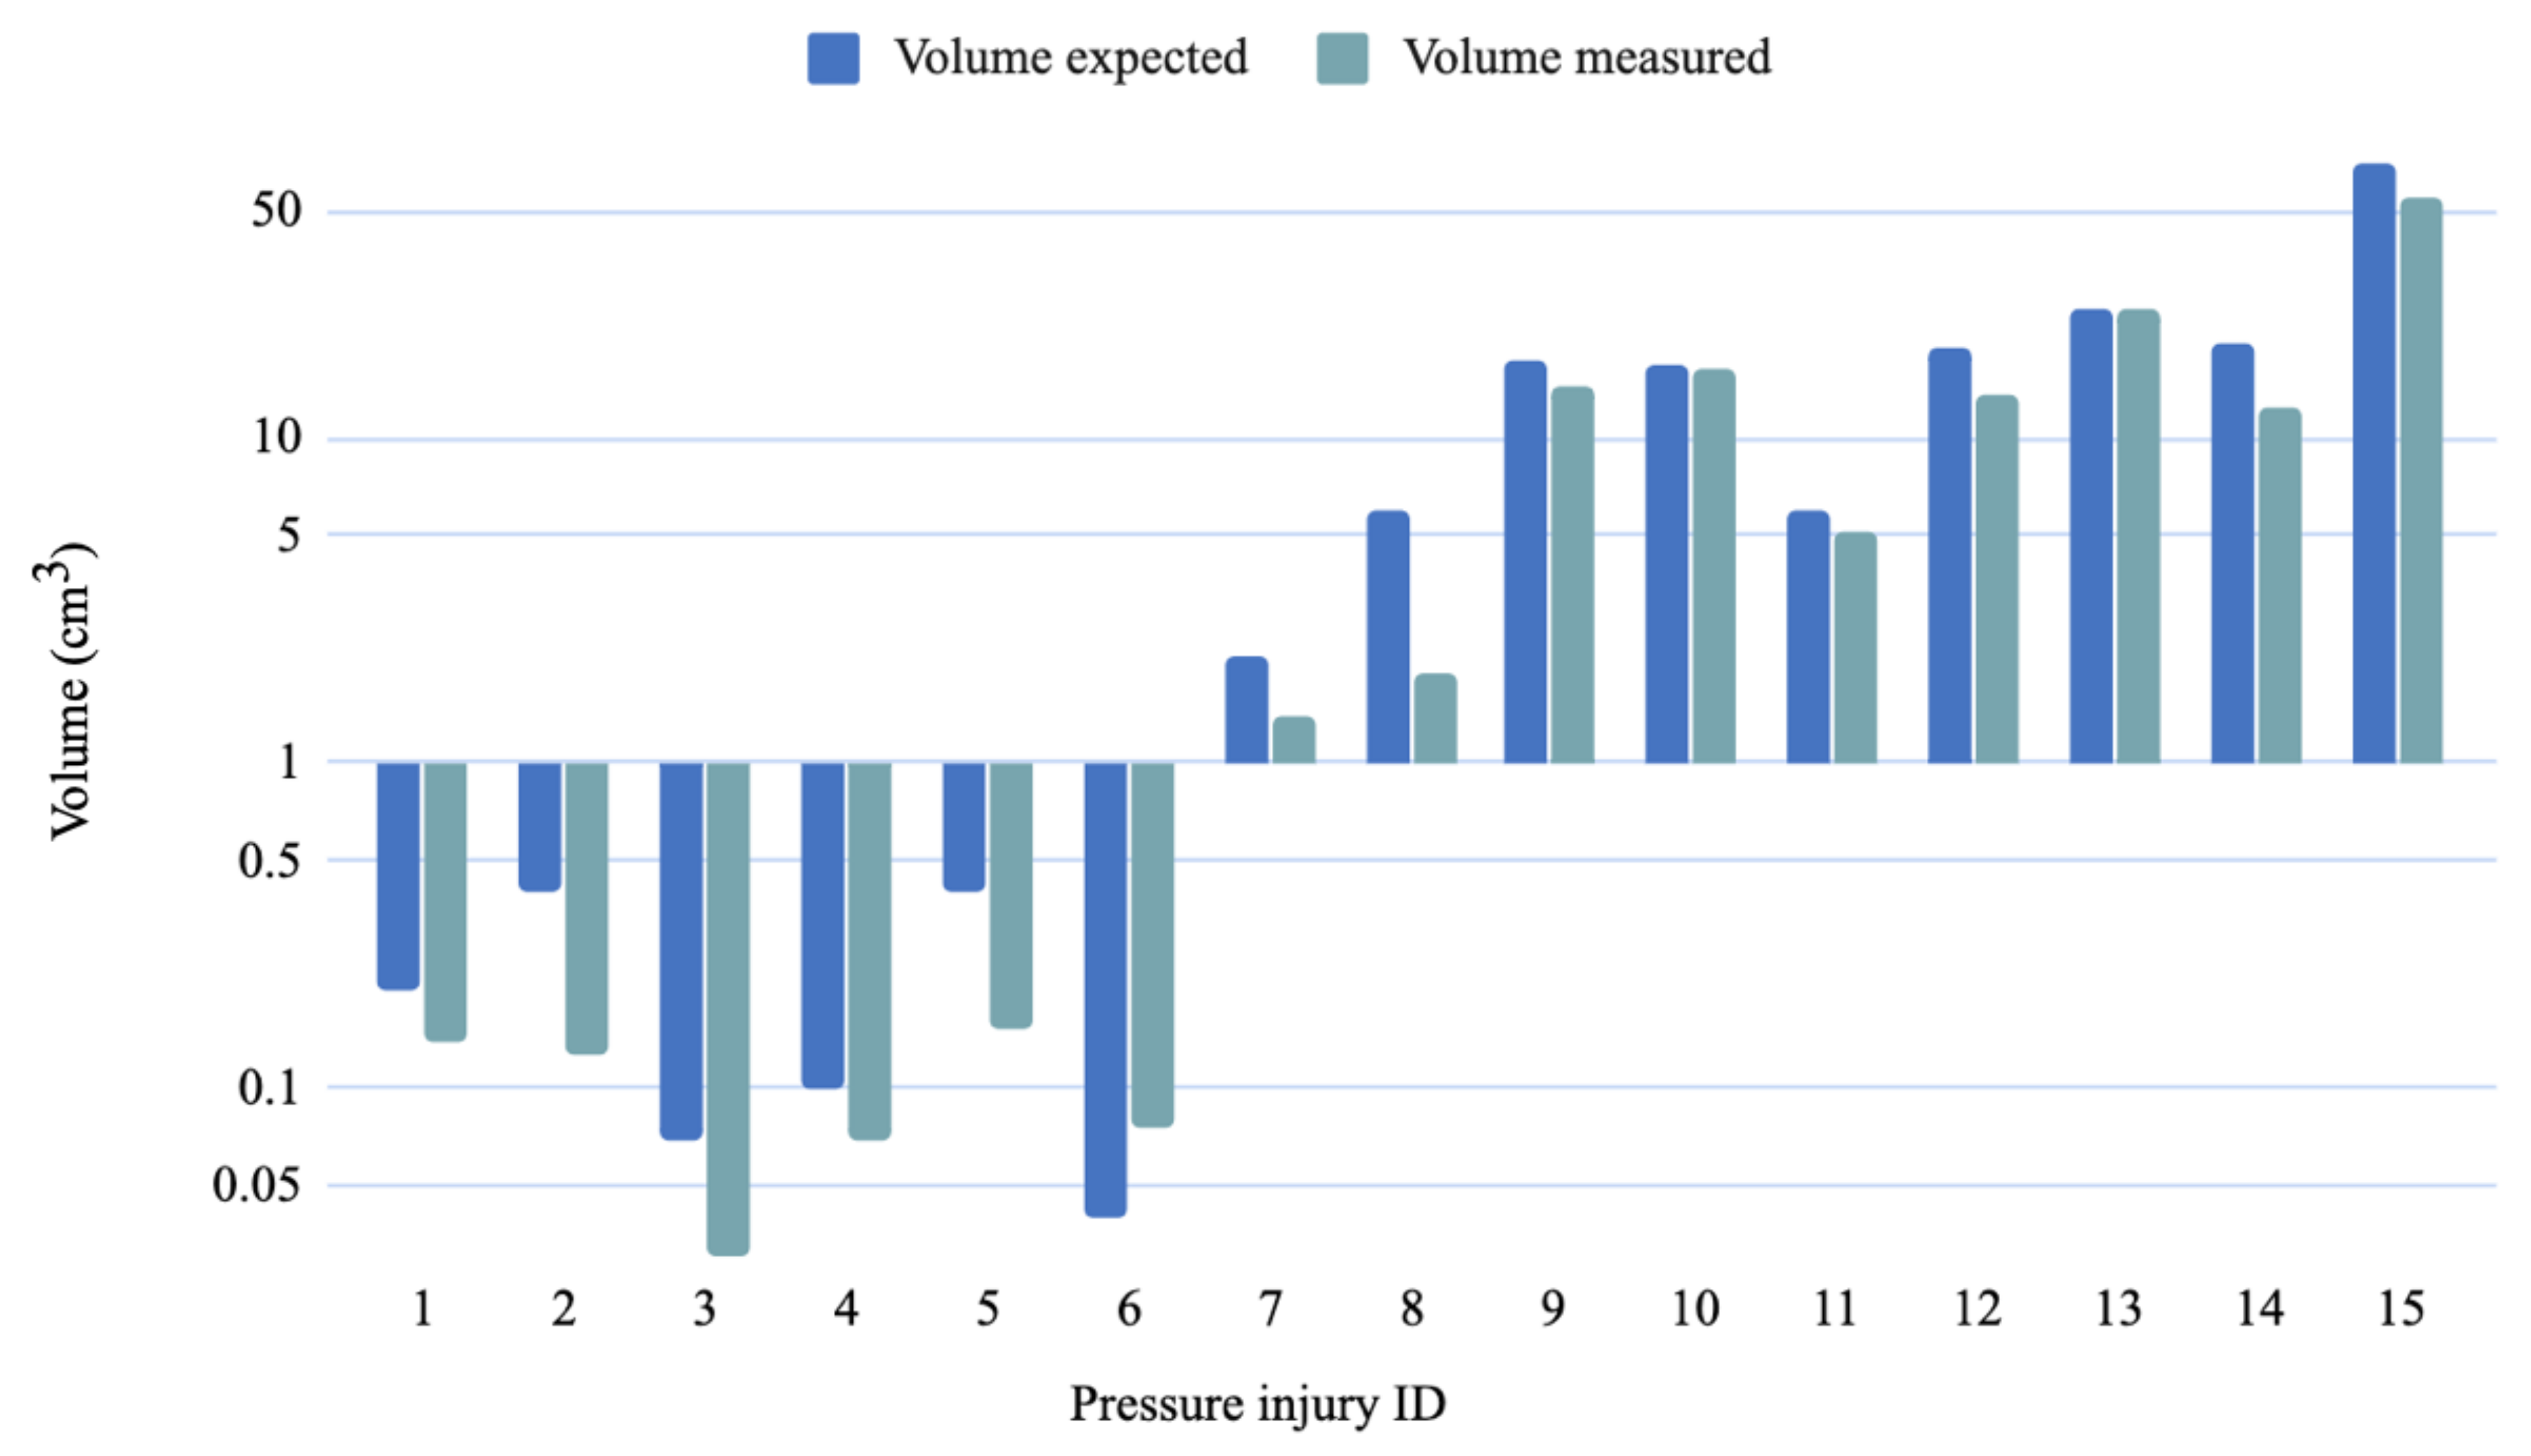
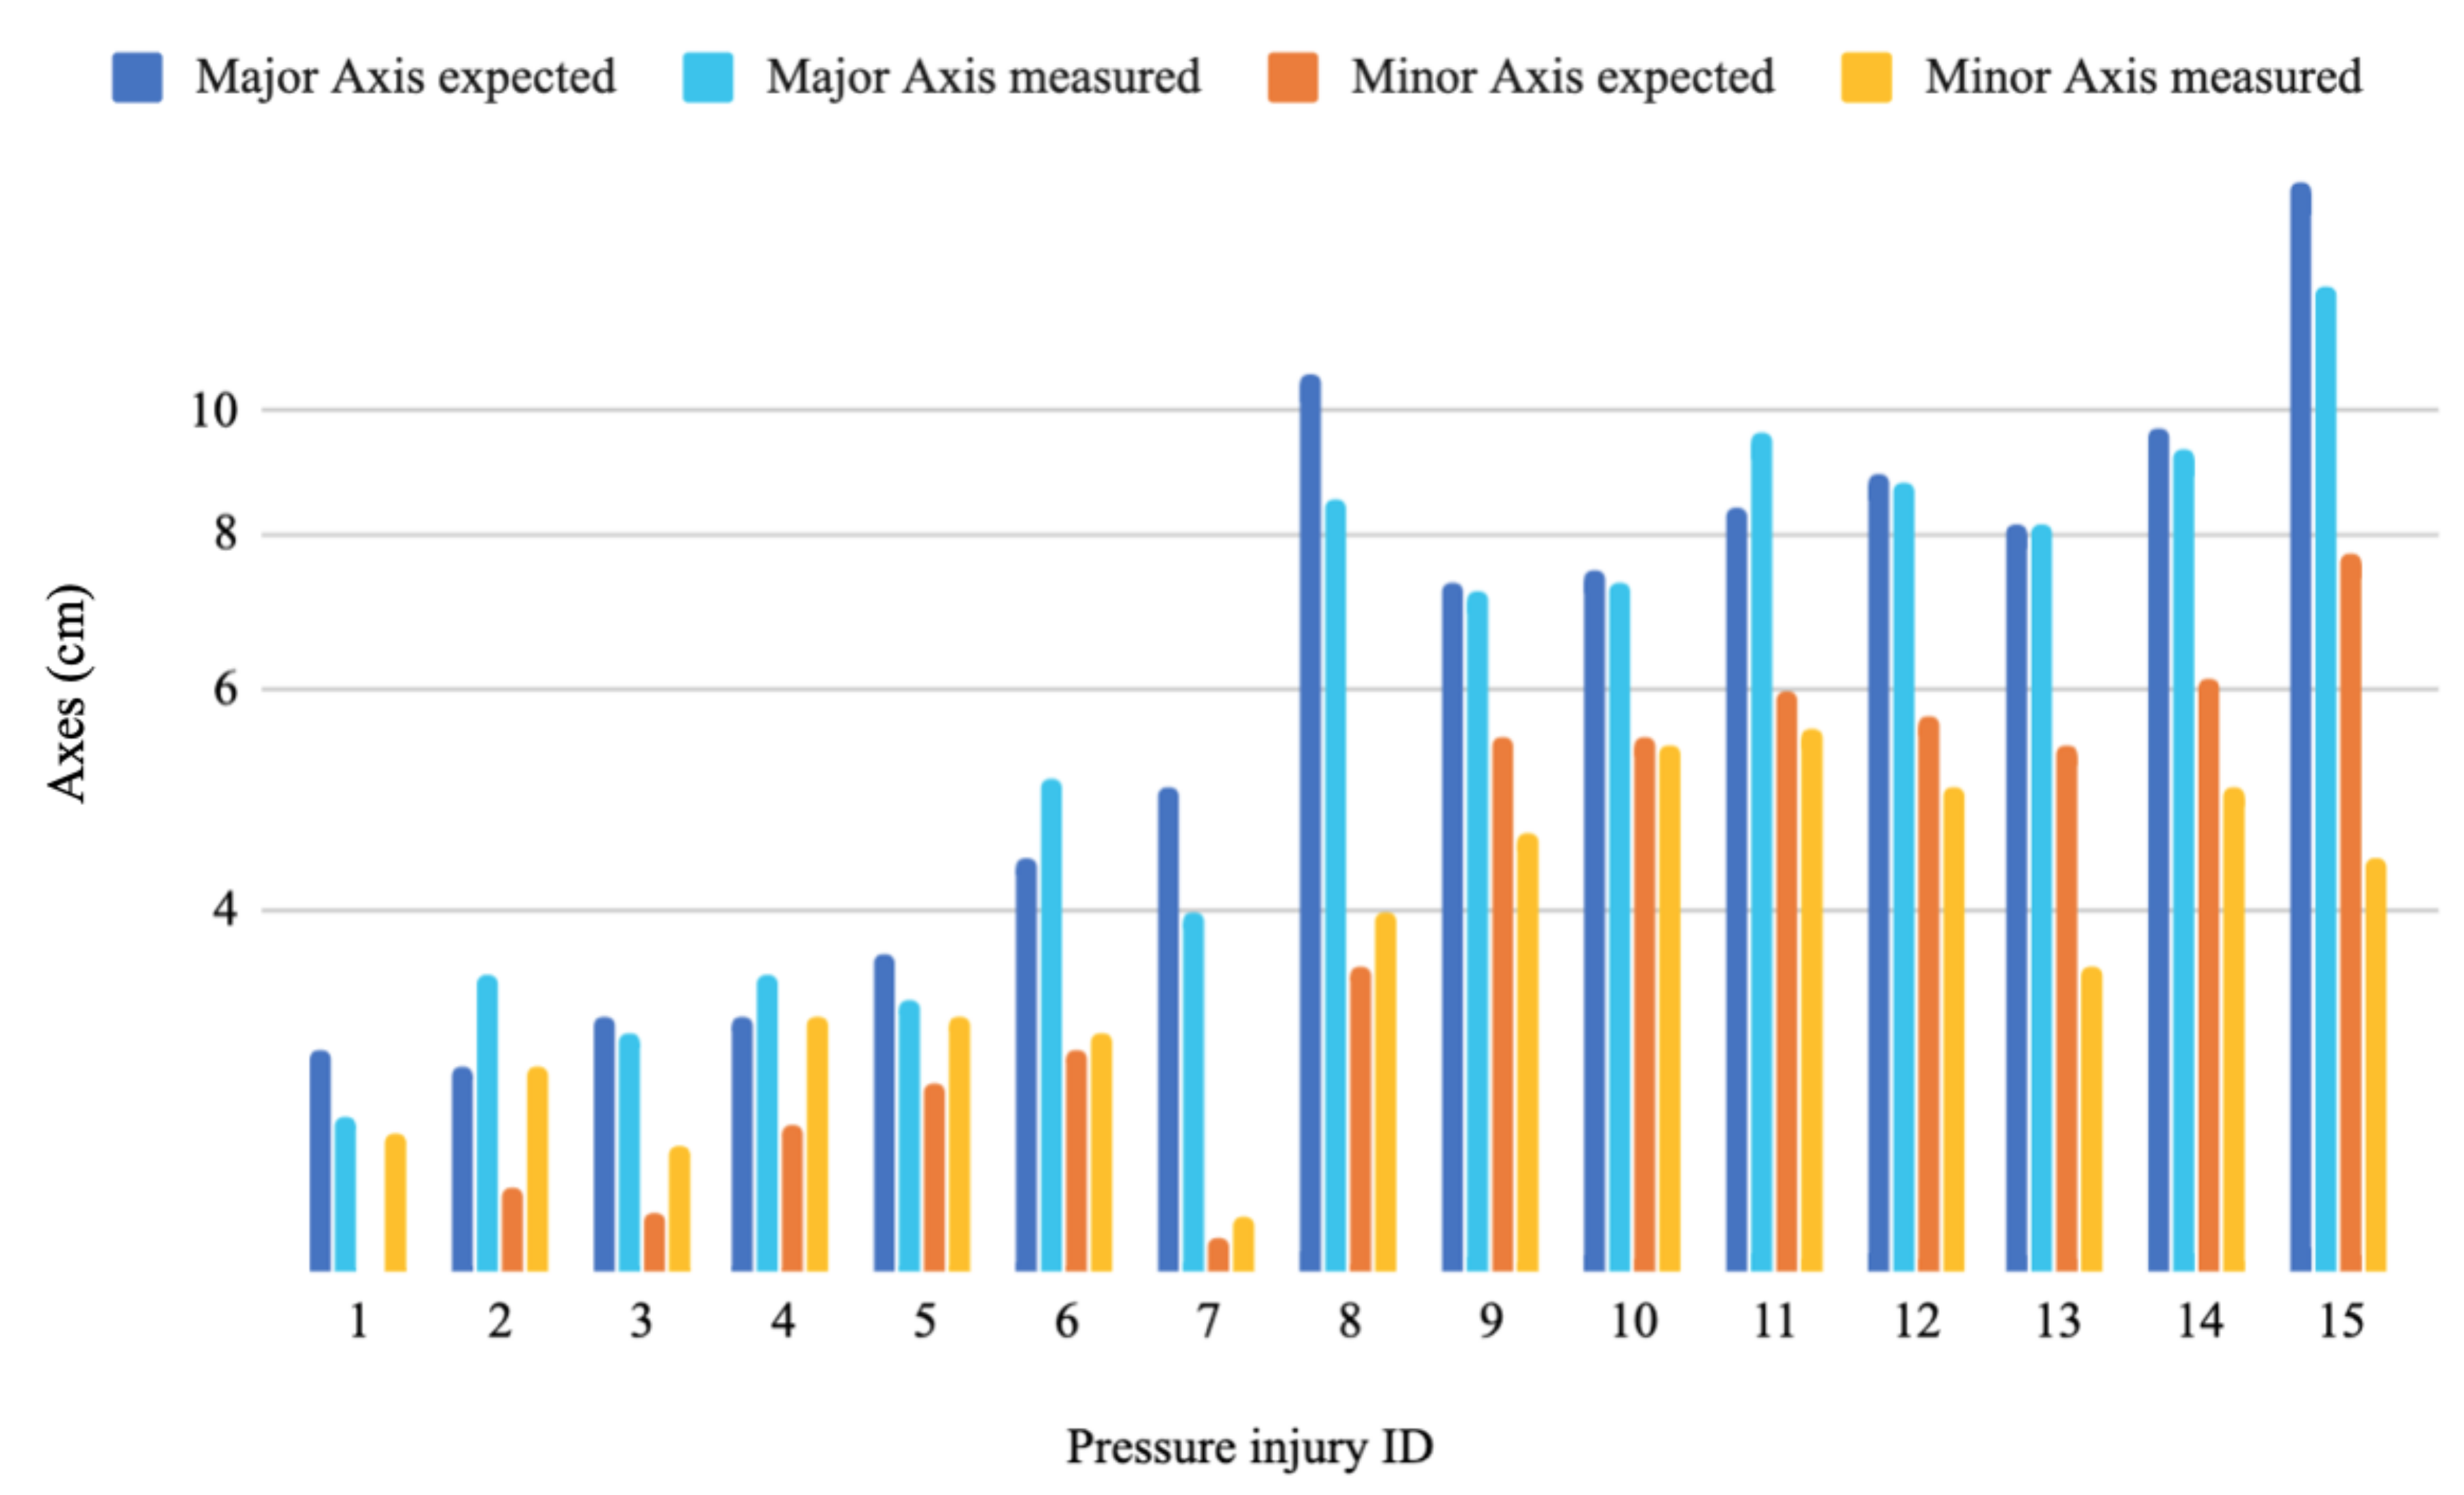
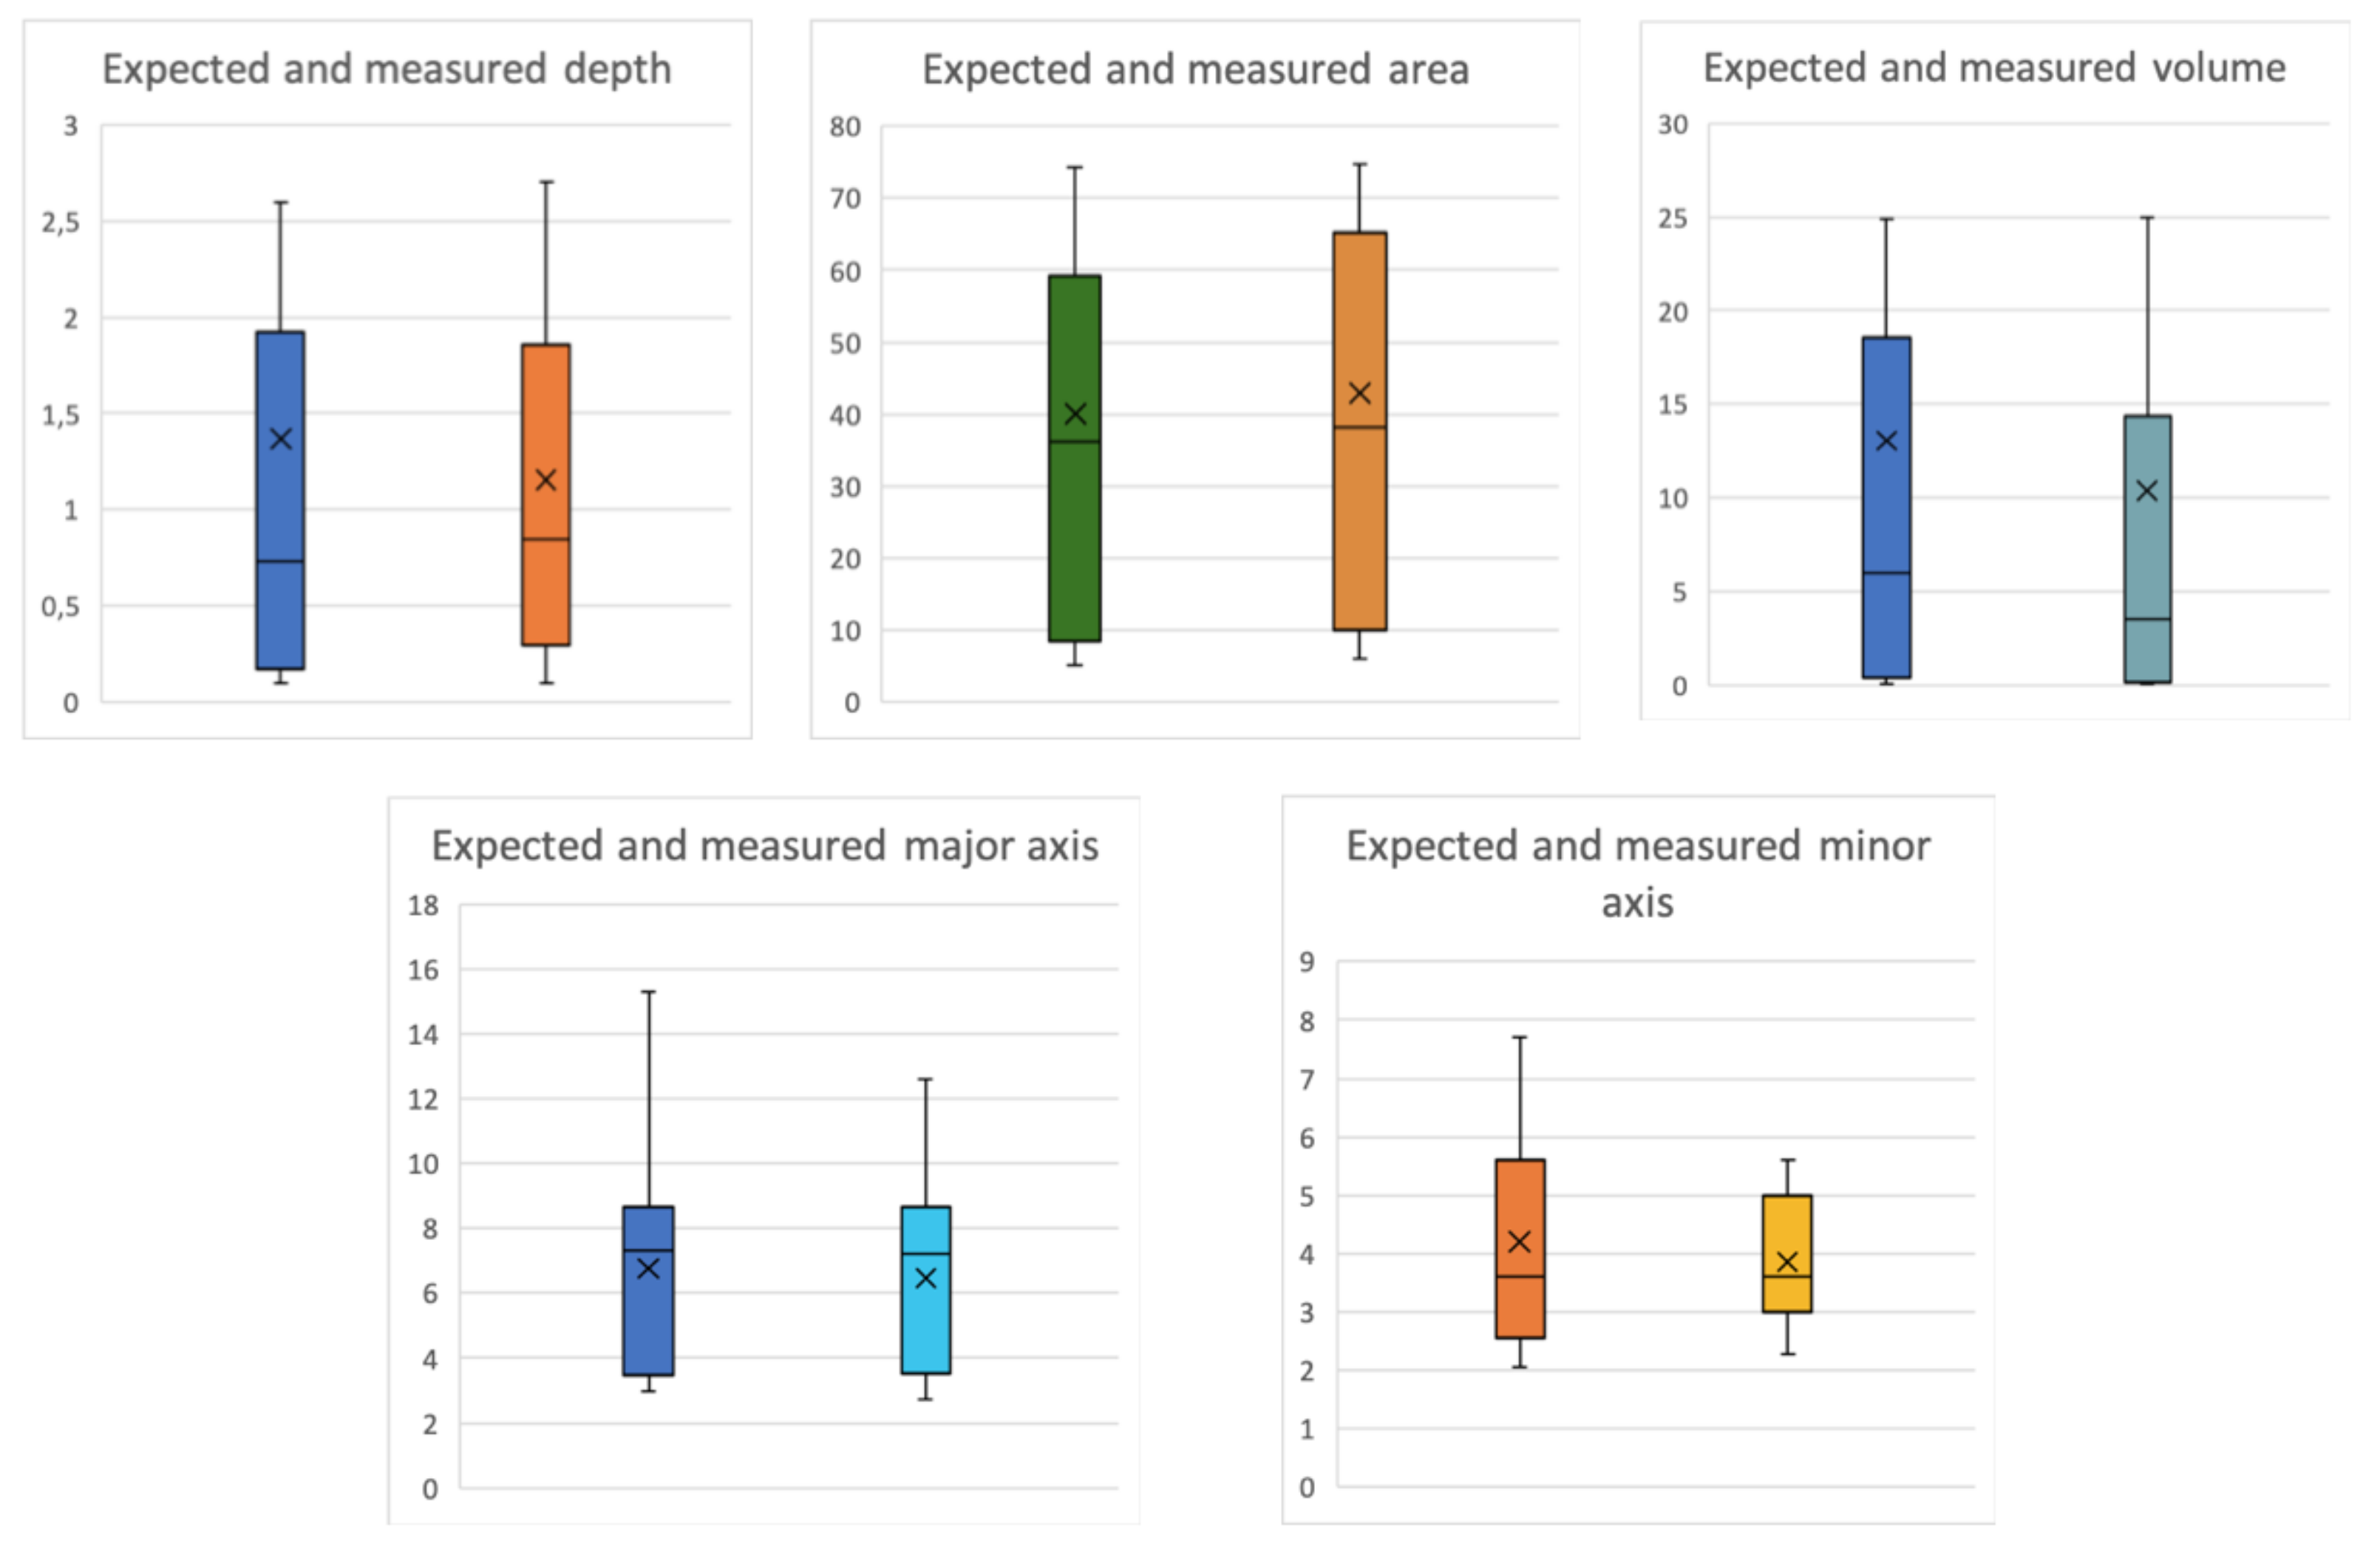
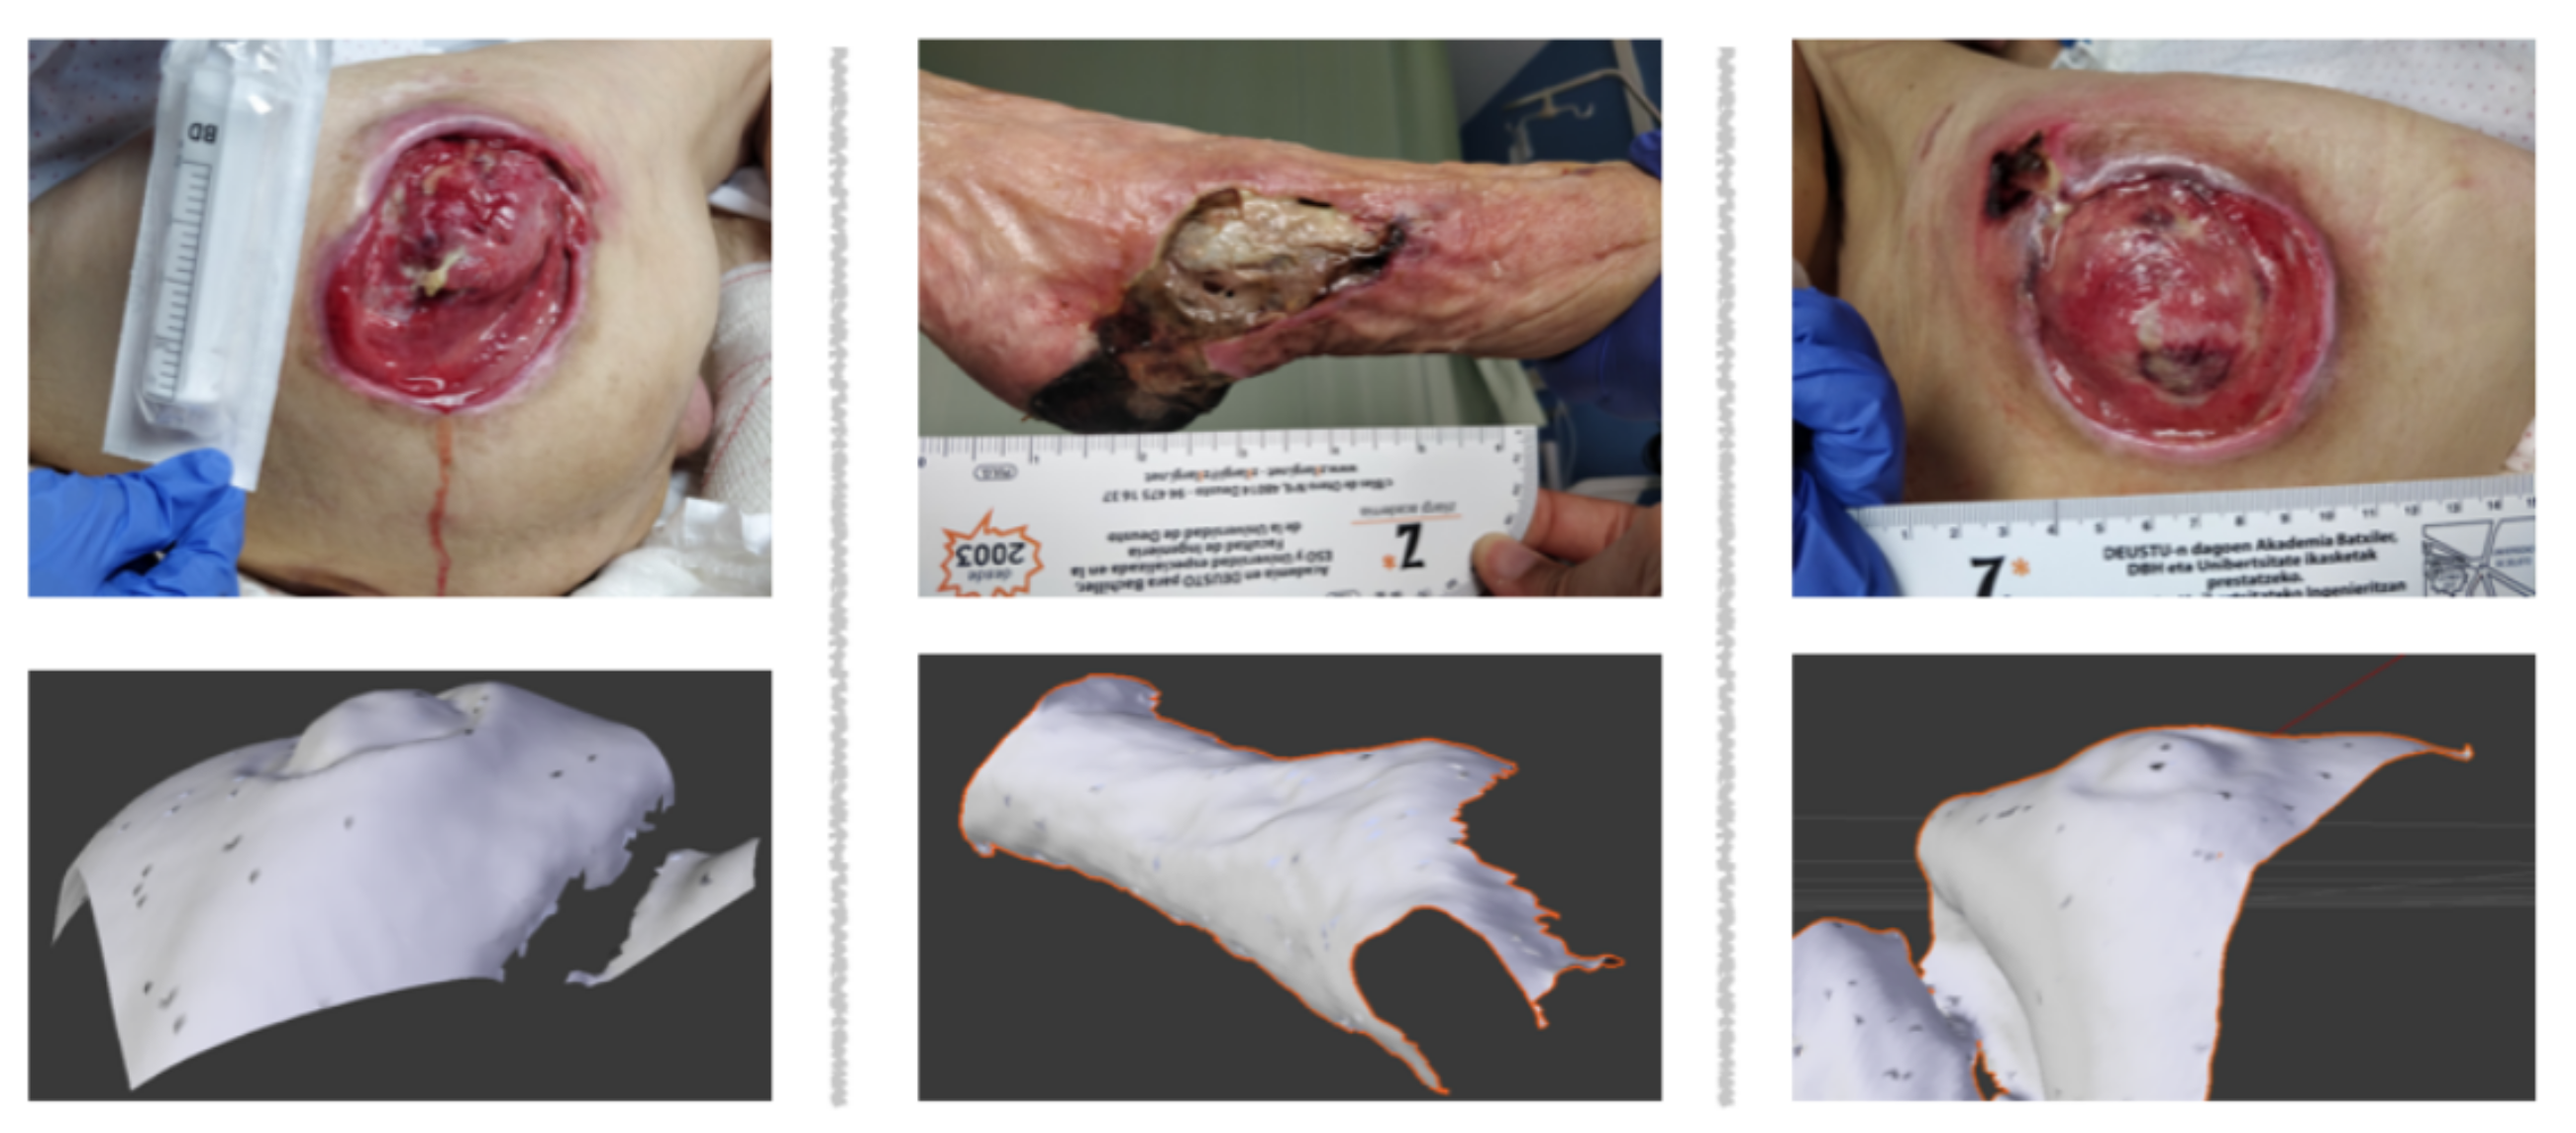
4.3. Evaluation Metrics and Results
5. Discussion and Conclusions
Author Contributions
Funding
Acknowledgments
Conflicts of Interest
Abbreviations
| SLS | Structured Light System |
| SOC | System On a Chip |
| IR | Infrared |
| Mask RCNN | Mask Regional Convolutional Neural Network |
| PI | Pressure Injury |
| PSSC | Progressive Sparse Spatial Consensus |
| EM | Expectation-Maximization |
| RANSAC | RANdom SAmple Consensus |
| MIOD | Medetec Medical Images Online Database |
| SIFT | Scale Invariant Feature Transform |
| SVM | Support Vector Machines |
| FCN | Fully Convolution Network |
| RPN | Region Proposal Network |
| FC layers | Fully Connected layers |
| ROI | Region Of Interest |
| bbox | Bounding Box |
References
- Chaboyer, W.P.; Thalib, L.; Harbeck, E.L.; Coyer, F.M.; Blot, S.; Bull, C.F.; Lin, F.F. Incidence and prevalence of pressure injuries in adult intensive care patients: A systematic review and meta-analysis. Crit. Care Med. 2018, 46, e1074–e1081. [Google Scholar] [CrossRef] [PubMed]
- Agency for Healthcare Research and Quality (AHRQ). 2013 Annual Hospital-Acquired Condition Rate and Estimates of Cost Savings and Deaths Averted From 2010 to 2013. Available online: https://www.ahrq.gov/sites/default/files/publications/files/hacrate2013_0.pdf (accessed on 24 March 2020).
- Zahia, S.; Zapirain, M.B.G.; Sevillano, X.; González, A.; Kim, P.J.; Elmaghraby, A. Pressure injury image analysis with machine learning techniques: A systematic review on previous and possible future methods. Artif. Intell. Med. 2019, 102, 101742. [Google Scholar] [CrossRef] [PubMed]
- Agency for Healthcare Research and Quality. Preventing Pressure Ulcers in Hospitals. Available online: https://www.ahrq.gov/professionals/systems/hospital/pressureulcertoolkit/putool1.html (accessed on 28 March 2020).
- Nussbaum, S.R.; Carter, M.J.; Fife, C.E.; DaVanzo, J.; Haught, R.; Nusgart, M.; Cartwright, D. An economic evaluation of the impact, cost, and medicare policy implications of chronic nonhealing wounds. Value Health 2018, 21, 27–32. [Google Scholar] [CrossRef] [PubMed]
- Dealey, C.; Posnett, J.; Walker, A. The cost of pressure ulcers in the United Kingdom. J. Wound Care 2012, 21, 261–266. [Google Scholar] [CrossRef]
- Khoshelham, K.; Elberink, S.O. Accuracy and resolution of Kinect depth data for indoor mapping applications. Sensors 2012, 12, 1437–1454. [Google Scholar] [CrossRef]
- Sansoni, G.; Trebeschi, M.; Docchio, F. State-of-the-art and applications of 3D imaging sensors in industry, cultural heritage, medicine, and criminal investigation. Sensors 2009, 9, 568–601. [Google Scholar] [CrossRef]
- Zhang, L.; Han, B.; Dong, H.; El Saddik, A. Development of an automatic 3D human head scanning-printing system. Multimed. Tools Appl. 2017, 76, 4381–4403. [Google Scholar] [CrossRef]
- Treleaven, P.; Wells, J. 3D body scanning and healthcare applications. Computer 2007, 40, 28–34. [Google Scholar] [CrossRef]
- Structure Sensor. 3D Scanning, Mixed Reality and more, for any Device from iPads to Robots. Available online: https://structure.io/ (accessed on 28 April 2020).
- Kalantari, M.; Nechifor, M. Accuracy and utility of the Structure Sensor for collecting 3D indoor information. Geo-Spat. Inf. Sci. 2016, 19, 202–209. [Google Scholar] [CrossRef]
- Shah, A.; Wollak, C.; Shah, J.B. Wound measurement techniques: Comparing the use of ruler method, 2D imaging and 3D scanner. J. Am. Coll. Clin. Wound Spec. 2013, 5, 52–57. [Google Scholar] [CrossRef]
- Gholami, P.; Ahmadi-pajouh, M.A.; Abolftahi, N.; Hamarneh, G.; Kayvanrad, M. Segmentation and measurement of chronic wounds for bioprinting. IEEE J. Biomed. Health Inf. 2017, 22, 1269–1277. [Google Scholar] [CrossRef] [PubMed]
- Wang, L.; Pedersen, P.C.; Agu, E.; Strong, D.M.; Tulu, B. Area determination of diabetic foot ulcer images using a cascaded two-stage SVM-based classification. IEEE Trans. Biomed. Eng. 2016, 64, 2098–2109. [Google Scholar] [CrossRef] [PubMed]
- Khan, S.; Paul, S.; Rao, S.S.; Krishnareddy, A. Segmenting skin ulcers based on thresholding and watershed segmentation. In Proceedings of the International Conference on Communications and Signal Processing (ICCSP), Melmaruvathur, India, 2–4 April 2015. [Google Scholar]
- Fauzi, M.F.A.; Khansa, I.; Catignani, K.; Gordillo, G.; Sen, C.K.; Gurcan, M.N. Computerized segmentation and measurement of chronic wound images. Comput. Biol. Med. 2015, 60, 74–85. [Google Scholar] [CrossRef] [PubMed]
- Nandagopan, G.L.; Haripriya, A.B. Implementation and comparison of two image segmentation techniques on thermal foot images and detection of ulceration using asymmetry. In Proceedings of the International Conference on Communication and Signal Processing (ICCSP), Melmaruvathur, India, 6–8 April 2016. [Google Scholar]
- Lee, H.; Lee, B.U.; Park, J.; Sun, W.; Oh, B.; Yang, S. Segmentation of wounds using gradient vector flow. In Proceedings of the International Conference on Intelligent Informatics and Biomedical Sciences (ICIIBMS), Okinawa, Japan, 28–30 November 2015. [Google Scholar]
- Haider, A.; Alhashim, M.; Tavakolian, K.; Fazel-Rezai, R. Computer-assisted image processing technique for tracking wound progress. In Proceedings of the IEEE International Conference on Electro Information Technology (EIT), Grand Forks, ND, USA, 19–21 May 2016. [Google Scholar]
- Yadav, M.K.; Manohar, D.D.; Mukherjee, G.; Chakraborty, C. Segmentation of chronic wound areas by clustering techniques using selected color space. J. Med. Imaging Health Inf. 2013, 3, 22–29. [Google Scholar] [CrossRef]
- Bochko, V.; Välisuo, P.; Harju, T.; Alander, J. Lower extremity ulcer image segmentation of visual and near-infrared imagery. Ski. Res. Technol. 2010, 16, 190–197. [Google Scholar] [CrossRef]
- Seixas, J.L.; Barbon, S.; Mantovani, R.G. Pattern recognition of lower member skin ulcers in medical images with machine learning algorithms. In Proceedings of the IEEE 28th International Symposium on Computer-Based Medical Systems, Sao Carlos, Brazil, 22–25 June 2015. [Google Scholar]
- Veredas, F.J.; Mesa, H.; Morente, L. Efficient detection of wound-bed and peripheral skin with statistical colour models. Med. Biol. Eng. Comput. 2015, 53, 345–359. [Google Scholar] [CrossRef]
- Lowe, D.G. Distinctive image features from scale-invariant keypoints. Int. J. Comput. Vis. 2004, 60, 91–110. [Google Scholar] [CrossRef]
- Litjens, G.; Kooi, T.; Bejnordi, B.E.; Setio, A.A.A.; Ciompi, F.; Ghafoorian, M.; Van Der Laak, J.A.; Van Ginneken, B.; Sánchez, C.I. A survey on deep learning in medical image analysis. Med. Image Anal. 2017, 42, 60–88. [Google Scholar] [CrossRef]
- Ronneberger, O.; Fischer, P.; Brox, T. U-Net: Convolutional networks for biomedical image segmentation. In International Conference on Medical Image Computing and Computer-Assisted Intervention; Springer: Cham, Switzerland, 2015; pp. 234–241. [Google Scholar]
- Zhang, X.; Yang, L.; Wang, J.; Zhao, Q.; Qiao, A. The design of wound area measurement software based on Android operating system. In Proceedings of the 11th World Congress on Intelligent Control and Automation, Shenyang, China, 29 June–4 July 2014. [Google Scholar]
- Trabelsi, O.; Tlig, L.; Sayadi, M.; Fnaiech, F. Skin disease analysis and tracking based on image segmentation. In Proceedings of the 2013 International Conference on Electrical Engineering and Software Applications, Hammamet, Tunisia, 21–23 March 2013. [Google Scholar]
- Chino, D.Y.; Scabora, L.C.; Cazzolato, M.T.; Jorge, A.E.; Traina, C., Jr.; Traina, A.J. Segmenting skin ulcers and measuring the wound area using deep convolutional networks. Comput. Methods Programs Biomed. 2020, 191, 105376. [Google Scholar] [CrossRef]
- Dorileo, É.A.; Frade, M.A.; Rangayyan, R.M.; Azevedo-Marques, P.M. Segmentation and analysis of the tissue composition of dermatological ulcers. In Proceedings of the CCECE 2010, Calgary, AB, Canada, 2–5 May 2010. [Google Scholar]
- Pereyra, L.C.; Pereira, S.M.; Souza, J.P.; Frade, M.A.; Rangayyan, R.M.; Azevedo-Marques, P.M. Characterization and pattern recognition of color images of dermatological ulcers: A pilot study. Comput. Sci. J. Mold. 2014, 22, 211–235. [Google Scholar]
- Blanco, G.; Bedo, M.V.; Cazzolato, M.T.; Santos, L.F.; Jorge, A.E.S.; Traina, C.; Azevedo-Marques, P.M.; Traina, A.J. A label-scaled similarity measure for content-based image retrieval. In Proceedings of the 2016 IEEE International Symposium on Multimedia (ISM), San Jose, CA, USA, 11–13 December 2016. [Google Scholar]
- Chino, D.Y.T.; Scabora, L.C.; Cazzolato, M.T.; Jorge, A.E.S.; Traina, C.; Traina, A.J.M. ICARUS: Retrieving skin ulcer images through bag-of-signatures. In Proceedings of the 2018 IEEE 31st International Symposium on Computer-Based Medical Systems (CBMS), Karlstad, Sweden, 18–21 June 2018. [Google Scholar]
- Ortiz, D.P.; Sierra-Sosa, D.; Zapirain, B.G. Pressure ulcer image segmentation technique through synthetic frequencies generation and contrast variation using toroidal geometry. Biomed. Eng. Online 2017, 16, 4. [Google Scholar] [CrossRef]
- He, K.; Gkioxari, G.; Dollár, P.; Girshick, R. Mask r-cnn. In Proceedings of the IEEE International Conference on Computer Vision, Venice, Italy, 22–29 October 2017. [Google Scholar]
- Ren, S.; He, K.; Girshick, R.; Sun, J. Faster R-CNN: Towards Real-Time Object Detection with Region Proposal Networks. IEEE Trans. Pattern Anal. Mach. Intell. 2017, 39, 1137–1149. [Google Scholar] [CrossRef] [PubMed]
- PyTorch3D. Available online: https://github.com/facebookresearch/pyTorch3d (accessed on 10 May 2020).
- Bishop, G.; Weimer, D.M. Fast phong shading. ACM SIGGRAPH Comput. Graph. 1986, 20, 103–106. [Google Scholar] [CrossRef]
- Ma, Y.; Wang, J.; Xu, H.; Zhang, S.; Mei, X.; Ma, J. Robust image feature matching via progressive sparse spatial consensus. IEEE Access 2017, 5, 24568–24579. [Google Scholar] [CrossRef]
- Fischler, M.A.; Bolles, R.C. Random sample consensus: A paradigm for model fitting with applications to image analysis and automated cartography. Commun. ACM 1981, 24, 381–395. [Google Scholar] [CrossRef]
- Avis, D.; Bremner, D.; Seidel, R. How good are convex hull algorithms? Comput. Geom. 1997, 7, 265–301. [Google Scholar] [CrossRef]
- Medetec Medical Images Medetec. Available online: http://www.medetec.co.uk/files/medetec-image-databases.html (accessed on 11 January 2020).
- Chollet, F. Keras: Deep Learning Library for Theano and Tensorflow. Available online: https://www.datasciencecentral.com/profiles/blogs/keras-deep-learning-library-for-theano-and-tensorflow (accessed on 21 May 2020).
- Abadi, M.; Agarwal, A.; Barham, P.; Brevdo, E.; Chen, Z.; Citro, C.; Corrado, G.S.; Davis, A.; Dean, J.; Devin, M.; et al. Tensorflow: Large-scale machine learning on heterogeneous distributed systems. arXiv 2016, 1603, 04467. [Google Scholar]
- Zahia, S.; Sierra-Sosa, D.; Garcia-Zapirain, B.; Elmaghraby, A. Tissue classification and segmentation of pressure injuries using convolutional neural networks. Comput. Methods Programs Biomed. 2018, 159, 51–58. [Google Scholar] [CrossRef]
- Dhane, D.M.; Krishna, V.; Achar, A.; Bar, C.; Sanyal, K.; Chakraborty, C. Spectral clustering for unsupervised segmentation of lower extremity wound beds using optical images. J. Med. Syst. 2016, 40, 207. [Google Scholar] [CrossRef]
- Veredas, F.J.; Luque-Baena, R.M.; Martn-Santos, F.J.; Morilla-Herrera, J.C.; Morente, L. Wound image evaluation with machine learning. Neurocomputing 2015, 164, 112–122. [Google Scholar] [CrossRef]
- Wannous, H.; Lucas, Y.; Treuillet, S. Enhanced assessment of the wound-healing process by accurate multiview tissue classification. IEEE Trans. Med. Imaging 2011, 30, 315326. [Google Scholar] [CrossRef] [PubMed]


© 2020 by the authors. Licensee MDPI, Basel, Switzerland. This article is an open access article distributed under the terms and conditions of the Creative Commons Attribution (CC BY) license (http://creativecommons.org/licenses/by/4.0/).
Share and Cite
Zahia, S.; Garcia-Zapirain, B.; Elmaghraby, A. Integrating 3D Model Representation for an Accurate Non-Invasive Assessment of Pressure Injuries with Deep Learning. Sensors 2020, 20, 2933. https://doi.org/10.3390/s20102933
Zahia S, Garcia-Zapirain B, Elmaghraby A. Integrating 3D Model Representation for an Accurate Non-Invasive Assessment of Pressure Injuries with Deep Learning. Sensors. 2020; 20(10):2933. https://doi.org/10.3390/s20102933
Chicago/Turabian StyleZahia, Sofia, Begonya Garcia-Zapirain, and Adel Elmaghraby. 2020. "Integrating 3D Model Representation for an Accurate Non-Invasive Assessment of Pressure Injuries with Deep Learning" Sensors 20, no. 10: 2933. https://doi.org/10.3390/s20102933
APA StyleZahia, S., Garcia-Zapirain, B., & Elmaghraby, A. (2020). Integrating 3D Model Representation for an Accurate Non-Invasive Assessment of Pressure Injuries with Deep Learning. Sensors, 20(10), 2933. https://doi.org/10.3390/s20102933