Development and Deployment of Air-Launched Drifters from Small UAS


Abstract
1. Introduction
Superpressure Balloons as Pseudo-Lagrangian Drifters
2. Setup
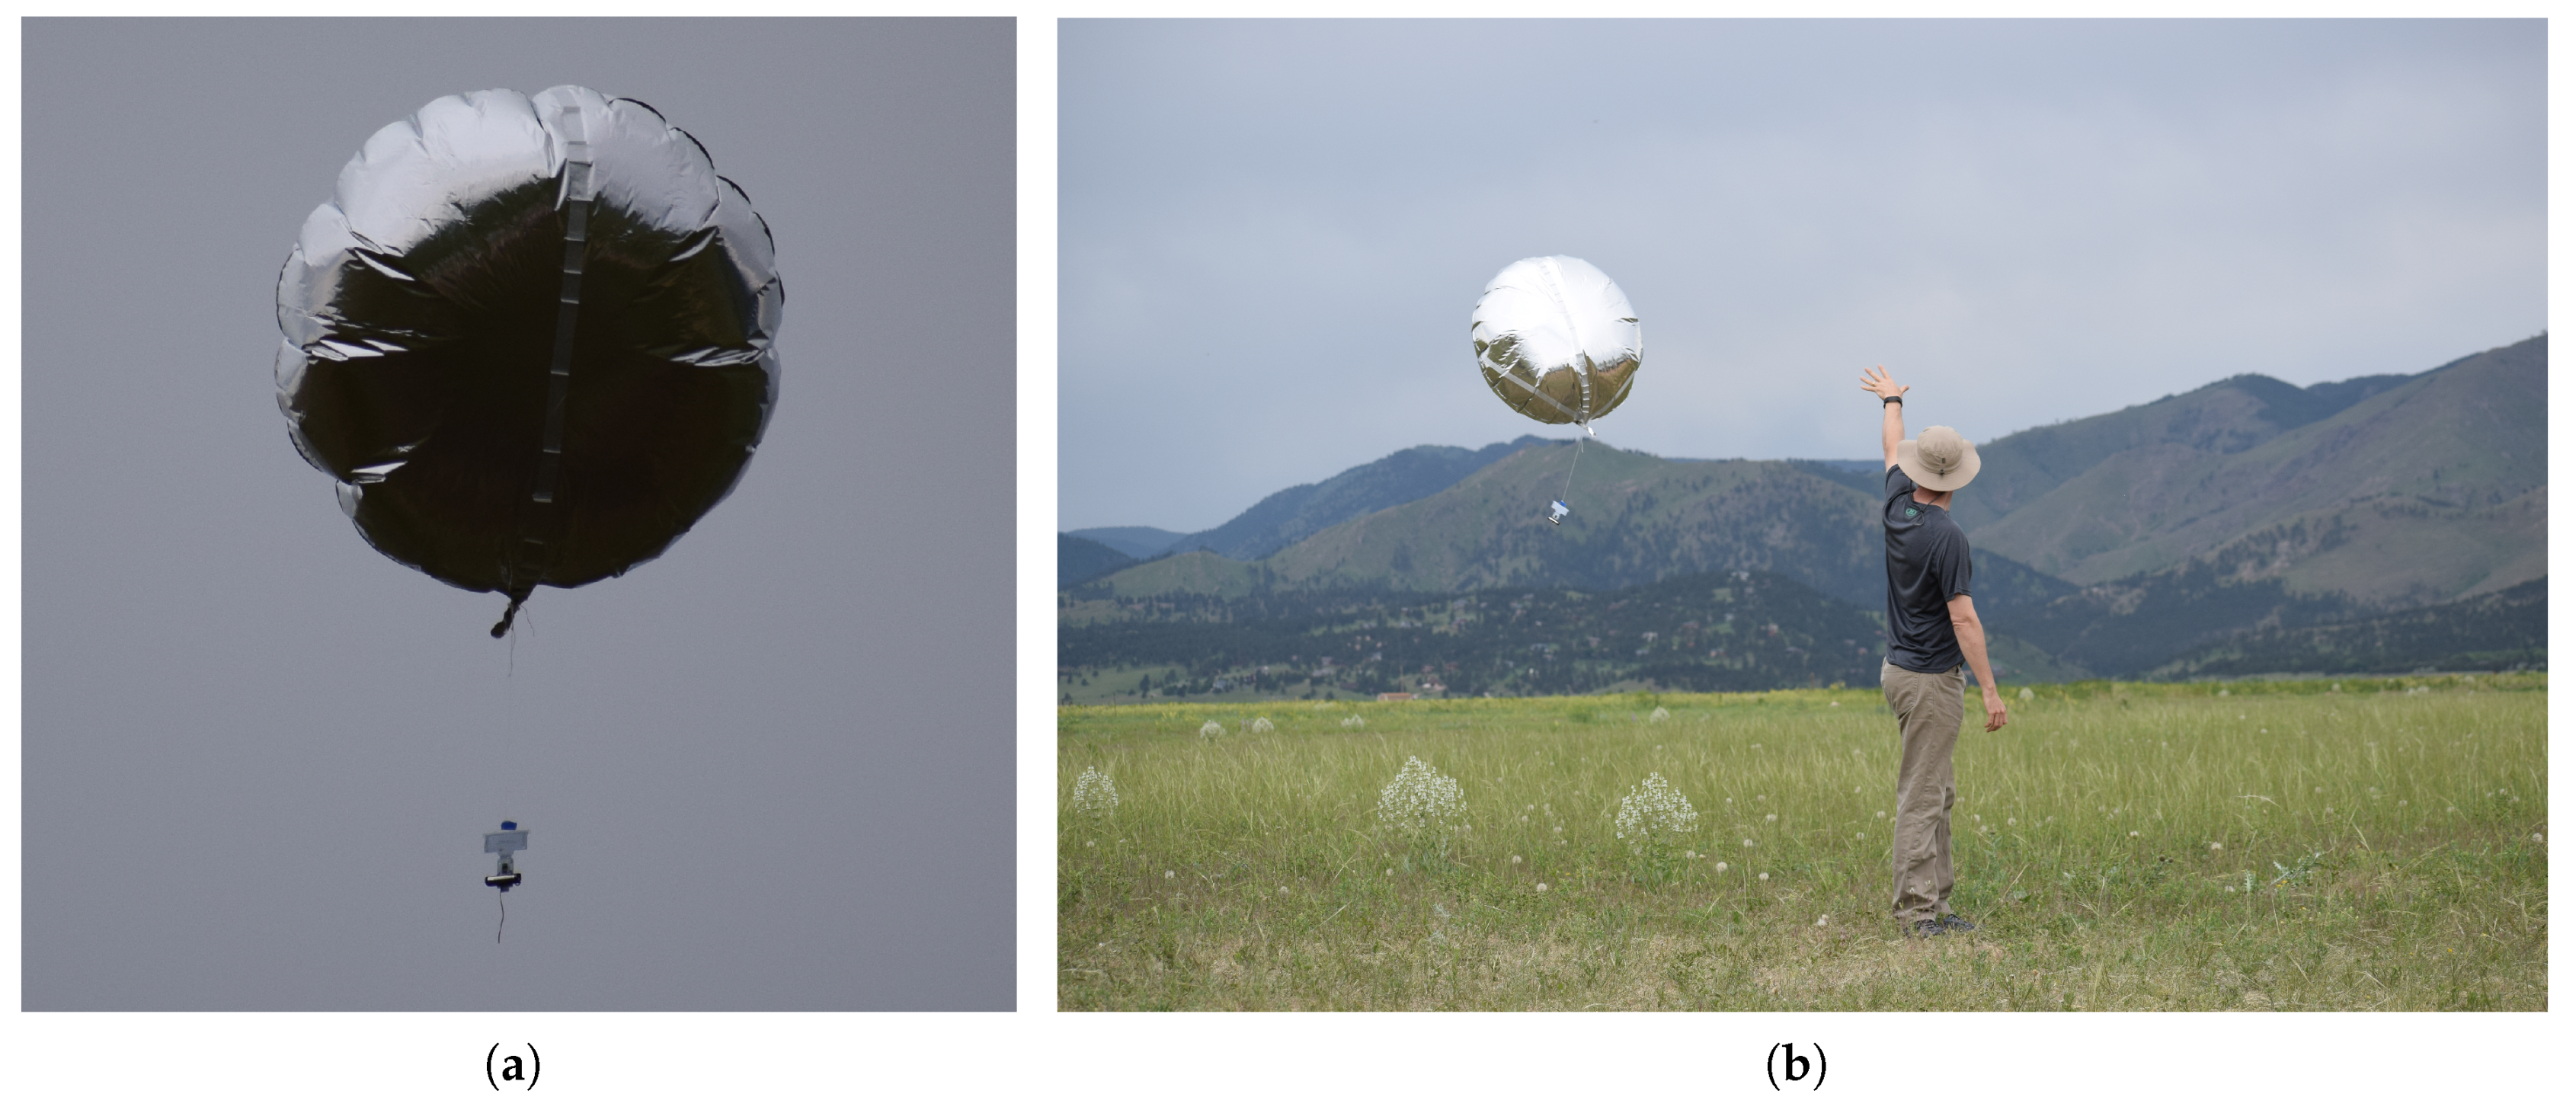
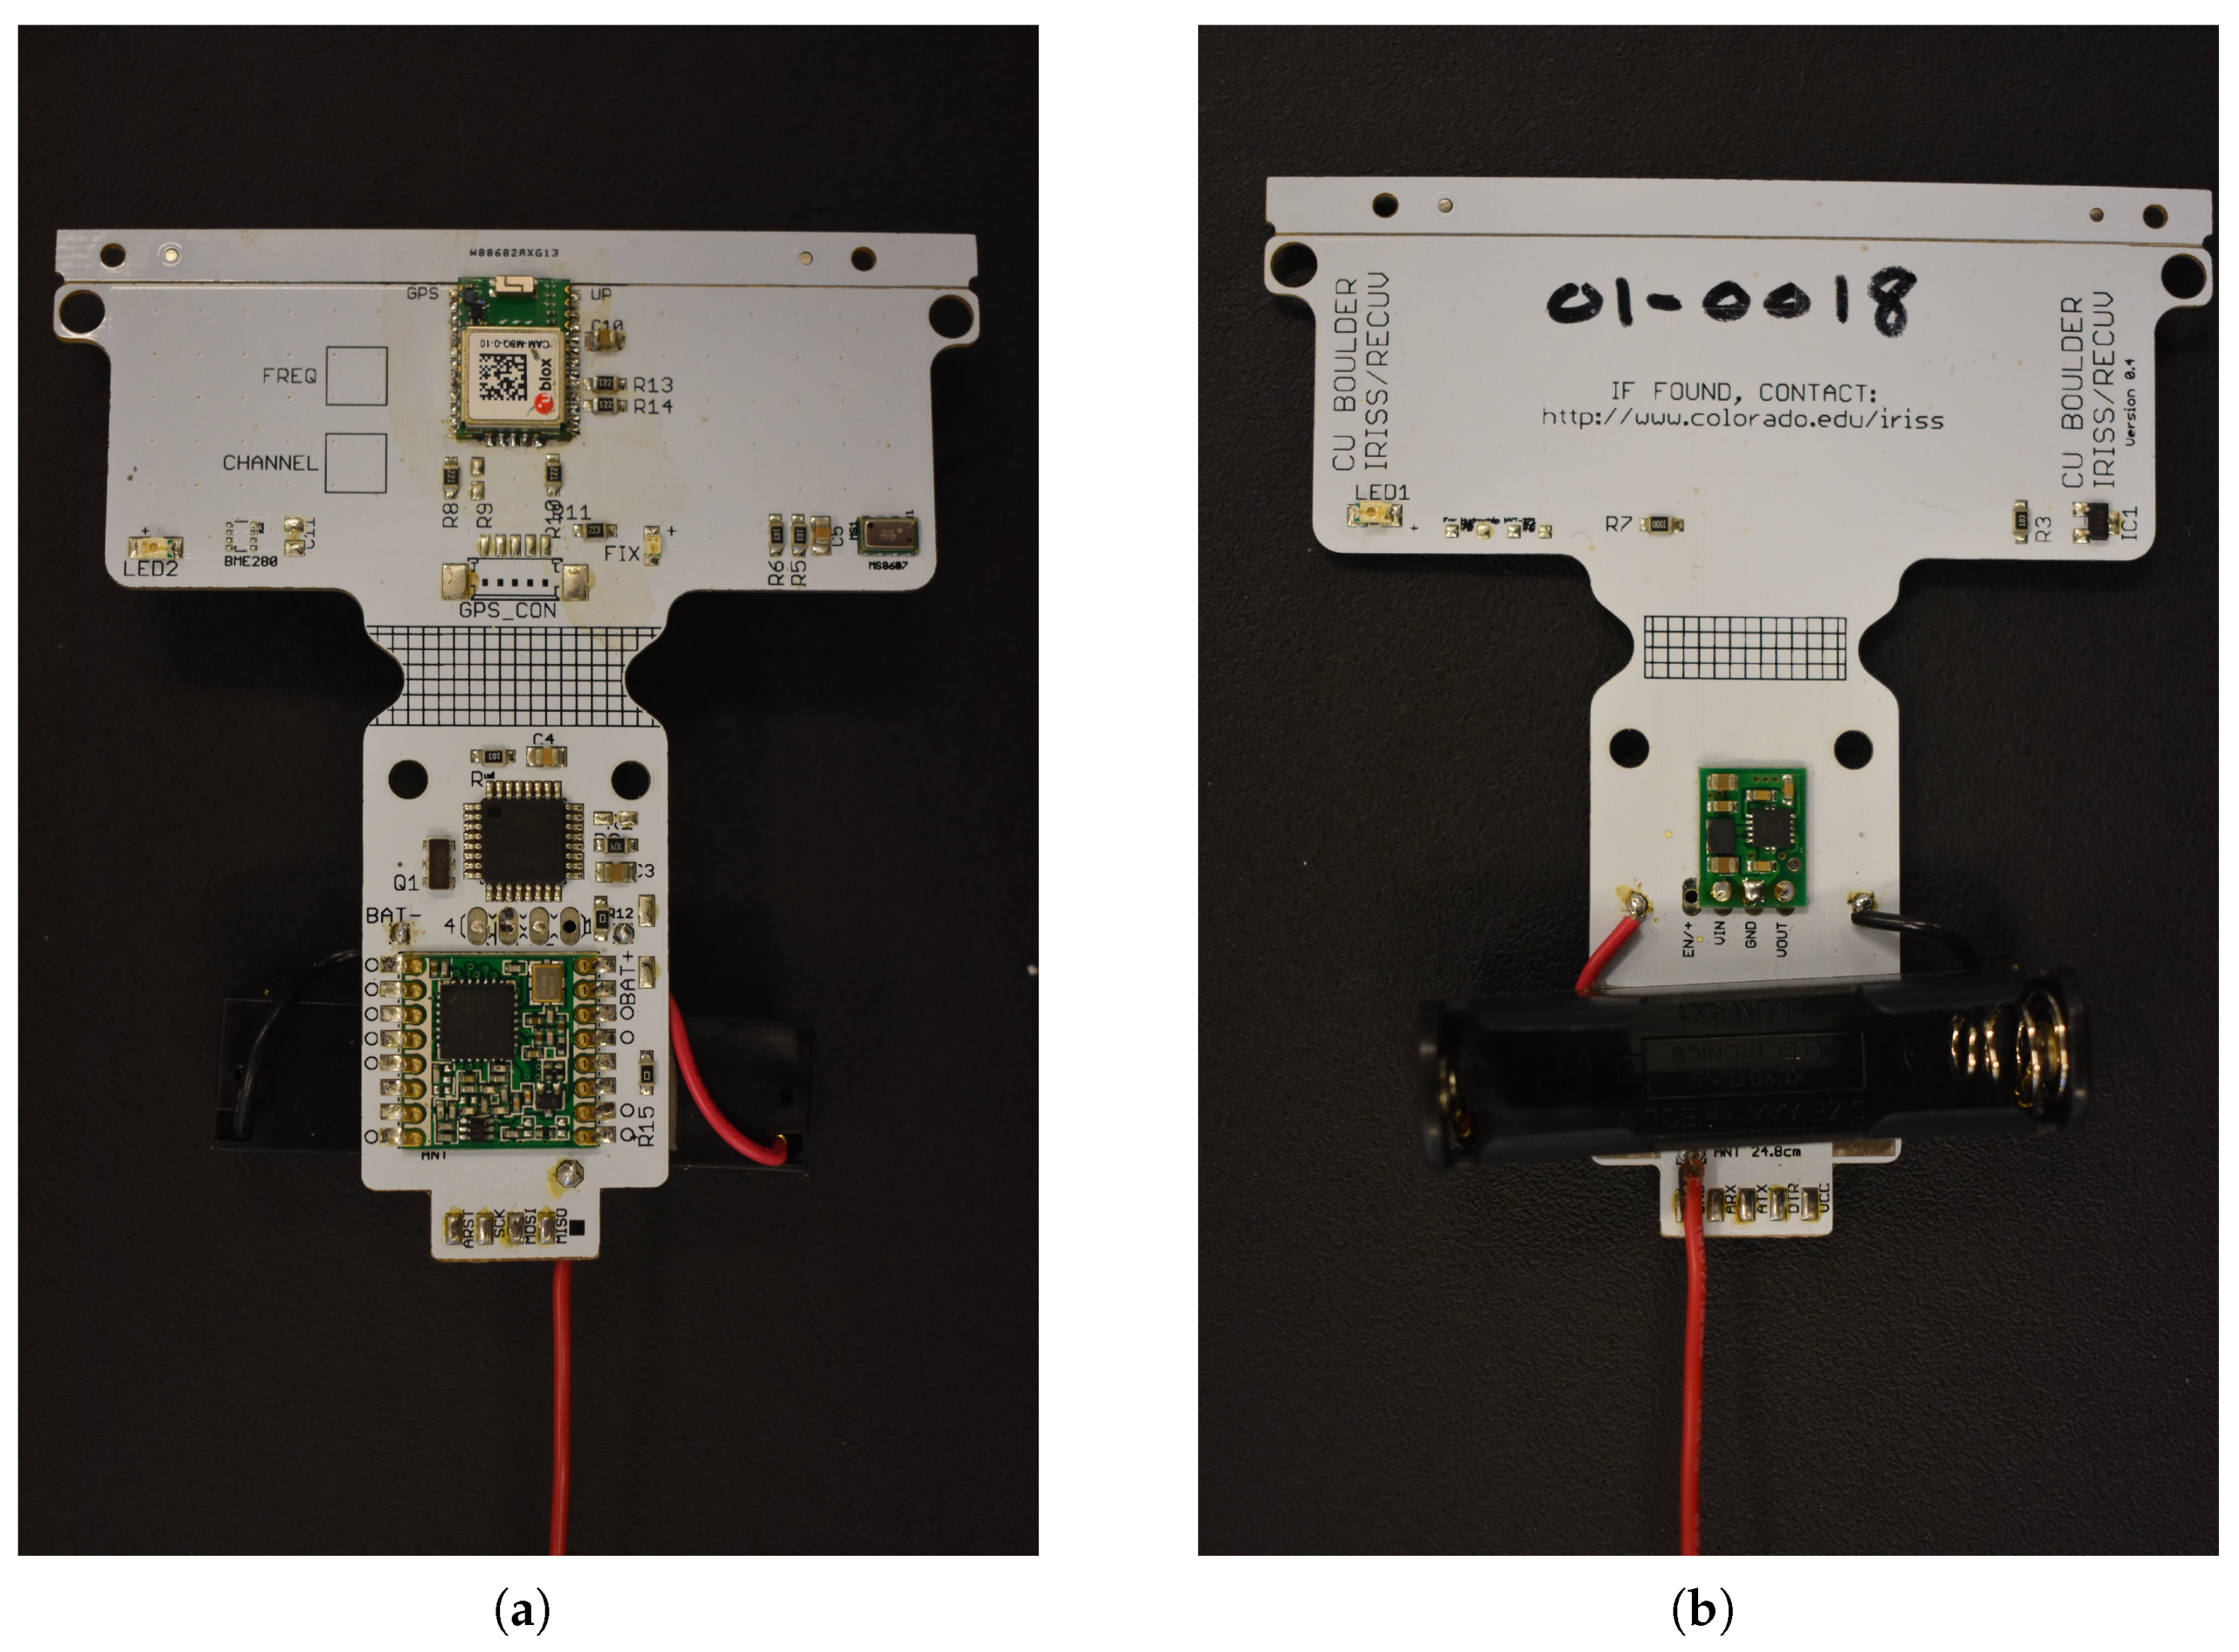
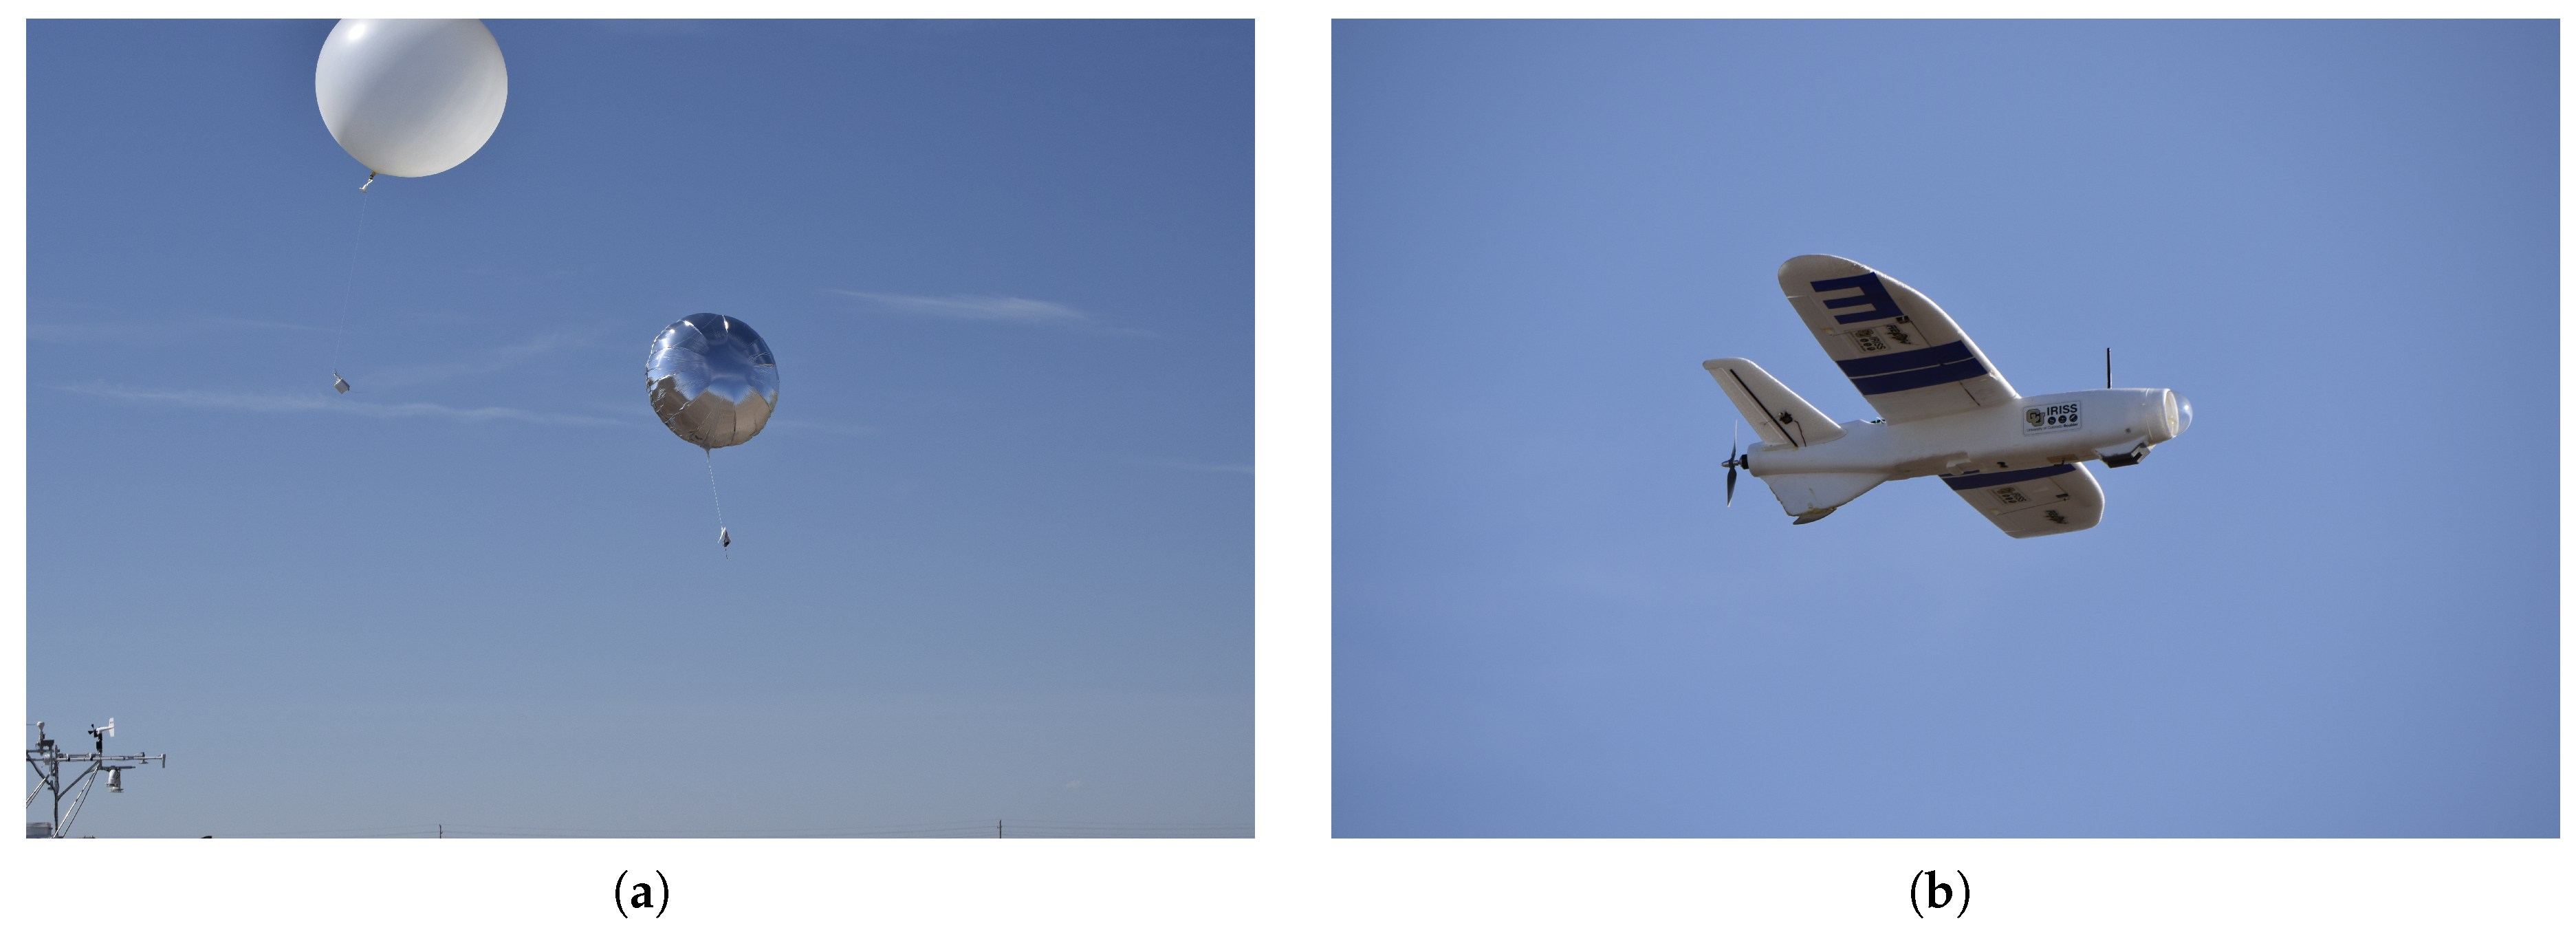
2.1. Drifter Setup
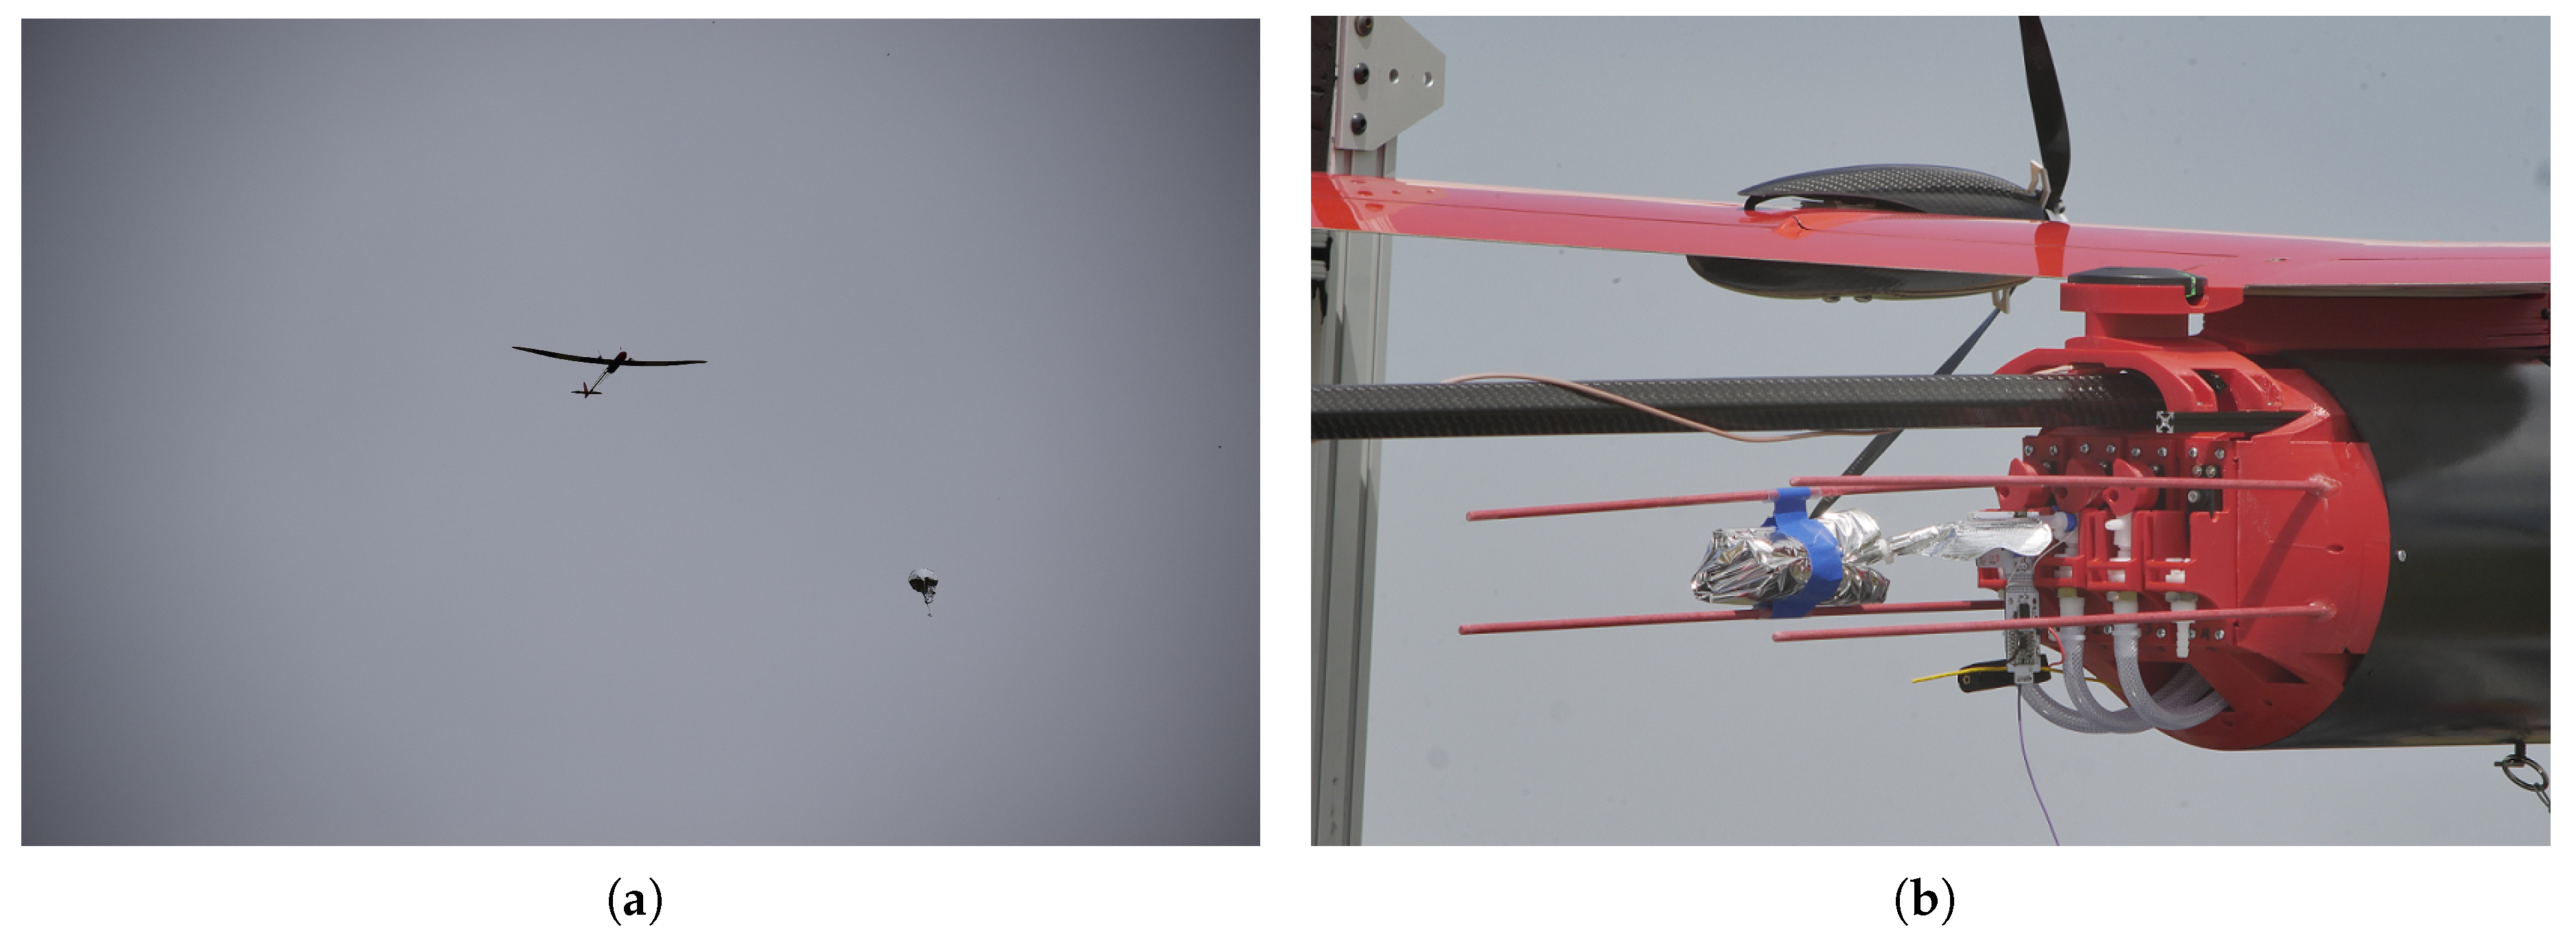
2.2. ALD Deployment
3. Results
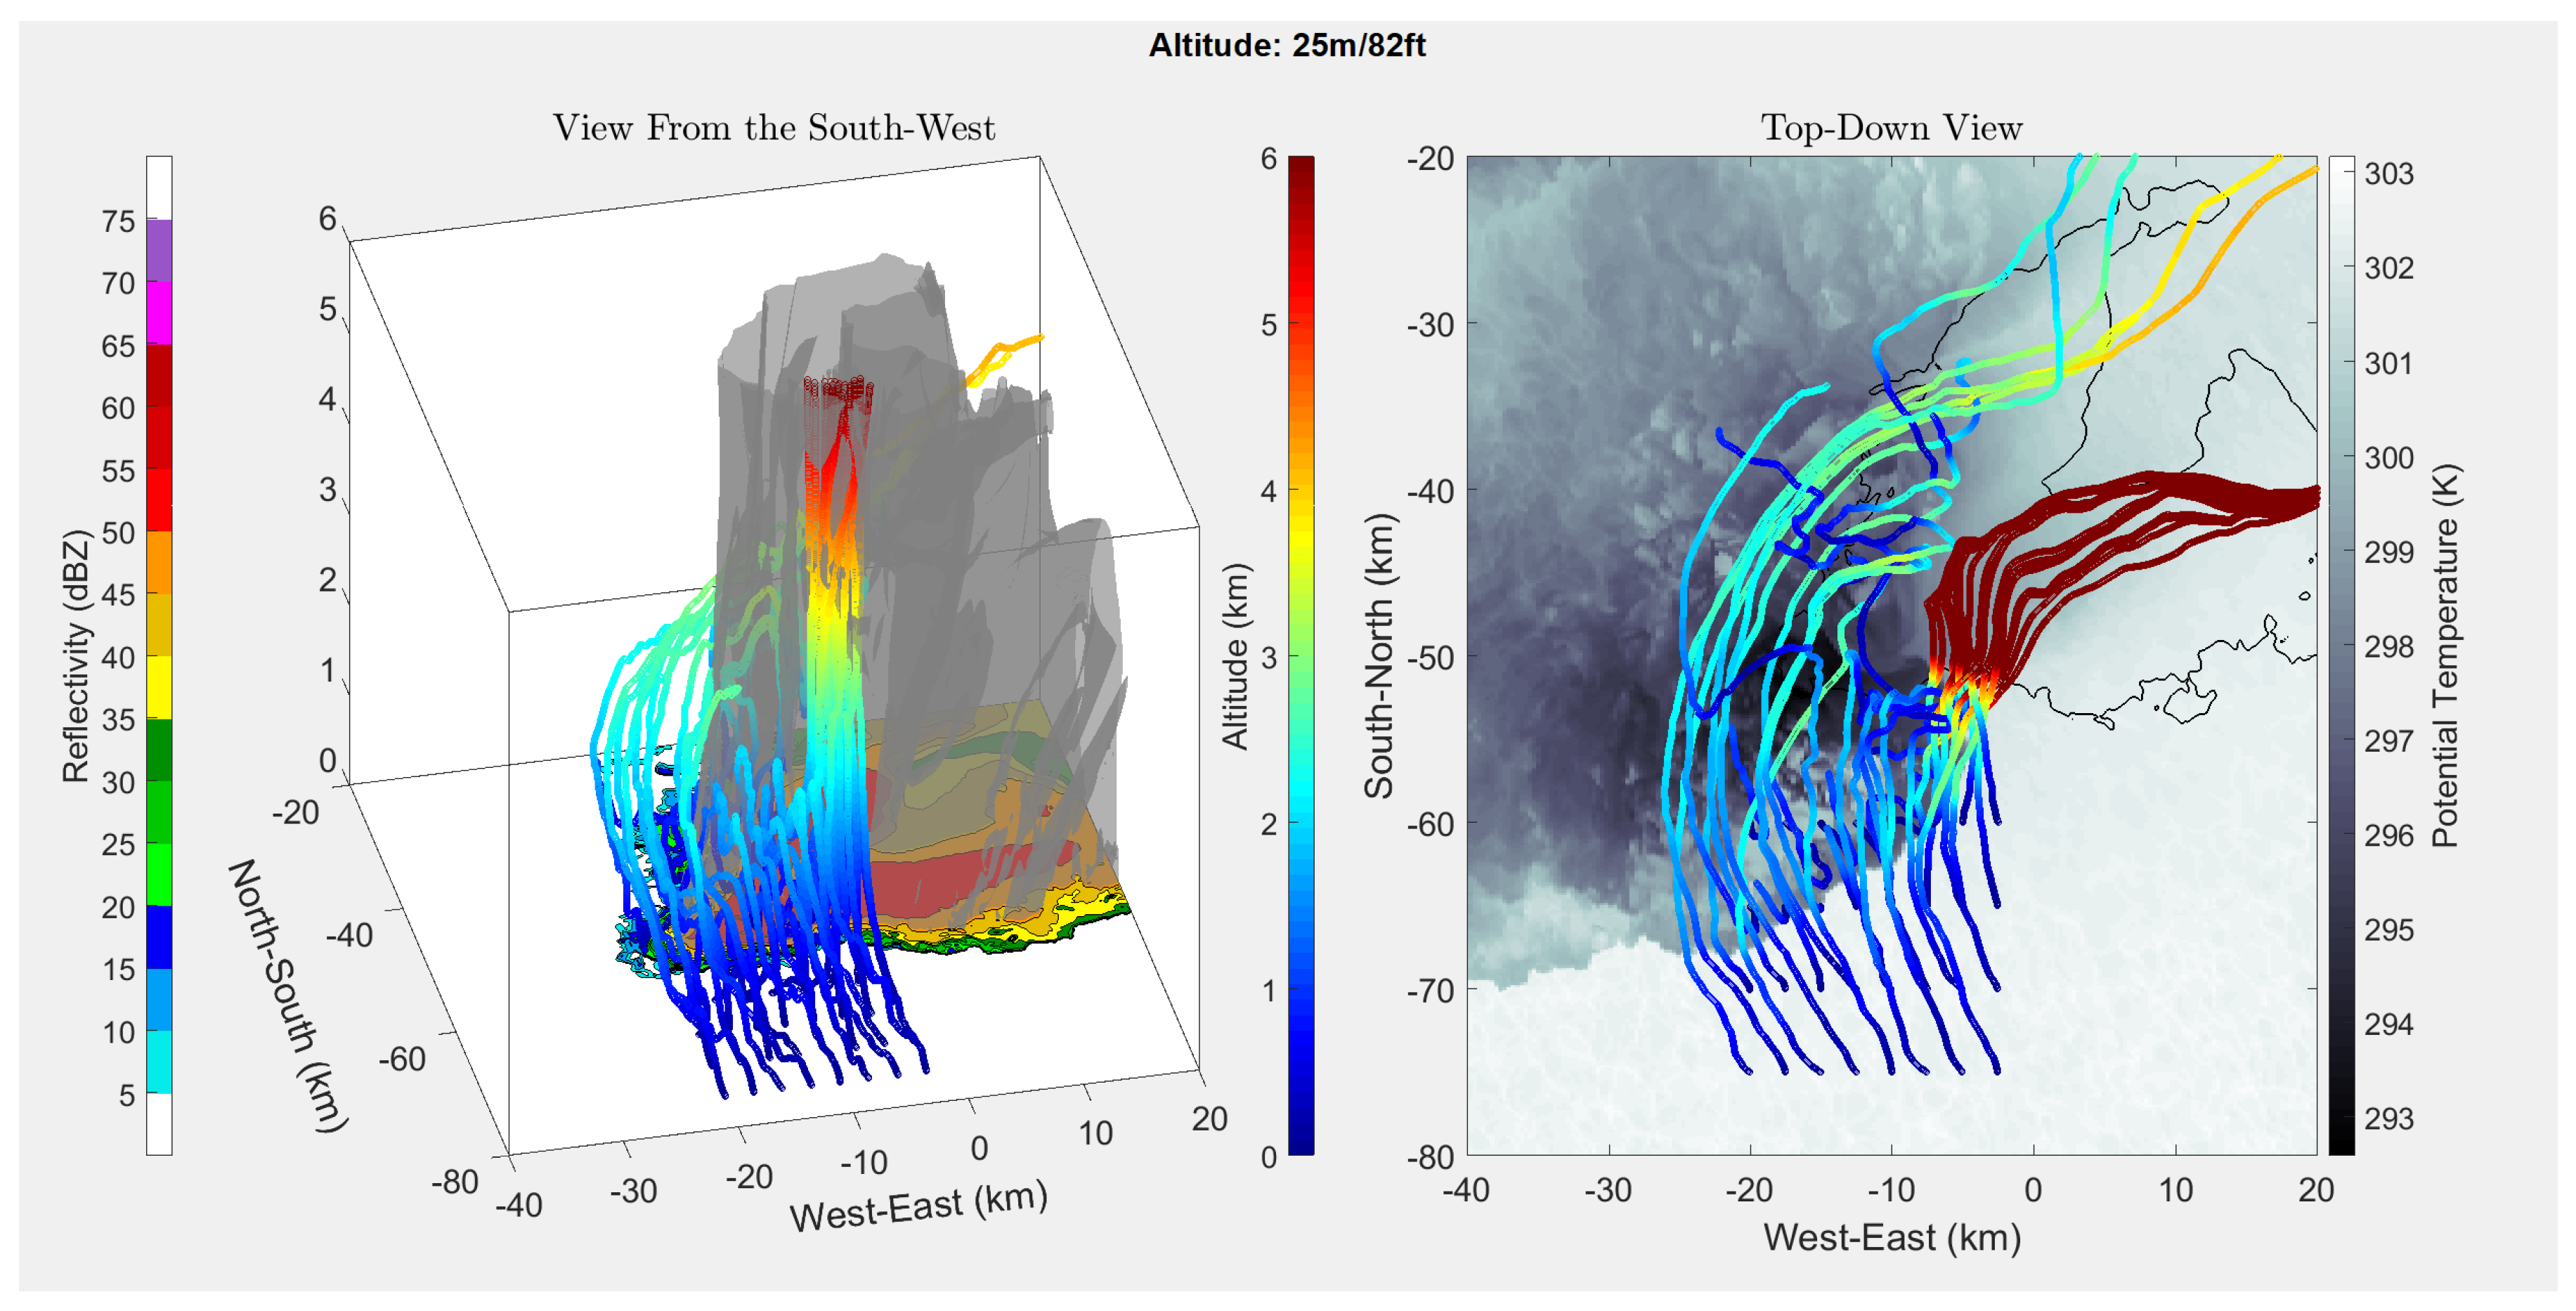
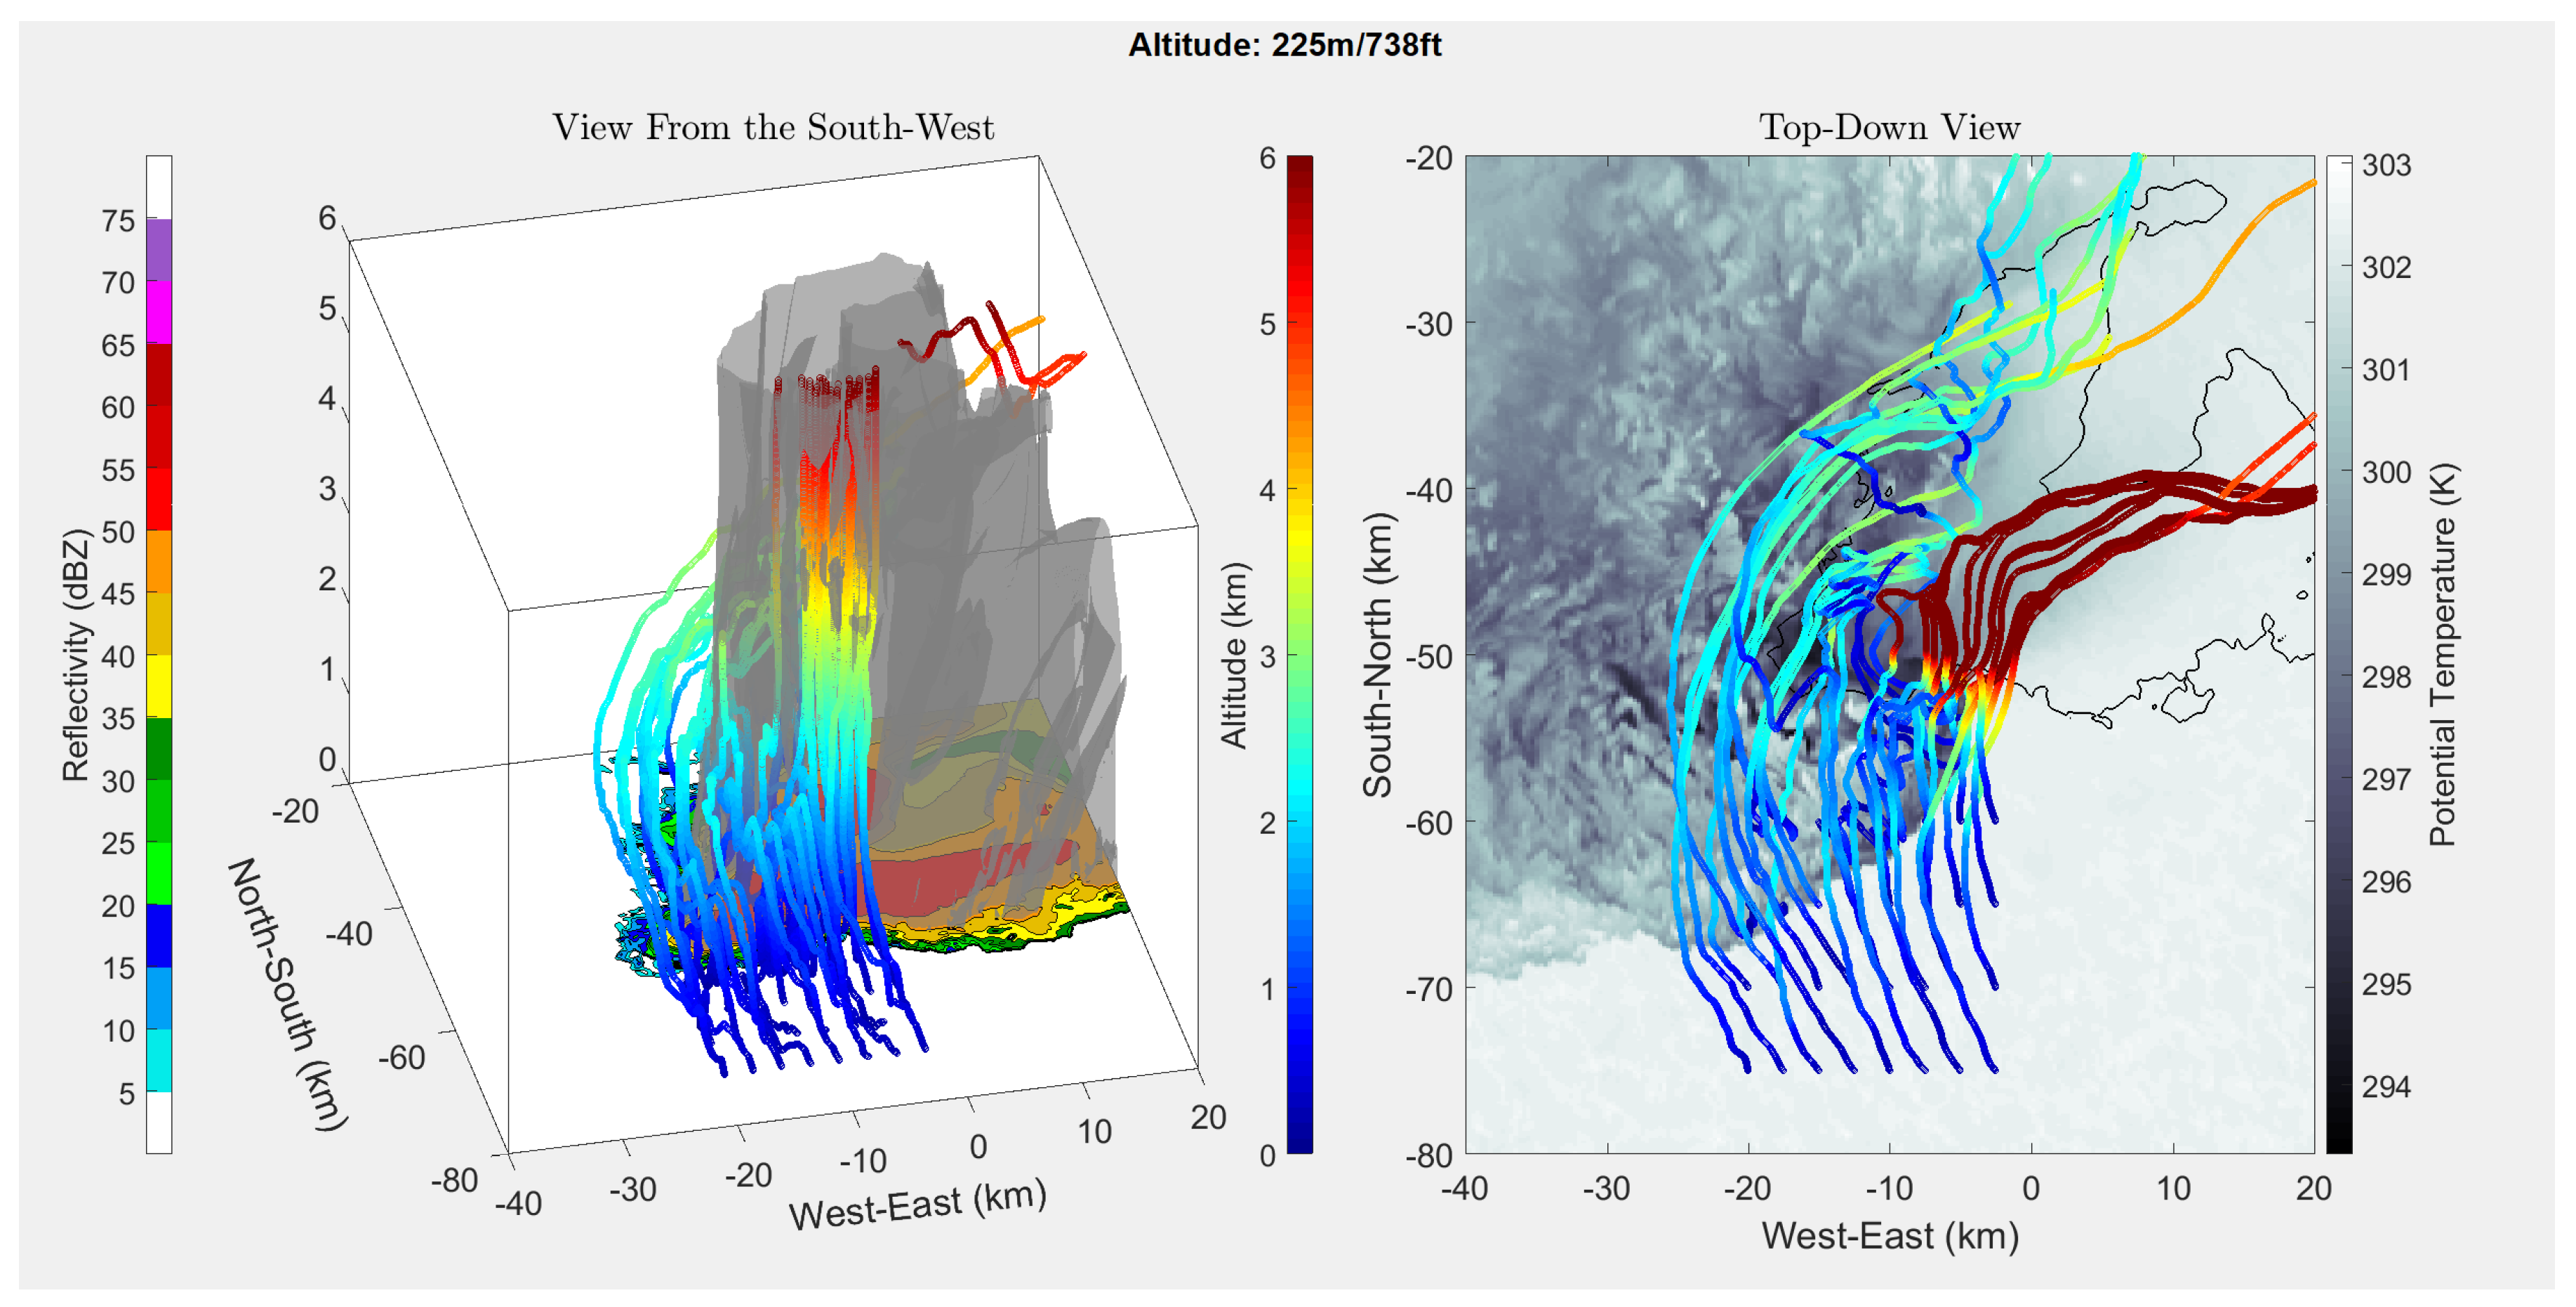
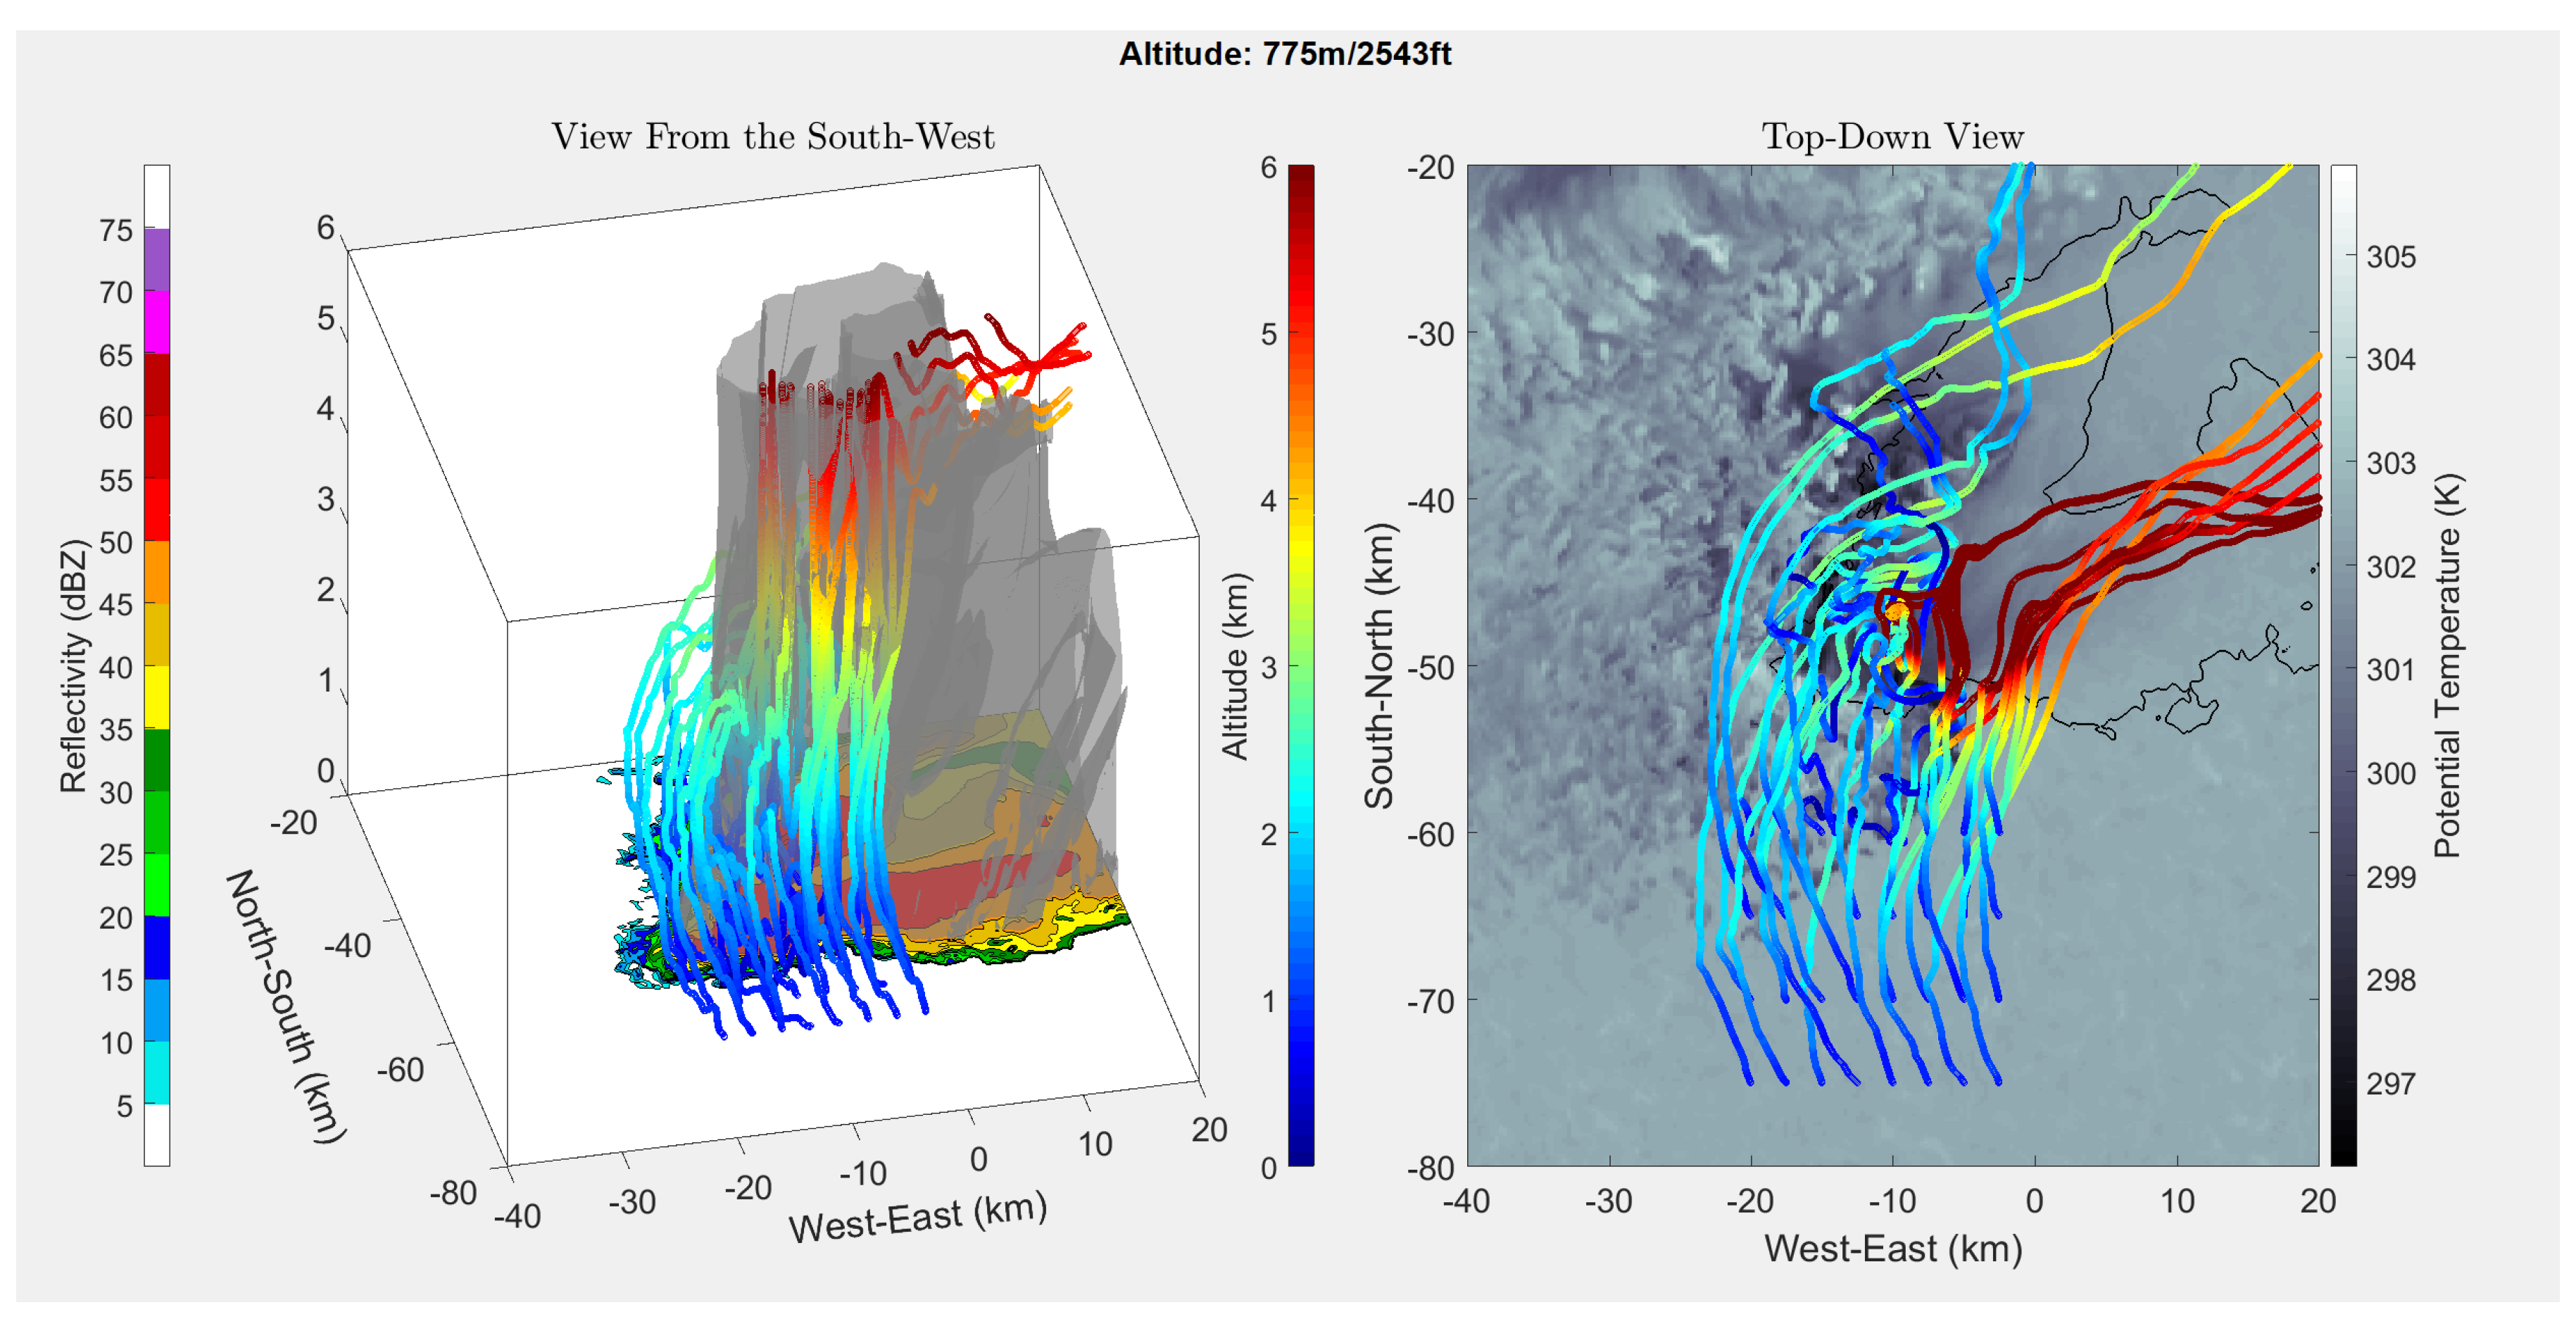
3.1. ALD Trajectory Simulations
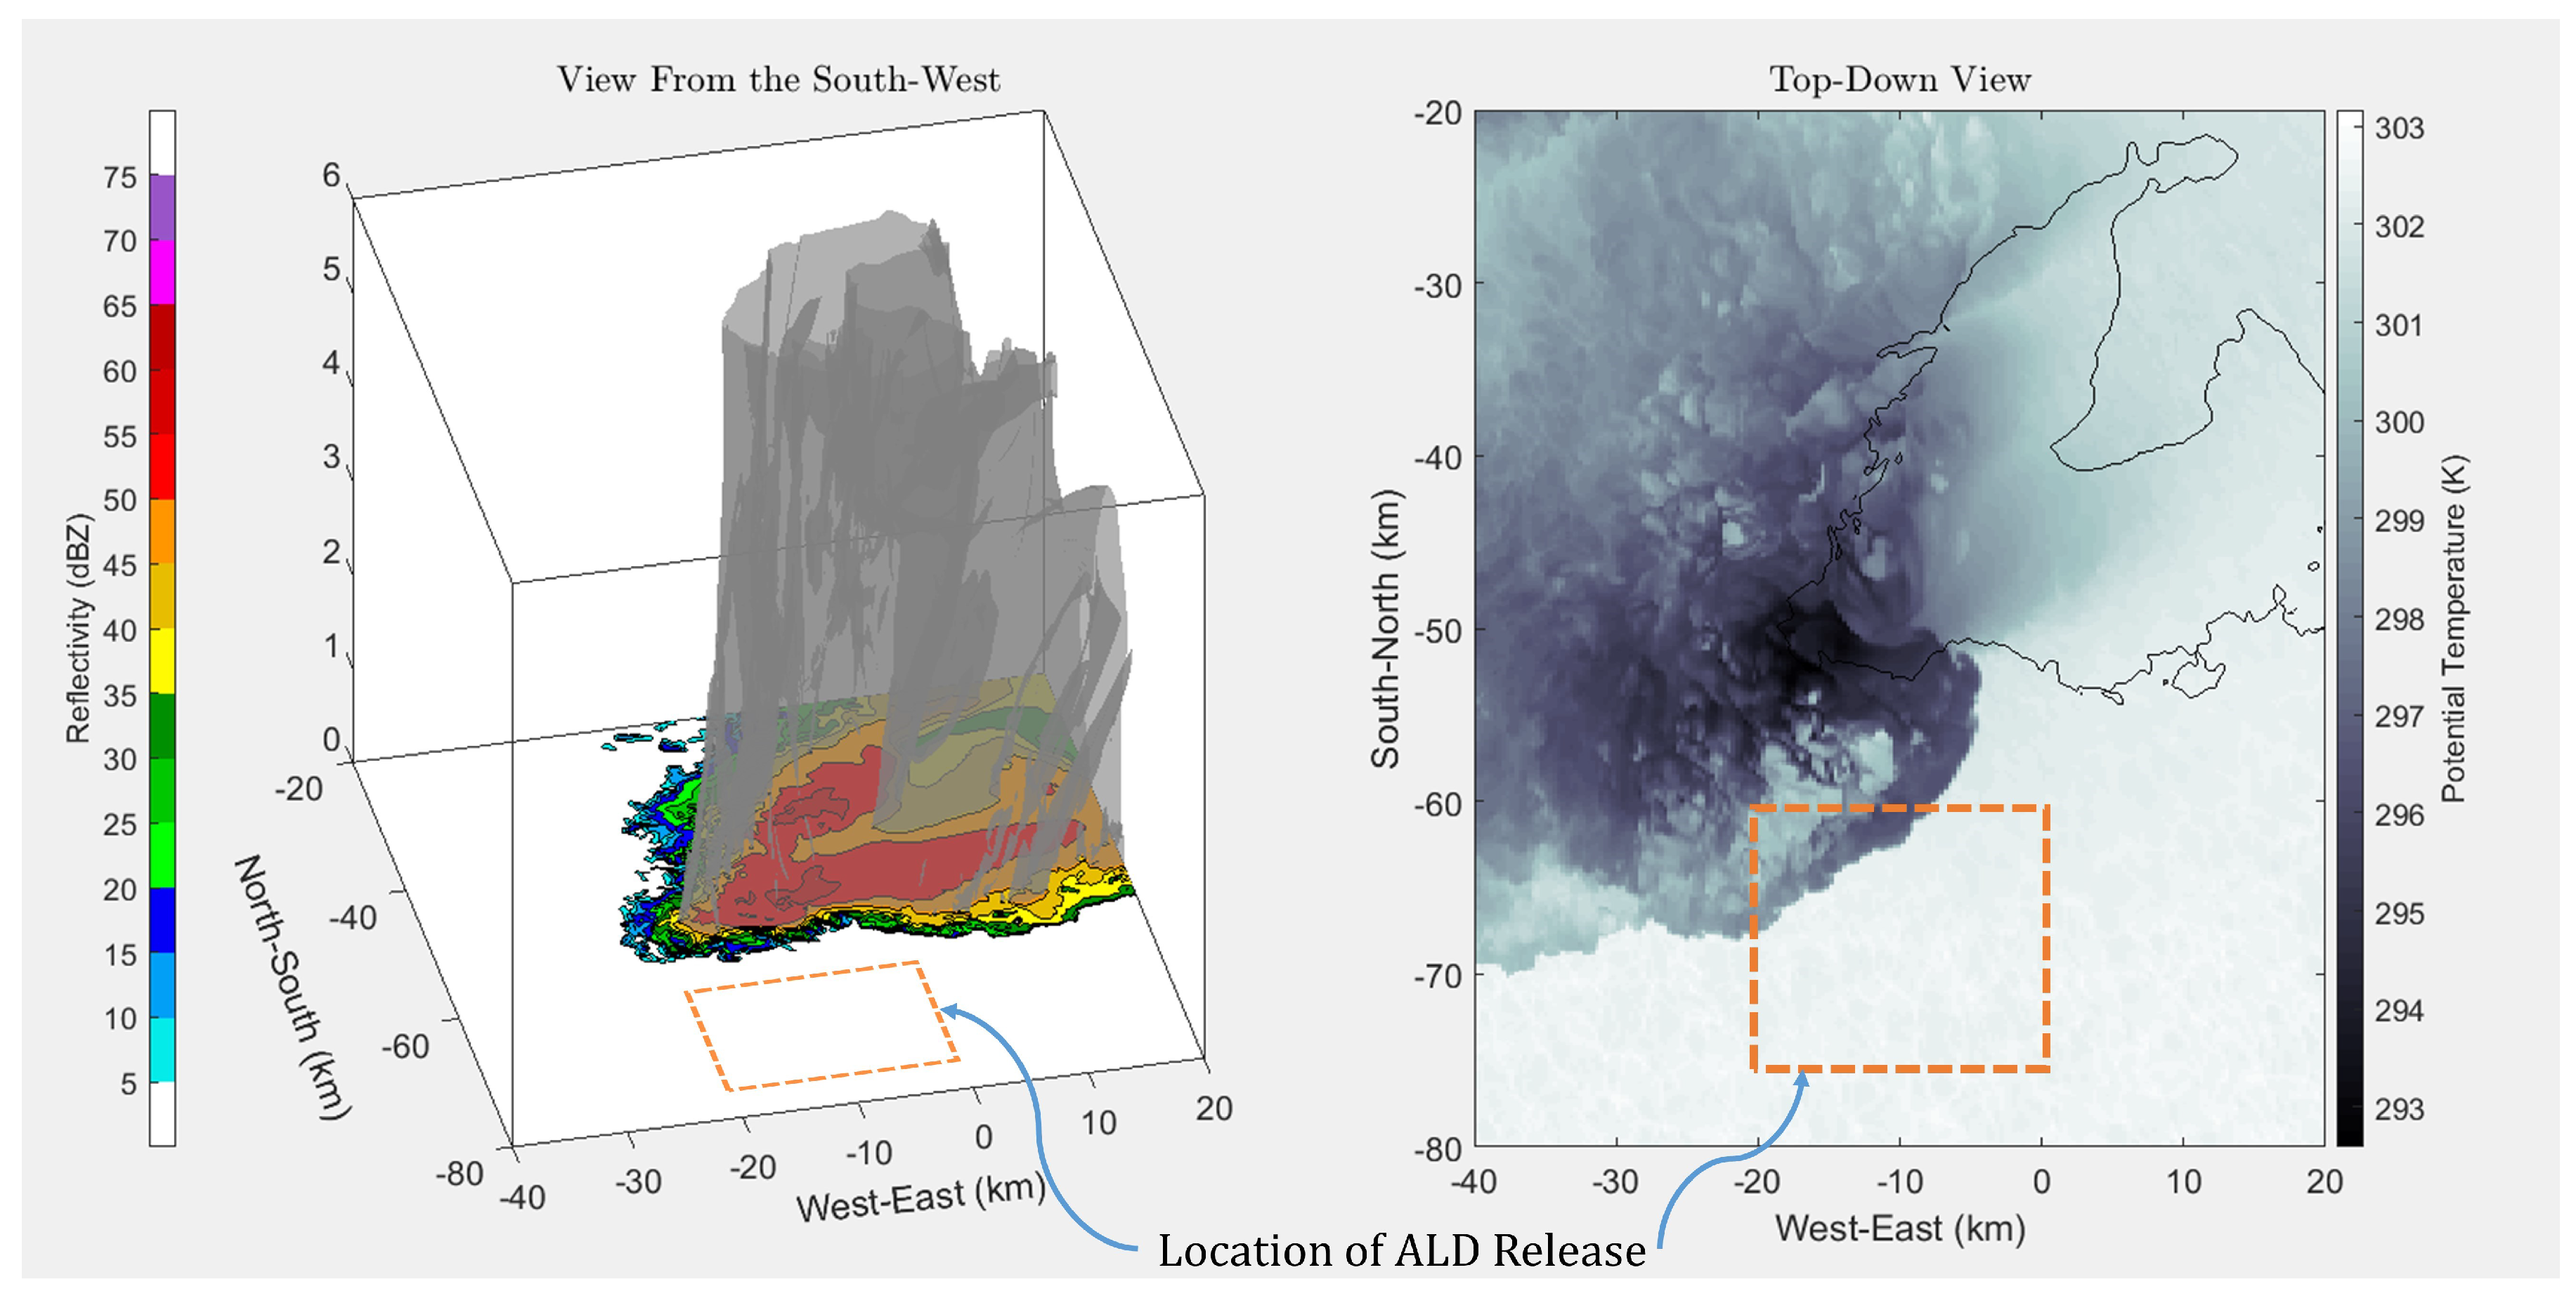
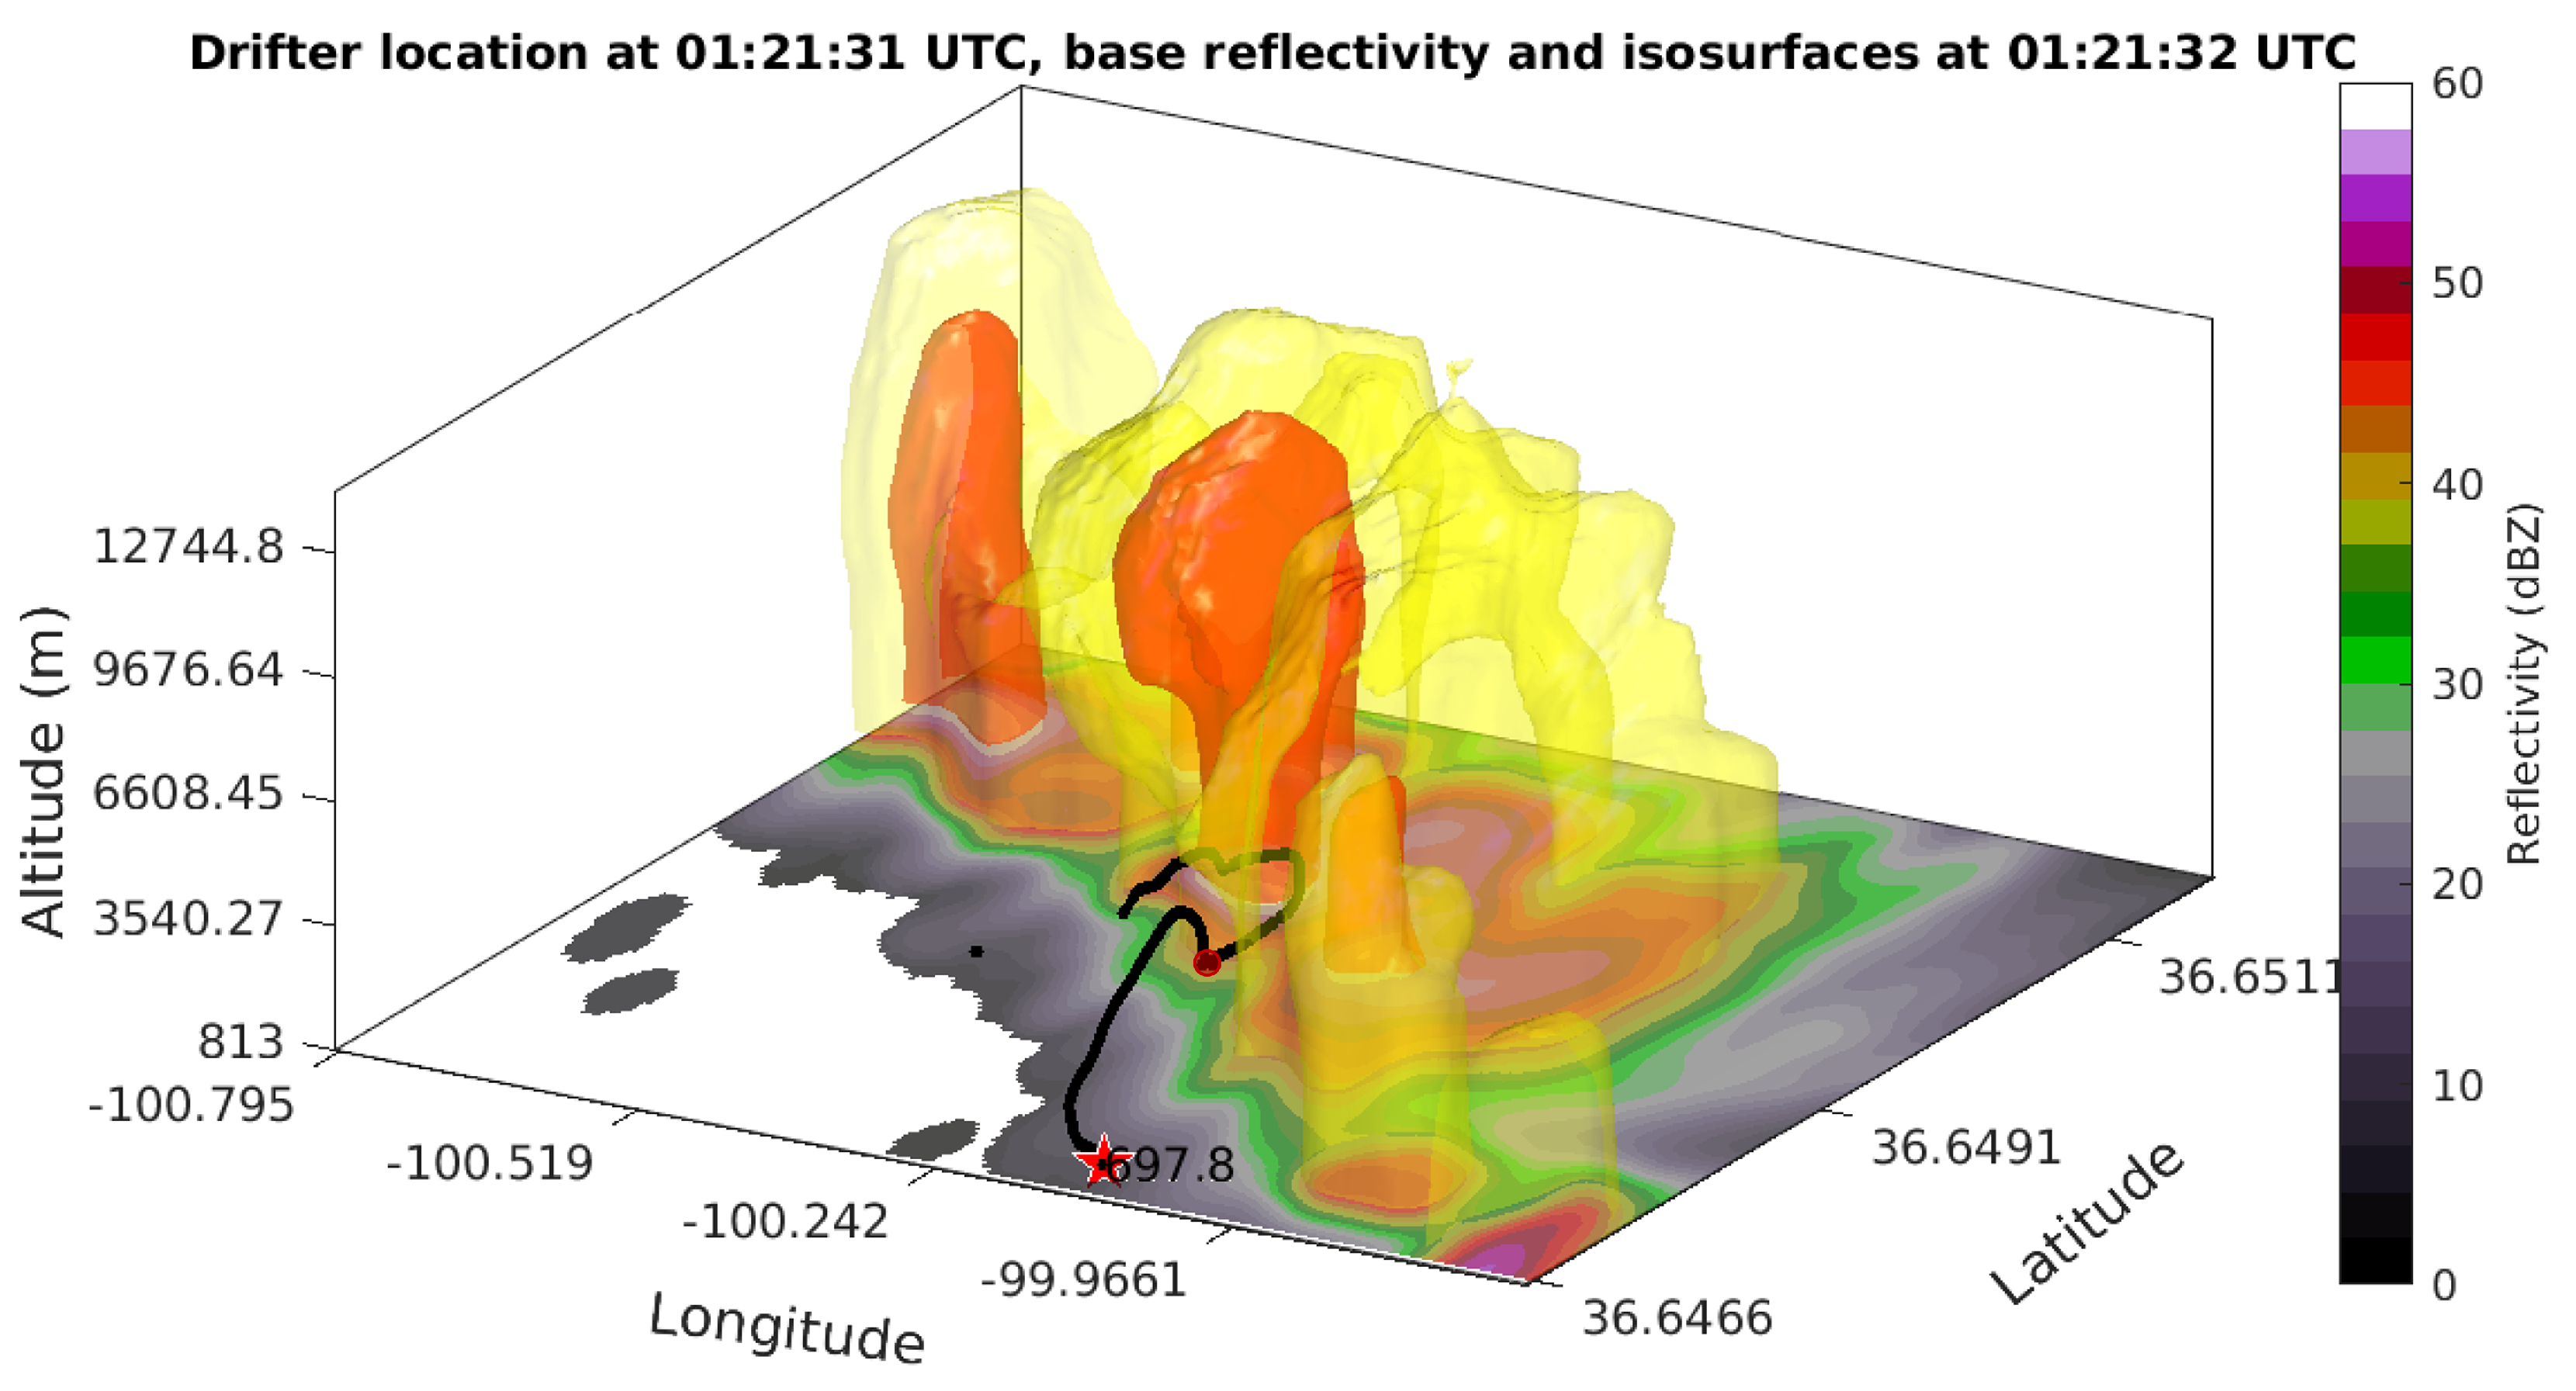
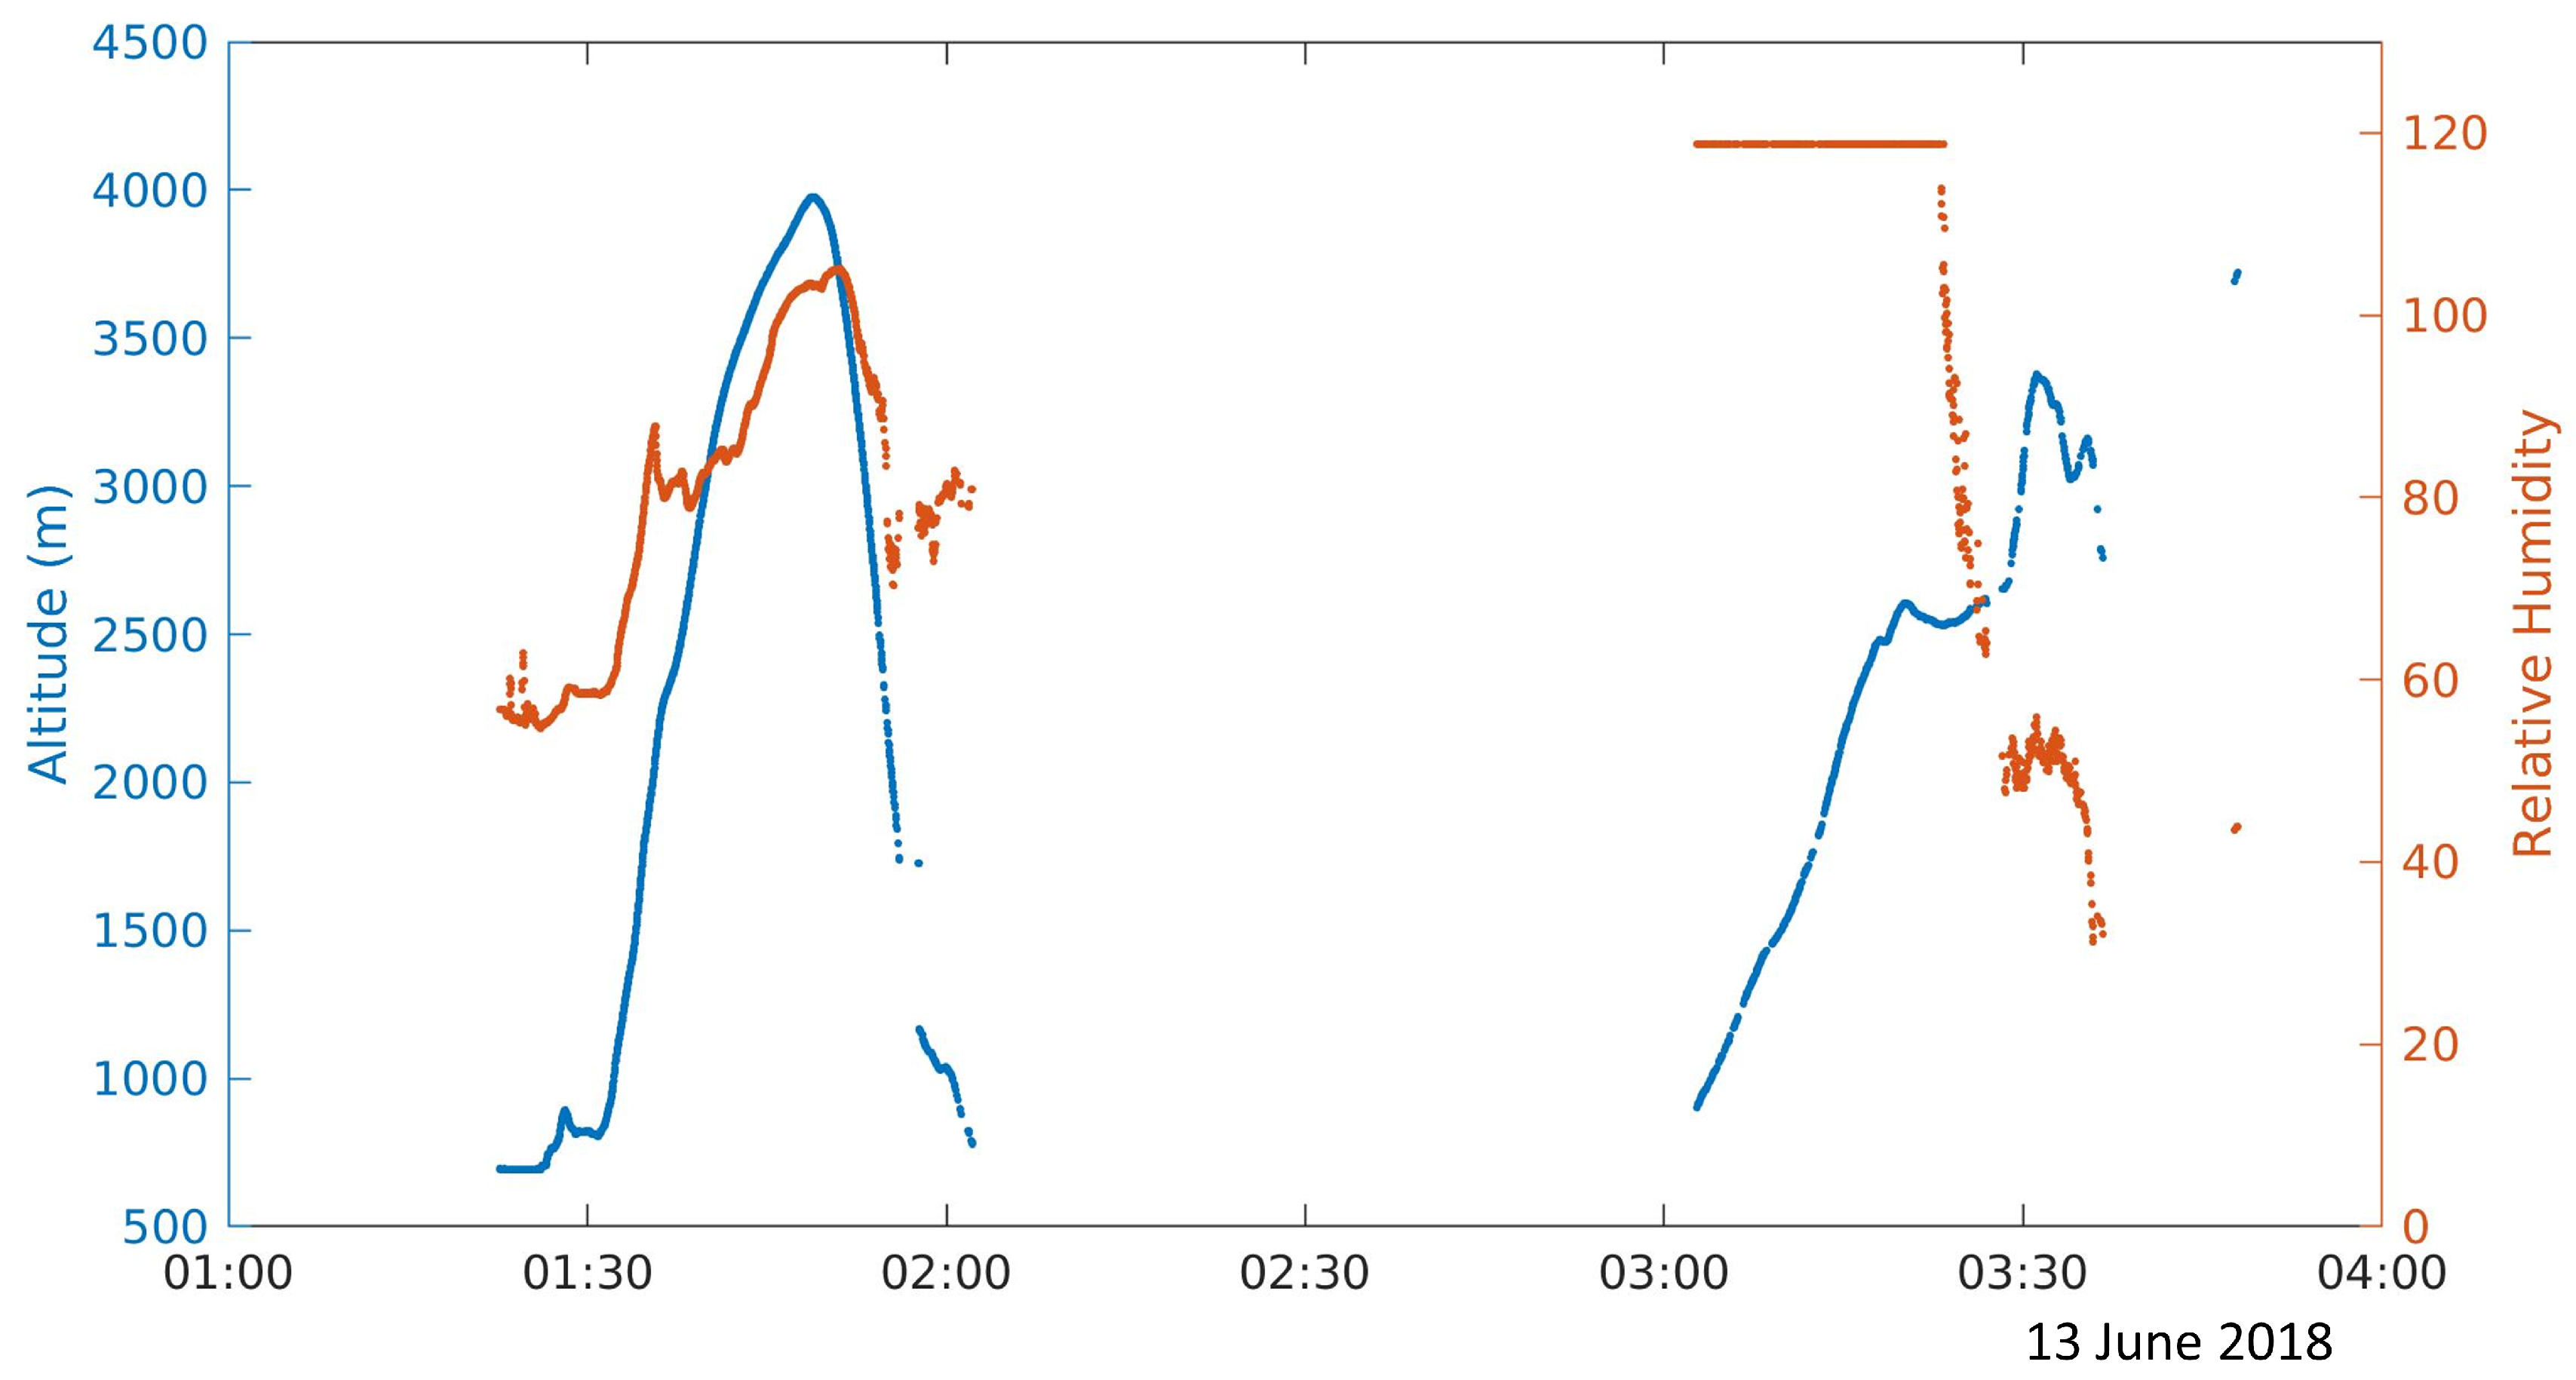
3.2. Initial Field Results
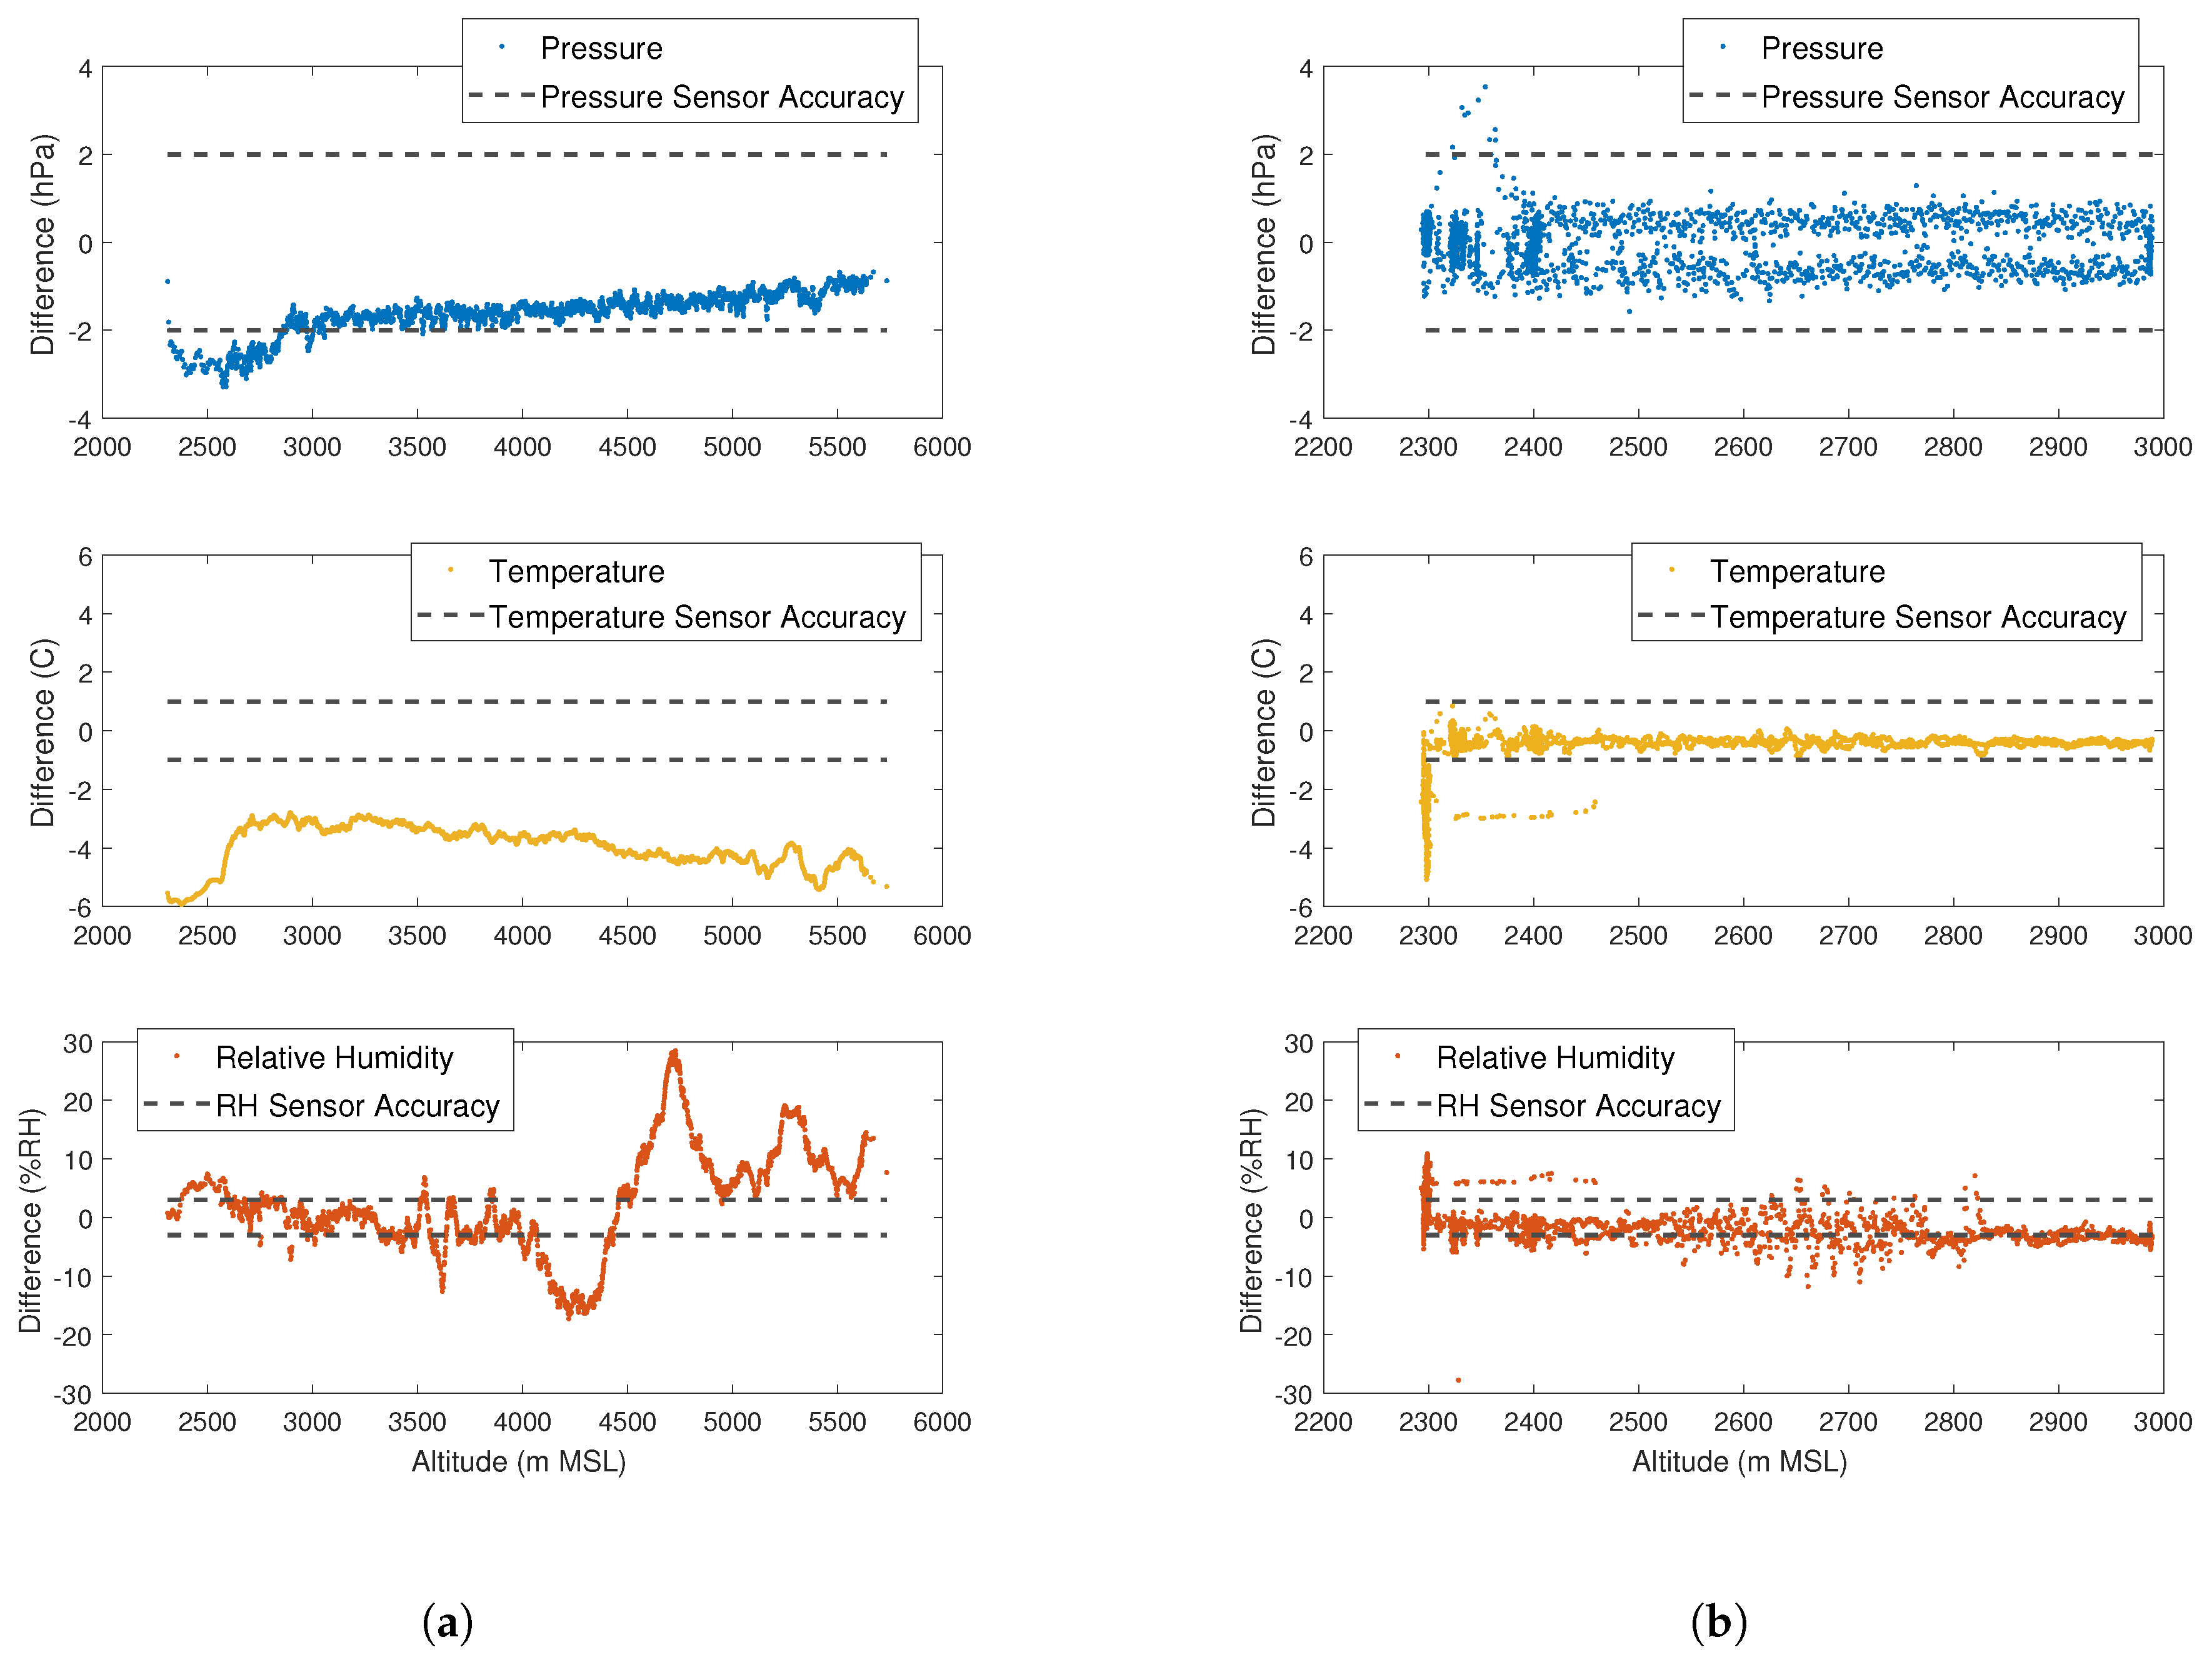
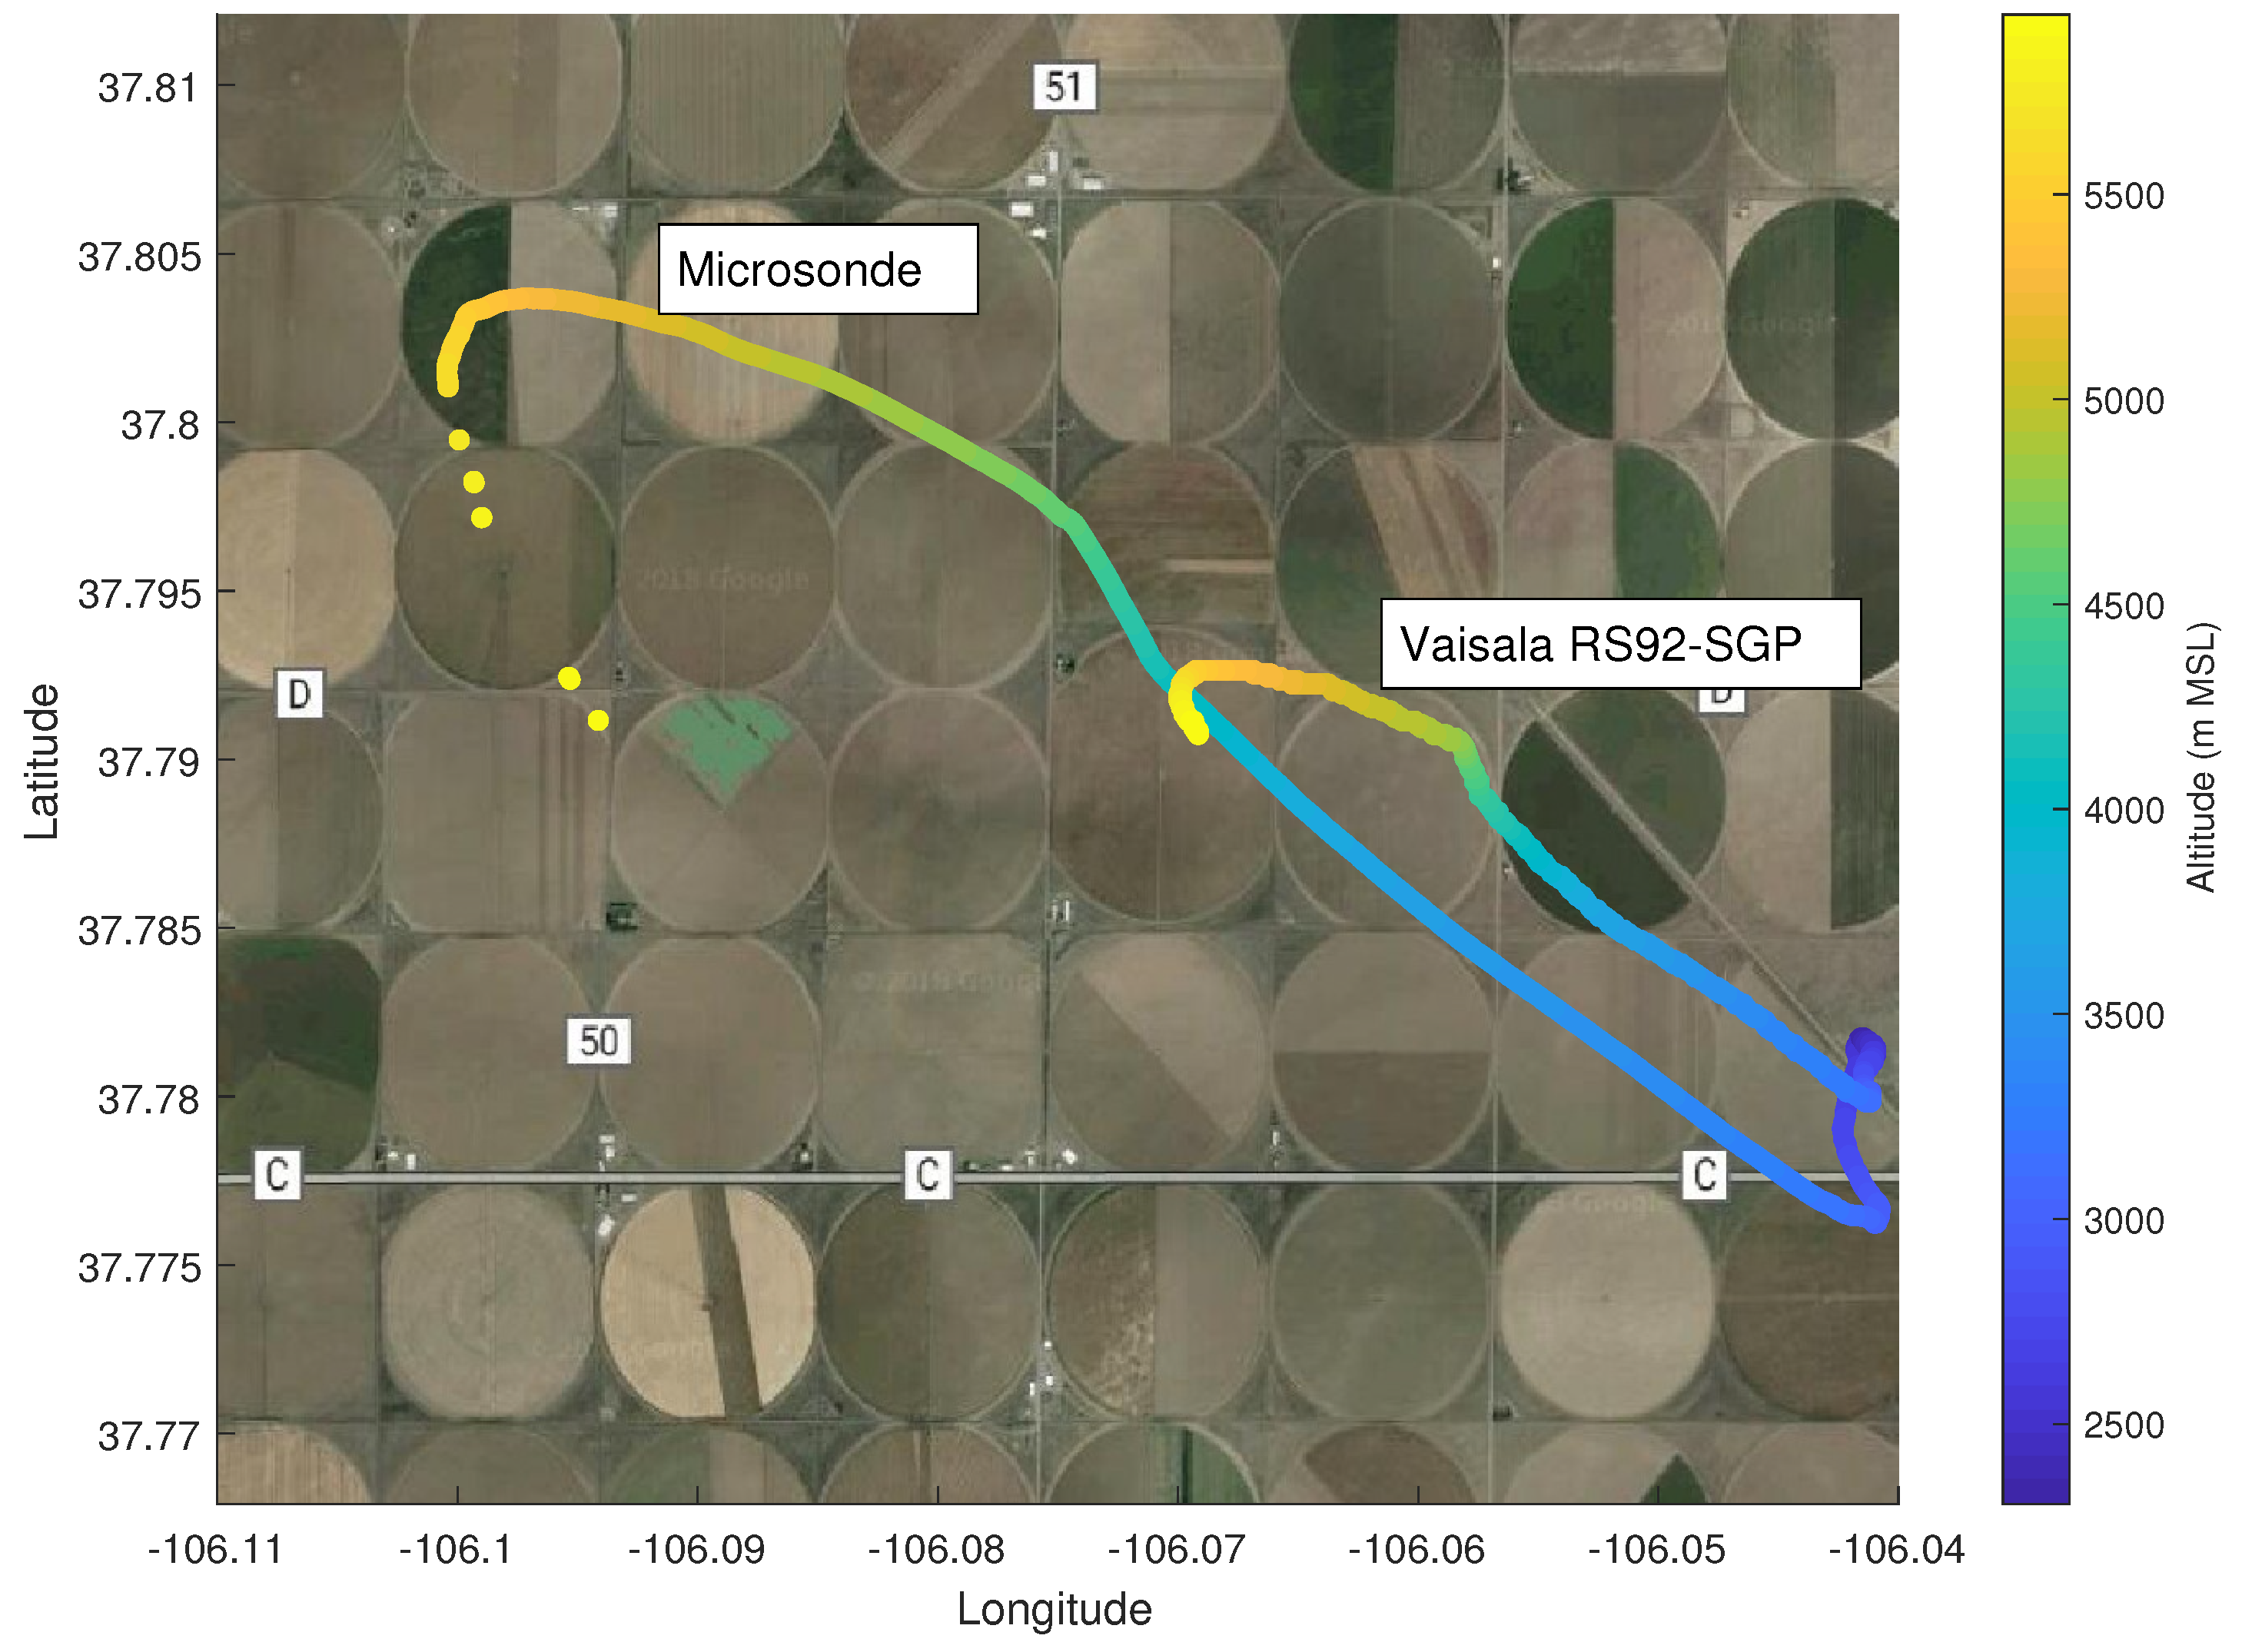
3.3. Microsonde Characterization Tests
4. Conclusions
Author Contributions
Funding
Acknowledgments
Conflicts of Interest
References
- Storm Prediction Center. Monthly and Annual U.S. Tornado Summaries; Storm Prediction Center: Norman, OK, USA, 2018. Available online: https://www.spc.noaa.gov/climo/online/monthly/newm.html (accessed on 2 March 2018).
- National Weather Service. Summary of Natural Hazard Statistics for 2017 in the United States; National Weather Service: Silver Spring, MD, USA, 2018. Available online: https://www.nws.noaa.gov/om/hazstats/sum17.pdf (accessed on 3 January 2019).
- Markowski, P.M. Hook Echoes and Rear-Flank Downdrafts: A Review. Mon. Weather Rev. 2002, 130, 852–876. [Google Scholar] [CrossRef]
- National Severe Storms Laboratory. Severe Weather 101-Tornado Basics. Available online: https://www.nssl.noaa.gov/education/svrwx101/tornadoes/ (accessed on 2 March 2019).
- Houston, A.L.; Argrow, B.; Elston, J.; Lahowetz, J.; Frew, E.W.; Kennedy, P.C. The Collaborative Colorado-Nebraska Unmanned Aircraft System Experiment. Bull. Am. Meteorol. Soc. 2012, 93, 39–54. [Google Scholar] [CrossRef]
- Waugh, S.M. The U-Tube: An Improved Aspirated Temperature System for Mobile Meteorological Observations, Especially in Severe Weather. Ph.D. Thesis, University of Oklahoma, Norman, OK, USA, 2012. [Google Scholar]
- Stratka, J.M.; Rasmussen, E.M.; Fredrickson, S.E. A Mobile Mesonet for Finescale Meteorological Observations. J. Atmos. Ocean. Technol. 1996, 13, 921–936. [Google Scholar] [CrossRef]
- Businger, S.; Chiswell, S.; Ulmer, W. Balloons as a Lagrangian Measurement Platform for Atmospheric Research. J. Geophys. Res. 1996, 101, 4363–4376. [Google Scholar] [CrossRef]
- Manobianco, J.; Dreher, J.; Adams, M.; Buza, M.; Evans, R.; Case, J. How Nanotechnology Can Revolutionize Meteorological Observing with Lagrangian Drifters. Bull. Am. Meteorol. Soc. 2008, 1105–1109. [Google Scholar] [CrossRef]
- Markowski, P.M.; Richardson, Y.P.; Richardson, S.J.; Peterson, A. Aboveground thermodynamic observations in convective storms from balloon borne probes acting as pseudo-lagrangian drifters. Bull. Am. Meteorol. Soc. 2018, 99, 711–724. [Google Scholar] [CrossRef]
- Lin, Y.L. Mesoscale Dynamics; Cambridge University Press: Cambridge, UK, 2007. [Google Scholar]
- Analog-Digitale Mikromechanische Sensorsysteme. MS8607 The Worldwide Smallest Weather Station. Mainz, Germany. Available online: https://www.amsys.info/sheets/amsys.en.ms8607.pdf (accessed on 5 October 2017).
- Microchip. ATmega48A/PA/88A/PA/168A/PA/328/P Data Sheet, 2018. Chandler, AZ, USA. Available online: http://ww1.microchip.com/downloads/en/DeviceDoc/ATmega328PB-Automotive-Data-Sheet-40001980B.pdf (accessed on 5 October 2017).
- u-blox. CAM-M8, 2016. Thalwil, Switzerland. Available online: https://www.u-blox.com/sites/default/files/CAM-M8-FW3_DataSheet_%28UBX-15031574%29.pdf (accessed on 5 October 2017).
- HopeRF Electronic. RFM95/96/97/98(W)—Low Power Long Range Transceiver Module. Guangdong, China. Available online: https://cdn.sparkfun.com/assets/learn_tutorials/8/0/4/RFM95_96_97_98W.pdf (accessed on 5 October 2017).
- Bryan, G.; Fritsch, J. A Benchmark Simulation for Moist Nonhydrostatic Numerical Models. Mon. Weather Rev. 2002, 130, 2917–2928. [Google Scholar] [CrossRef]
- Chow, C.Y. An Introduction to Computation Fluid Mechanics; Seminole Publishing Company: Boulder, CO, USA, 1983. [Google Scholar]
- Hölzer, A.; Sommerfeld, M. New simple correlation formula for the drag coefficient of non-spherical particles. Powder Technol. 2008, 184, 361–365. [Google Scholar] [CrossRef]
- O’Donnell, B.J.; Helenbrook, B. Drag on ellipsoids at finite Reynolds numbers. Atom. Sprays 2005, 15, 363–376. [Google Scholar] [CrossRef]
- Greene, B.R.; Segales, A.R.; Waugh, S.; Duthoit, S.; Chilson, P.B. Considerations for Temperature Sensor Placement on Rotary-Wing Unmanned Aircraft Systems. Atmos. Meas. Technol. 2018, 11, 5519–5530. [Google Scholar] [CrossRef]


| Max. Operating Range | Accuracy | Resolution | |
|---|---|---|---|
| Pressure | 10–2000 mbar | ±2 mbar | 0.016 mbar |
| Temperature | −40–80 C | ±1 C | 0.01 C |
| Relative Humidity | 0–100% | ±3% | 0.01% |
| Horizontal Position Accuracy | Maximum Navigation Update Rate | Sensitivity |
|---|---|---|
| 2.5 m | 10 Hz | −166 dBm |
| Component | Mass |
|---|---|
| Microsonde | 17.0 g |
| Mylar Balloon | 48.0 g |
| Connectors | 0.6 g |
| Total: | 65.6 g |
© 2019 by the authors. Licensee MDPI, Basel, Switzerland. This article is an open access article distributed under the terms and conditions of the Creative Commons Attribution (CC BY) license (http://creativecommons.org/licenses/by/4.0/).
Share and Cite
Swenson, S.; Argrow, B.; Frew, E.; Borenstein, S.; Keeler, J. Development and Deployment of Air-Launched Drifters from Small UAS. Sensors 2019, 19, 2149. https://doi.org/10.3390/s19092149
Swenson S, Argrow B, Frew E, Borenstein S, Keeler J. Development and Deployment of Air-Launched Drifters from Small UAS. Sensors. 2019; 19(9):2149. https://doi.org/10.3390/s19092149
Chicago/Turabian StyleSwenson, Sara, Brian Argrow, Eric Frew, Steve Borenstein, and Jason Keeler. 2019. "Development and Deployment of Air-Launched Drifters from Small UAS" Sensors 19, no. 9: 2149. https://doi.org/10.3390/s19092149
APA StyleSwenson, S., Argrow, B., Frew, E., Borenstein, S., & Keeler, J. (2019). Development and Deployment of Air-Launched Drifters from Small UAS. Sensors, 19(9), 2149. https://doi.org/10.3390/s19092149