Investigation on Mass Sensitivity of N-M Type Electrode Quartz Crystal Microbalance


Abstract
:
1. Introduction
2. Theory
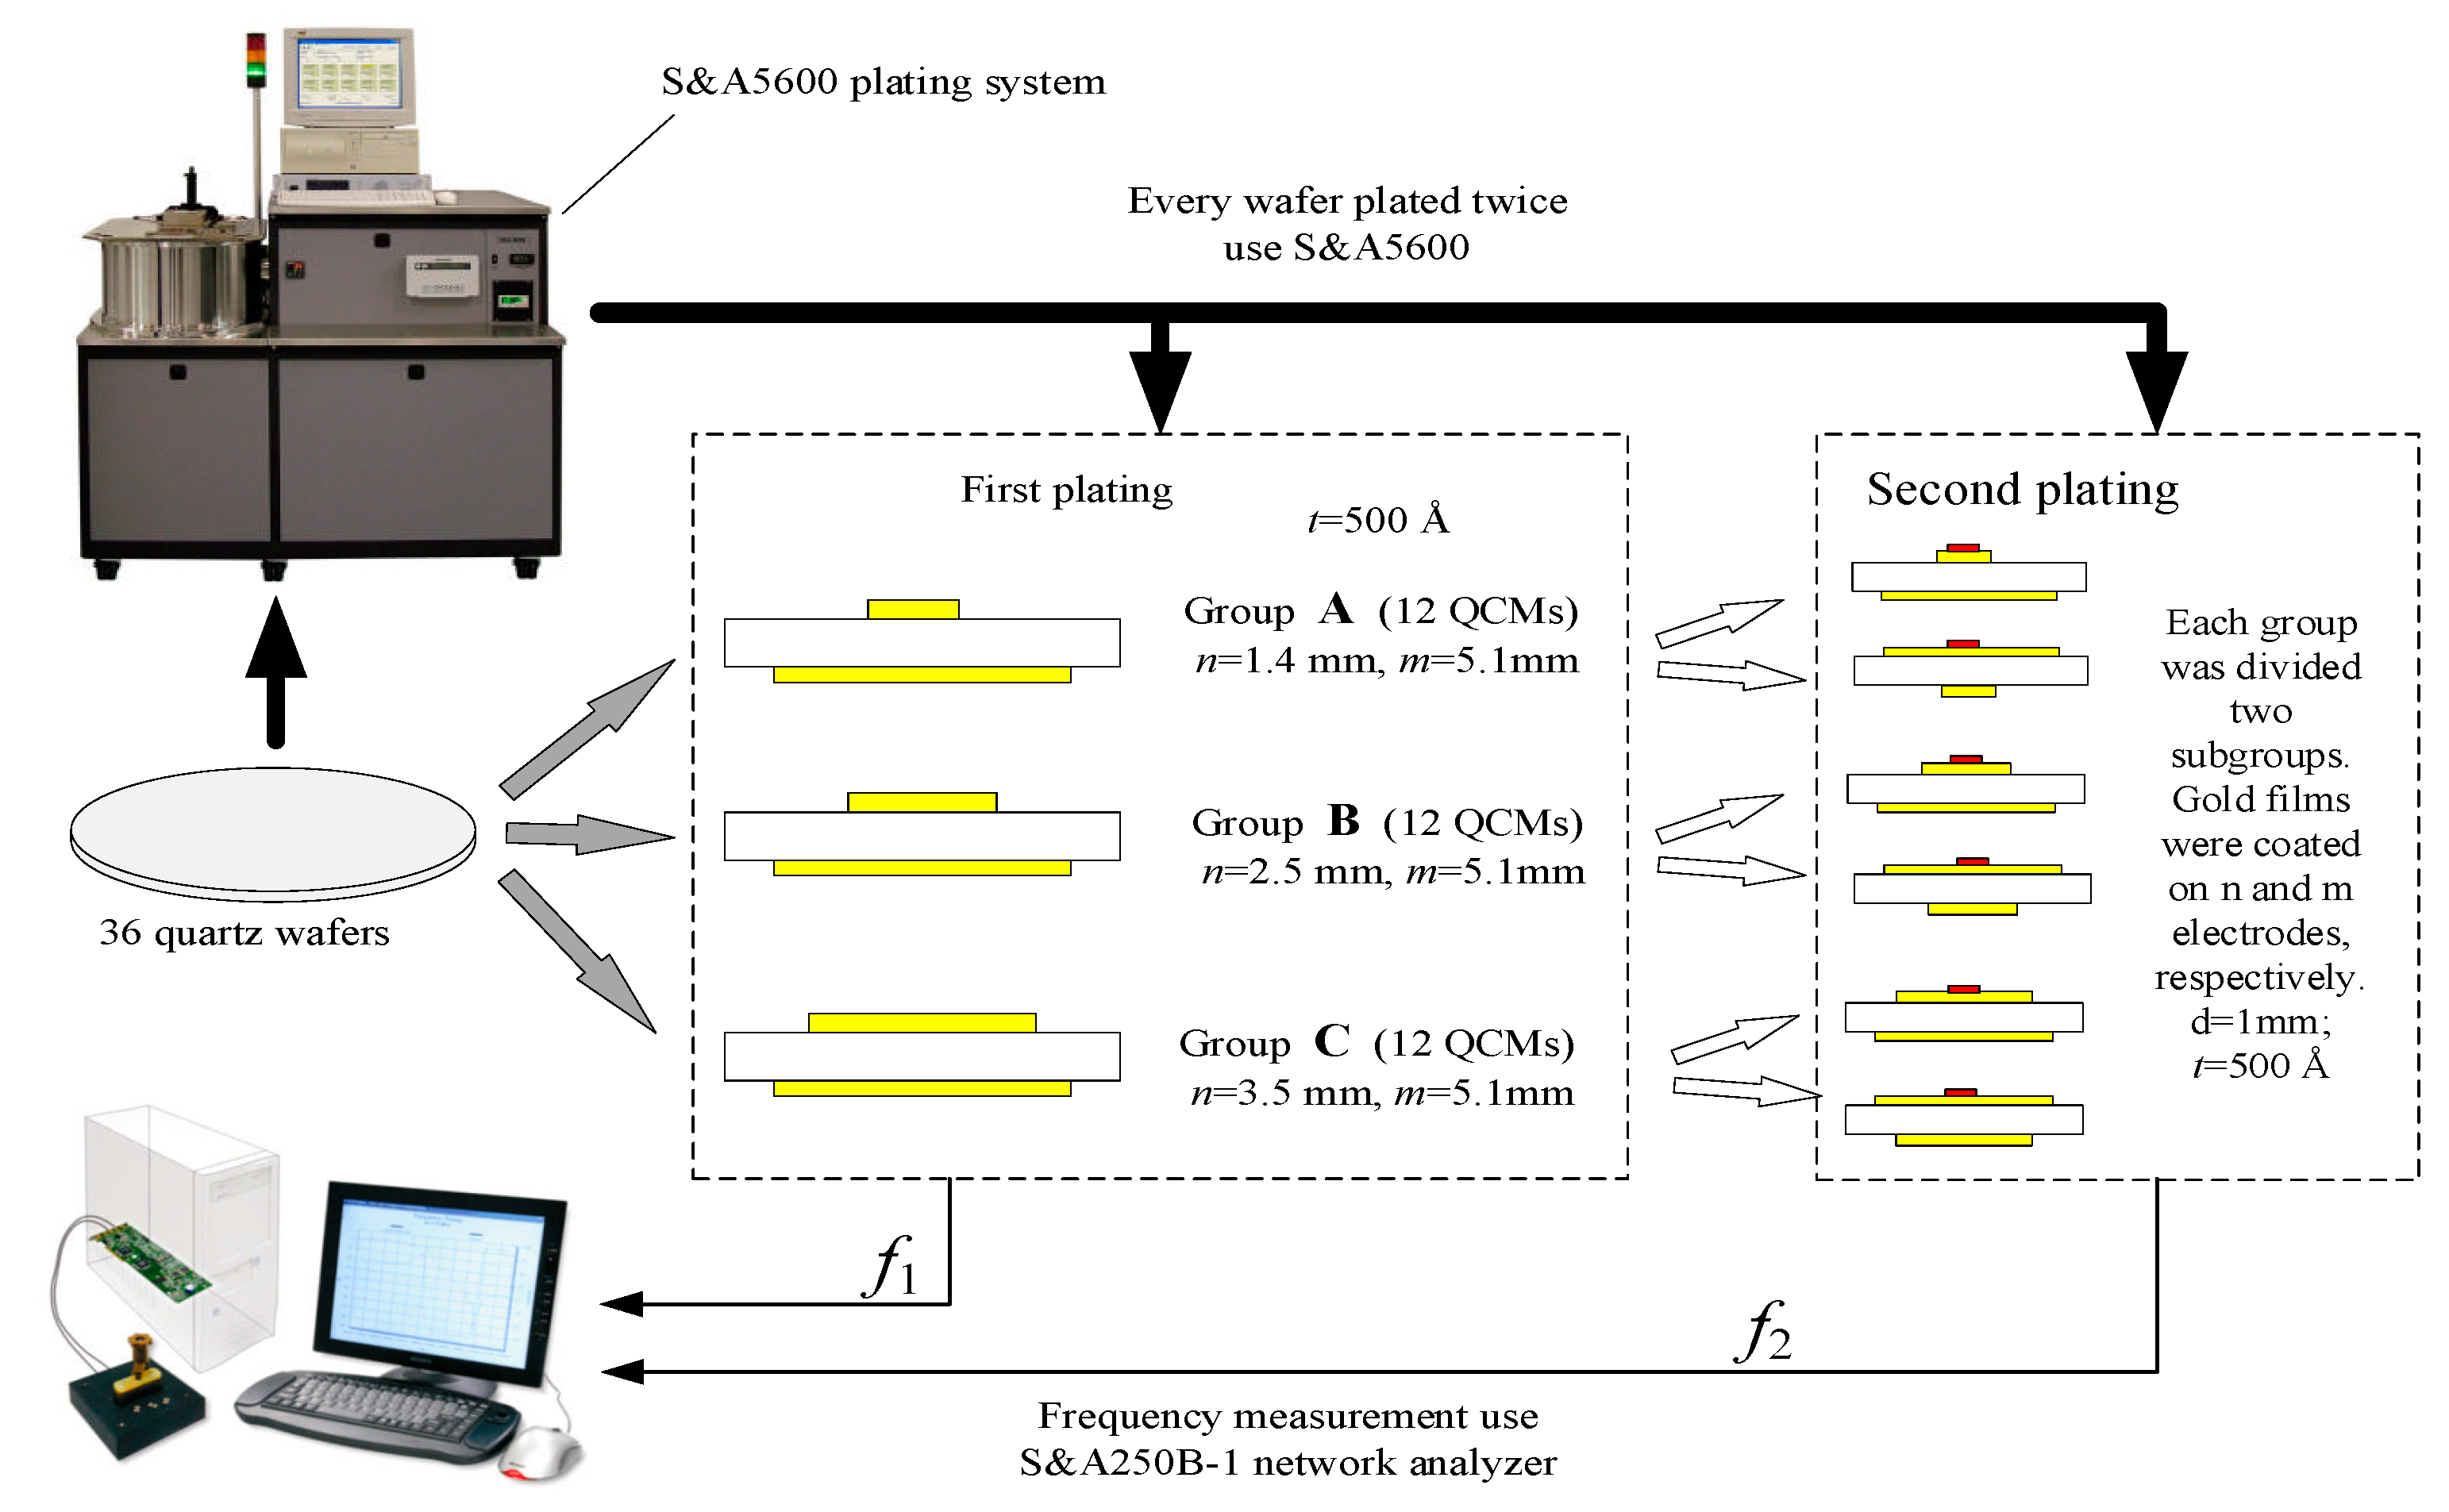
3. Experiment
4. Results and Discussion
4.1. Effect of Different Electrodes on N-M type QCMs
4.2. Effect of Different Ratios of Diameters of Electrodes on N-M Type QCMs
4.3. The Mass Sensitivity of QCM-2.5/5.1
5. Conclusions
Author Contributions
Funding
Conflicts of Interest
References
- Iturri, J.; Vianna, A.C.; Moreno-Cencerrado, A.; Pum, D.; Sleytr, U.B.; Toca-Herrera, J.L. Impact of surface wettability on s-layer recrystallization: A real-time characterization by QCM-D. Beilstein. J. Nanotechnol. 2017, 8, 91–98. [Google Scholar] [CrossRef]
- Tokuyama, H.; Kitamura, E.; Seida, Y. Detection of AU(III) ions using a poly(N,N-dimethylacrylamide)-coated QCM sensor. Talanta 2016, 146, 507–509. [Google Scholar] [CrossRef]
- Ogi, H.; Naga, H.; Fukunishi, Y.; Hirao, M.; Nishiyama, M. 170-MHz electrodeless quartz crystal microbalance biosensor: Capability and limitation of higher frequency measurement. Anal. Chem. 2009, 81, 8068–8073. [Google Scholar] [CrossRef]
- Weber, F.; Barrantes, A.; Tiainen, H. Silicic Acid-Mediated Formation of Tannic Acid Nanocoatings. Langmuir 2019, 35, 3327–3336. [Google Scholar] [CrossRef]
- Chappanda, N.K.; Tchalala, R.M.; Shekhah, O.; Surya, G.S.; Eddaoudi, M.; Salama, N.K. A Comparative Study of Interdigitated Electrode and Quartz Crystal Microbalance Transduction Techniques for Metal–Organic Framework-Based Acetone Sensors. Sensors 2018, 18, 3898. [Google Scholar] [CrossRef]
- Zhang, Q.L.; Cui, H.X.; Xiong, X.L.; Chen, J.; Wang, Y.; Shen, J.; Luo, Y.T.; Chen, L.C. QCM-nanomagnetic beads biosensor for lead ion detection. Analyst 2018, 143, 549–554. [Google Scholar] [CrossRef]
- Cervera-Chiner, L.; Juan-Borrás, M.; March, C.; Arnau, A.; Escriche, I.; Montoya, Á.; Jiménez, Y. High fundamental frequency quartz crystal microbalance (HFF-QCM) immunosensor for pesticide detection in honey. Food Control 2018, 92, 1–6. [Google Scholar]
- Fernandez, R.; Garcia, P.; Garcia, M.; Garcia, J.V.; Jimenez, Y.; Arnau, A. Design and validation of a 150 MHz HFFQCM sensor for bio-sensing applications. Sensors 2017, 17, 2057. [Google Scholar] [CrossRef]
- Li, Y.; Huang, X.H.; Sun, L.; Xu, L. A piezoelectric immunosensor for the rapid detection of p16 INK4a expression in liquid-based cervical cytology specimens. Sens. Actuators B Chem. 2016, 224, 863–867. [Google Scholar]
- Esmeryan, K.D.; Ganeva, R.R.; Stamenov, G.S.; Chaushev, T.A. Superhydrophobic Soot Coated Quartz Crystal Microbalances: A Novel Platform for Human Spermatozoa Quality Assessment. Sensors 2019, 19, 123. [Google Scholar] [CrossRef]
- Ward, M.D.; Delawski, E.J. Radial mass sensitivity of the quartz crystal microbalance in liquid media. Anal. Chem. 1991, 63, 886–890. [Google Scholar] [CrossRef]
- Öztürk, S.; Kösemen, A.; Kösemen, Z.A.; Kılınç, N.; Öztürk, Z.Z.; Penza, M. Electrochemically growth of Pd doped ZnO nanorods on QCM for room temperature VOC sensors. Sens. Actuators B Chem. 2016, 222, 280–289. [Google Scholar] [CrossRef]
- Xie, J.; Wang, H.; Duan, M. QCM chemical sensor based on ZnO colloid spheres for the alcohols. Sens. Actuators B Chem. 2014, 203, 239–244. [Google Scholar] [CrossRef]
- Esmeryan, K.D.; Castano, C.E.; Abolghasemibizaki, M.; Mohammadi, R. An artful method for in-situ assessment of the anti-biofouling potential of various functional coatings using a quartz crystal microbalance. Sens. Actuators B Chem. 2017, 243, 910–918. [Google Scholar] [CrossRef]
- Josse, F.; Lee, Y.; Martin, S.J.; Cernosek, R.W. Analysis of the radial dependence of mass sensitivity for modified-electrode quartz crystal resonators. Anal. Chem. 1998, 70, 237–247. [Google Scholar] [CrossRef]
- Sauerbrey, G. Use of quartz vibration for weighing thin films on a microbalance. J. Phys. 1959, 155, 206–222. [Google Scholar]
- Gao, J.Y.; Huang, X.H.; Wang, Y. The modified design of ring electrode quartz crystal resonator for uniform mass sensitivity distribution. IEEE Trans. Ultrason. Ferroelectr. Freq. Control 2013, 60, 2031–2034. [Google Scholar]
- Hillier, A.C.; Ward, M.D. Scanning electrochemical mass sensitivity mapping of the quartz crystal microbalance in liquid media. Anal. Chem. 1992, 64, 2539–2554. [Google Scholar] [CrossRef]
- Yang, L.; Huang, X.H. The influence of electrode geometry on mass sensitivity of quartz crystal microbalance. In Proceedings of the International Conference on Electrical, Computer Engineering and Electronics (ICECEE 2015), Jinan, China, 29–31 May 2015. [Google Scholar]
- Anthony, R.; Bhethanabotla, V.R.; Smith, A.L.; Fabien, J. Patterned Electrodes for Thickness Shear Mode Quartz Resonators to Achieve Uniform Mass Sensitivity Distribution. IEEE Sens. J. 2009, 9, 1772–1777. [Google Scholar]
- Kelly, J.J.; Rahman, K.A.; Durning, C.J.; West, A.C. Effect of current distribution on quartz crystal microbalance measurements. J. Electrochem. Soc. 1998, 145, 492–497. [Google Scholar] [CrossRef]
- Zhang, H.; Yao, Y.; Shi, Y. Performance Enhancement of Interdigital Electrode-Piezoelectric Quartz Crystal (IDE-PQC) Salt Concentration Sensor by Increasing the Electrode Area of Piezoelectric Quartz Crystal (PQC). Sensors 2018, 18, 3224. [Google Scholar] [CrossRef]
- Ballato, A.; Vig, J.R. Comments on the effects of nonuniform mass loading on a quartz crystal microbalance. IEEE Trans. Ultrason. Ferroelectr. Freq. Control 1998, 45, 1123–1124. [Google Scholar]
- Oltra, R.; Efimov, I.O. Local sensitivity of an electrochemical quartz crystal microbalance: Spatial localization of the low frequency mode. Rev. Sci. Instrum. 1995, 66, 1136–1141. [Google Scholar] [CrossRef]
- Huang, X.H.; Pan, W.; Hu, J.G.; Bai, Q.S. The exploration and confirmation of the maximum mass sensitivity of quartz crystal microbalance. IEEE Trans. Ultrason. Ferroelectr. Freq. Control 2018, 65, 1888–1892. [Google Scholar] [CrossRef]
- Kawasaki, T.; Mochida, T.; Katada, J.I.; Okahata, Y. Laser response of a quartz crystal microbalance: Frequency changes induced by light irradiation in the air phase. Anal. Sci. 2009, 25, 1069–1075. [Google Scholar] [CrossRef]
- Huang, X.H.; Bai, Q.S.; Hu, J.G.; Hou, D. A practical model of quartz crystal microbalance in actual applications. Sensors 2017, 17, 1785. [Google Scholar] [CrossRef]


| Group | A | B | C | |||
|---|---|---|---|---|---|---|
| Electrode | n-Electrode | m-Electrode | n-Electrode | m-Electrode | n-Electrode | m-Electrode |
| (Hz) | 2690 | 2710 | 2550 | 2730 | 2240 | 2310 |
| 2590 | 2670 | 2600 | 2680 | 2240 | 2330 | |
| 2380 | 2640 | 2700 | 2760 | 2110 | 2290 | |
| 2570 | 2520 | 2520 | 2670 | 2240 | 2330 | |
| 2630 | 2540 | 2400 | 2640 | 2320 | 2300 | |
| 2480 | 2610 | 2640 | 2620 | 2270 | 2270 | |
| 2556.67 | 2615.00 | 2568.33 | 2683.33 | 2236.67 | 2305.00 | |
| (Hz) | 110.94 | 73.96 | 104.39 | 53.17 | 69.47422 | 23.45 |
| (Hz) | 2585.83 | 2625.83 ※ | 2270.83 | |||
| 94.91 | 99.22 | 60.97 | ||||
| Groups | R (Ω) | |||||||||||
|---|---|---|---|---|---|---|---|---|---|---|---|---|
| A | 81.64 | 77.61 | 67.19 | 71.47 | 67.30 | 76.77 | 77.59 | 68.04 | 92.04 | 77.17 | 97.22 | 80.04 |
| B | 21.42 | 23.45 | 21.98 | 23.98 | 19.59 | 19.44 | 25.37 | 28.27 | 24.73 | 24.46 | 23.45 | 22.02 |
| C | 12.95 | 11.35 | 10.04 | 12.76 | 24.61 | 13.14 | 11.37 | 11.33 | 12.76 | 11.20 | 13.02 | 11.75 |
© 2019 by the authors. Licensee MDPI, Basel, Switzerland. This article is an open access article distributed under the terms and conditions of the Creative Commons Attribution (CC BY) license (http://creativecommons.org/licenses/by/4.0/).
Share and Cite
Chen, Q.; Huang, X.; Pan, W.; Xu, Y.; Fan, Z. Investigation on Mass Sensitivity of N-M Type Electrode Quartz Crystal Microbalance. Sensors 2019, 19, 2125. https://doi.org/10.3390/s19092125
Chen Q, Huang X, Pan W, Xu Y, Fan Z. Investigation on Mass Sensitivity of N-M Type Electrode Quartz Crystal Microbalance. Sensors. 2019; 19(9):2125. https://doi.org/10.3390/s19092125
Chicago/Turabian StyleChen, Qiao, Xianhe Huang, Wei Pan, Yuan Xu, and Zhichao Fan. 2019. "Investigation on Mass Sensitivity of N-M Type Electrode Quartz Crystal Microbalance" Sensors 19, no. 9: 2125. https://doi.org/10.3390/s19092125
APA StyleChen, Q., Huang, X., Pan, W., Xu, Y., & Fan, Z. (2019). Investigation on Mass Sensitivity of N-M Type Electrode Quartz Crystal Microbalance. Sensors, 19(9), 2125. https://doi.org/10.3390/s19092125