Article

Rapid Determination of Chlorogenic Acid, Luteoloside and 3,5-O-dicaffeoylquinic Acid in Chrysanthemum Using Near-Infrared Spectroscopy

1
College of Biosystems Engineering and Food Science, Zhejiang University, Hangzhou 310058, Zhejiang Province, China
2
Zhejiang Research Institute of Traditional Chinese Medicine, Hangzhou 310023, Zhejiang Province, China
3
State Key Laboratory of Modern Optical Instrumentation, Zhejiang University, Hangzhou 310027, Zhejiang Province, China
*
Authors to whom correspondence should be addressed.
Sensors 2019, 19(9), 1981; https://doi.org/10.3390/s19091981
Submission received: 13 March 2019 / Revised: 19 April 2019 / Accepted: 24 April 2019 / Published: 28 April 2019
(This article belongs to the Special Issue Infrared Spectroscopy and Sensors)

Abstract

:
The feasibility of near-infrared spectroscopy (NIR) to detect chlorogenic acid, luteoloside and 3,5-O-dicaffeoylquinic acid in Chrysanthemum was investigated. An NIR spectroradiometer was applied for data acquisition. The reference values of chlorogenic acid, luteoloside, and 3,5-O-dicaffeoylquinic acid of the samples were determined by high-performance liquid chromatography (HPLC) and were used for model calibration. The results of six preprocessing methods were compared. To reduce input variables and collinearity problems, three methods for variable selection were compared, including successive projections algorithm (SPA), genetic algorithm-partial least squares regression (GA-PLS), and competitive adaptive reweighted sampling (CARS). The selected variables were employed as the inputs of partial least square (PLS), back propagation-artificial neural networks (BP-ANN), and extreme learning machine (ELM) models. The best performance was achieved by BP-ANN models based on variables selected by CARS for all three chemical constituents. The values of rp2 (correlation coefficient of prediction) were 0.924, 0.927, 0.933, the values of RMSEP were 0.033, 0.018, 0.064 and the values of RPD were 3.667, 3.667, 2.891 for chlorogenic acid, luteoloside, and 3,5-O-dicaffeoylquinic acid, respectively. The results indicated that NIR spectroscopy combined with variables selection and multivariate calibration methods could be considered as a useful tool for rapid determination of chlorogenic acid, luteoloside, and 3,5-O-dicaffeoylquinic acid in Chrysanthemum.

1. Introduction

Chrysanthemum (the dry capitulum of Chrysanthemum morifolium Ramat) is a medicinal and edible cognate plant [1]. It was harvested in full bloom, and dried in the shade or over a fire, or dried in the sun after steaming. Modern studies show that Chrysanthemum has many biological and pharmacological characteristics including antibacterial, anti-inflammatory, antioxidant, vasodilator, hypolipidemic, and anti-tumor [2,3]. The Pharmacopoeia of the People’s Republic of China provides a standard of content of chlorogenic acid, luteoloside and 3,5-O-dicaffeoylquinic acid in Chrysanthemum [4]. Chlorogenic acid shows the activity of protecting the cardiovascular, antioxidation, antibacterial, antiviral, lipid-lowering, hypoglycemic, and liver protection [5,6]. Luteolin has anti-inflammatory, antiviral, and analgesic activity [7]. 3,5-O-dicaffeoylquinic acid is identified as an important chemical composition for antioxidant activity [8]. Chrysanthemum is widely distributed around the world.
The contents of chemical composition are different according to different environment, cultivars, harvest time, processing methods, and storage conditions [9,10]. The rapid determination of the contents of chlorogenic acid, luteoloside, and 3,5-O-dicaffeoylquinic acid are important for quality evaluation and clinical medication selection of Chrysanthemum.
Several techniques have been adopted for the determination of chlorogenic acid, luteoloside and 3,5-O-dicaffeoylquinicacid, including HPLC, gas chromatography–mass spectrometry and fluorescence spectrometry [11,12]. Nevertheless, these methods are expensive, time-consuming and require complicated sample preprocessing. Hence, it is necessary to develop a rapid and effective quantitative analysis method for the quality determination of Chrysanthemum.
With the advantages of being nondestructive, simple and fast, near-infrared spectroscopy (NIRS) has been widely applied in agriculture [13], the petroleum industry [14], food [15] and traditional Chinese medicine [16]. For instance, chlorogenic acid, caffeic acid, luteoloside, baicalin, ursodesoxycholic acid and chenodeoxycholic acid were analyzed in Tanreqing injection using FT-NIR, Tao applied NIR to determine the concentration of seven analytes including chlorogenic acid [17,18]. However, few studies are developed for quantitative analysis of chlorogenic acid, luteoloside and 3,5-O-dicaffeoylquinic acid in Chrysanthemum.
In this work, a new method is proposed for the rapid determination of chlorogenic acid, luteoloside and 3,5-O-dicaffeoylquinic acid based on NIRS technology, which can provide components information for production, processing and the inspection of Chrysanthemum and its products.

2. Materials and Methods

2.1. Materials and Reagents

The reference substance of Chlorogenic acid, luteoloside, and 3,5-O-dicaffeoylquinic acid were derived from the National Institutes for the Foods and Drug Control (Beijing, China). The HPLC-grade acetonitrile was obtained from Tedia Scientific Inc. (Cincinnati, OH, USA). Methanol (analytical grade) and phosphoric acid (analytical grade, P85%) were purchased from Zhejiang Chemicals Company (Zhejiang, China). All other reagents were of analytical grade. Water used throughout the experiments was purified water provided by Wahaha Company (Zhejiang, China).
112 samples of Chrysanthemum were used in this research. Samples were provided by Zhejiang Research Institute of Traditional Chinese Medicine (Hangzhou, Zhejiang Province). Each sample was dried and grounded into powder, and only the powder which could pass through 0.25 mm pore mesh was used. These samples were kept in a temperature of 25 ± 2 °C and a moisture of 60 ± 10%. Among the prepared samples, 76 samples were selected randomly for calibration and the remaining 36 samples for independent prediction.

2.2. Spectrometric Measurements

Each sample was put in the sample cell and scanned by the Matrix Duplex NIR system working in the wavenumber range of 12,000 cm−1 to 4000 cm−1. All spectra were collected in a diffuse reflection mode with an optical fiber reflectance head and recorded as the log (1/R). Each sample was scanned 32 times and the average spectrum was regarded as the sample spectrum.

2.3. Reference Analysis Methods

The contents of chlorogenic acid, luteoloside, and 3,5-O-dicaffeoylquinic acid were determined by the HPLC method according to the Pharmacopoeia of the People’s Republic of China (2015 edition). The HPLC system was an Agilent 1100 series consisting of a vacuum degasser G1322A, a quaternary pump G1311A, an autosampler G1329A, a programmable variable wavelength detector (VWD) G1314B and a Thermostatted Column Compartment G1316A. The column was a Diamonsil C18 (250 × 4.6 mm, 5 µm) column. The detection wavelength was 348 nm. A gradient system was used consisting of two mobile phases. Mobile phase A was acetonitrile and the mobile phase B was 1% phosphoric acid solution. The gradient system was as follows: 0–11 min, 10–18% A, 11–30 min, 18–20% A, 30–40 min, 20% A. The flow rate was 1.0 mL/min, the injection volume was 5 µL.

2.4. Spectral Preprocessing

Before the calibration process, six preprocessing strategies were employed to reduce high-frequency random noise, baseline variation, path length differences and light scattering. The preprocessing methods include moving averages smoothing (MAS), Savitzky–Golay smoothing (SG), standard normal variate transformation (SNV), multiplicative scattering correction (MSC), the first derivative (1st-Der) and de-trending (Detrend). The results of different preprocessing methods were compared to choose the optimum preprocessing strategies. The preprocessing and calculations were carried out using the Unscrambler® 10.1 software (Camo Process AS, Oslo, Norway).

2.5. Sensitive Variables Selection

A raw NIRS spectrum of a Chrysanthemum sample contained 2075 spectral bands, which suffered the collinearity and high dimensionality problems. In some cases, suitable methods can identify the most effective variables to reduce the input variables and improve the models’ accuracy and robustness [19,20]. Three methods for variables selection were used to reduce the collinearity and high dimensionality problems of NIR spectra and to develop simpler models. The methods include successive projections algorithm (SPA) [21], which could minimize variable collinearity, genetic algorithm-partial least squares regression (GAPLS) which combines the advantage of GA and PLS [22], and competitive adaptive reweighted sampling (CARS) [23,24,25]. CARS is a feature selection method combined Monte Carlo sampling with PLS regression coefficient.

2.6. Chemometric Calibration Method

Partial least square (PLS) algorithm [26] is a classic linear calibration method for spectral analysis. PLS extracts the main factors or sensitive variables (SV). Models are developed based on the scores of the main factors or SV according to their cumulative contribution rate [27,28].
Extreme learning machine (ELM) is one of learning neural algorithms, which has been successfully applied in nonlinear regression problems [29]. The algorithm randomly generates the connection weights between the input layer and the hidden layer. There is no need to adjust the threshold of the hidden layer neurons in the training process. The optimal solution is achieved when the number of hidden layer neurons is set. Comparing with traditional learning algorithms, ELM not only possesses the fast learning speed but also has a good generalization performance [30].
Backpropagation artificial neural network (BP-ANN) is one of the most popular neural network topologies [31]. BP-ANN extracts and establishes a complex correlation between inputs and outputs. The output represents the similarity between an object and a training pattern. As each process of the training pattern and the weight factor is adjusted, the difference between the calculated network output and the expected value is defined as the network output error, which will gradually decrease until the desired selection level is reached. An epoch is a one cycle through all training patterns [32,33].

2.7. Model Evaluation and Softwares

The performance of models was evaluated by five parameters including correlation coefficient of calibration (rc2), root mean square error of calibration (RMSEC), the correlation coefficient of prediction (rp2), root mean square error of prediction (RMSEP) and relative percent deviation (RPD). A good model should have higher rc2 and rp2 values, and lower RMSEC and RMSEP values. An RPD more than 1.5 is regarded as good predictions; an RPD between 2.0 and 2.5 indicates a satisfactory model for prediction, an RPD larger than 3.0 is considered as an efficient prediction model. In this study, rp2, RMSEP, and RPD were used as evaluation indexes to compare the models.
The spectral data extraction and the calculation of SPA, CARS, GA-PLS, ELM, and BP-ANN algorithms were performed by Matlab R2011a (The Math Works, Natick, MA, USA). PLS was conducted by Unscrambler® 10.1 (CAMO AS, Oslo, Norway).

3. Results and Discussion

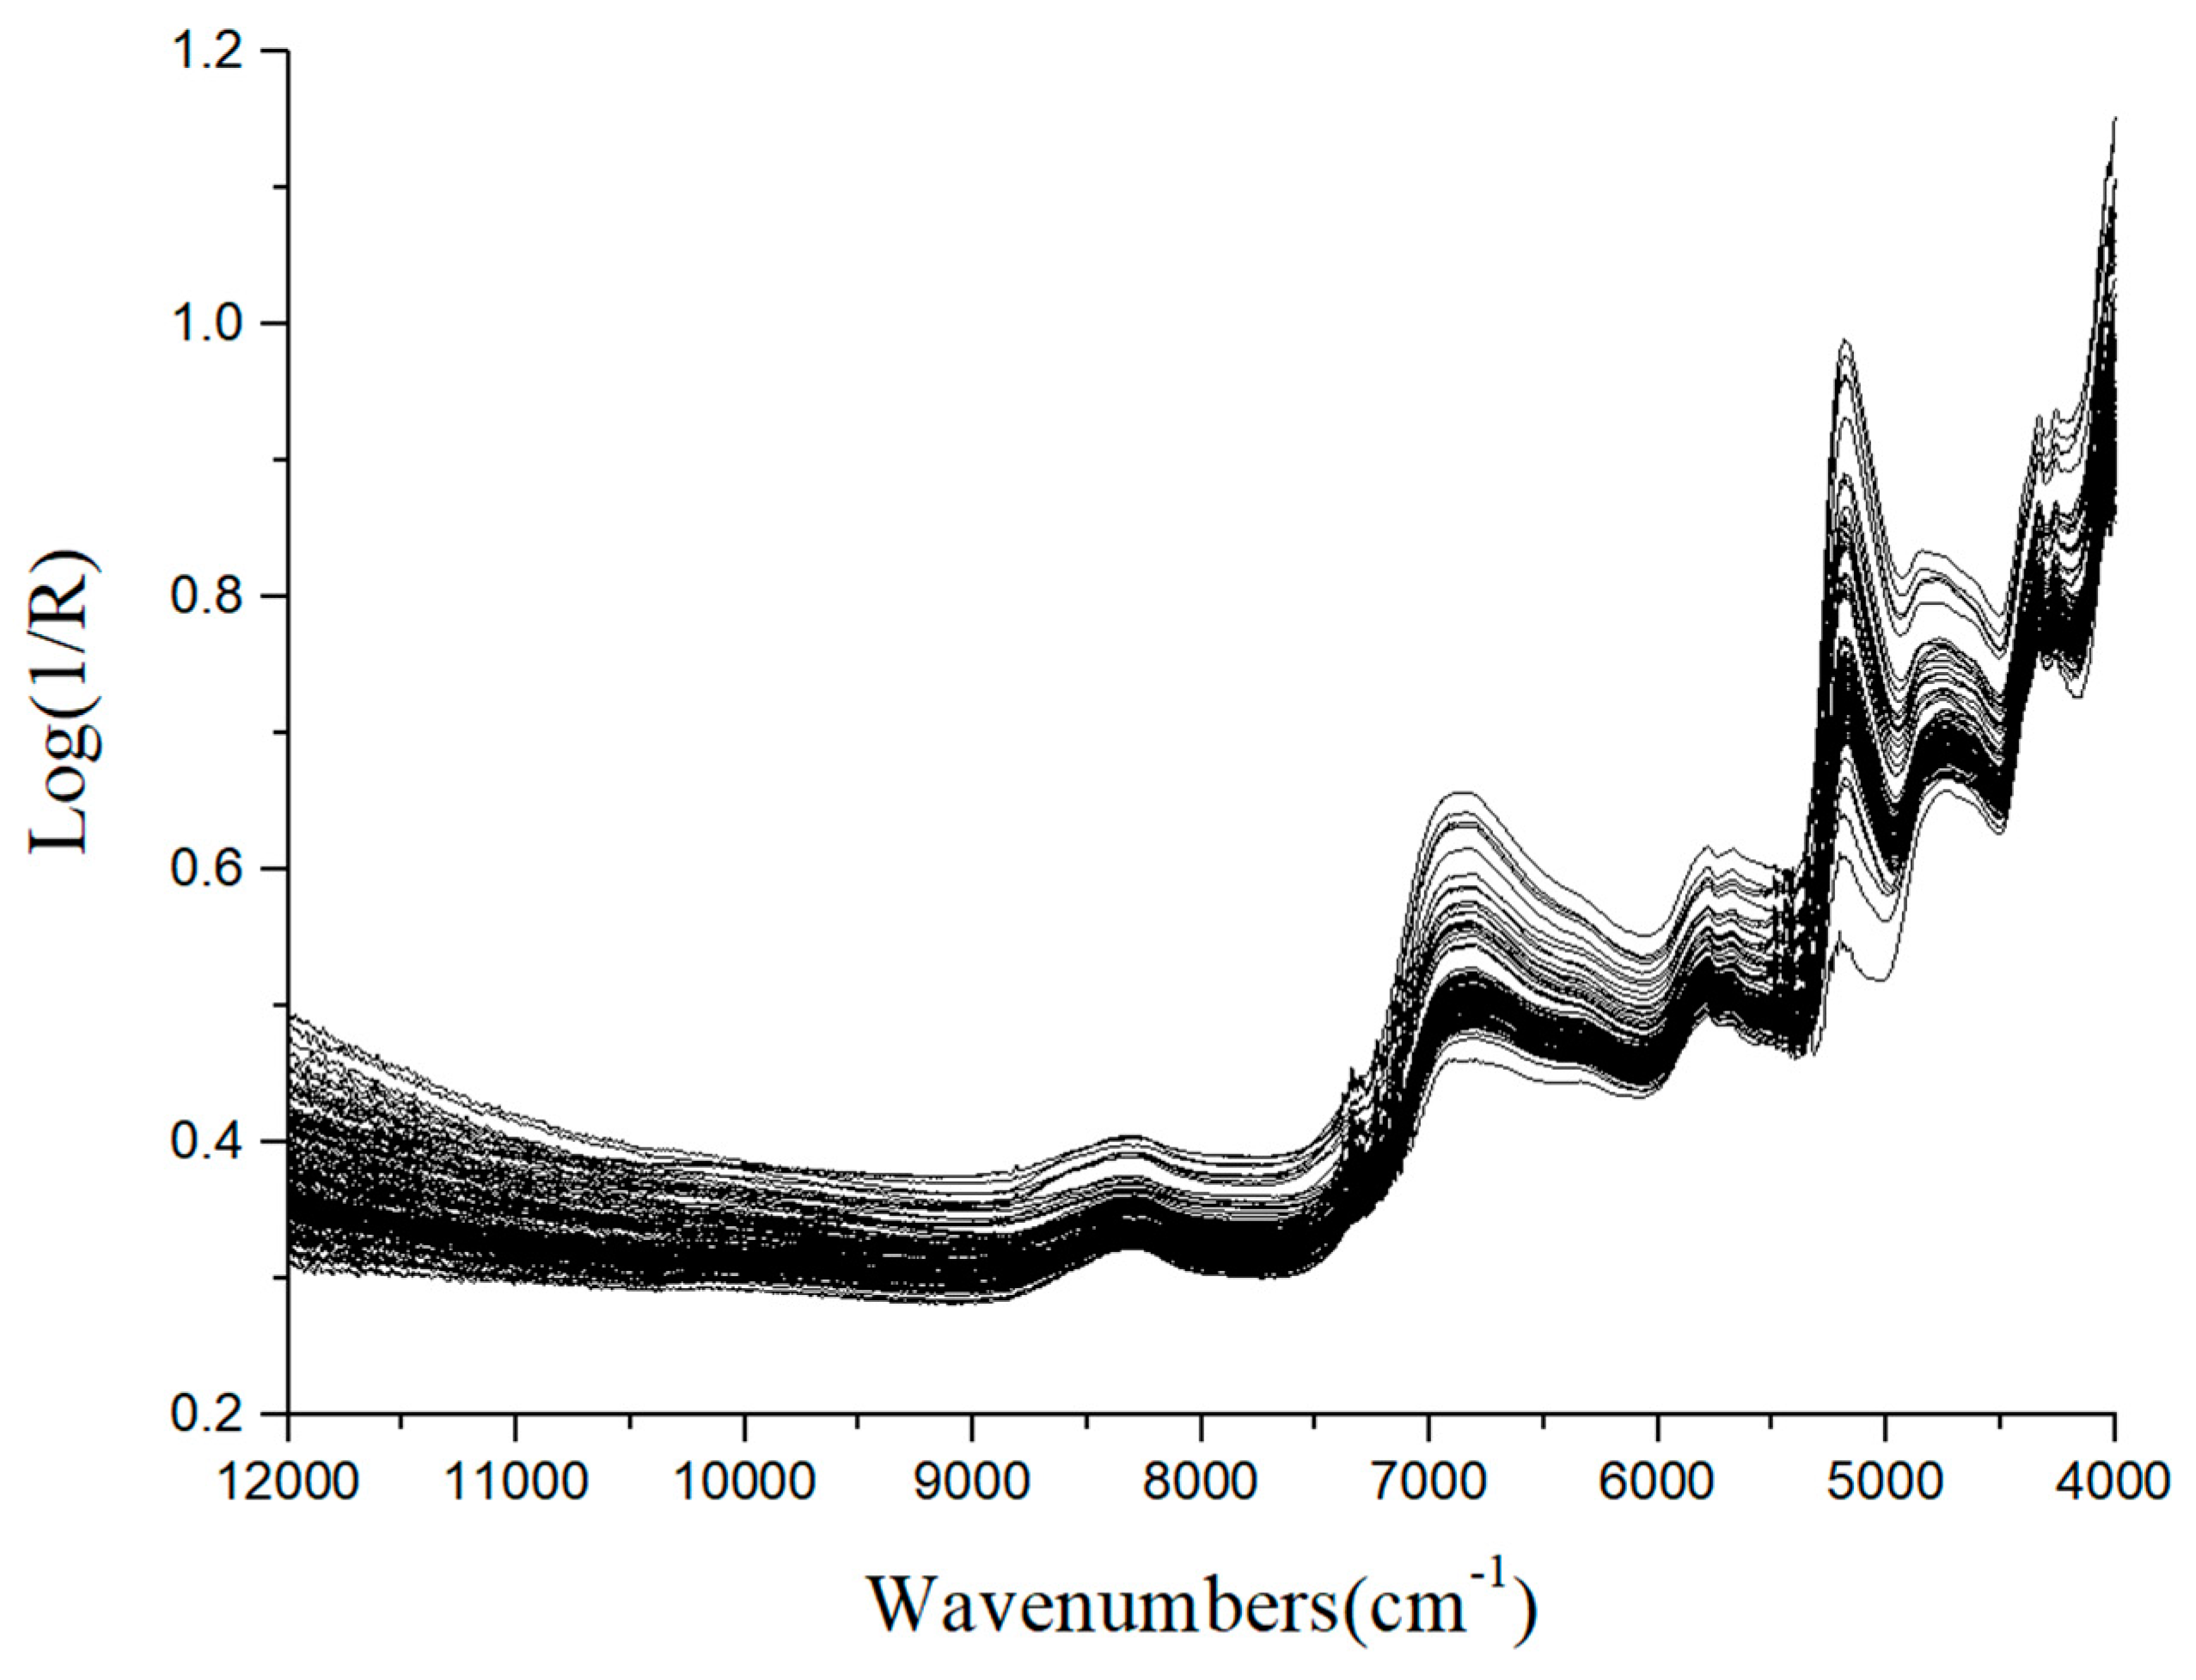
3.1. Features of NIR Spectra and HPLC Analysis

The original spectra of 112 Chrysanthemum samples are shown in Figure 1. It is noticed that the trends of all samples were quite similar except the different magnitudes of the spectra reflectance. This might be caused by different contents of chemical constituents of the samples, including chlorogenic acid, luteoloside and 3,5-O-dicaffeoylquinic acid. The reference values of chlorogenic acid, luteoloside and 3,5-O-dicaffeoylquinic acid in Chrysanthemum determined by HPLC are shown in Table 1. The content range of the measured components in the modeling set and the prediction set are similar, so, the established model can be representative.

3.2. Determination of the Best Preprocessing Algorithms

Different preprocessing methods were applied to the raw NIR spectra data. To identify the optimal preprocessing methods, PLS models were established based on different pretreated spectra data as input variables. Results of the PLS models based on the raw and pretreated spectra data are shown in Table 2. The best result was obtained based on SG pretreated spectra for the chlorogenic acid prediction. The prediction results of the SG model had a good rp2 value of 0.843 and a small RMSEP value of 0.047. The optimal PLS model (rp2 = 0.741 and RMSEP = 0.033) was achieved by the SNV preprocessing for the luteoloside prediction. For the 3,5-O-dicaffeoylquinic acid prediction, the best performance with rp2 of 0.843 and RMSEP of 0.072 was obtained by the raw spectra data. The best input variables were employed for further calculation.

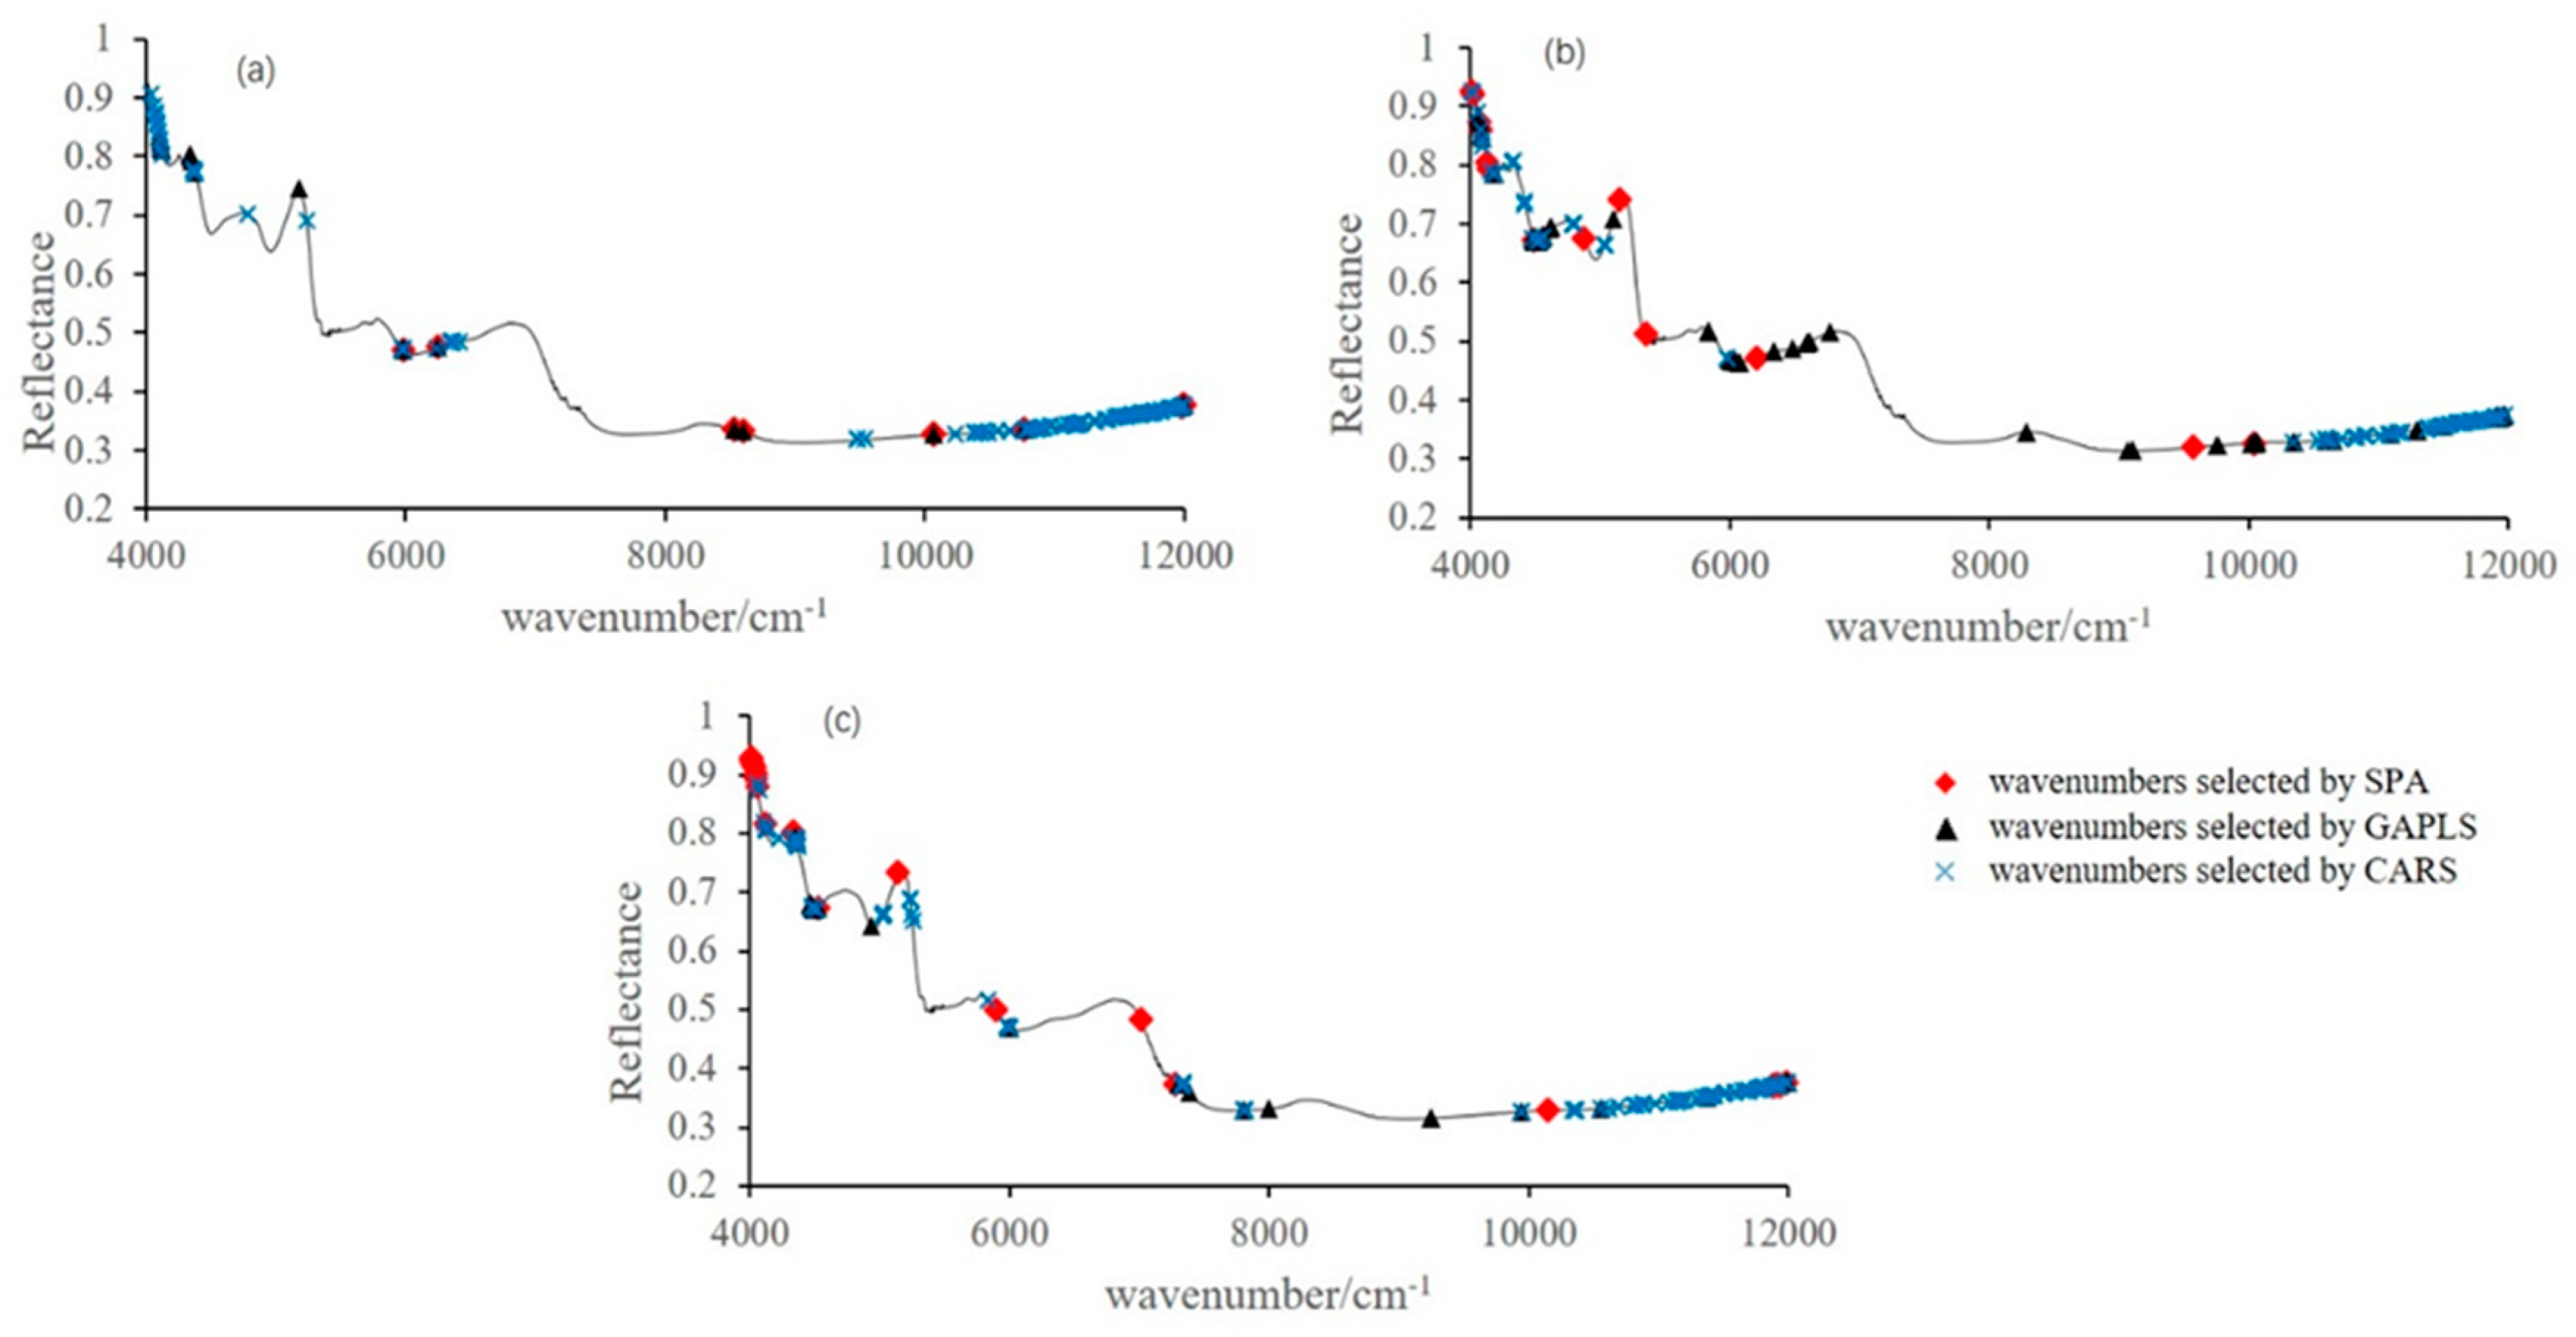
3.3. Sensitive Variables Selection

The data of raw NIRS spectrum of Chrysanthemum contained 2075 bands. These bands had collinearity and high dimensionality problems. To reduce the input variables and the collinearity problems, SPA, GA-PLS, and CARS were compared. Shown from Figure 2, by applying these methods, the number of variables decreased from 2075 to less than 106. The selected variables simplified the model and improved the speed of the computation process.

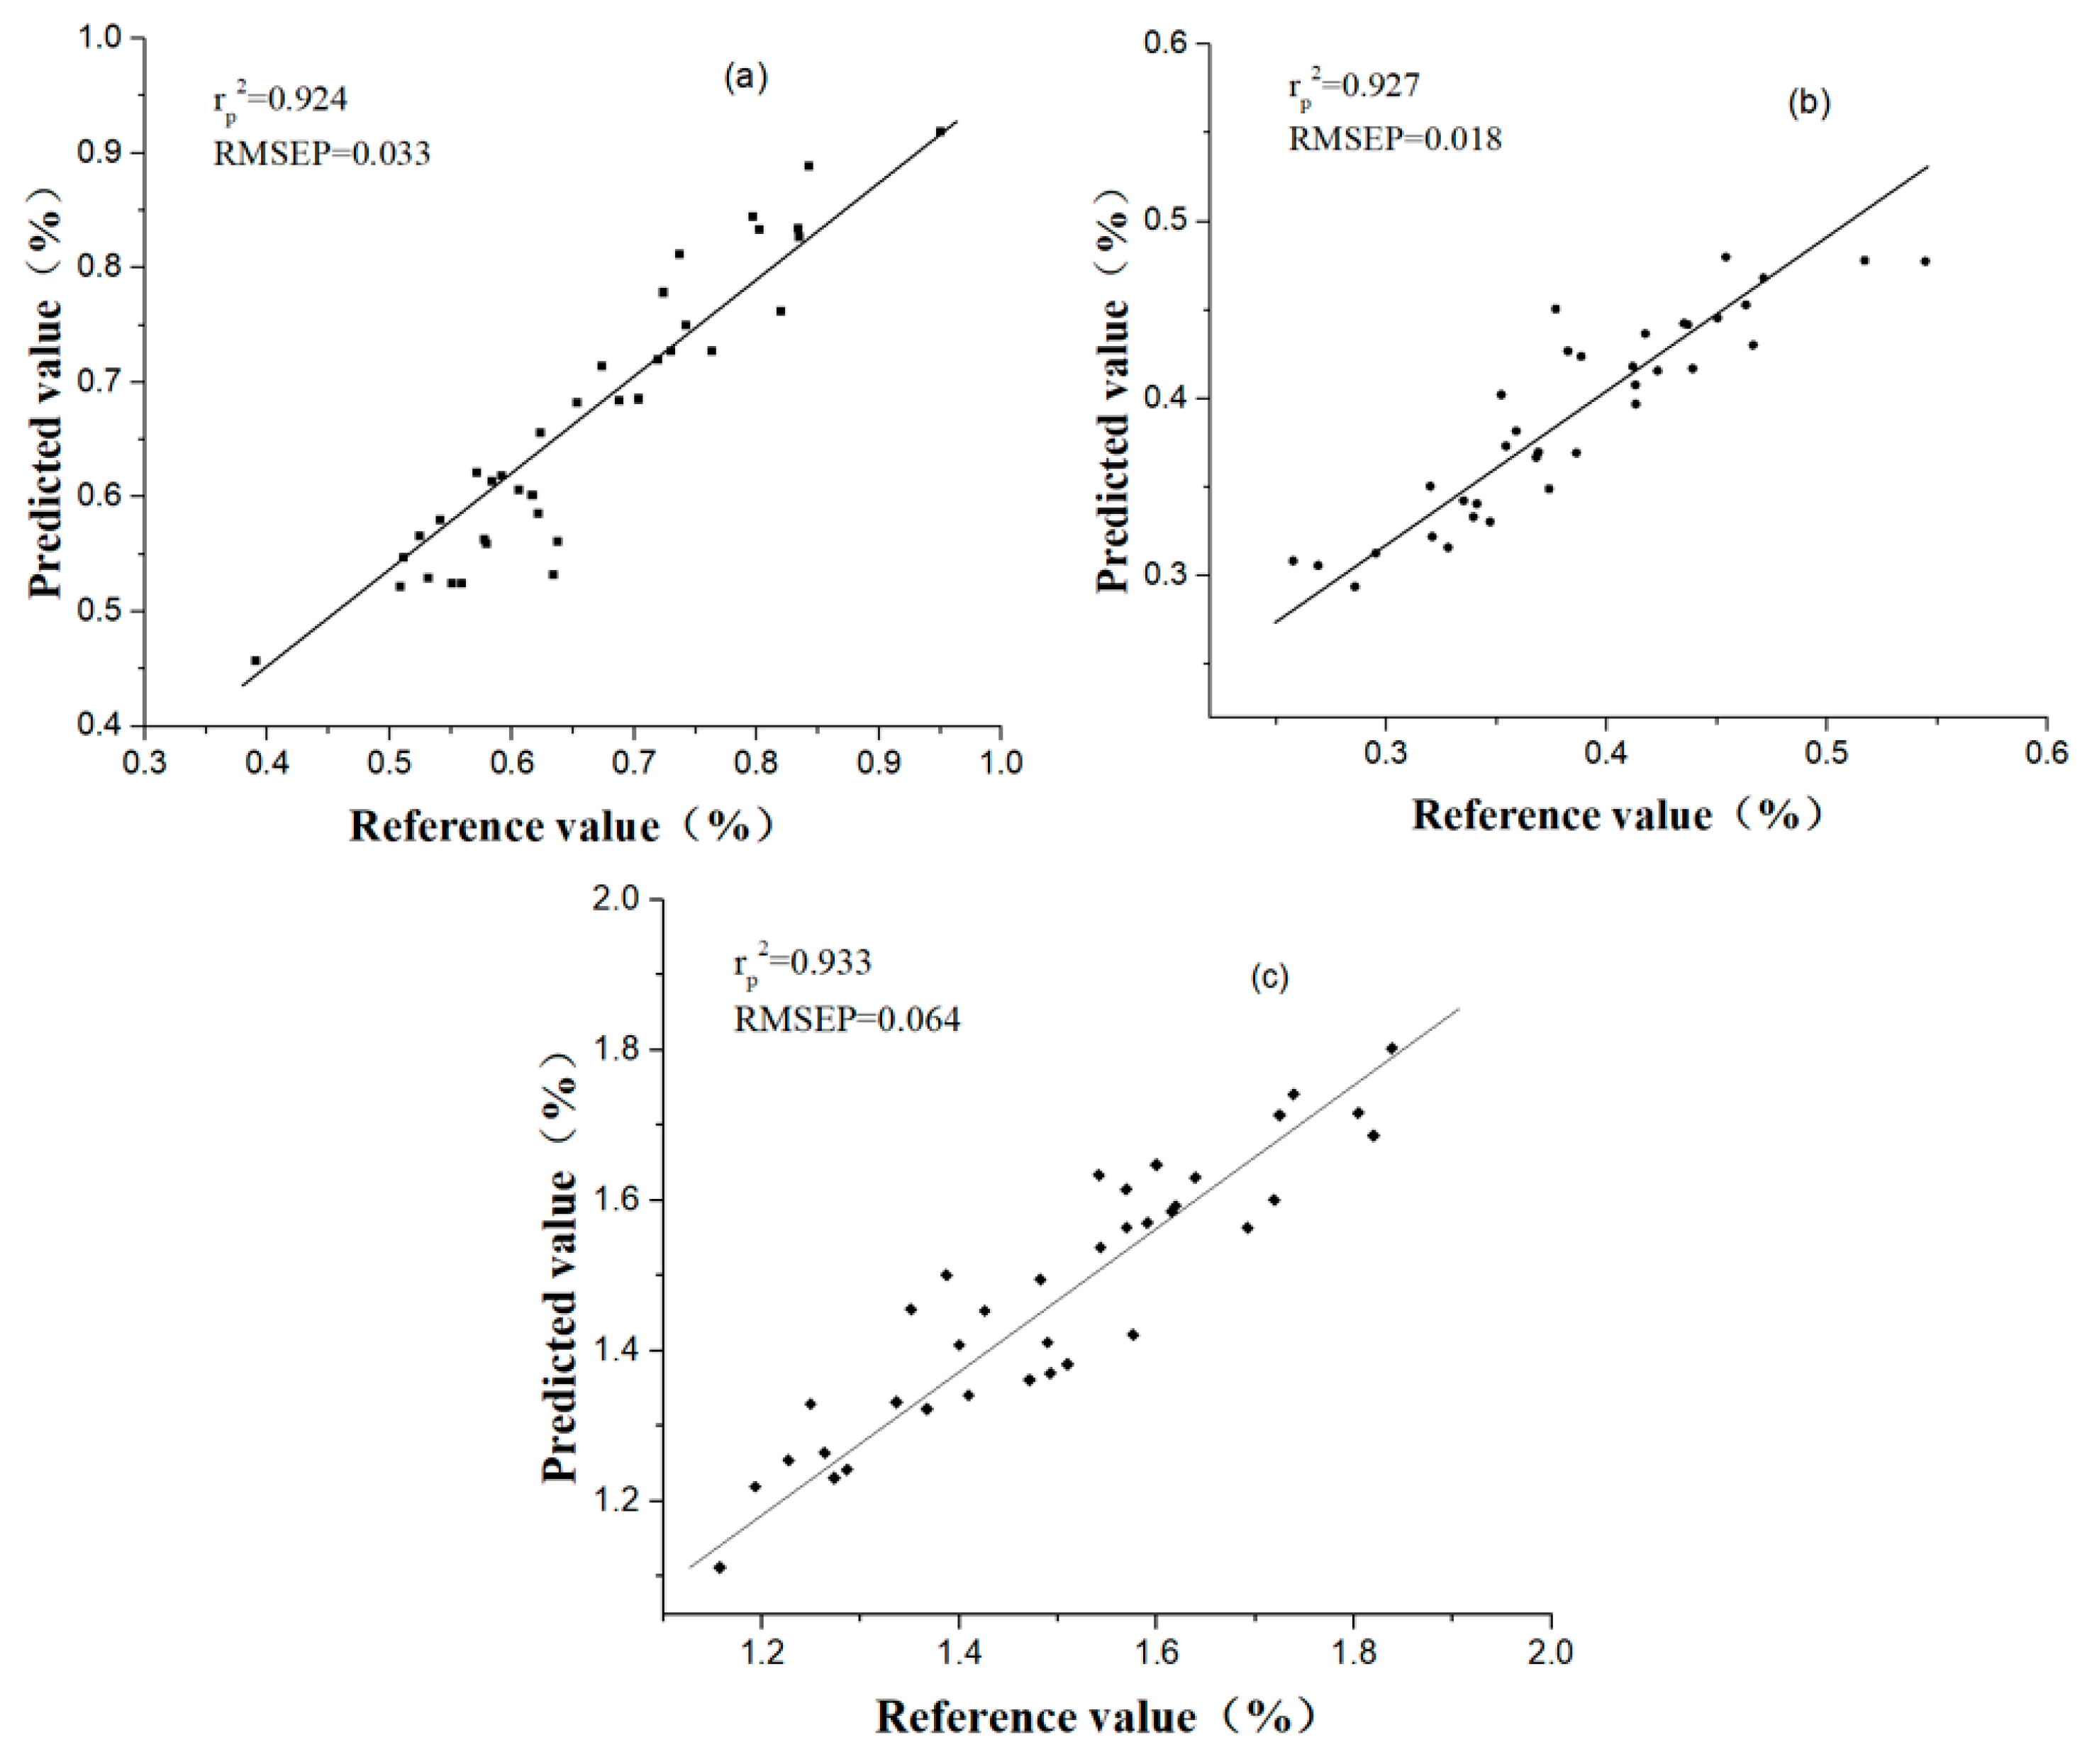
3.4. Model Calibration

Three kinds of regression models (PLS, ELM, BP-ANN) were established based on the selected SVs as input variables. The performance of each model is shown in Table 3. Compared with full spectral PLS models (Table 2), the CARS-PLS model had a better performance with rp2 of 0.899, RMSEP of 0.038 and RPD of 3.184 for the prediction of chlorogenic acid. The SPA-PLS and GAPLS-PLS models had similar results, compared with the full spectral model. The results indicated that CARS was an effective variable selection method and SVs identified by CARS contained the most relevant and representative information. SPA and GAPLS also obtained positive results, as only 0.3% and 1.4% of the full spectral bands were selected as input variables, and their models also had a good prediction. Moreover, BP-ANN models achieved better performance than PLS and ELM models and the best prediction performance was obtained by CARS-BP-ANN model (processed by SG), which had rp2 of 0.924, RMSEP of 0.033 and RPD of 3.667.
For the luteoloside content prediction, the GAPLS-PLS and CARS-PLS models showed better results than the full spectral PLS model, indicating that the SVs selected by GAPLS and CARS extracted the most useful information to represent the full spectra. Compared with the full spectra model, similar performance was achieved based on the variables selected by SPA, which had only 0.6% of full variables. Therefore, SPA was also regarded as a helpful way of variable selection. Similar to the chlorogenic acid analysis, BP-ANN models were better than the corresponding PLS and ELM models. The best result was obtained by the BP-ANN model based on the variables selected by CARS, and the best model had rp2 of 0.927, RMSEP of 0.018 and RPD of 3.667.
For 3,5-O-dicaffeoylquinic acid prediction, compared with the full spectral PLS models, GAPLS-PLS and CARS-PLS models obtained better performance, which implied that GAPLS and CARS were effective variable selection methods. Although the value of rp2 of the SPA-PLS model was lower than the PLS model based on full spectra, SPA was still considered as a useful method, since the number of input variables of SPA-PLS model decreased 99.0%, from 2075 to 20, whereas the rp2 value only reduced 8.5%. Same to the prediction of chlorogenic acid and luteoloside, BP-ANN models also achieved the best performance. The best prediction results were obtained by the CARS-BP-ANN model, which had rp2 of 0.933, RMSEP of 0.064, and RPD of 2.891. Therefore, BP-ANN was considered as the optimal calibration method for the prediction of chlorogenic acid, luteoloside and 3,5-O-dicaffeoylquinic acid in Chrysanthemum. The scatter plots of the best results of CARS-BP-ANN models in the prediction set for prediction of chlorogenic acid, luteoloside and 3,5-O-dicaffeoylquinic acid are shown in Figure 3.

4. Conclusions

In this work, the feasibility of NIR spectroscopy for the rapid determination of chlorogenic acid, luteoloside and 3,5-O-dicaffeoylquinic acid contents in Chrysanthemum was explored. Different preprocessing, variable selection and regression methods were employed and their results were compared. SG and SNV were considered as the optimal preprocessing method for the prediction of chlorogenic acid and luteoloside respectively and raw data was the best for the prediction of 3,5-O-dicaffeoylquinic acid. SPA, GAPLS and CARS were proposed to recognize sensitive variables which were important to predict chlorogenic acid, luteoloside and 3,5-O-dicaffeoylquinic acid contents. The BP-ANN models achieved better performance than PLS and ELM models and the best performance was achieved by the BP-ANN models based on variables selected by CARS for the prediction of all three chemical constituents in Chrysanthemum. The best spectral models for the prediction of chlorogenic acid, luteoloside and 3,5-O-dicaffeoylquinic acid had rp2 of 0.924, 0.927, 0.933, RMSEP of 0.033, 0.018, 0.064, RPD of 3.667, 3.667, 2.891, respectively. The above results indicated that NIR spectroscopy combined with variables selection and multivariate calibration methods has the potential to be considered as a useful tool for the rapid determination of chlorogenic acid, luteoloside and 3,5-O-dicaffeoylquinic acid in Chrysanthemum. In the future, more Chrysanthemum samples with a wider range of chlorogenic acid, luteoloside and 3,5-O-dicaffeoylquinic acid contents should be considered to further improve the accuracy, robustness and adaptability of models for industrial application.

Author Contributions

Conceptualization and methodology implementation, Z.X. and Y.H.; data analysis, Z.X. and C.C.; investigation, Z.X. and Y.S.; validation, Z.X. and C.C.; supervision, P.N. and Y.H.; writing—original draft preparations, Z.X.; writing—review and editing, Z.X., Y.S., C.C., Y.H. and P.N.

Funding

This study was supported by the National Key Research and Development Program of China (Grant no. 2018YFD0700704) and the key Scientific and Technological Projects in Zhejiang Province (Grant no. 2016C02058).

Conflicts of Interest

The authors declare no conflict of interest.

References

  1. Wang, S.; Hao, L.J.; Zhu, J.J.; Wang, Z.M.; Zhang, X.; Song, X.M. Comparative Evaluation of Chrysanthemum Flos from Different Origins by HPLC-DAD-MS n and Relative Response Factors. Food Anal. Meth. 2015, 8, 40–51. [Google Scholar] [CrossRef]
  2. Chen, C.-W.; Yan, H.; Han, B.-X. Rapid identification of three varieties of chrysanthemum with near infrared spectroscopy. Rev. Bras. Farm. 2014, 24, 33–37. [Google Scholar] [CrossRef]
  3. Lin, L.-Z.; Harnly, J.M. Identification of the phenolic components of chrysanthemum flower (Chrysanthemum morifolium Ramat). Food Chem. 2010, 120, 319–326. [Google Scholar] [CrossRef]
  4. Han, S.P. A successive projection method. Math. Program. 1988, 40, 1–14. [Google Scholar] [CrossRef]
  5. Upadhyay, R.; Rao, L.J.M. An outlook on chlorogenic acids-occurrence, chemistry, technology, and biological activities. Crit. Rev. Food Sci. Nutr. 2013, 53, 968–984. [Google Scholar] [CrossRef]
  6. Lou, Z.; Wang, H.; Zhu, S.; Ma, C.; Wang, Z. Antibacterial Activity and Mechanism of Action of Chlorogenic Acid. J. Food Sci. 2011, 76, 398–403. [Google Scholar] [CrossRef]
  7. Lin, Y.; Shi, R.; Wang, X.; Shen, H.-M. Luteolin, a Flavonoid with Potential for Cancer Prevention and Therapy. Curr. Cancer Drug Targets 2008, 8, 634–646. [Google Scholar] [CrossRef]
  8. Garbetta, A.; Capotorto, I.; Cardinali, A.; D’Antuono, I.; Linsalata, V.; Pizzi, F.; Minervini, F. Antioxidant activity induced by main polyphenols present in edible artichoke heads: influence of in vitro gastro-intestinal digestion. J. Funct. Foods 2014, 10, 456–464. [Google Scholar] [CrossRef]
  9. Zhao, H.E.; Liu, Z.H.; Hu, X.; Yin, J.L.; Li, W.; Rao, G.Y.; Zhang, X.H.; Huang, C.L.; Anderson, N.; Zhang, Q.X.; et al. Chrysanthemum genetic resources and related genera of Chrysanthemum collected in China. Genet. Resour. Evol. 2009, 56, 937–946. [Google Scholar] [CrossRef]
  10. Qin, M.-J.; Hong, J.-L.; He, D.-X.; Zhang, C.; Qin, M.; Shu, P.; Hong, J.; Lu, L.; He, D. Chemical Variations of the Essential Oils in Flower Heads of Chrysanthemum indicum L. from China. Chem. Biodivers. 2010, 7, 2951–2962. [Google Scholar]
  11. Guo, A.-L.; Chen, L.-M.; Wang, Y.-M.; Liu, X.-Q.; Zhang, Q.-W.; Gao, H.-M.; Wang, Z.-M.; Xiao, W.; Wang, Z.-Z.; McPhee, D.J. Influence of Sulfur Fumigation on the Chemical Constituents and Antioxidant Activity of Buds of Lonicera japonica. Molecules 2014, 19, 16640–16655. [Google Scholar] [CrossRef] [Green Version]
  12. Ding, G.; Li, B.; Han, Y.; Liu, A.; Zhang, J.; Peng, J.; Jiang, M.; Hou, Y.; Bai, G. A rapid integrated bioactivity evaluation system based on near-infrared spectroscopy for quality control of Flos Chrysanthemi. J. Pharm. Biomed. Anal. 2016, 131, 391–399. [Google Scholar] [CrossRef]
  13. Wang, D.-J.; Zhou, X.-Y.; Jin, T.-M.; Hu, X.-N.; Zhong, J.-E.; Wu, Q.-T. Application of near-infrared spectroscopy to agriculture and food analysis. Spectrosc. Spectr. Anal. 2004, 24, 447–450. [Google Scholar]
  14. Fu, H.-Y.; Huan, S.-Y.; Xu, L.; Tang, L.-J.; Jiang, J.-H.; Wu, H.-L.; Shen, G.-L.; Yu, R.-Q.; Tang, L.-J. Moving Window Partial Least-Squares Discriminant Analysis for Identification of Different Kinds of Bezoar Samples by near Infrared Spectroscopy and Comparison of Different Pattern Recognition Methods. J. Near Infrared Spectrosc. 2007, 15, 291–297. [Google Scholar] [CrossRef]
  15. Büning-Pfaue, H. Analysis of water in food by near infrared spectroscopy. Food Chem. 2003, 82, 107–115. [Google Scholar] [CrossRef]
  16. Zhang, C.; Su, J. Application of near infrared spectroscopy to the analysis and fast quality assessment of traditional Chinese medicinal products. Acta Pharm. Sin. B 2014, 4, 182–192. [Google Scholar] [CrossRef]
  17. Li, W.; Xing, L.; Fang, L.; Wang, J.; Qu, H. Application of near infrared spectroscopy for rapid analysis of intermediates of Tanreqing injection. J. Pharm. Biomed. Anal. 2010, 53, 350–358. [Google Scholar] [CrossRef]
  18. Tao, L.; Lin, Z.; Chen, J.; Wu, Y.; Liu, X. Mid-infrared and near-infrared spectroscopy for rapid detection of Gardeniae Fructus by a liquid-liquid extraction process. J. Pharm. Biomed. Anal. 2017, 145, 1–9. [Google Scholar] [CrossRef]
  19. Xiaobo, Z.; Jiewen, Z.; Povey, M.J.; Holmes, M.; Hanpin, M. Variables selection methods in near-infrared spectroscopy. Anal. Chim. Acta 2010, 667, 14–32. [Google Scholar] [CrossRef]
  20. Zhu, N.; Lin, M.; Nie, Y.; Wu, D.; Chen, K. Study on the quantitative measurement of firmness distribution maps at the pixel level inside peach pulp. Comput. Electron. Agric. 2016, 130, 48–56. [Google Scholar] [CrossRef]
  21. Ye, S.; Wang, D.; Min, S. Successive projections algorithm combined with uninformative variable elimination for spectral variable selection. Chemom. Intell. Lab. Syst. 2008, 91, 194–199. [Google Scholar] [CrossRef]
  22. Li, L.; Ustin, S.L.; Riano, D. Retrieval of Fresh Leaf Fuel Moisture Content Using Genetic Algorithm Partial Least Squares (GA-PLS) Modeling. IEEE Geosci. Sens. Lett. 2007, 4, 216–220. [Google Scholar] [CrossRef]
  23. Li, H.; Liang, Y.; Xu, Q.; Cao, D. Key wavelengths screening using competitive adaptive reweighted sampling method for multivariate calibration. Anal. Chim. Acta 2009, 648, 77–84. [Google Scholar] [CrossRef]
  24. Wu, D.; Sun, D.-W. Application of visible and near infrared hyperspectral imaging for non-invasively measuring distribution of water-holding capacity in salmon flesh. Talanta 2013, 116, 266–276. [Google Scholar] [CrossRef]
  25. Wu, D.; Sun, D.-W. Potential of time series-hyperspectral imaging (TS-HSI) for non-invasive determination of microbial spoilage of salmon flesh. Talanta 2013, 111, 39–46. [Google Scholar] [CrossRef]
  26. Han, B.; Yan, H.; Chen, C.; Yao, H.; Dai, J.; Chen, N. A rapid identification of four medicinal chrysanthemum varieties with near infrared spectroscopy. Pharmacogn. Mag. 2014, 10, 353–358. [Google Scholar] [CrossRef] [Green Version]
  27. Saariaho, A.-M.; Argyropoulos, D.S.; Jääskeläinen, A.-S.; Vuorinen, T. Development of the partial least squares models for the interpretation of the UV resonance Raman spectra of lignin model compounds. Vib. Spectrosc. 2005, 37, 111–121. [Google Scholar] [CrossRef]
  28. Huang, L.; Liu, H.; Zhang, B.; Wu, D. Application of Electronic Nose with Multivariate Analysis and Sensor Selection for Botanical Origin Identification and Quality Determination of Honey. Food Bioprocess Technol. 2015, 8, 359–370. [Google Scholar] [CrossRef]
  29. Kumar, B.M.; Karthik, S. An efficient extreme learning machine (ELM) based classification of rice crop varieties using hyper-spectral image processing. Int. J. Appl. Eng. Res. 2014, 9, 28245–28260. [Google Scholar]
  30. Liu, G.-H.; Jiang, H.; Xiao, X.-H.; Zhang, D.-J.; Mei, C.-L.; Ding, Y.-H. Determination of process variable pH in solid-state fermentation by FT-NIR spectroscopy and extreme learning machine (ELM). Spectrosc. Spectr. Anal. 2012, 32, 970–973. [Google Scholar]
  31. Shi, H.; Lu, Y.; Du, J.; Du, W.; Ye, X.; Yu, X.; Ma, J.; Cheng, J.; Gao, Y.; Cao, Y.; et al. Application of Back Propagation Artificial Neural Network on Genetic Variants in Adiponectin ADIPOQ, Peroxisome Proliferator-Activated Receptor-γ, and Retinoid X Receptor-α Genes and Type 2 Diabetes Risk in a Chinese Han Population. Diabetes Technol. Ther. 2012, 14, 293–300. [Google Scholar] [CrossRef] [Green Version]
  32. Barma, S.D.; Das, B.; Giri, A.; Majumder, S.; Bose, P.K. Back propagation artificial neural network (BPANN) based performance analysis of diesel engine using biodiesel. J. Renew. Sustain. Energy 2011, 3, 13101. [Google Scholar] [CrossRef]
  33. Karegowda, A.G.; Nasiha, A.; Jayaram, M.; Manjunath, A. Exudates Detection in Retinal Images using Back Propagation Neural Network. Int. J. Comput. Appl. 2011, 25, 25–31. [Google Scholar] [CrossRef]
Figure 1. Raw spectra of Chrysanthemum measured by the Matrix Duplex NIR system working in the wavenumber range of 12,000 cm−1 to 4000 cm−1.
Sensors 19 01981 g001
Figure 2. Sensitive variables selected by different methods for prediction of (a) chlorogenic acid, (b) luteoloside, and (c) 3,5-O-dicaffeoylquinic acid.
Sensors 19 01981 g002
Figure 3. Results of CARS-BP-ANN models in the prediction set for prediction of (a) chlorogenic acid, (b) luteoloside, and (c) 3,5-O-dicaffeoylquinic acid.
Sensors 19 01981 g003
Table 1. Referent contents of Chlorogenic acid, luteoloside, and 3,5-O-dicaffeoylquinic acid in Chrysanthemum determined by HPLC.
Calibration SetPrediction Set
Range (%)Mean (%)S.D. 1Range (%)Mean (%)S.D.
Chlorogenic acid0.388–0.9610.6480.1210.390–0.9500.6600.121
Luteoloside0.255–0.5520.3880.0630.258–0.5450.3870.066
3,5-O-dicaffeoylquinic acid0.985–1.8391.5060.1891.193–1.8381.4990.185
1 Standard deviation.
Table 2. Results of PLS models with different data preprocessing methods.
QualityPreprocessingNumber of Latent VariablesCalibrationPrediction
rc2RMSECrp2RMSEPSlopeBiasRPD
Chlorogenic AcidNone90.9060.0360.7970.0540.775−0.0142.241
MAS60.8410.0470.8410.0470.727−0.0112.574
SG60.8390.0470.8430.0470.728−0.0102.574
SNV70.8760.0410.7620.0590.756−0.0172.051
MSC90.8780.0410.7670.0570.768−0.0172.123
1-Der50.8820.0400.7400.0610.738−0.0091.984
Detrend70.8690.0420.8080.0520.773−0.0142.327
LuteolosideNone130.9760.0090.7280.0340.7530.0041.941
MAS110.9100.0180.7380.0330.734−0.0042.000
SG110.9010.0190.7410.0330.7540.0012.000
SNV120.9740.0100.7410.0330.7610.0052.000
MSC100.9490.0140.7280.0340.7480.0041.941
1-Der80.9180.0180.6500.0390.624−0.0061.692
Detrend110.9640.0120.6910.0360.7310.0031.833
3,5-O-dicaffeoylquinic acidNone100.9200.0530.8430.0720.8420.0122.569
MAS100.9180.0540.8320.0750.8380.0142.467
SG100.8760.0660.8150.0780.7930.0112.372
SNV80.8460.0730.7660.0880.754−0.0042.102
MSC90.9080.0570.8230.0770.831−0.0022.403
1-Der50.8030.0830.6050.1140.791−0.0031.623
Detrend90.9180.0540.8140.0790.8430.0152.342
Table 3. Results of different regression methods based on sensitive variables for chlorogenic acid, luteoloside, and 3,5-O-dicaffeoylquinic acid.
QualityPreprocessingVariable Selection MethodsModelsCalibrationPrediction
rc2RMSECrp2RMSEPRPD
Chlorogenic AcidSGSPAPLS0.8590.0440.8430.0472.574
ELM0.8460.0460.8760.0472.574
BP-ANN0.8890.0390.8570.0472.574
GAPLSPLS0.9100.0350.8410.0482.521
ELM0.8780.0410.8340.0522.327
BP-ANN0.8850.0390.8740.0442.750
CARSPLS0.9700.0200.8990.0383.184
ELM0.9720.0200.8820.0412.951
BP-ANN0.9640.0220.9240.0333.667
LuteolosideSNVSPAPLS0.8030.0270.7360.0332.000
ELM0.8560.0230.7380.0332.000
BP-ANN0.8340.0250.7830.0312.129
GAPLSPLS0.8010.0270.7590.0322.063
ELM0.6480.0360.7330.0361.833
BP-ANN0.8460.0240.8140.0282.357
CARSPLS0.9760.0090.9100.0203.300
ELM0.9980.0000.8190.0411.610
BP-ANN0.9550.0130.9270.0183.667
3,5-O-dicaffeoylquinic acidNone SPAPLS0.8080.0820.7710.0872.126
ELM0.8430.0740.8080.0832.229
BP-ANN0.8480.0740.8500.0722.569
GAPLSPLS0.8690.0680.8560.0692.681
ELM0.9040.0580.8780.0652.846
BP-ANN0.9060.0580.9080.0563.304
CARSPLS0.9740.0310.9270.0493.776
ELM0.9490.0420.8930.0642.891
BP-ANN0.9620.0390.9330.0642.891

