Novel Surface-Enhanced Raman Spectroscopy Techniques for DNA, Protein and Drug Detection

Abstract
1. Introduction
2. SERS for DNA Detection
2.1. SERS in the Detection of Microbe-Related DNA Targets for Food Safety
2.1.1. Sandwich Detection Method
2.1.2. Amplification Method
2.2. SERS in the Detection of Disease-Related DNA Targets for Clinical Diagnosis
2.2.1. DNA Hybridization Method
2.2.2. Asymmetry Signal Amplification Method
2.2.3. Gene Chips Method
3. SERS for Protein Detection
3.1. SERS in the Detection of Protein in the Blood for Clinical Diagnosis
3.2. SERS in the Detection of Disease-Related Protein Markers for Clinical Diagnosis
4. SERS for Drug Detection
4.1. SERS in the Detection of Illegally Added Drugs for Drug Safety
4.1.1. Direct Detection Method
4.1.2. SERS Combined with Separation Technology
4.2. SERS in the Detection of Drugs in Bodily Fluid for In Vivo Illegal Drugs Analysis
4.3. SERS in the Detection of Drug Concentration for Medication Guides
5. Conclusions and Perspectives
Author Contributions
Funding
Conflicts of Interest
References
- Fleischmann, M.; Hendra, P.J.; Mcquillan, A.J. Raman Spectra of pyridzne adsorbed at a silver electrode. Chem. Phys. Lett. 1974, 26, 163–166. [Google Scholar] [CrossRef]
- Albrecht, M.G.; Creighton, J.A. Anomalously intense Raman spectra of pyridine at a silver electrode. J. Am. Chem. Soc. 1977, 99, 5215–5217. [Google Scholar] [CrossRef]
- Zhang, X.; Zheng, Y.; Liu, X.; Lu, W.; Dai, J.; Lei, D.Y.; MacFarlane, D.R. Hierarchical porous plasmonic metamaterials for reproducible ultrasensitive Surface-enhanced Raman spectroscopy. Adv. Mater. 2015, 27, 1090–1096. [Google Scholar] [CrossRef]
- Kurouski, D.; Van Duyne, R.P. In situ detection and identification of hair dyes using Surface enhanced Raman spectroscopy (SERS). Anal. Chem. 2015, 87, 2901–2906. [Google Scholar] [CrossRef]
- Sharma, B.; Bugga, P.; Madison, L.R.; Henry, A.I.; Blaber, M.G.; Greeneltch, N.G.; Chiang, N.; Mrksich, M.; Schatz, G.C.; Van Duyne, R.P. Bisboronic acids for selective, physiologically relevant direct glucose sensing with Surface-enhanced Raman spectroscopy. J. Am. Chem. Soc. 2016, 138, 13952–13959. [Google Scholar] [CrossRef] [PubMed]
- Gruenke, N.L.; Fernanda Cardinal, M.; McAnally, M.O.; Frontiera, R.R.; Schatz, G.C.; Van Duyne, R.P. Ultrafast and nonlinear Surface-enhanced Raman spectroscopy. Chem. Soc. Rev. 2016, 45, 2263–2290. [Google Scholar] [CrossRef] [PubMed]
- Bernd Walkenfort, V.T.; König, M.; Salehi, M.; Schlücker, S. Rapid, quantitative, and ultrasensitive point-of-care Ttesting: A portable SERS reader for lateral flow assays in clinical chemistry. Angew. Chem. Int. Ed. 2019, 58, 442–446. [Google Scholar]
- Jensen, T.; Kelly, L.; Lazarides, A.; Schatz, G.C. Electrodynamics of noble metal nanoparticles and nanoparticle clusters. J. Clust. Sci. 1999, 10, 295–317. [Google Scholar] [CrossRef]
- Otto, A. The ‘chemical’ (electronic) contribution to surface-enhanced Raman scattering. J. Raman. Spectrosc. 2005, 36, 497–509. [Google Scholar] [CrossRef]
- Qian, Y.; Fan, T.; Yao, Y.; Shi, X.; Liao, X.; Zhou, F.; Gao, F. Label-free and Raman dyes-free Surface-enhanced Raman spectroscopy for detection of DNA. Sens. Actuators B 2018, 254, 483–489. [Google Scholar] [CrossRef]
- Pu, H.; Xie, X.; Sun, D.; Wei, Q.; Jiang, Y. Double strand DNA functionalized Au@Ag Nps for ultrasensitive detection of 17β-estradiol using Surface-enhanced Raman spectroscopy. Talanta 2019, 195, 419–425. [Google Scholar] [CrossRef]
- Cialla-May, D.; Zheng, X.S.; Weber, K.; Popp, J. Recent progress in surface-enhanced Raman spectroscopy for biological and biomedical applications: from cells to clinics. Chem. Soc. Rev. 2017, 46, 3945–3961. [Google Scholar] [CrossRef]
- He, S.; Kyaw, Y.M.E.; Tan, E.K.M.; Bekale, L.; Kang, M.W.C.; Kim, S.S.Y.; Tan, I.; Lam, K.P.; Kah, J.C.Y. Quantitative and label-free detection of protein kinase a activity based on Surface-enhanced Raman spectroscopy with gold nanostars. Anal. Chem. 2018, 90, 6071–6080. [Google Scholar] [CrossRef] [PubMed]
- Garcia-Rico, E.; Alvarez-Puebla, R.A.; Guerrini, L. Direct surface-enhanced Raman scattering (SERS) spectroscopy of nucleic acids: from fundamental studies to real-life applications. Chem. Soc. Rev. 2018, 47, 4909–4923. [Google Scholar] [CrossRef]
- Puppels, G.J.; Otto, C.; Greve, J. Raman microspectroscopic study of low-pH-induced changes in DNA structure of polytene chromosomes. Biochemistry 1994, 33, 3386–3395. [Google Scholar] [CrossRef]
- Lee, W.Y.; Weinberg, O.K.; Evans, A.G.; Pinkus, G.S. Loss of full-length GATA1 expression in megakaryocytes is a sensitive and specific immunohistochemical marker for the diagnosis of myeloid proliferative disorder related to down syndrome. Am. J. Clin. Pathol. 2018, 149, 300–309. [Google Scholar] [CrossRef] [PubMed]
- Rai, N.; Venugopalan, G.; Pradhan, R.; Ambastha, A.; Upadhyay, A.D.; Dwivedi, S.; Dey, A.B.; Dey, S. Exploration of novel anti-oxidant protein sestrin in frailty syndrome in elderly. Aging Dis. 2018, 9, 220–227. [Google Scholar] [CrossRef]
- Zabel, M.; Nackenoff, A.; Kirsch, W.M.; Harrison, F.E.; Perry, G.; Schrag, M. Markers of oxidative damage to lipids, nucleic acids and proteins and antioxidant enzymes activities in Alzheimer’s disease brain: A meta-analysis in human pathological specimens. Free Radical Biol. Med. 2018, 115, 351–360. [Google Scholar] [CrossRef] [PubMed]
- Cailletauda, J.; De Bleyea, C.; Dumonta, E.; Sacréa, P.Y.; Netchacovitcha, L.; Gutb, Y.; Boiretc, M.; Ginotb, Y.M.; Huberta, P.; Ziemonsa, E. Critical review of surface-enhanced Raman spectroscopy applications in the pharmaceutical field. J. Pharmaceut. Biomed. 2018, 147, 458–472. [Google Scholar] [CrossRef]
- Liu, H.; Zhou, X.; Liu, W.; Yang, X.; Xing, D. Paper-based bipolar electrode electrochemiluminescence switch for label-free and sensitive genetic detection of pathogenic bacteria. Anal. Chem. 2016, 88, 10191–10197. [Google Scholar] [CrossRef]
- Petralia, S.; Sciuto, E.L.; Di Pietro, M.L.; Zimbone, M.; Grimaldi, M.G.; Conoci, S. An innovative chemical strategy for PCR-free genetic detection of pathogens by an integrated electrochemical biosensor. Analyst 2017, 142, 2090–2093. [Google Scholar] [CrossRef]
- Morla-Folch, J.; Alvarez-Puebla, R.A.; Guerrini, L. Direct quantification of DNA base composition by Surface-enhanced Raman scattering spectroscopy. J. Phys. Chem. Lett. 2016, 7, 3037–3041. [Google Scholar] [CrossRef]
- Panikkanvalappil, S.R.; Mackey, M.A.; El-Sayed, M.A. Probing the unique dehydration-induced structural modifications in cancer cell DNA using Surface enhanced Raman spectroscopy. J. Am. Chem. Soc. 2013, 135, 4815–4821. [Google Scholar] [CrossRef]
- Xu, L.J.; Lei, Z.C.; Li, J.; Zong, C.; Yang, C.J.; Ren, B. Label-free Surface-enhanced Raman spectroscopy detection of DNA with single-base sensitivity. J. Am. Chem. Soc. 2015, 137, 5149–5154. [Google Scholar] [CrossRef]
- Bell, S.E.J.; Sirimuthu, N.M.S. Surface-enhanced Raman spectroscopy (SERS) for sub-micromolar detection of DNA/RNA mononucleotides. J. Am. Chem. Soc. 2006, 128, 15580–15581. [Google Scholar] [CrossRef]
- Qi, J.; Zeng, J.; Zhao, F.; Lin, S.H.; Raja, B.; Strych, U.; Willson, R.C.; Shih, W.C. Label-free, in situ SERS monitoring of individual DNA hybridization in microfluidics. Nanoscale 2014, 6, 8521–8526. [Google Scholar] [CrossRef]
- Ming, L.; Scott, K.C.; Hongyan, L.; Savan, S.; Dongling, M.; Nianqiang, W. Plasmonic nanorice antenna on triangle nanoarray for Surface-enhanced Raman scattering detection of Hepatitis B Virus DNA. Anal. Chem. 2013, 85, 2072–2078. [Google Scholar]
- Lin, D.; Gong, T.; Hong, Z.Y.; Qiu, S.; Pan, J.; Tseng, C.Y.; Feng, S.; Chen, R.; Voon Kong, K. Metal carbonyls for the biointerference-free ratiometric Surface-enhanced Raman spectroscopy-based assay for cell-free circulating DNA of epstein-barr virus in blood. Anal. Chem. 2018, 90, 7139–7147. [Google Scholar] [CrossRef]
- Meng, X.; Wang, H.; Chen, N.; Ding, P.; Shi, H.; Zhai, X.; Su, Y.; He, Y. A graphene-silver nanoparticle-silicon sandwich SERS chip for quantitative detection of molecules and capture, discrimination, and inactivation of bacteria. Anal. Chem. 2018, 90, 5646–5653. [Google Scholar] [CrossRef]
- Han, B.; Zhang, Y.L.; Zhu, L.; Chen, X.H.; Ma, Z.C.; Zhang, X.L.; Wang, J.N.; Wang, W.; Liu, Y.Q.; Chen, Q.D.; et al. Direct laser scribing of AgNPs@RGO biochip as a reusable SERS sensor for DNA detection. Sens. Actuators B Chem. 2018, 270, 500–507. [Google Scholar] [CrossRef]
- Guselnikova, O.; Postnikov, P.; Pershina, A.; Svorcik, V.; Lyutakov, O. Express and portable label-free DNA detection and recognition with SERS platform based on functional Au grating. Appl. Surf. Sci. 2019, 470, 219–227. [Google Scholar] [CrossRef]
- Guerrini, L.; Krpetić, Ž.; van Lierop, D.; Alvarez-Puebla, R.A.; Graham, D. Direct Surface-enhanced Raman scattering analysis of DNA duplexes. Angew. Chem. Int. Ed. 2015, 54, 1144–1148. [Google Scholar] [CrossRef] [PubMed]
- Panikkanvalappil, S.R.; Mahmoud, M.A.; Mackey, M.A.; El-Sayed, M.A. Surface-enhanced Raman spectroscopy for real-time monitoring of reactive oxygen species-induced DNA damage and its prevention by platinum nanoparticles. ACS Nano 2013, 7, 7524–7533. [Google Scholar] [CrossRef]
- Cao, Y.W.C.; Jin, R.C.; Mirkin, C.A. Nanoparticles with Raman spectroscopic fingerprints for DNA and RNA detection. Science 2002, 297, 1536–1540. [Google Scholar] [CrossRef] [PubMed]
- Li, J.M.; Wei, C.; Ma, W.F.; An, Q.; Guo, J.; Hu, J.; Wang, C.C. Multiplexed SERS detection of DNA targets in a sandwich-hybridization assay using SERS-encoded core-shell nanospheres. J. Mater. Chem. 2012, 22, 12100–12106. [Google Scholar] [CrossRef]
- Zhang, H.; Ma, X.; Liu, Y.; Duan, N.; Wu, S.; Wang, Z.; Xu, B. Gold nanoparticles enhanced SERS aptasensor for the simultaneous detection of Salmonella typhimurium and Staphylococcus aureus. Biosens. Bioelectron. 2015, 74, 872–877. [Google Scholar] [CrossRef]
- Dougan, J.A.; MacRae, D.; Graham, D.; Faulds, K. DNA detection using enzymatic signal production and SERS. Chem. Commun. 2011, 47, 4649–4651. [Google Scholar] [CrossRef] [PubMed]
- Isola, N.R.; Stokes, D.L.; Vo-Dinh, T. Surface-enhanced Raman gene probe for HIV detection. Anal. Chem. 1998, 70, 1352–1356. [Google Scholar] [CrossRef] [PubMed]
- Chen, K.; Wu, L.; Jiang, X.; Lu, Z.; Han, H. Target triggered self-assembly of Au nanoparticles for amplified detection of Bacillus thuringiensis transgenic sequence using SERS. Biosens. Bioelectron. 2014, 62, 196–200. [Google Scholar] [CrossRef] [PubMed]
- Guven, B.; Boyaci, I.H.; Tamer, U.; Acar-Soykut, E.; Dogan, U. Development of rolling circle amplification based Surface-enhanced Raman spectroscopy method for 35S promoter gene detection. Talanta 2015, 136, 68–74. [Google Scholar] [CrossRef]
- Ma, H.; Liu, J.; Monsur Ali, M.; Arif Iftakher Mahmood, M.; Labanieh, L.; Lu, M.; Iqbal, S.M.; Zhang, Q.; Zhao, W.; Wan, Y. Nucleic acid aptamers in cancer research, diagnosis and therapy. Chem. Soc. Rev. 2015, 44, 1240–1256. [Google Scholar] [CrossRef]
- Du, Y.; Dong, S. Nucleic acid biosensors: Recent advances and perspectives. Anal. Chem. 2017, 89, 189–215. [Google Scholar] [CrossRef]
- Xiang, D.; Shigdar, S.; Qiao, G.; Wang, T.; Kouzani, A.Z.; Zhou, S.; Kong, L.; Li, Y.; Pu, C.; Duan, W. Nucleic acid aptamer-guided cancer therapeutics and diagnostics: The next generation of cancer medicine. Theranostics 2015, 5, 23–42. [Google Scholar] [CrossRef]
- Barhoumi, A.; Halas, N.J. Label-free detection of DNA hybridization using Surface enhanced Raman spectroscopy. J. Am. Chem. Soc. 2010, 132, 12792–12793. [Google Scholar] [CrossRef]
- Karaballi, R.A.; Nel, A.; Krishnan, S.; Blackburn, J.; Brosseau, C.L. Development of an electrochemical Surface-enhanced Raman spectroscopy (EC-SERS) aptasensor for direct detection of DNA hybridization. Phys. Chem. Chem. Phys. 2015, 17, 21356–21363. [Google Scholar] [CrossRef]
- Johnson, R.P.; Richardson, J.A.; Brown, T.; Bartlett, P.N. A label-free, electrochemical SERS-based assay for detection of DNA hybridization and discrimination of mutations. J. Am. Chem. Soc. 2012, 134, 14099–14107. [Google Scholar] [CrossRef]
- Ngo, H.T.; Wang, H.N.; Fales, A.M.; Nicholson, B.P.; Woods, C.W.; Vo-Dinh, T. DNA bioassay-on-chip using SERS detection for dengue diagnosis. Analyst 2014, 139, 5655–5659. [Google Scholar] [CrossRef]
- Wabuyele, M.B.; Vo-Dinh, T. Detection of human immunodeficiency virus type 1 DNA sequence using plasmonics nanoprobes. Anal. Chem. 2005, 77, 7810–7815. [Google Scholar] [CrossRef]
- Hu, J.; Zhang, C.Y. Single base extension reaction-based surface enhanced Raman spectroscopy for DNA methylation assay. Biosens. Bioelectron. 2012, 31, 451–457. [Google Scholar] [CrossRef]
- Ye, S.; Wu, Y.; Zhai, X.; Tang, B. Asymmetric signal amplification for simultaneous SERS detection of multiple cancer markers with significantly different levels. Anal. Chem. 2015, 87, 8242–8249. [Google Scholar] [CrossRef]
- Kang, T.; Yoo, S.M.; Yoon, I.; Lee, S.Y.; Kim, B. Patterned multiplex pathogen DNA detection by Au particle-on-wire SERS sensor. Nano Lett. 2010, 10, 1189–1193. [Google Scholar] [CrossRef]
- Gracie, K.; Lindsay, D.; Graham, D.; Faulds, K. Bacterial meningitis pathogens identified in clinical samples using a SERS DNA detection assay. Anal. Methods 2015, 7, 1269–1272. [Google Scholar] [CrossRef]
- Park, T.; Lee, S.; Seong, G.H.; Choo, J.; Lee, E.K.; Kim, Y.S.; Ji, W.H.; Hwang, S.Y.; Gweon, D.G.; Lee, S. Highly sensitive signal detection of duplex dye-labelled DNA oligonucleotides in a PDMS microfluidic chip: confocal surface-enhanced Raman spectroscopic study. Lab Chip 2005, 5, 437–442. [Google Scholar] [CrossRef]
- Fritzsche, W.; Andrew Taton, T. Metal nanoparticles as labels for heterogeneous, chip-based DNA detection. Nanotechnology 2003, 14, 63–73. [Google Scholar] [CrossRef]
- Zhang, K.; Hao, C.; Man, B.; Zhang, C.; Yang, C.; Liu, M.; Peng, Q.; Chen, C. Diagnosis of liver cancer based on tissue slice surface enhanced Raman spectroscopy and multivariate analysis. Vib. Spectrosc. 2018, 98, 82–87. [Google Scholar] [CrossRef]
- Masetti, M.; Xie, H.N.; Krpetic, Z.; Recanatini, M.; Alvarez-Puebla, R.A.; Guerrini, L. Revealing DNA interactions with exogenous agents by Surface-enhanced Raman scattering. J. Am. Chem. Soc. 2015, 137, 469–476. [Google Scholar] [CrossRef]
- Kahraman, M.; Wachsmann-Hogiu, S. Label-free and direct protein detection on 3D plasmonic nanovoid structures using surface-enhanced Raman scattering. Anal. Chim. Acta 2015, 856, 74–81. [Google Scholar] [CrossRef]
- Han, X.X.; Huang, G.G.; Zhao, B.; Ozaki, Y. Label-free highly sensitive detection of proteins in aqueous solutions using Surface-enhanced Raman scattering. Anal. Chem. 2009, 81, 3329–3333. [Google Scholar] [CrossRef]
- Shin, M.H.; Hong, W.; Sa, Y.; Chen, L.; Jung, Y.J.; Wang, X.; Zhao, B.; Jung, Y.M. Multiple detection of proteins by SERS-based immunoassay with core shell magnetic gold nanoparticles. Vib. Spectrosc. 2014, 72, 44–49. [Google Scholar] [CrossRef]
- Lopez, A.; Lovato, F.; Oh, S.H.; Lai, Y.H.; Filbrun, S.; Driskell, E.A.; Driskell, J.D. SERS immunoassay based on the capture and concentration of antigen-assembled gold nanoparticles. Talanta 2016, 146, 388–393. [Google Scholar] [CrossRef]
- Sakamoto, Y.; Kokudo, N.; Matsuyama, Y.; Sakamoto, M.; Izumi, N.; Kadoya, M.; Kaneko, S.; Ku, Y.; Kudo, M.; Takayama, T.; et al. Proposal of a new staging system for intrahepatic cholangiocarcinoma: Analysis of surgical patients from a nationwide survey of the liver cancer study group of Japan. Cancer 2016, 122, 61–70. [Google Scholar] [CrossRef]
- Smith, R.A.; Andrews, K.S.; Brooks, D.; Fedewa, S.A.; Manassaram-Baptiste, D.; Saslow, D.; Brawley, O.W.; Wender, R.C. Cancer screening in the United States, 2018: A review of current American cancer society guidelines and current issues in cancer screening. CA Cancer J. Clin. 2018, 68, 297–316. [Google Scholar] [CrossRef]
- Schaub, F.X.; Dhankani, V.; Berger, A.C.; Trivedi, M.; Richardson, A.B.; Shaw, R.; Zhao, W.; Zhang, X.; Ventura, A.; Liu, Y.; et al. Pan-cancer alterations of the MYC oncogene and its proximal network across the cancer genome atlas. Cell Syst. 2018, 6, 282–300. [Google Scholar] [CrossRef]
- Krishnan, S.; Mani, V.; Wasalathanthri, D.; Kumar, C.V.; Rusling, J.F. Attomolar detection of a cancer biomarker protein in serum by Surface Plasmon Resonance using superparamagnetic particle labels. Angew. Chem. Int. Ed. 2011, 50, 1175–1178. [Google Scholar] [CrossRef]
- Hernández, J.; Thompson, I.M. Prostate-specific antigen: A review of the validation of the most commonly used cancer biomarker. Cancer 2004, 101, 894–904. [Google Scholar] [CrossRef]
- Chikkaveeraiah, B.V.; Bhirde, A.A.; Morgan, N.Y.; Eden, H.S.; Chen, X. Electrochemical immunosensors for detection of cancer protein biomarkers. ACS Nano 2012, 6, 6546–6561. [Google Scholar] [CrossRef]
- Jensen, G.C.; Krause, C.E.; Sotzing, G.A.; Rusling, J.F. Inkjet-printed gold nanoparticle electrochemical arrays on plastic. Application to immunodetection of a cancer biomarker protein. Phys. Chem. Chem. Phys. 2011, 13, 4888–4894. [Google Scholar] [CrossRef]
- Cervo, S.; Mansutti, E.; Del Mistro, G.; Spizzo, R.; Colombatti, A.; Steffan, A.; Sergo, V.; Bonifacio, A. SERS analysis of serum for detection of early and locally advanced breast cancer. Anal. Bioanal. Chem. 2015, 407, 7503–7509. [Google Scholar] [CrossRef]
- Feng, S.; Chen, R.; Lin, J.; Pan, J.; Chen, G.; Li, Y.; Cheng, M.; Huang, Z.; Chen, J.; Zeng, H. Nasopharyngeal cancer detection based on blood plasma surface-enhanced Raman spectroscopy and multivariate analysis. Biosens. Bioelectron. 2010, 25, 2414–2419. [Google Scholar] [CrossRef]
- Lin, J.; Chen, R.; Feng, S.; Pan, J.; Li, Y.; Chen, G.; Cheng, M.; Huang, Z.; Yu, Y.; Zeng, H. A novel blood plasma analysis technique combining membrane electrophoresis with silver nanoparticle-based SERS spectroscopy for potential applications in noninvasive cancer detection. Nanomed. Nanotechnol. 2011, 7, 655–663. [Google Scholar] [CrossRef]
- Campos, A.R.; Gao, Z.; Blaber, M.G.; Huang, R.; Schatz, G.C.; Van Duyne, R.P.; Haynes, C.L. Surface-enhanced Raman spectroscopy detection of Ricin B chain in human blood. J. Phys. Chem. C 2016, 120, 20961–20969. [Google Scholar] [CrossRef]
- Grubisha, D.S.; Lipert, R.J.; Park, H.Y.; Driskell, J.; Porter, M.D. Femtomolar detection of prostate-specific antigen: An immunoassay based on Surface-enhanced Raman scattering and immunogold labels. Anal. Chem. 2003, 75, 5936–5943. [Google Scholar] [CrossRef]
- Borrebaeck, C.A.K. Antibodies in diagnostics-from immunoassays to protein chips. Immunol. Today 2000, 21, 379–382. [Google Scholar] [CrossRef]
- Jiang, X.; Ng, J.M.K.; Stroock, A.D.; Dertinger, S.K.W.; Whitesides, G.M. A miniaturized, parallel, serially diluted immunoassay for analyzing multiple antigens. J. Am. Chem. Soc. 2003, 125, 5294–5529. [Google Scholar] [CrossRef]
- Granger, J.H.; Granger, M.C.; Firpo, M.A.; Mulvihill, S.J.; Porter, M.D. Toward development of a surface-enhanced Raman scattering (SERS)-based cancer diagnostic immunoassay panel. Analyst 2013, 138, 410–416. [Google Scholar] [CrossRef]
- Chon, H.; Lee, S.; Yoon, S.Y.; Chang, S.I.; Lim, D.W.; Choo, J. Simultaneous immunoassay for the detection of two lung cancer markers using functionalized SERS nanoprobes. Chem. Commun. 2011, 47, 12515–12517. [Google Scholar] [CrossRef]
- Dinish, U.S.; Balasundaram, G.; Chang, Y.T.; Olivo, M. Sensitive multiplex detection of serological liver cancer biomarkers using SERS-active photonic crystal fiber probe. J. Biophotonics 2014, 7, 956–965. [Google Scholar] [CrossRef]
- Feng, J.; Wu, X.; Ma, W.; Kuang, H.; Xu, L.; Xu, C. A SERS active bimetallic core-satellite nanostructure for the ultrasensitive detection of Mucin-1. Chem. Commun. 2015, 51, 14761–14763. [Google Scholar] [CrossRef]
- He, J.; Li, G.; Hu, Y. Aptamer recognition induced target-bridged strategy for proteins detection based on magnetic chitosan and silver/chitosan nanoparticles using Surface-enhanced Raman spectroscopy. Anal. Chem. 2015, 87, 11039–11047. [Google Scholar] [CrossRef]
- Kast, R.; Auner, G.; Yurgelevic, S.; Broadbent, B.; Raghunathan, A.; Poisson, L.M.; Mikkelsen, T.; Rosenblum, M.L.; Kalkanis, S.N. Identification of regions of normal grey matter and white matter from pathologic glioblastoma and necrosis in frozen sections using Raman imaging. J. Neurooncol. 2015, 125, 287–295. [Google Scholar] [CrossRef]
- Del Mistro, G.; Cervo, S.; Mansutti, E.; Spizzo, R.; Colombatti, A.; Belmonte, P.; Zucconelli, R.; Steffan, A.; Sergo, V.; Bonifacio, A. Surface-enhanced Raman spectroscopy of urine for prostate cancer detection: A preliminary study. Anal. Bioanal. Chem. 2015, 407, 3271–3275. [Google Scholar] [CrossRef]
- Fang, H.; Zhang, X.; Zhang, S.J.; Liu, L.; Zhao, Y.M.; Xu, H.J. Ultrasensitive and quantitative detection of paraquat on fruits skins via surface-enhanced Raman spectroscopy. Sens. Actuators B Chem. 2015, 213, 452–456. [Google Scholar] [CrossRef]
- Pratiwi, D.; Fawcett, J.P.; Gordonb, K.C.; Rades, T. Quantitative analysis of polymorphic mixtures of ranitidine hydrochloride by Raman spectroscopy and principal components analysis. Eur. J. Pharm. Biopharm. 2002, 54, 337–341. [Google Scholar] [CrossRef]
- Chen, P.; Wang, Z.; Zong, S.; Zhu, D.; Chen, H.; Zhang, Y.; Wu, L.; Cui, Y. pH-sensitive nanocarrier based on gold/silver core-shell nanoparticles decorated multi-walled carbon manotubes for tracing drug release in living cells. Biosens. Bioelectron. 2016, 75, 446–451. [Google Scholar] [CrossRef]
- Huang, S.; Tung, C.; Fulop, F.; Li, J. Developing a QSAR model for hepatotoxicity screening of the active compounds in traditional Chinese medicines. Food Chem. Toxicol. 2015, 78, 71–77. [Google Scholar] [CrossRef]
- Yang, W.; Zhang, Y.; Wu, W.; Huang, L.; Guo, D.; Liu, C. Approaches to establish Q-markers for the quality standards of traditional Chinese medicines. Acta Pharm. Sin. B 2017, 7, 439–446. [Google Scholar] [CrossRef]
- Liu, S.; Liang, Y.; Liu, H. Chemometrics applied to quality control and metabolomics for traditional Chinese medicines. J. Chromatogr. B 2016, 1015, 82–91. [Google Scholar] [CrossRef]
- Wang, W.; Lin, P.; Ma, L.; Xu, K.; Lin, X. Separation and determination of flavonoids in three traditional chinese medicines by capillary electrophoresis with amperometric detection. J. Sep. Sci. 2016, 39, 1357–1362. [Google Scholar] [CrossRef]
- Jiang, X.; Qin, X.; Yin, D.; Gong, M.; Yang, L.; Zhao, B.; Ruan, W. Rapid monitoring of benzylpenicillin sodium using Raman and surface enhanced Raman spectroscopy. Spectrochim. Acta Part A Mol. Biomol. Spectrosc. 2015, 140, 474–478. [Google Scholar] [CrossRef]
- Zhang, L.; Jin, Y.; Mao, H.; Zheng, L.; Zhao, J.; Peng, Y.; Du, S.; Zhang, Z. Structure-selective hot-spot Raman enhancement for direct identification and detection of trace penicilloic acid allergen in penicillin. Biosens. Bioelectron. 2014, 58, 165–171. [Google Scholar] [CrossRef]
- Pavel, I.; Cota, S.; Cîntǎ-Pînzaru, S.; Kiefe, W. Raman, Surface enhanced Raman spectroscopy, and DFT calculations: A powerful approach for the identification and characterization of 5-fluorouracil anticarcinogenic drug Species. J. Phys. Chem. A 2005, 109, 9945–9952. [Google Scholar] [CrossRef]
- Zhang, Y.; Huang, X.; Liu, W.; Chen, Z.; Chen, C.; Yin, L. Analysis of drugs illegally added into Chinese traditional patent medicine using Surface-enhanced Raman Scattering. Anal. Sci. 2013, 29, 985–990. [Google Scholar] [CrossRef]
- Mao, H.; Qi, M.; Zhou, Y.; Huang, X.; Zhang, L.; Jin, Y.; Peng, Y.; Du, S. Discrimination of sibutramine and its analogues based on surface-enhanced Raman spectroscopy and chemometrics: Toward the rapid detection of synthetic anorexic drugs in natural slimming products. RSC Adv. 2015, 5, 5886–5894. [Google Scholar] [CrossRef]
- Brosseau, C.L.; Gambardella, A.; Casadio, F.; Grzywacz, C.M.; Wouters, J.; Duyne, R.P.V. Ad-hoc Surface-enhanced Raman spectroscopy methodologies for the detection of artist dyestuffs: thin layer chromatography-Surface enhanced Raman spectroscopy and in situ on the fiber analysis. Anal. Chem. 2009, 81, 3056–3062. [Google Scholar] [CrossRef]
- Li, D.; Qu, L.; Zhai, W.; Xue, J.; Fossey, J.S.; Long, Y. Facile on-site detection of substituted aromatic pollutants in water using thin layer chromatography combined with Surface-enhanced Raman spectroscopy. Environ. Sci. Technol. 2011, 45, 4046–4052. [Google Scholar] [CrossRef]
- Lv, D.; Cao, Y.; Lou, Z.; Li, S.; Chen, X.; Chai, Y.; Lu, F. Rapid on-site detection of ephedrine and its analogues used as adulterants in slimming dietary supplements by TLC-SERS. Anal. Bioanal. Chem. 2015, 407, 1313–1325. [Google Scholar] [CrossRef]
- Zhu, Q.; Cao, Y.; Cao, Y.; Chai, Y.; Lu, F. Rapid on-site TLC-SERS detection of four antidiabetes drugs used as adulterants in botanical dietary supplements. Anal. Bioanal. Chem. 2014, 406, 1877–1884. [Google Scholar] [CrossRef]
- Fang, F.; Qi, Y.; Lu, F.; Yang, L. Highly sensitive on-site detection of drugs adulterated in botanical dietary supplements using thin layer chromatography combined with dynamic surface enhanced Raman spectroscopy. Talanta 2016, 146, 351–357. [Google Scholar] [CrossRef]
- Han, Z.; Liu, H.; Meng, J.; Yang, L.; Liu, J.; Liu, J. Portable kit for identification and detection of drugs in human urine using Surface-enhanced Raman spectroscopy. Anal. Chem. 2015, 87, 9500–9506. [Google Scholar] [CrossRef]
- Dong, R.; Weng, S.; Yang, L.; Liu, J. Detection and direct readout of drugs in human urine using dynamic Surface-enhanced Raman spectroscopy and support vector machines. Anal. Chem. 2015, 87, 2937–2944. [Google Scholar] [CrossRef]
- Zhang, M.L.; Hasi, W.L.J.; Lin, X.; Zhao, X.R.; Lou, X.T.; Han, S.; Lin, D.Y.; Lu, Z.W. Rapid and simple detection of pethidine hydrochloride injection using surface-enhanced Raman spectroscopy based on silver aggregates. Anal. Methods 2015, 7, 8241–8247. [Google Scholar] [CrossRef]
- Tang, L.; Li, S.; Han, F.; Liu, L.; Xu, L.; Ma, W.; Kuang, H.; Li, A.; Wang, L.; Xu, C. SERS-active Au@Ag nanorod dimers for ultrasensitive dopamine detection. Biosens. Bioelectron. 2015, 71, 7–12. [Google Scholar] [CrossRef]
- Wu, H.Y.; Cunningham, B.T. Point-of-care detection and real-time monitoring of intravenously delivered drugs via tubing with an integrated SERS sensor. Nanoscale 2014, 6, 5162–5171. [Google Scholar] [CrossRef]
- McLaughlin, C.; MacMillan, D.; McCardle, C.; Smith, W.E. Quantitative Analysis of Mitoxantrone by Surface-Enhanced Resonance Raman Scattering. Anal. Chem. 2002, 74, 3160–3167. [Google Scholar] [CrossRef]
- Yuen, C.; Zheng, W.; Huang, Z. Low-level detection of anti-cancer drug in blood plasma using microwave-treated gold-polystyrene beads as surface-enhanced Raman scattering substrates. Biosens. Bioelectron. 2010, 26, 580–584. [Google Scholar] [CrossRef]
- Shi, Y.; Liu, W.; Chen, C. Two-step centrifugation method for subpicomolar Surface-enhanced Raman scattering detection. Anal. Chem. 2016, 88, 5009–5015. [Google Scholar] [CrossRef]
- Litti, L.; Amendola, V.; Toffoli, G.; Meneghetti, M. Detection of low-quantity anticancer drugs by surface-enhanced Raman scattering. Anal. Bioanal. Chem. 2016, 408, 2123–2131. [Google Scholar] [CrossRef]


| Substrate | Analyte | Detection Limit | Detection Method | Ref. |
|---|---|---|---|---|
| PSA/Ag-NP composite nanosphere | 4-Aminothiophenol | 10−9 M | Sandwich detection method | [35] |
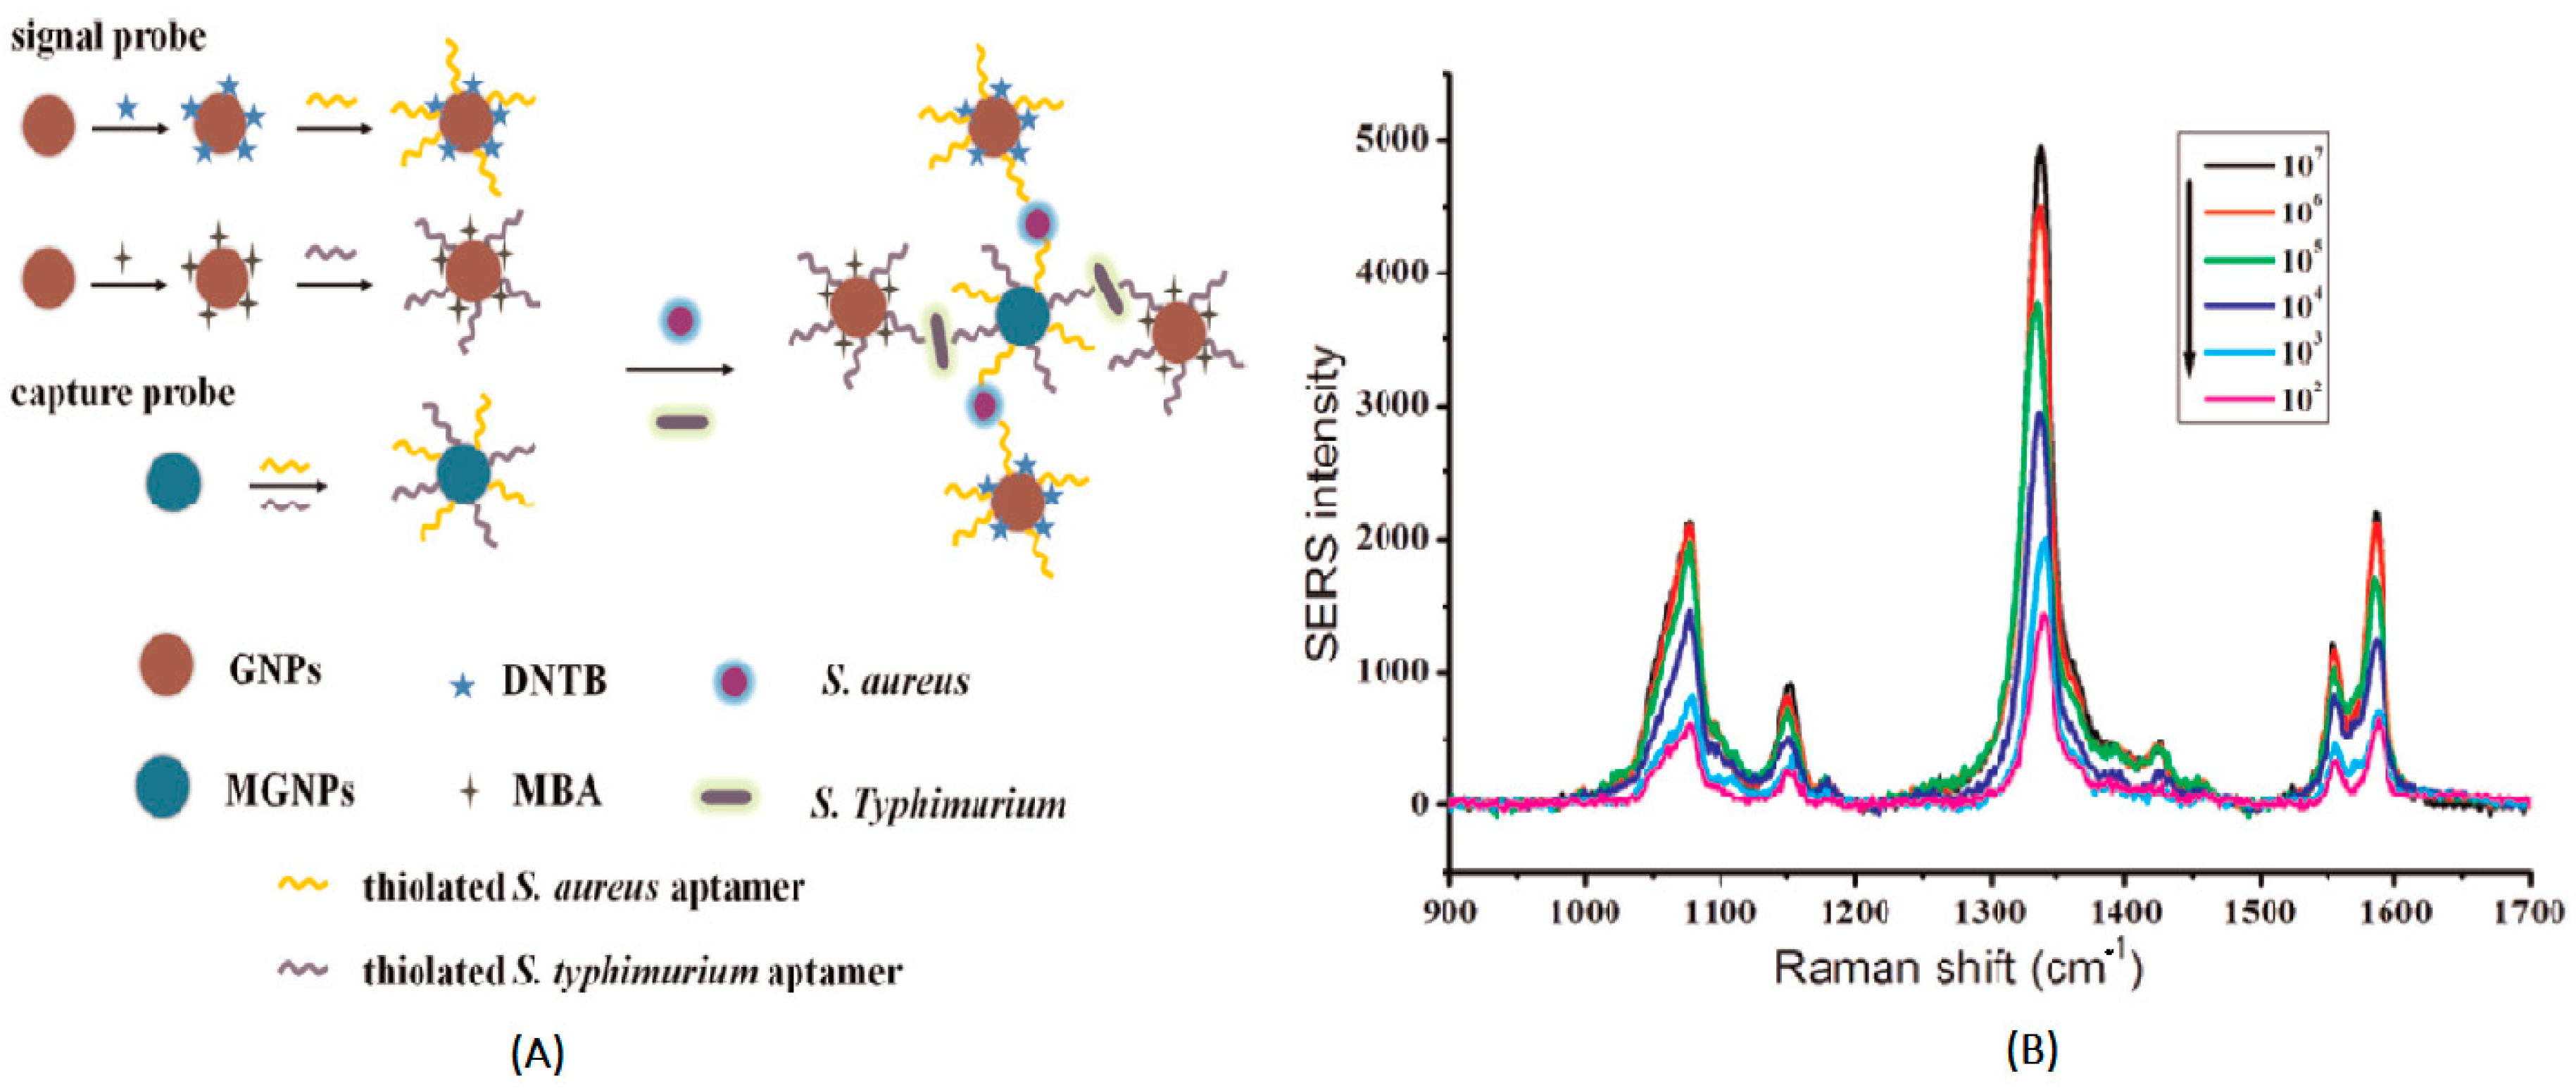
| Gold nanoparticle | S. typhimurium, S. aureus | 15 fM | Sandwich detection method | [36] |
| Gold nanoparticle | Target DNA | 50 pM | Amplification method | [39] |
| Gold nanorod | Target oligonucleotide sequence | 6.3 fM | Amplification method | [40] |
| Gold nanoparticle | DNA methylation | 3 pM | Asymmetry signal amplification method | [49] |
| Gold nanoparticle | MicroRNA, ATP | 0.15 fM | Asymmetry signal amplification method | [50] |
| Gold nanoparticle | Target DNA | 10 pM | Gene chips method | [51] |
| Substrate | Application | Year | Ref. |
|---|---|---|---|
| Silver nanoparticle | Bluminal A breast cancer detection | 2015 | [68] |
| Silver nanoparticle | Nasopharyngeal cancer detection | 2010 | [69] |
| Silver nanoparticle | Noninvasive cancer detection | 2011 | [70] |
| Gold nanoparticle | Cancer diagnostic immunoassay | 2013 | [75] |
| Gold nanoparticle | Serological liver cancer biomarkers detection | 2014 | [77] |
| Silver nanoparticle | Mucin-1 detection | 2015 | [78] |
| Silver nanoparticle | Protein detection | 2015 | [79] |
© 2019 by the authors. Licensee MDPI, Basel, Switzerland. This article is an open access article distributed under the terms and conditions of the Creative Commons Attribution (CC BY) license (http://creativecommons.org/licenses/by/4.0/).
Share and Cite
Chen, C.; Liu, W.; Tian, S.; Hong, T. Novel Surface-Enhanced Raman Spectroscopy Techniques for DNA, Protein and Drug Detection. Sensors 2019, 19, 1712. https://doi.org/10.3390/s19071712
Chen C, Liu W, Tian S, Hong T. Novel Surface-Enhanced Raman Spectroscopy Techniques for DNA, Protein and Drug Detection. Sensors. 2019; 19(7):1712. https://doi.org/10.3390/s19071712
Chicago/Turabian StyleChen, Chuanpin, Wenfang Liu, Sanping Tian, and Tingting Hong. 2019. "Novel Surface-Enhanced Raman Spectroscopy Techniques for DNA, Protein and Drug Detection" Sensors 19, no. 7: 1712. https://doi.org/10.3390/s19071712
APA StyleChen, C., Liu, W., Tian, S., & Hong, T. (2019). Novel Surface-Enhanced Raman Spectroscopy Techniques for DNA, Protein and Drug Detection. Sensors, 19(7), 1712. https://doi.org/10.3390/s19071712