The Instrument Design of the DLR Earth Sensing Imaging Spectrometer (DESIS)

 , ,
, ,
Abstract
:1. Introduction
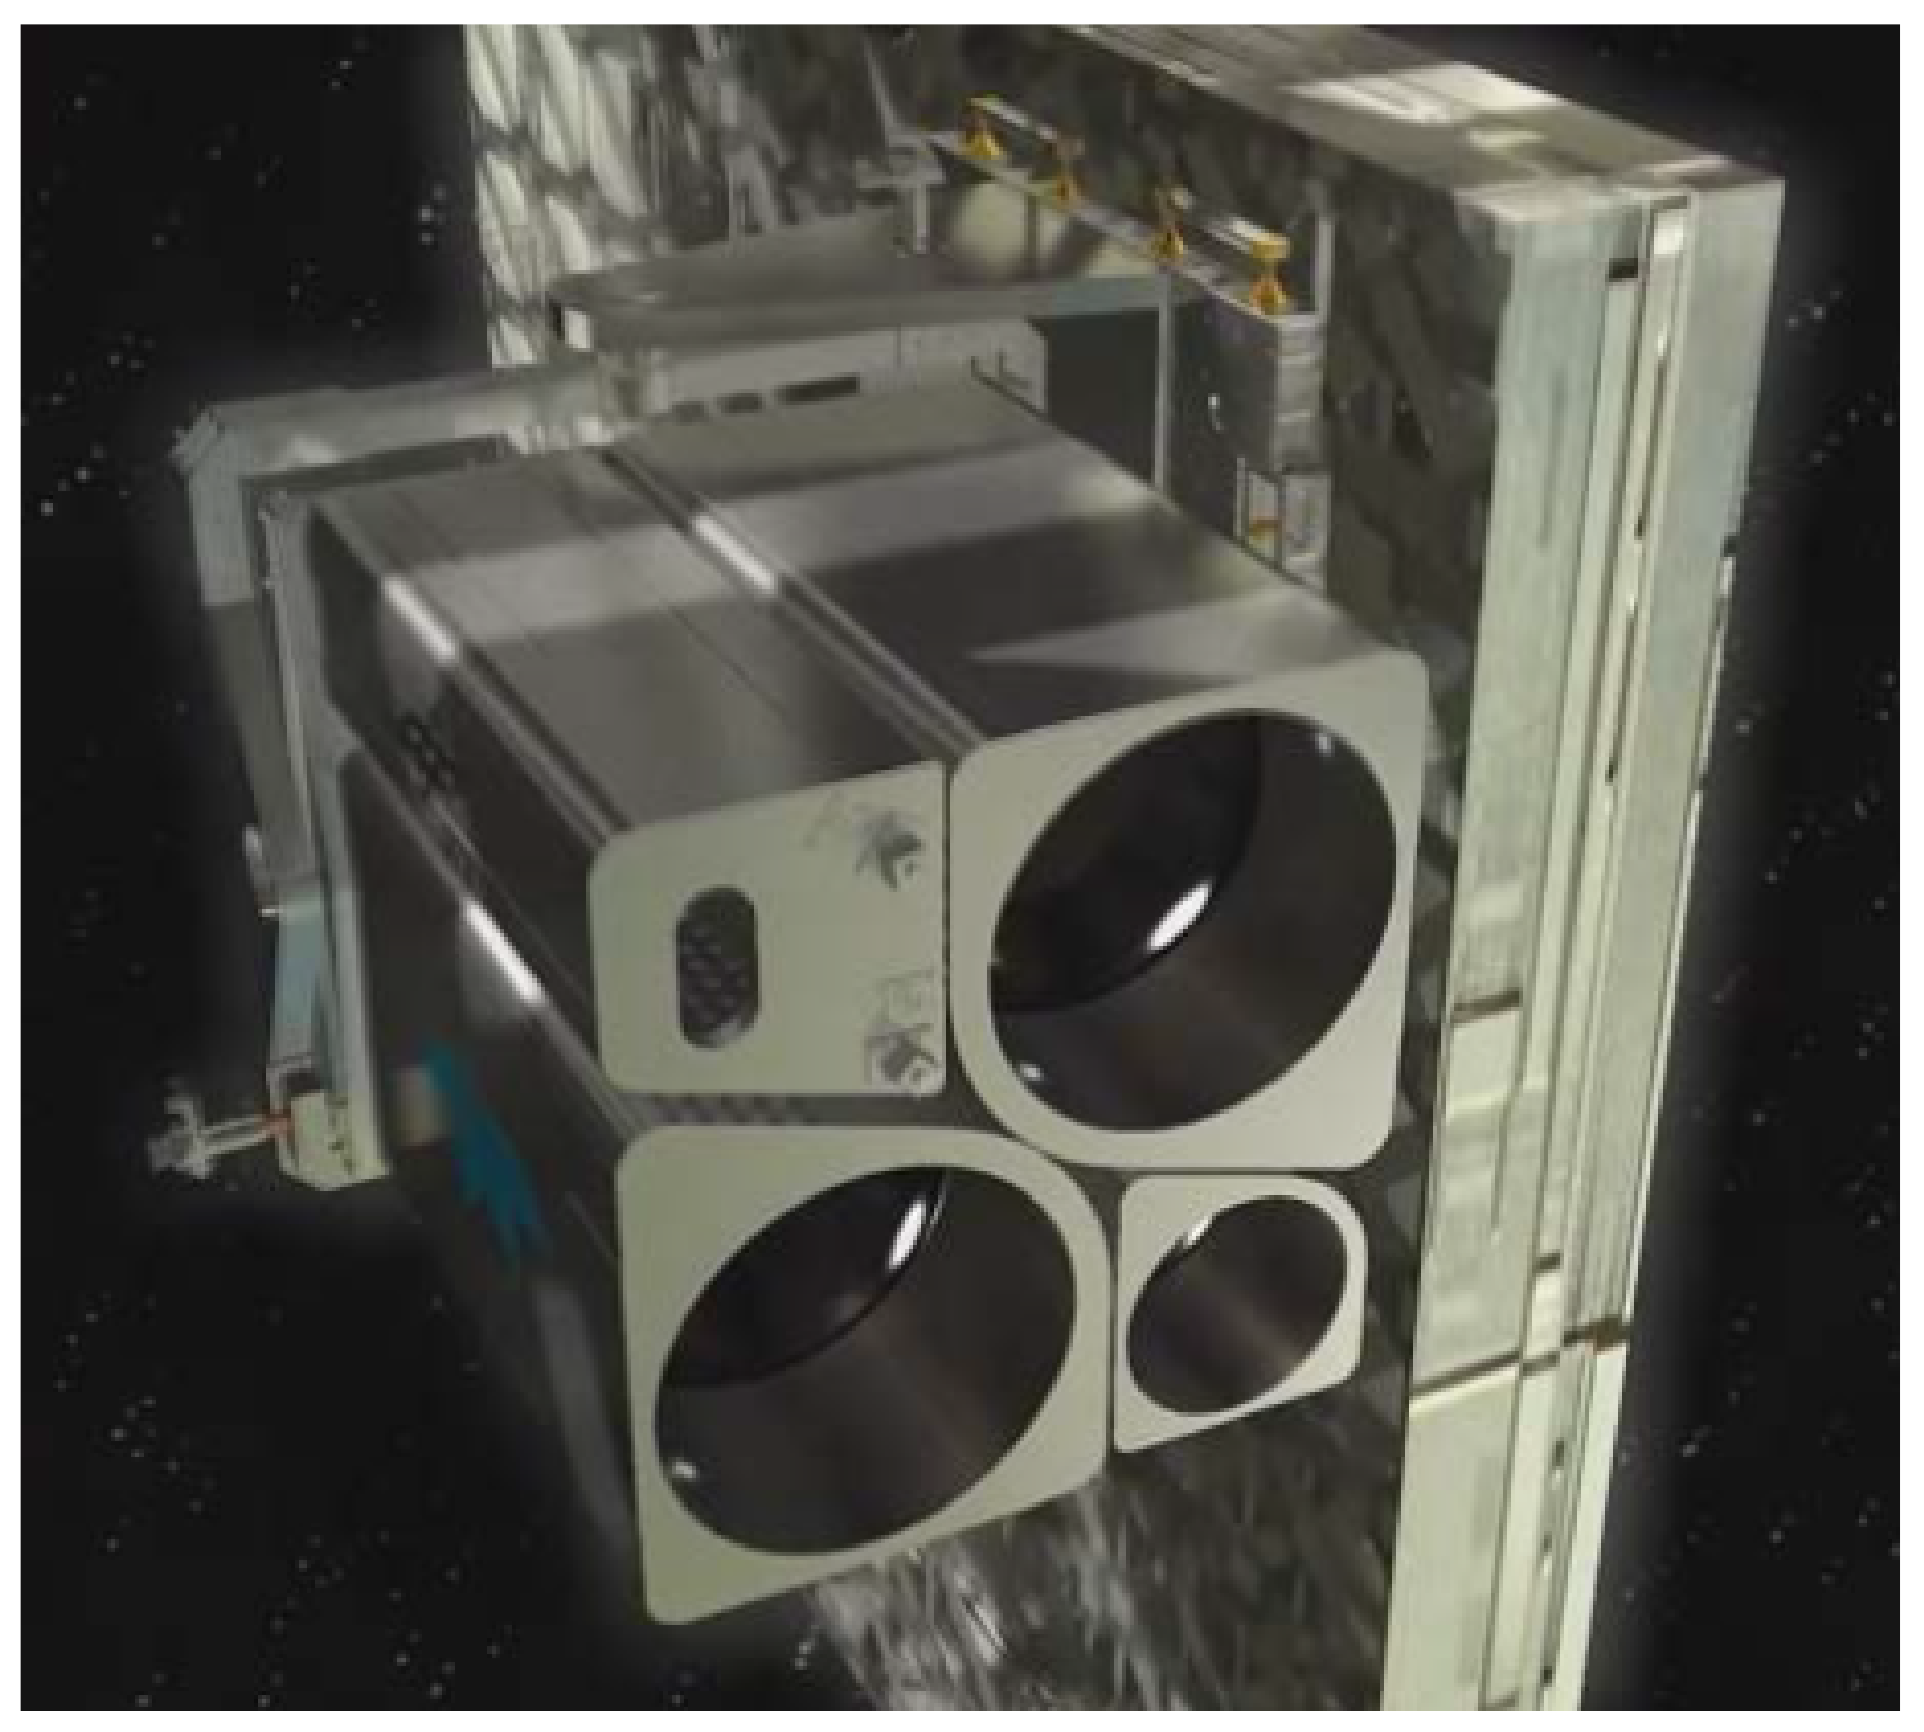
2. MUSES Platform
3. DESIS
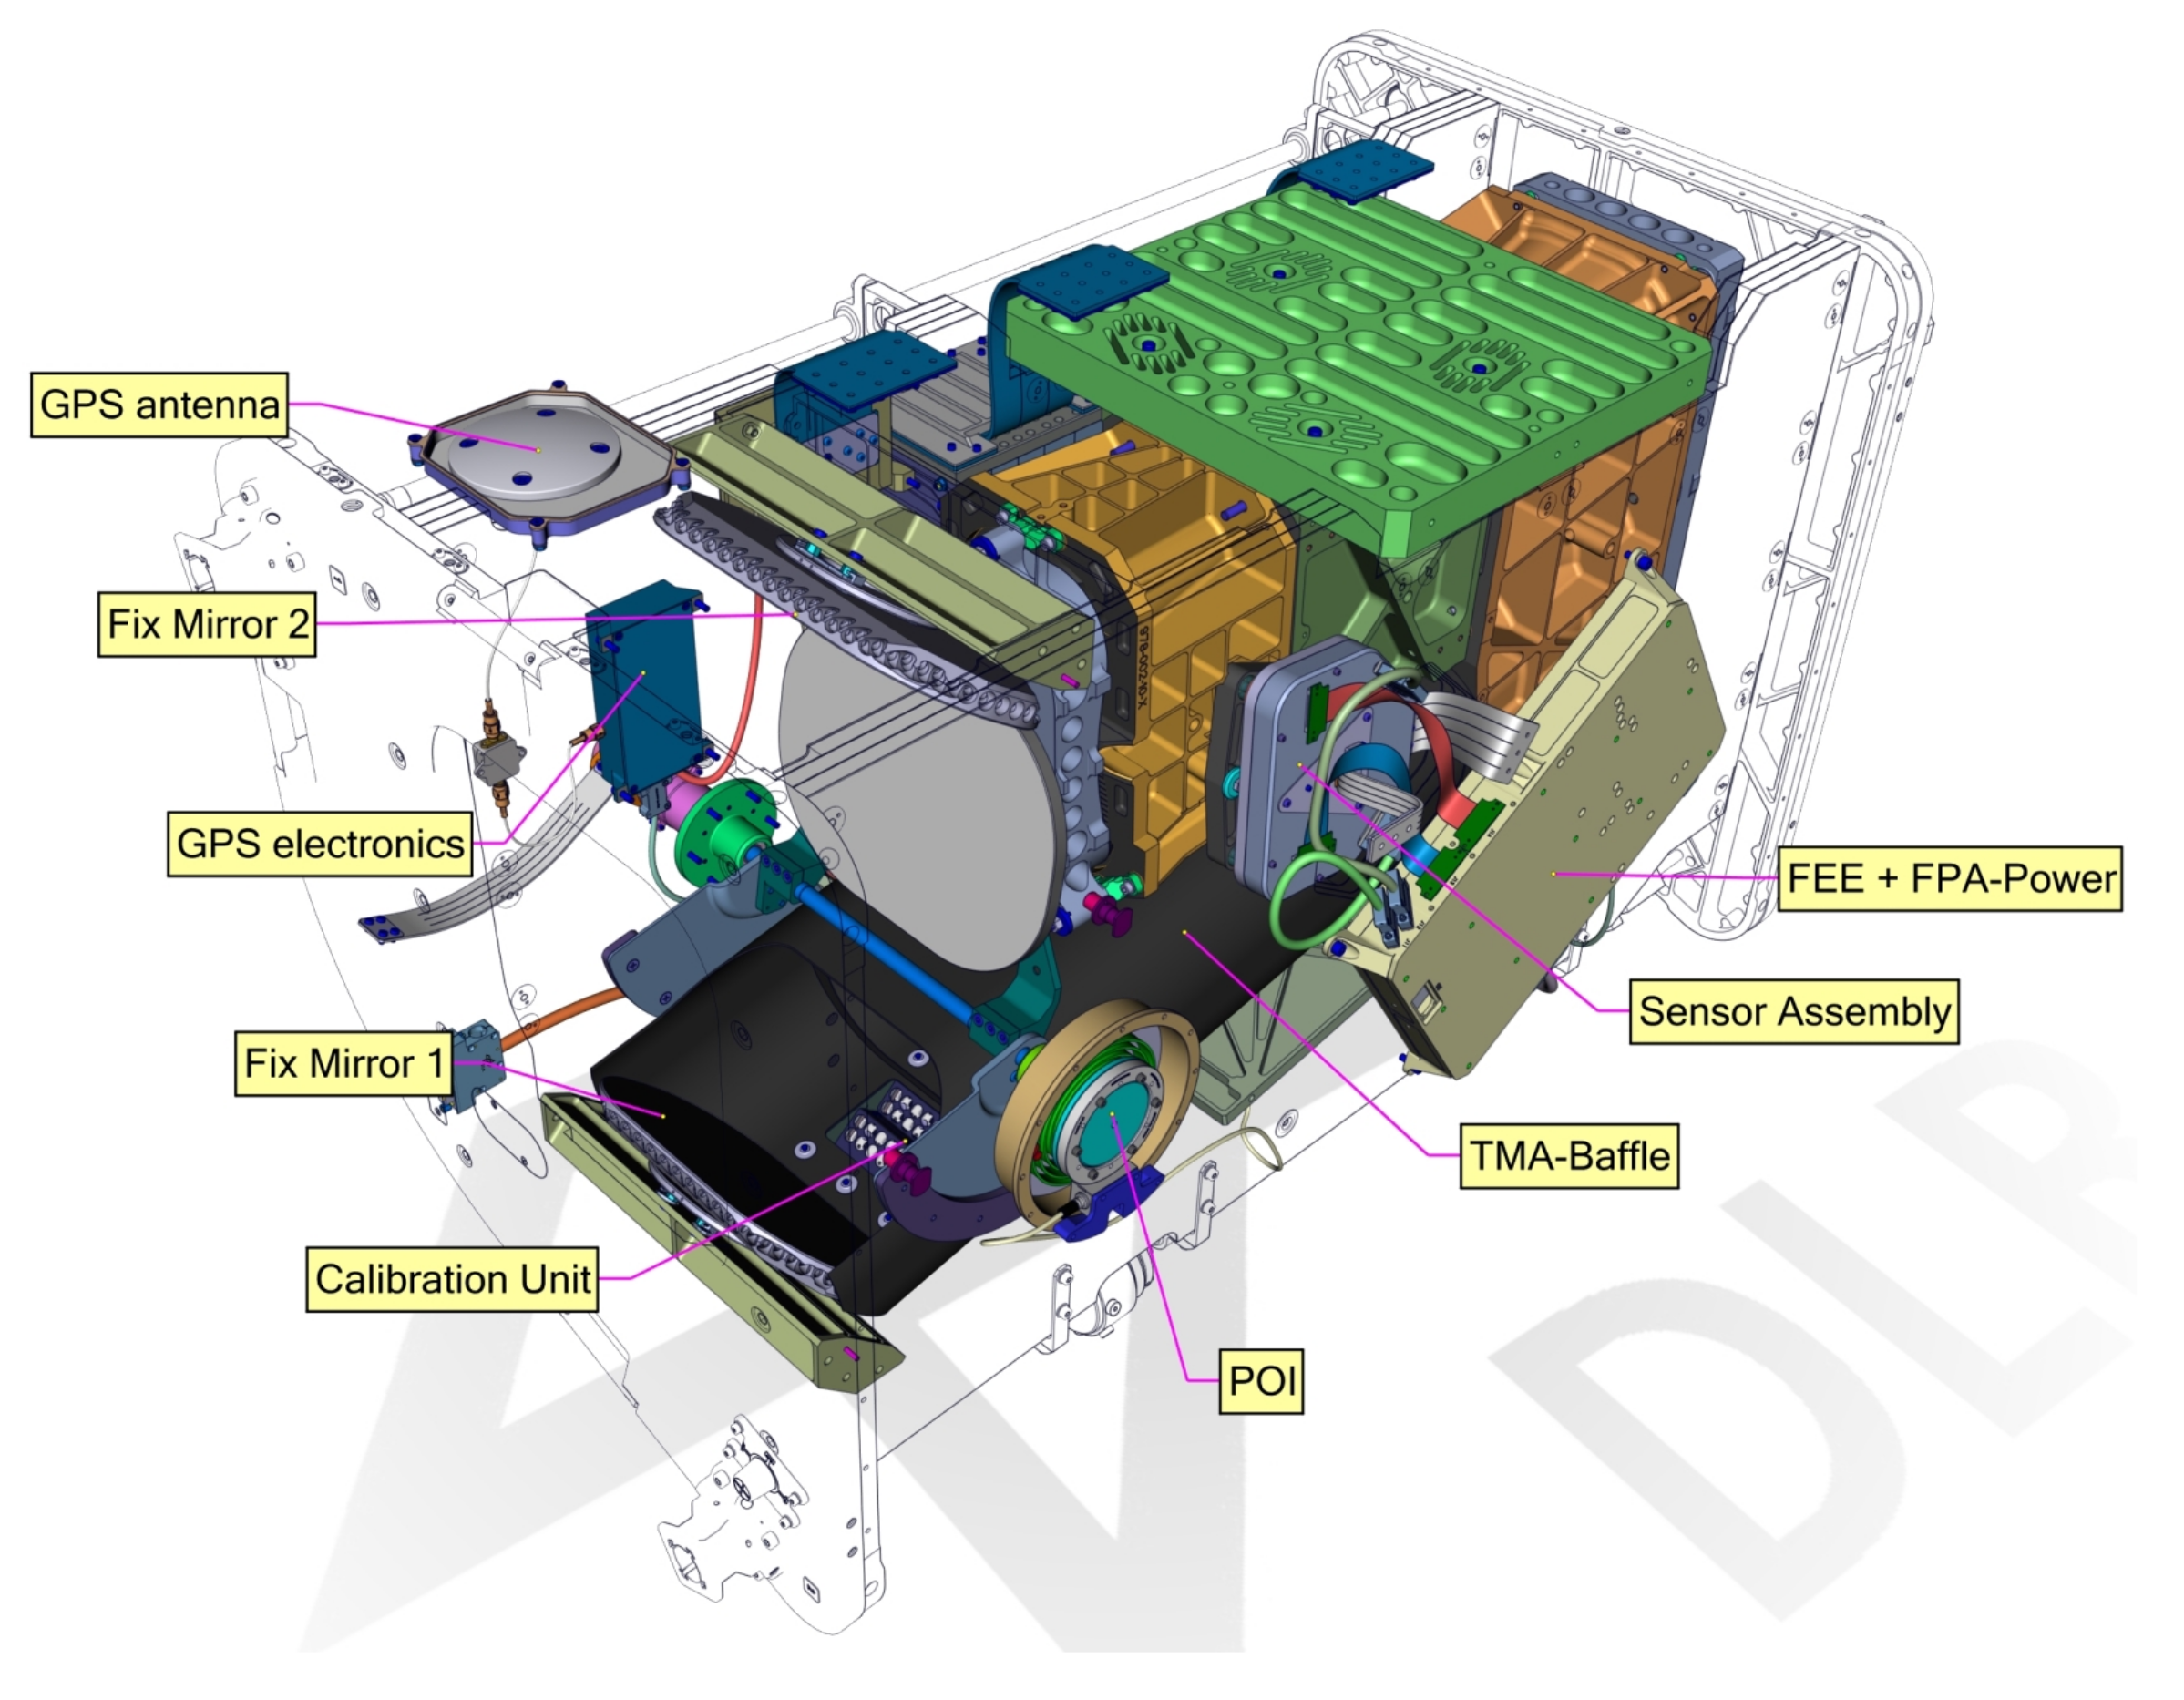
4. DESIS Design
4.1. Spectrometer Optics
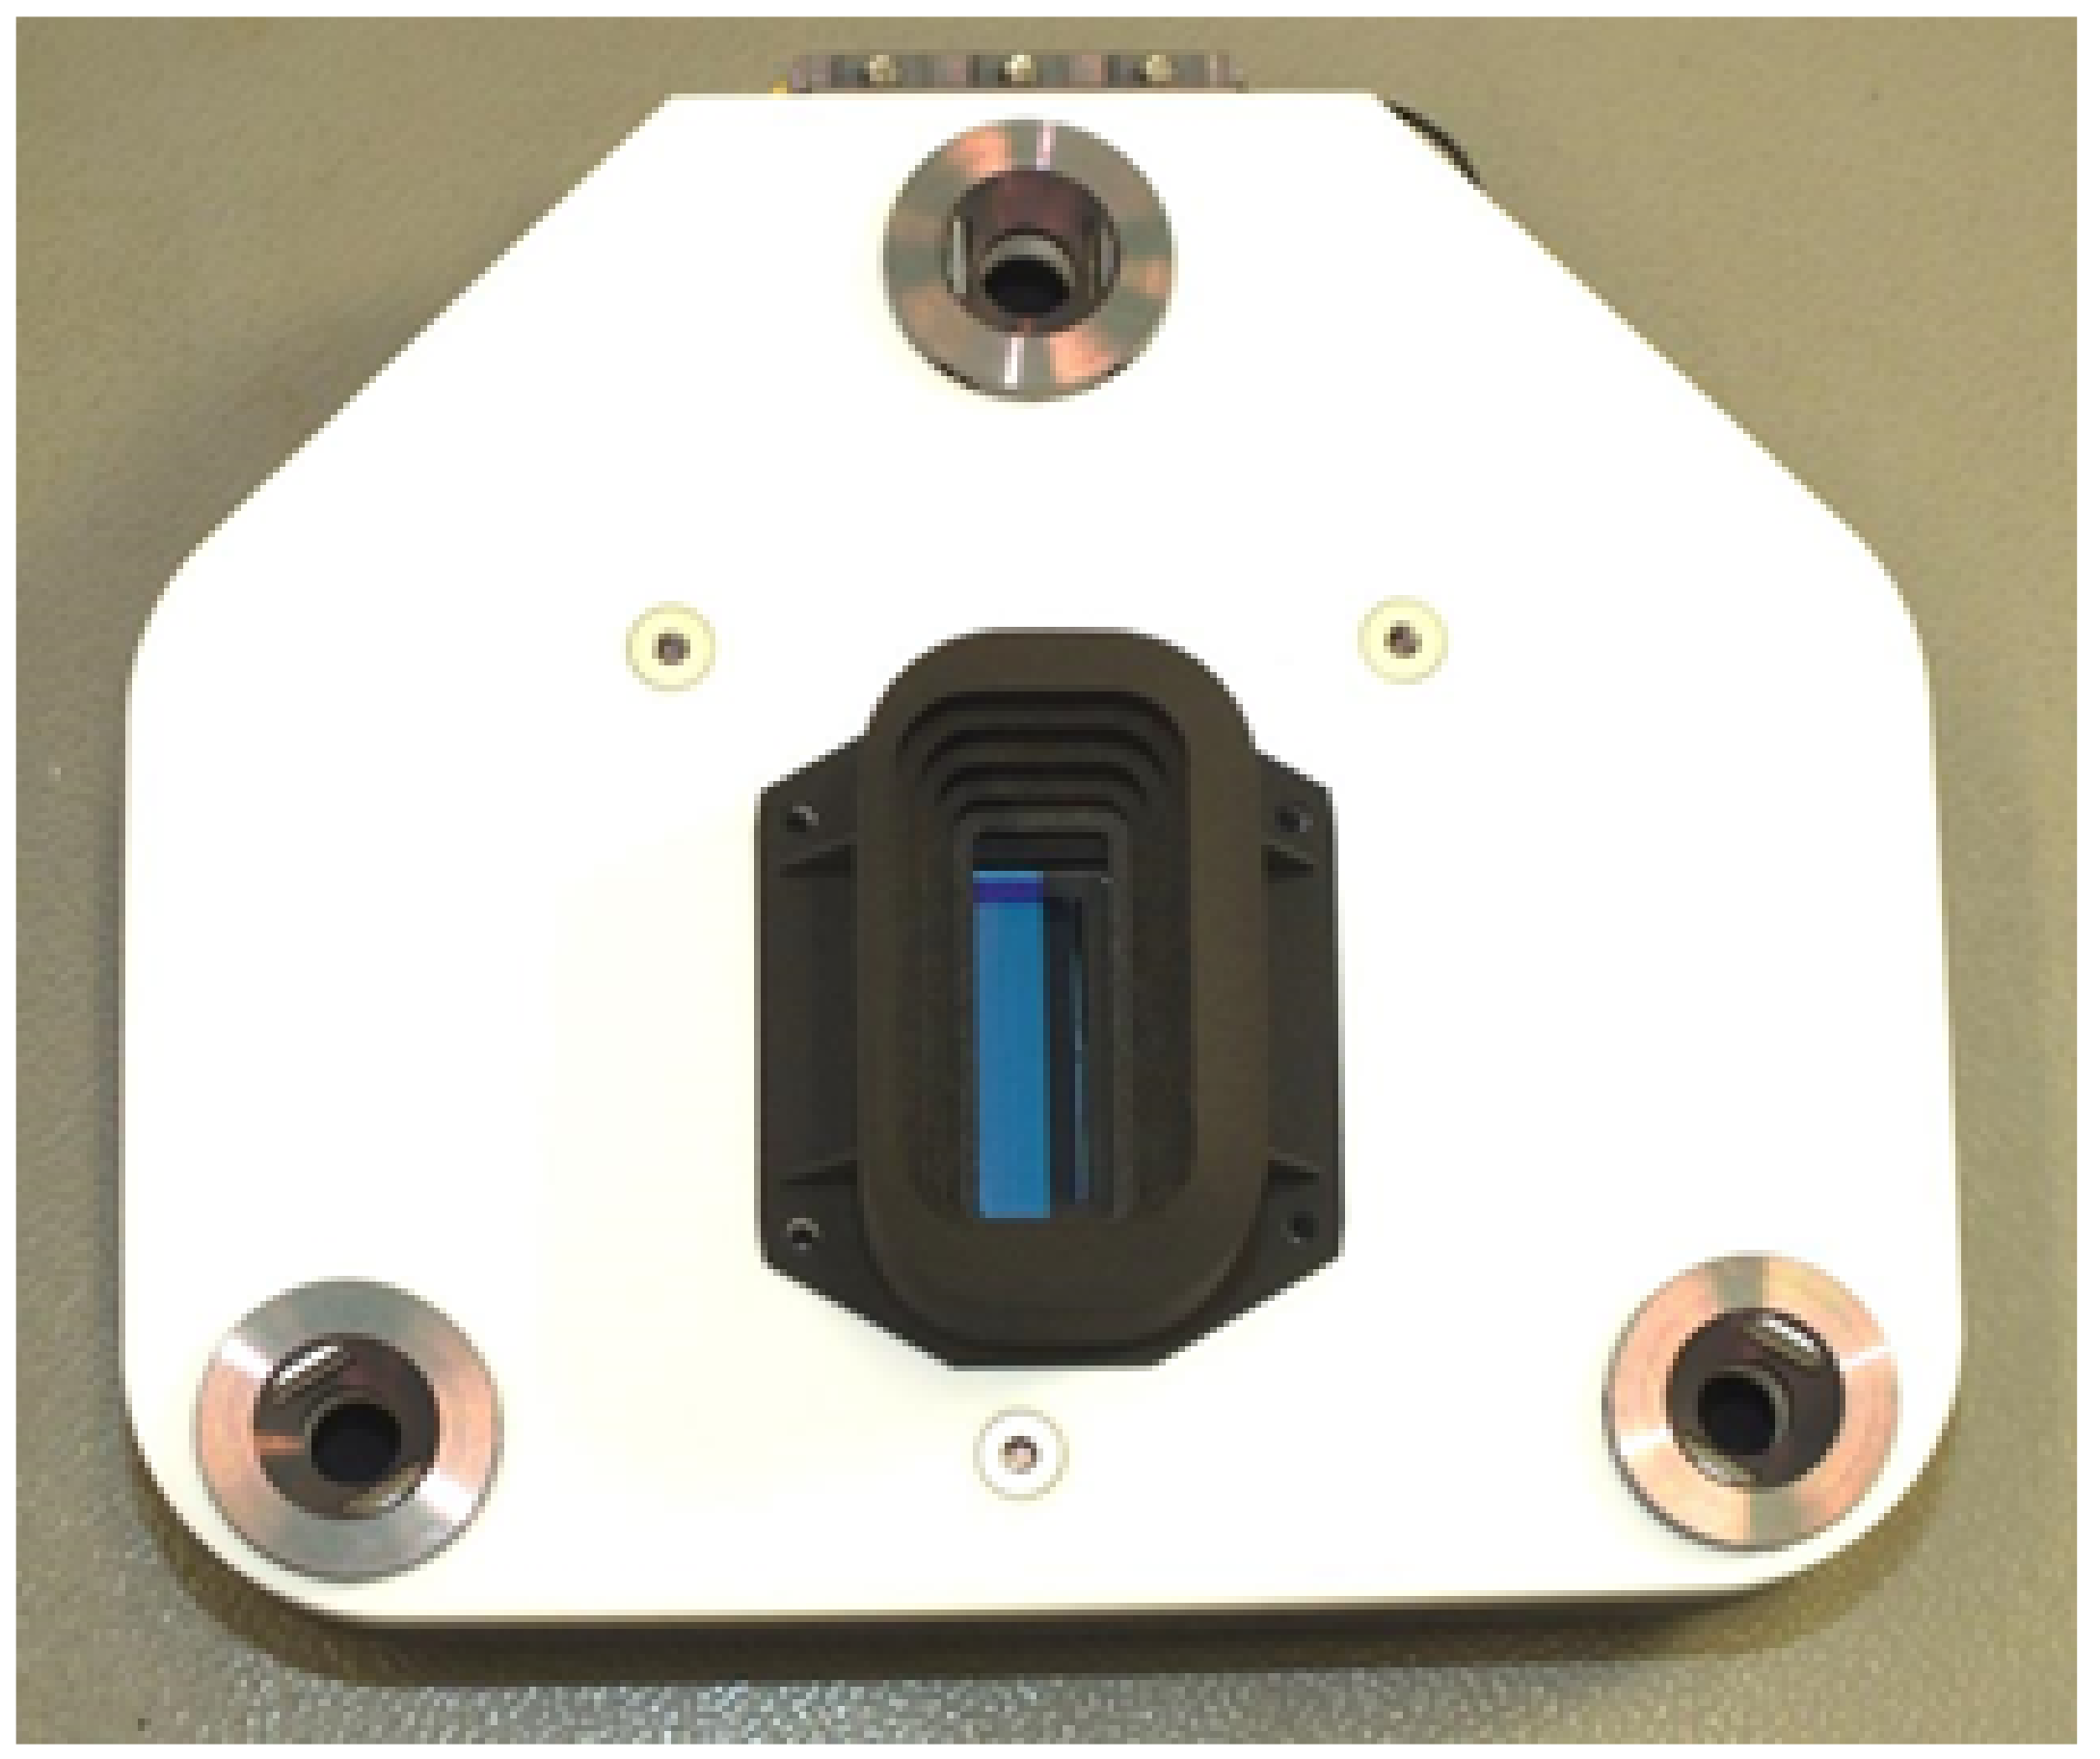
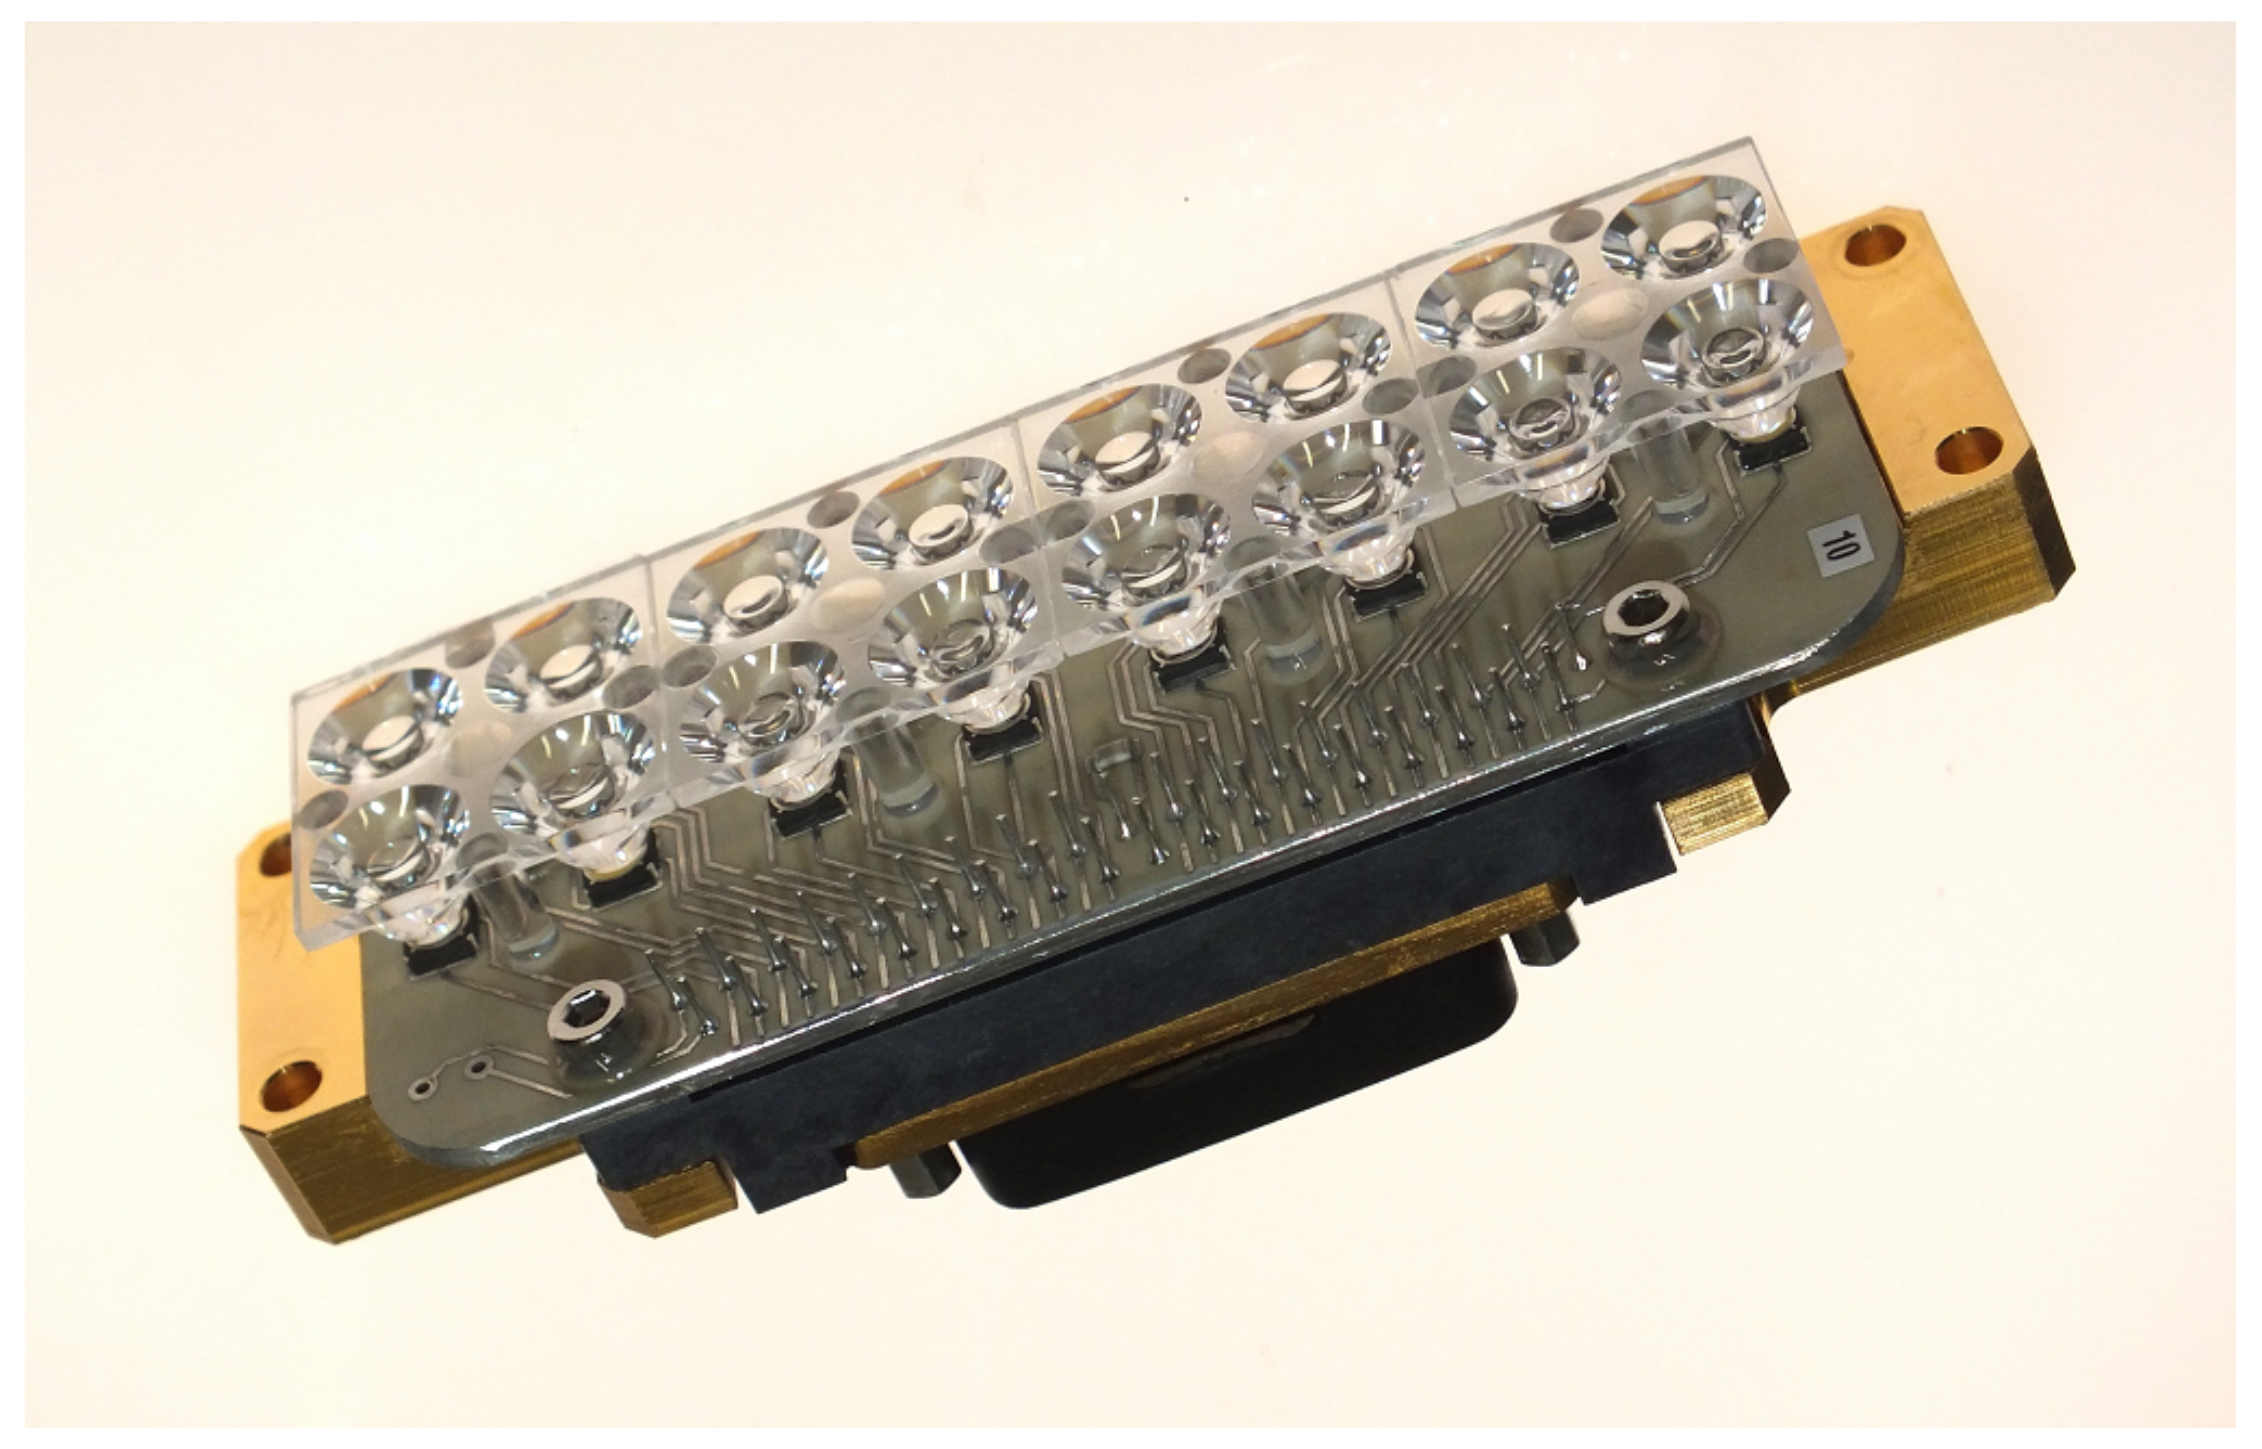
4.2. Focal Plane Assembly
4.3. Instrument Control and Mass Memory
4.4. GPS
4.5. Calibration Unit
4.6. Pointing Unit
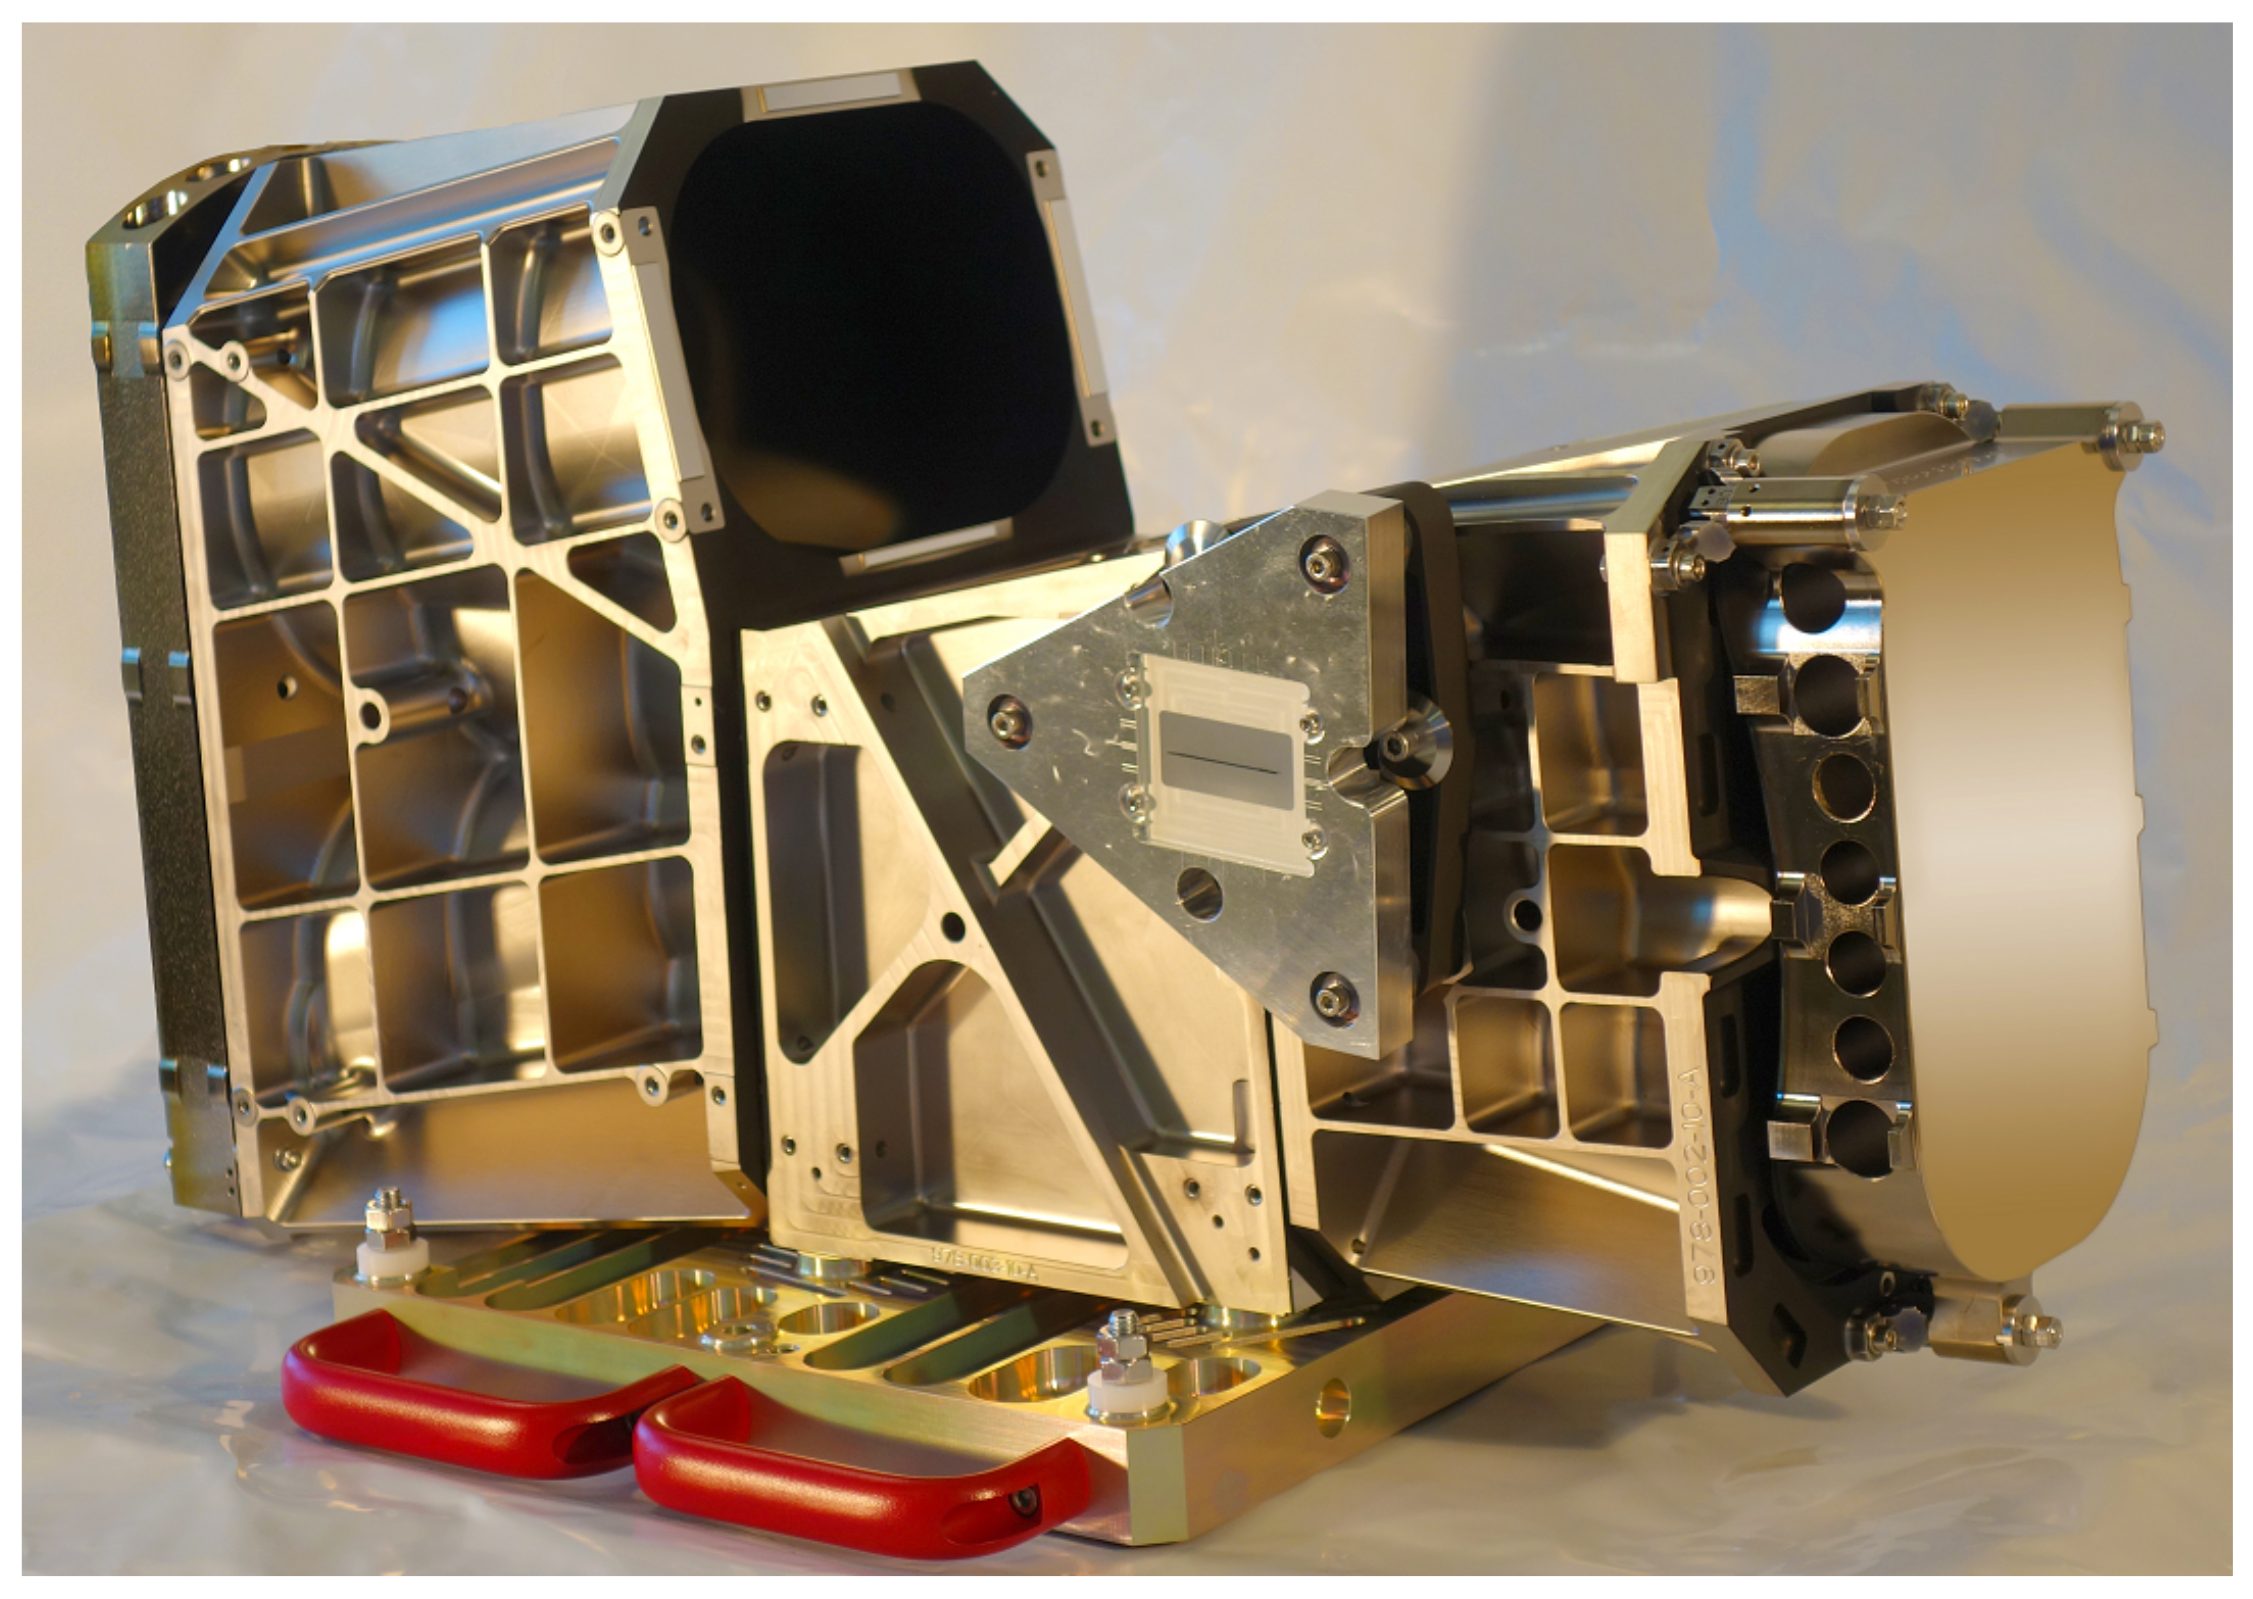
4.7. Container and Thermal Design
5. On-Ground Calibration and Testing
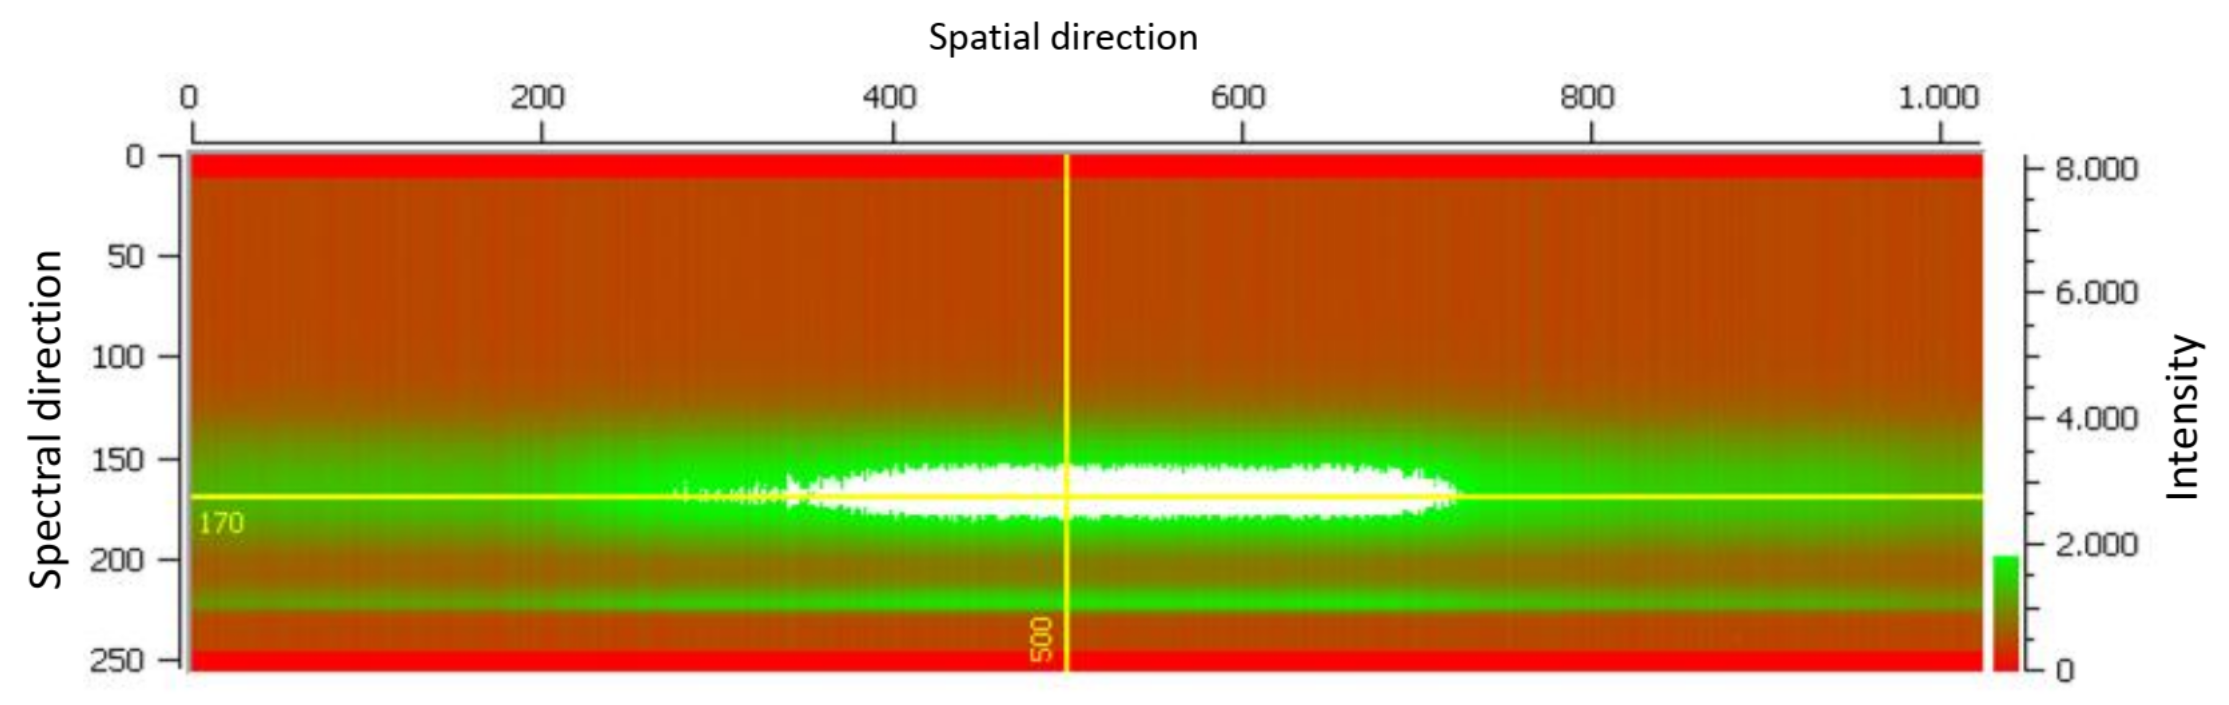
- quantum efficiency (QE), linearity, dark signal non-uniformity (DNSU), photo response non-uniformity (PRNU), dark current noise
- photon transfer curve (PTC)
- modulation transfer function (MTF)
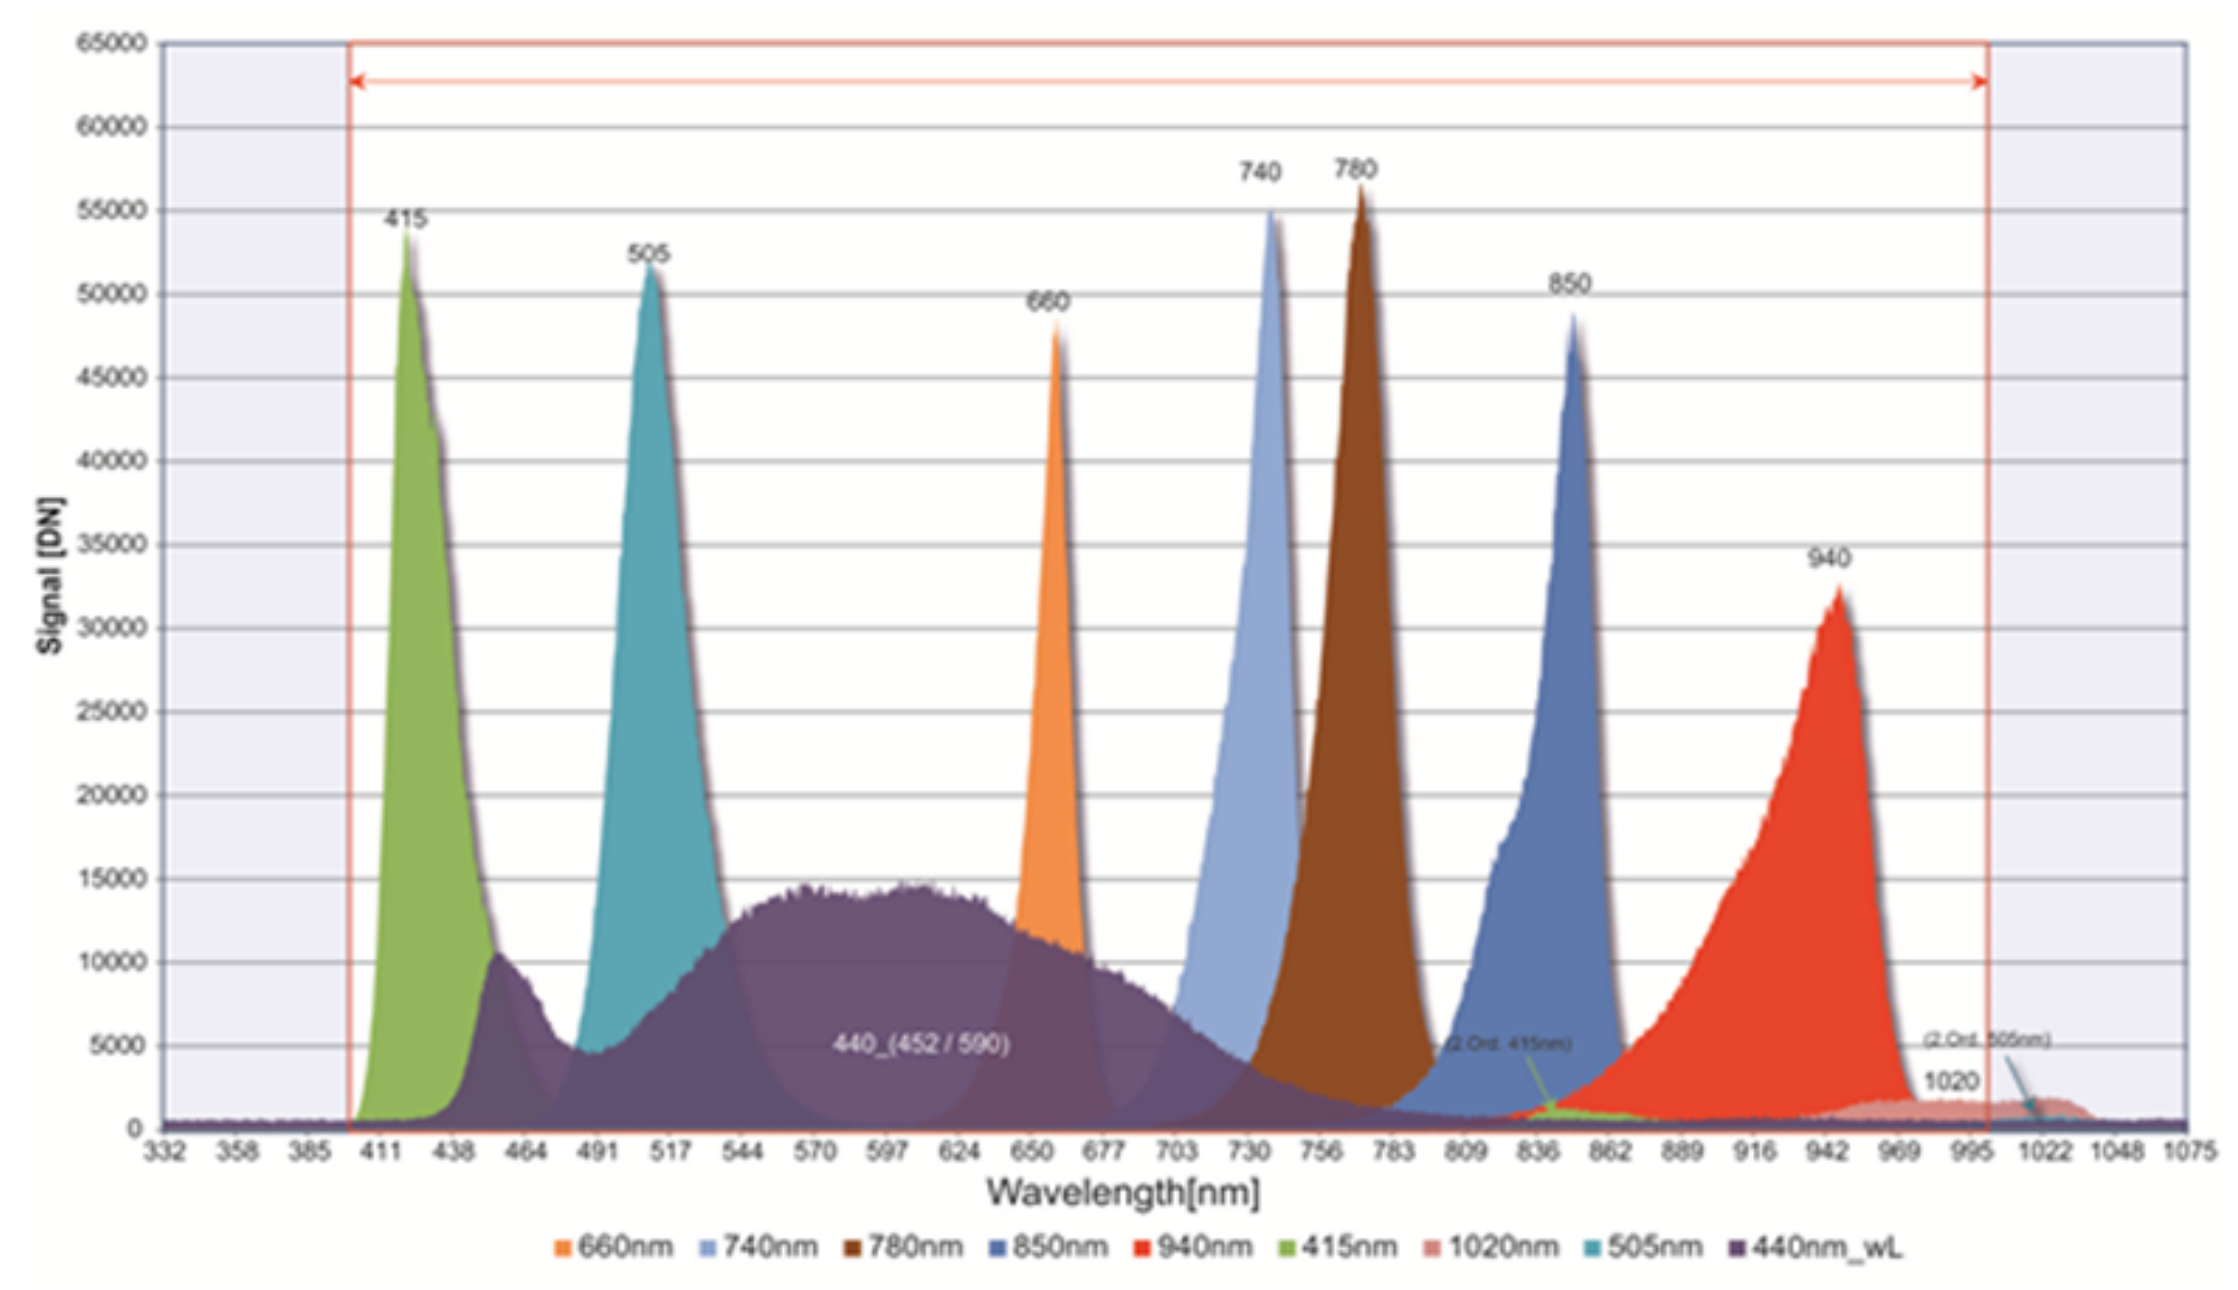
- spectral calibration of the order sorting filter
- wavefront deformation Peak to Valley (PV) and root-mean-square (RMS) of the optical system
- grating efficiency and 2nd order stray-light suppression by grating subsystem
- pointing accuracy and repeatability of pointing unit
- focusing and focus check
- spatial MTF and spectral full width at half maximum (FWHM)
- absolute radiometric calibration for spectral radiances
- spectral response function for each pixel
- keystone and smile
- polarization
6. Summary and Outlook
Author Contributions
Funding
Acknowledgments
Conflicts of Interest
References
- Nichol, C.; Drolet, G.; Porcar-Castell, A.; Wade, T.; Sabater, N.; Middleton, E.; MacLellan, C.; Levula, J.; Mammarella, I.; Vesala, T.; Atherton, J. Diurnal and Seasonal Solar Induced Chlorophyll Fluorescence and Photosynthesis in a Boreal Scots Pine Canopy. Remote Sens. 2019, 11, 273. [Google Scholar] [CrossRef]
- Hill, J.; Buddenbaum, H.; Townsend, P.A. Imaging Spectroscopy of Forest Ecosystems: Perspectives for the Use of Space-borne Hyperspectral Earth Observation Systems. Surv. Geophys. 2019. [Google Scholar] [CrossRef]
- Hank, T.B.; Berger, K.; Bach, H.; Clevers, J.G.P.W.; Gitelson, A.; Zarco-Tejada, P.; Mauser, W. Spaceborne Imaging Spectroscopy for Sustainable Agriculture: Contributions and Challenges. Surv. Geophys. 2018. [Google Scholar] [CrossRef]
- Giardino, C.; Brando, V.E.; Gege, P.; Pinnel, N.; Hochberg, E.; Knaeps, E.; Reusen, I.; Doerffer, R.; Bresciani, M.; Braga, F.; et al. Imaging Spectrometry of Inland and Coastal Waters: State of the Art, Achievements and Perspectives. Surv. Geophys. 2018. [Google Scholar] [CrossRef]
- Mielke, C.; Rogaß, C.; Boesche, N.K.; Segl, K.; Altenberger, U. EnGeoMAP 2.0—Automated Hyperspectral Mineral Identification for the German EnMAP Space Mission. Remote Sens. 2016, 8, 127. [Google Scholar] [CrossRef]
- Steinberg, A.; Chabrillat, S.; Stevens, A.; Segl, K.; Foerster, S. Prediction of Common Surface Soil Properties Based on Vis-NIR Airborne and Simulated EnMAP Imaging Spectroscopy Data: Prediction Accuracy and Influence of Spatial Resolution. Remote Sens. 2016, 8, 613. [Google Scholar] [CrossRef]
- Green, R.O.; Chrien, T.; Nielson, P.J.; Sarture, C.; Eng, B.; Chovit, C.; Murray, A.T.; Eastwood, M.; Novack, H.I. Airborne visible/infrared imaging spectrometer (AVIRIS): Recent improvements to the sensor and data facility. Proc. SPIE 1993, 1937, 180–190. [Google Scholar] [CrossRef]
- Pearlman, J.S.; Barry, P.S.; Segal, C.C.; Shepanski, J.; Beiso, D.; Carman, S.L. Hyperion, a space-based imaging spectrometer. IEEE Trans. Geosci. Remote Sens. 2003, 41, 1160–1173. [Google Scholar] [CrossRef]
- Barnsley, M.J.; Settle, J.J.; Cutter, M.A.; Lobb, D.R.; Teston, F. The PROBA/CHRIS mission: a low-cost smallsat for hyperspectral multiangle observations of the Earth surface and atmosphere. IEEE Trans. Geosci. Remote Sens. 2004, 42, 1512–1520. [Google Scholar] [CrossRef]
- Rast, M.; Bezy, J.L. The ESA Medium Resolution Imaging Spectrometer MERIS-A review of the instrument and its mission. Int. J. Remote Sens. 1999, 20, 1681–1702. [Google Scholar] [CrossRef]
- Kumar, A.; Saha, A.; Dadhwal, V. Some Issues Related with Sub-pixel Classification using HYSI Data from IMS-1 Satellite. J. Indian Soc. Remote Sens. 2010, 38, 203–210. [Google Scholar] [CrossRef]
- Pignatti, S.; Palombo, A.; Pascucci, S.; Romano, F.; Santini, F.; Simoniello, T.; Amato, U.; Cuomo, V.; Acito, N.; Diani, M.; et al. The PRISMA hyperspectral mission: Science activities and opportunities for agriculture and land monitoring. In Proceedings of the 2013 IEEE International Geoscience and Remote Sensing Symposium—IGARSS, Melbourne, VIC, Australia, 21–26 July 2013; pp. 4558–4561. [Google Scholar]
- Guanter, L.; Kaufmann, H.; Segl, K.; Foerster, S.; Rogaß, C.; Chabrillat, S.; Kuester, T.; Hollstein, A.; Rossner, G.; Chlebek, C.; et al. The EnMAP Spaceborne Imaging Spectroscopy Mission for Earth Observation. Remote Sens. 2015, 7, 8830–8857. [Google Scholar] [CrossRef]
- Tal Feingersh, E.B.D. SHALOM—A Commercial Hyperspectral Space Mission. In Optical Payloads for Space Missions; Wiley Online Library: Hoboken, NJ, USA, 2015. [Google Scholar] [CrossRef]
- Keith, D.; Schaeffer, B.; Lunetta, R.; Gould, R., Jr.; Rocha, K.; Cobb, D. Remote sensing of selected water-quality indicators with the hyperspectral imager for the coastal ocean (HICO) sensor. Int. J. Remote Sens. 2014, 35, 2927–2962. [Google Scholar] [CrossRef]
- Hulley, G.; Hook, S.; Fisher, J.; Lee, C. ECOSTRESS, A NASA Earth-Ventures Instrument for studying links between the water cycle and plant health over the diurnal cycle. In Proceedings of the 2017 IEEE International Geoscience and Remote Sensing Symposium (IGARSS), Fort Worth, TX, USA, 23–28 July 2017; pp. 5494–5496. [Google Scholar] [CrossRef]
- Iwasaki, A.; Ohgi, N.; Tanii, J.; Kawashima, T.; Inada, H. Hyperspectral Imager Suite (HISUI)—Japanese hyper-multi spectral radiometer. In Proceedings of the 2011 IEEE International Geoscience and Remote Sensing Symposium, Vancouver, BC, Canada, 24–29 July 2011; pp. 1025–1028. [Google Scholar]
- Müller, R.; Avbelj, J.; Carmona, E.; Gerasch, B.; Graham, L.; Günther, B.; Heiden, U.; Kerr, G.; Knodt, U.; Krutz, D.; et al. The New Hyperspectral Sensor DESIS on the Multi-Payload Platform MUSES Installed on the ISS. In Proceedings of the XXIII ISPRS Congress, Prague, Czech Republic, 12–19 July 2016; Volume XLI-B1, pp. 461–467. [Google Scholar]
- Peschel, T.; Damm, C.; Beier, M.; Gebhardt, A.; Risse, S.; Walter, I.; Sebastian, I.; Krutz, D. Design of an imaging spectrometer for earth observation using freeform mirrors. Proc. SPIE 2017, 10562, 1056237. [Google Scholar] [CrossRef]
- Salomon, M.; Sternberg, N.A.; Gouzman, I.; Lempert, G.; Grossman, E.; Katsir, D.; Cotostiano, R.; Minton, T. Qualification of Acktar Vacuum Black Coating for Space Application; Technical Report; Acktar Ltd.: Kiryat-Gat, Israel, 2009. [Google Scholar]
- Krawczyk, H.; Alonso, K.; Carmona, E.; Gerasch, B.; Müller, R.; Krutz, D.; Sebastian, I.; Günther, B. Radiometric and spectral onboard calibration concepts of hyperspectral sensors—Specific of EnMAP and DESIS. In Proceedings of the Whispers 2018, Amsterdam, The Netherlands, 23–26 September 2018. [Google Scholar]
- Sebastian, I.; Krutz, D.; Eckardt, A.; Venus, H.; Walter, I.; Günther, B.; Neidhardt, M.; Reulke, R.; Müller, R.; Uhlig, M.; et al. On-Ground Calibration of DESIS: DLR´s Earth Sensing Imaging Spectrometer for the International Space Station ISS. Proc. SPIE 2018, 10680, 1–13. [Google Scholar]
- Eckardt, A.; Krutz, D.; Säuberlich, T.; Venus, H.; Reulke, R. Verification and calibration of the DESIS detector. SPIE Opt. Photon. 2018, 2018, 10768. [Google Scholar]
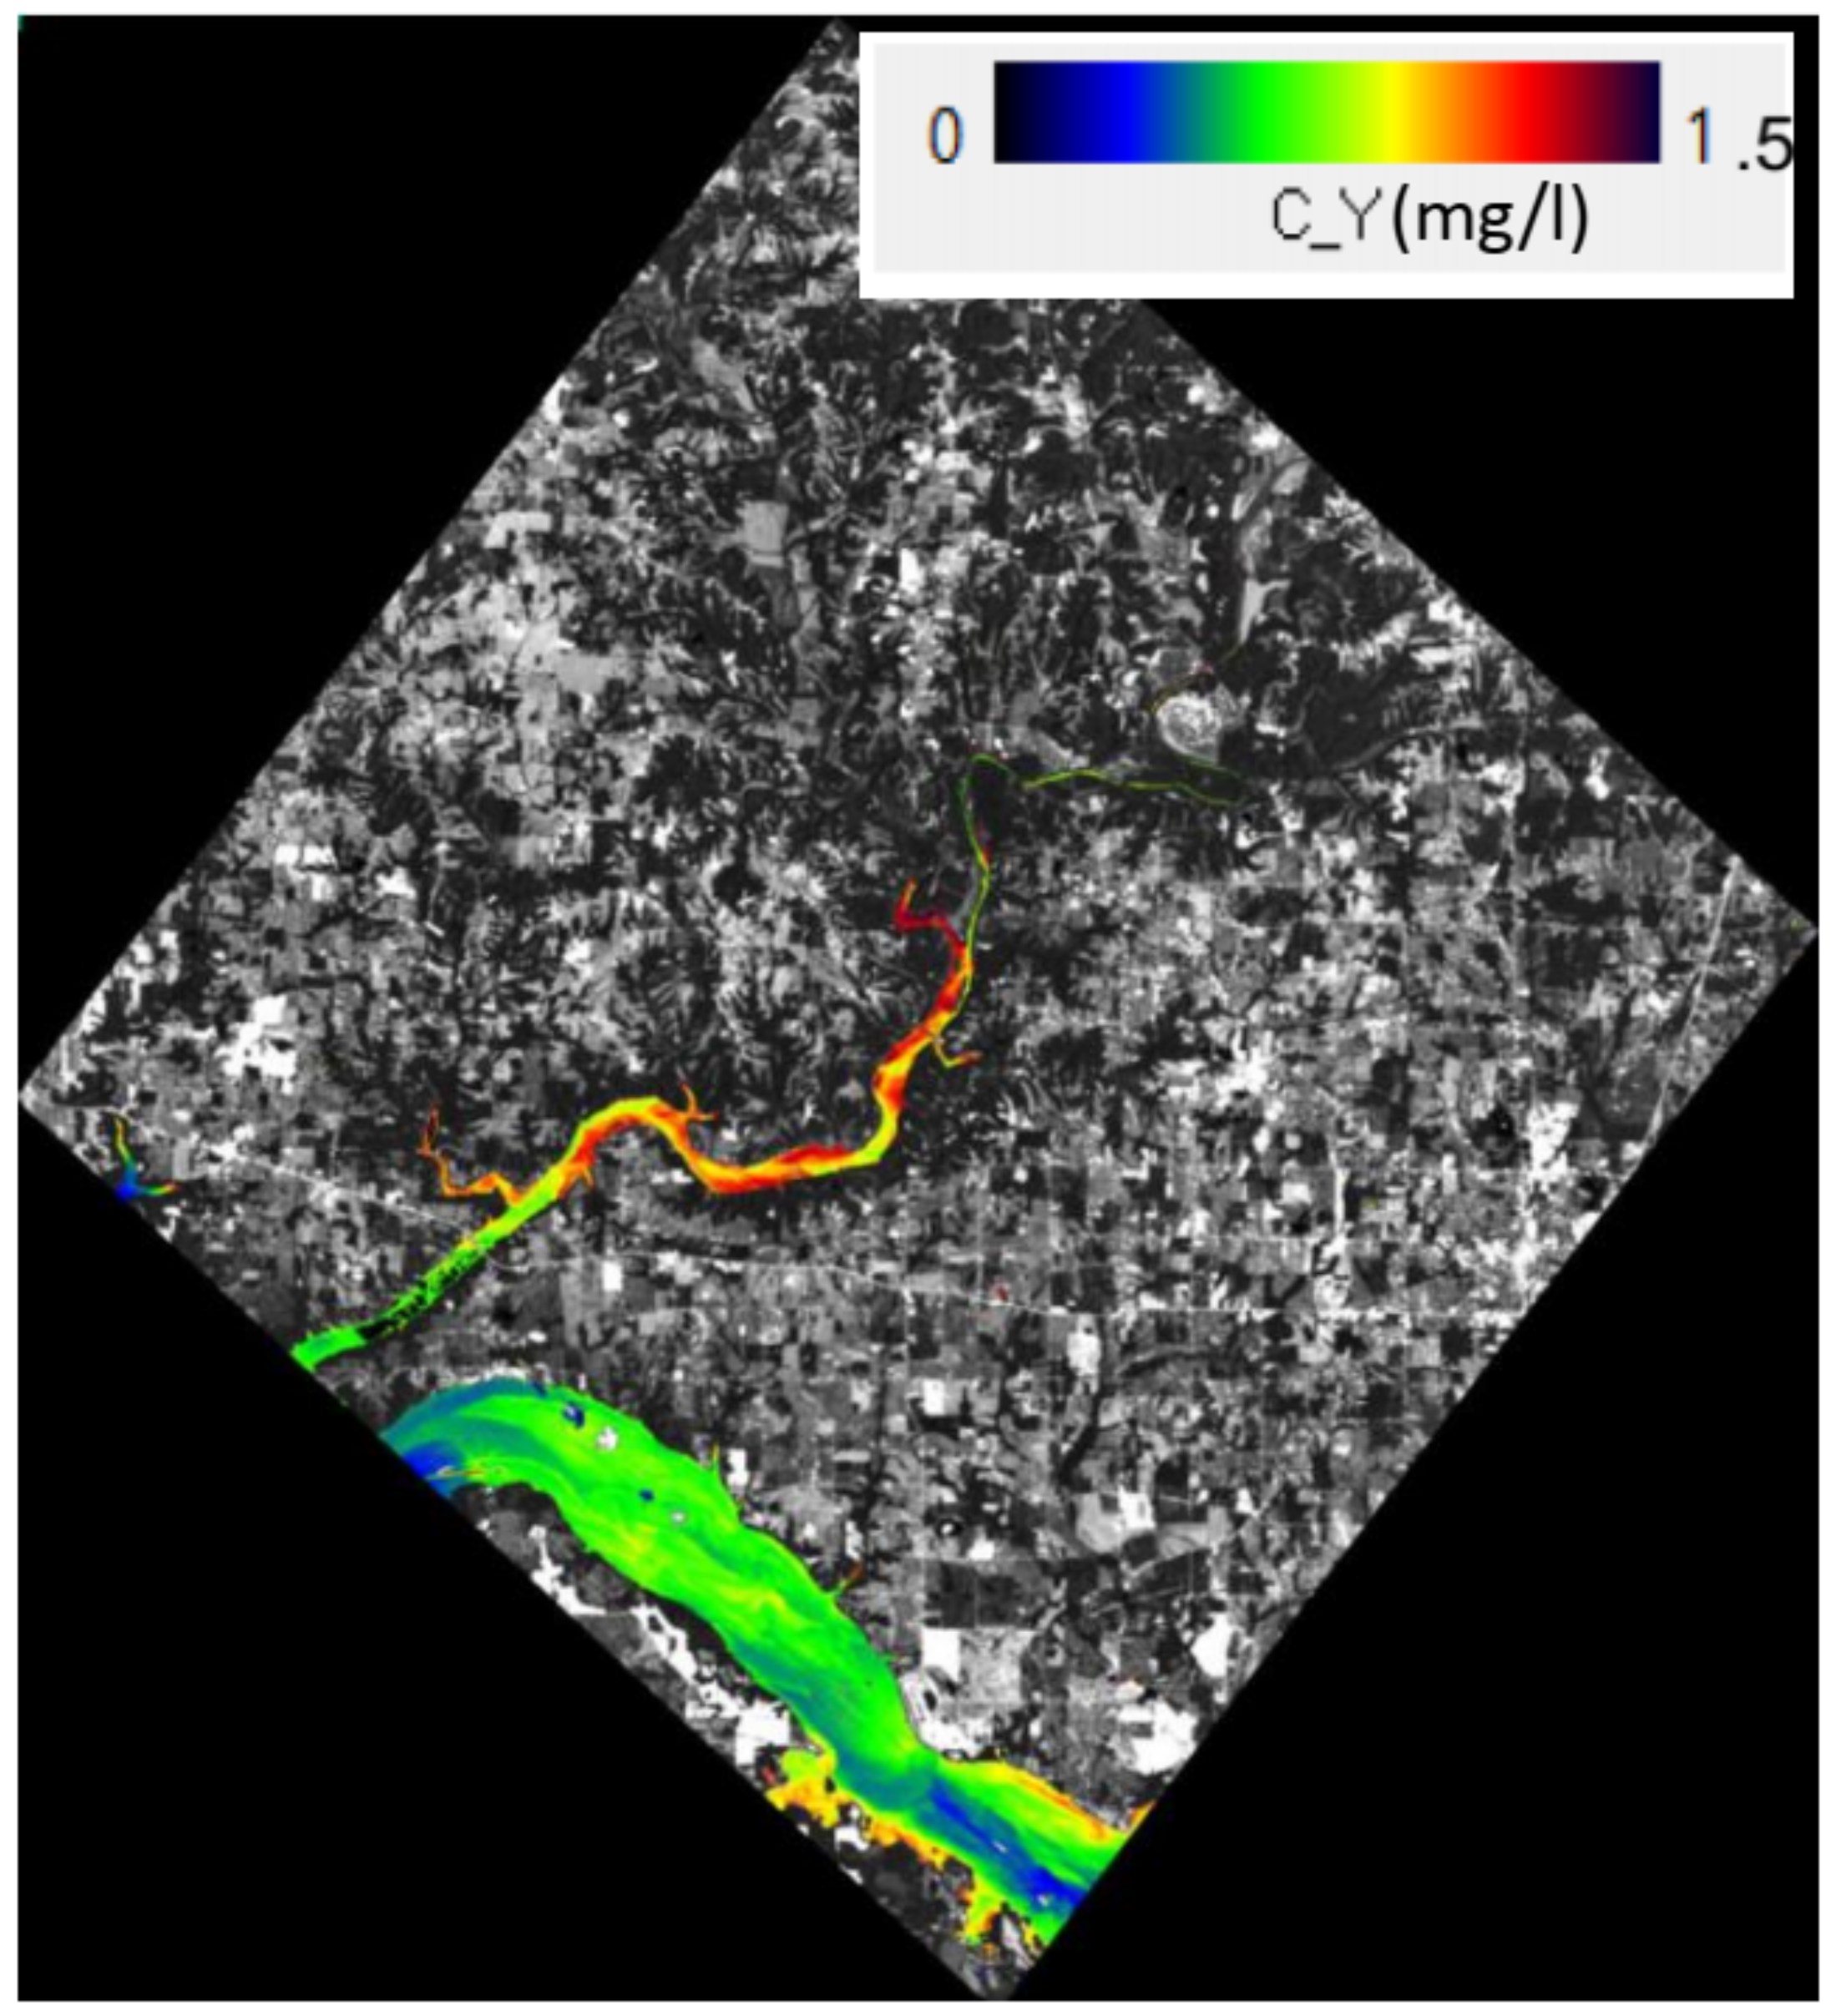
- Pinnel, N.; Gege, P.; Göritz, A. Sensitivity study for aquatic ecosystem monitoring with the DESIS hyperspectral sensor. In Proceedings of the Whispers 2018, Amsterdam, The Netherlands, 23–26 September 2018. [Google Scholar]


| Parameter | Value |
|---|---|
| 2.8 | |
| focal length | 320 mm |
| field of view | 4.1° |
| instantaneous field of view | 0.004° |
| ground sampling distance | 30.0 m |
| spatial pixels | 1024 |
| swath | 30 km |
| spectral range | 400 nm–1000 nm |
| spectral channels | 235 |
| spectral sampling distance | 2.55 nm |
| spectral binning modes | 1, 2, 3, 4 |
| signal-to-noise ratio (albedo 0.3, 45° SZA, 232 Hz @ 550 nm) | 195 (no binning) 386 (binning 4) |
| radiometric linearity | >95% (10–90% full well capacity) |
| radiometric resolution | 12 bit + 1 bit gain |
| modular transfer function value at Nyquist | >20% |
| full width at half maximum | <3 nm |
| pixel size | 24 m × 24 m |
| maximum frame rate | 232 Hz in Rolling Shutter Mode |
| polarization | <5% |
| along track pointing capability | ±15° |
| pointing accuracy | <0.004° |
| mass | 88 kg |
| ISS orbit | 400 km |
© 2019 by the authors. Licensee MDPI, Basel, Switzerland. This article is an open access article distributed under the terms and conditions of the Creative Commons Attribution (CC BY) license (http://creativecommons.org/licenses/by/4.0/).
Share and Cite
Krutz, D.; Müller, R.; Knodt, U.; Günther, B.; Walter, I.; Sebastian, I.; Säuberlich, T.; Reulke, R.; Carmona, E.; Eckardt, A.; et al. The Instrument Design of the DLR Earth Sensing Imaging Spectrometer (DESIS). Sensors 2019, 19, 1622. https://doi.org/10.3390/s19071622
Krutz D, Müller R, Knodt U, Günther B, Walter I, Sebastian I, Säuberlich T, Reulke R, Carmona E, Eckardt A, et al. The Instrument Design of the DLR Earth Sensing Imaging Spectrometer (DESIS). Sensors. 2019; 19(7):1622. https://doi.org/10.3390/s19071622
Chicago/Turabian StyleKrutz, David, Rupert Müller, Uwe Knodt, Burghardt Günther, Ingo Walter, Ilse Sebastian, Thomas Säuberlich, Ralf Reulke, Emiliano Carmona, Andreas Eckardt, and et al. 2019. "The Instrument Design of the DLR Earth Sensing Imaging Spectrometer (DESIS)" Sensors 19, no. 7: 1622. https://doi.org/10.3390/s19071622
APA StyleKrutz, D., Müller, R., Knodt, U., Günther, B., Walter, I., Sebastian, I., Säuberlich, T., Reulke, R., Carmona, E., Eckardt, A., Venus, H., Fischer, C., Zender, B., Arloth, S., Lieder, M., Neidhardt, M., Grote, U., Schrandt, F., Gelmi, S., & Wojtkowiak, A. (2019). The Instrument Design of the DLR Earth Sensing Imaging Spectrometer (DESIS). Sensors, 19(7), 1622. https://doi.org/10.3390/s19071622