Monitoring the Degradation of Island Permafrost Using Time-Series InSAR Technique: A Case Study of Heihe, China


Abstract
1. Introduction
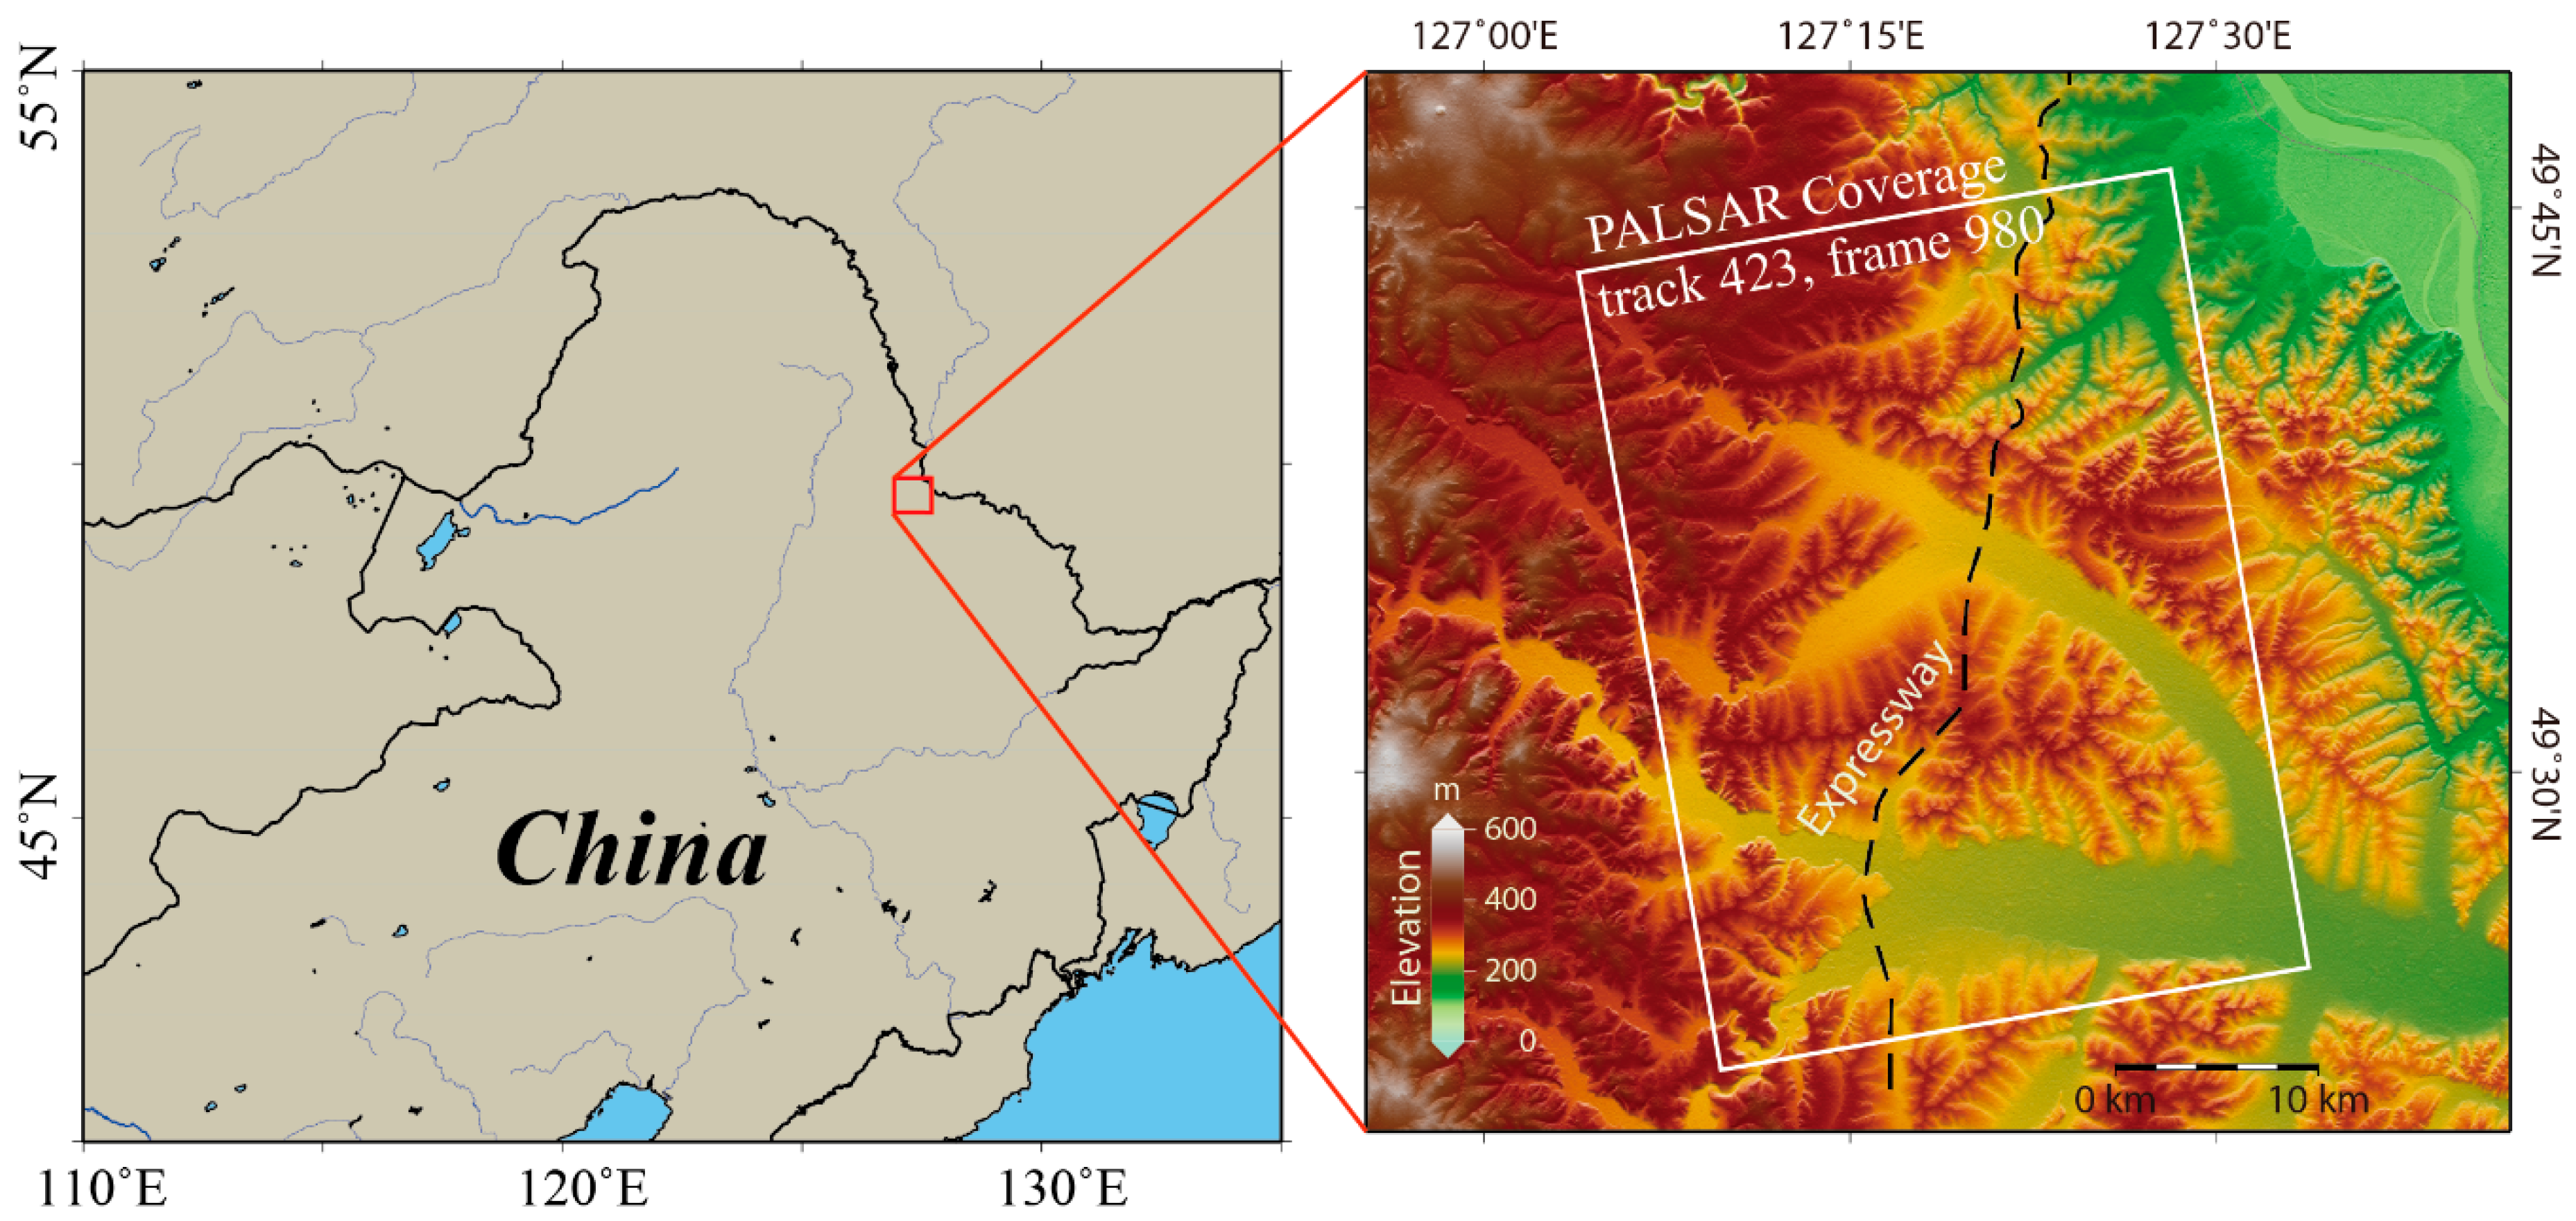
2. Study Area
3. Data Processing and Results
4. Results, Analysis, and Discussion
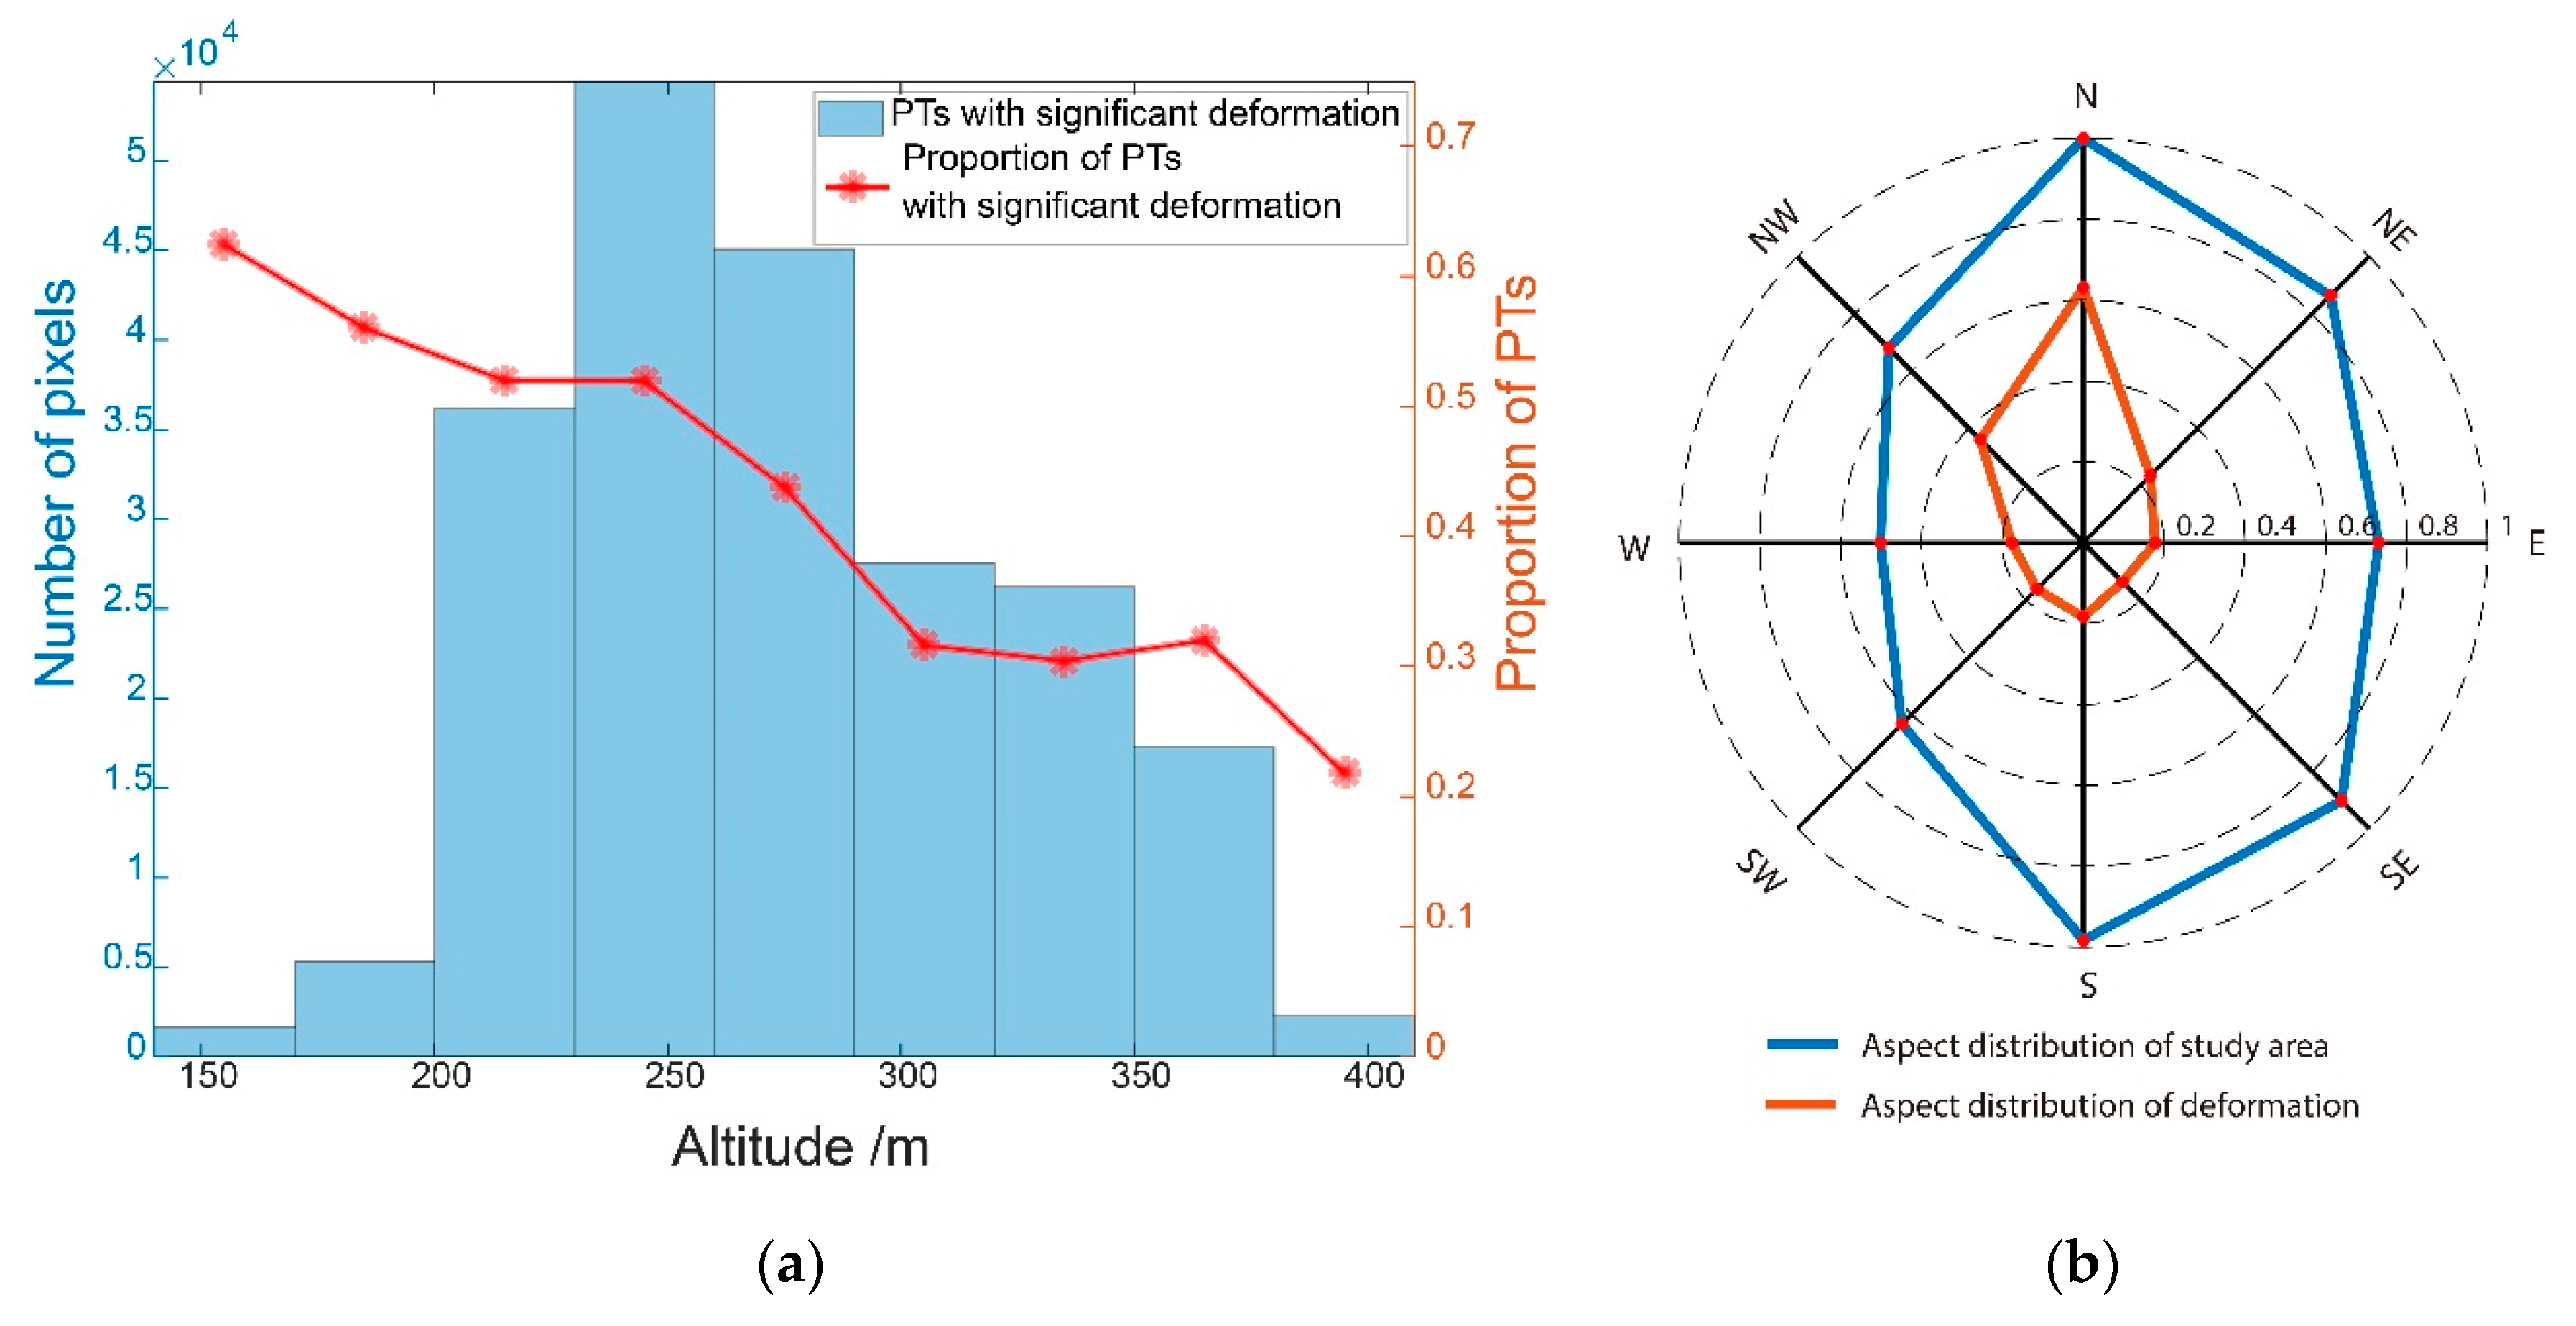
4.1. Deformation Statistics with Topographic Factors
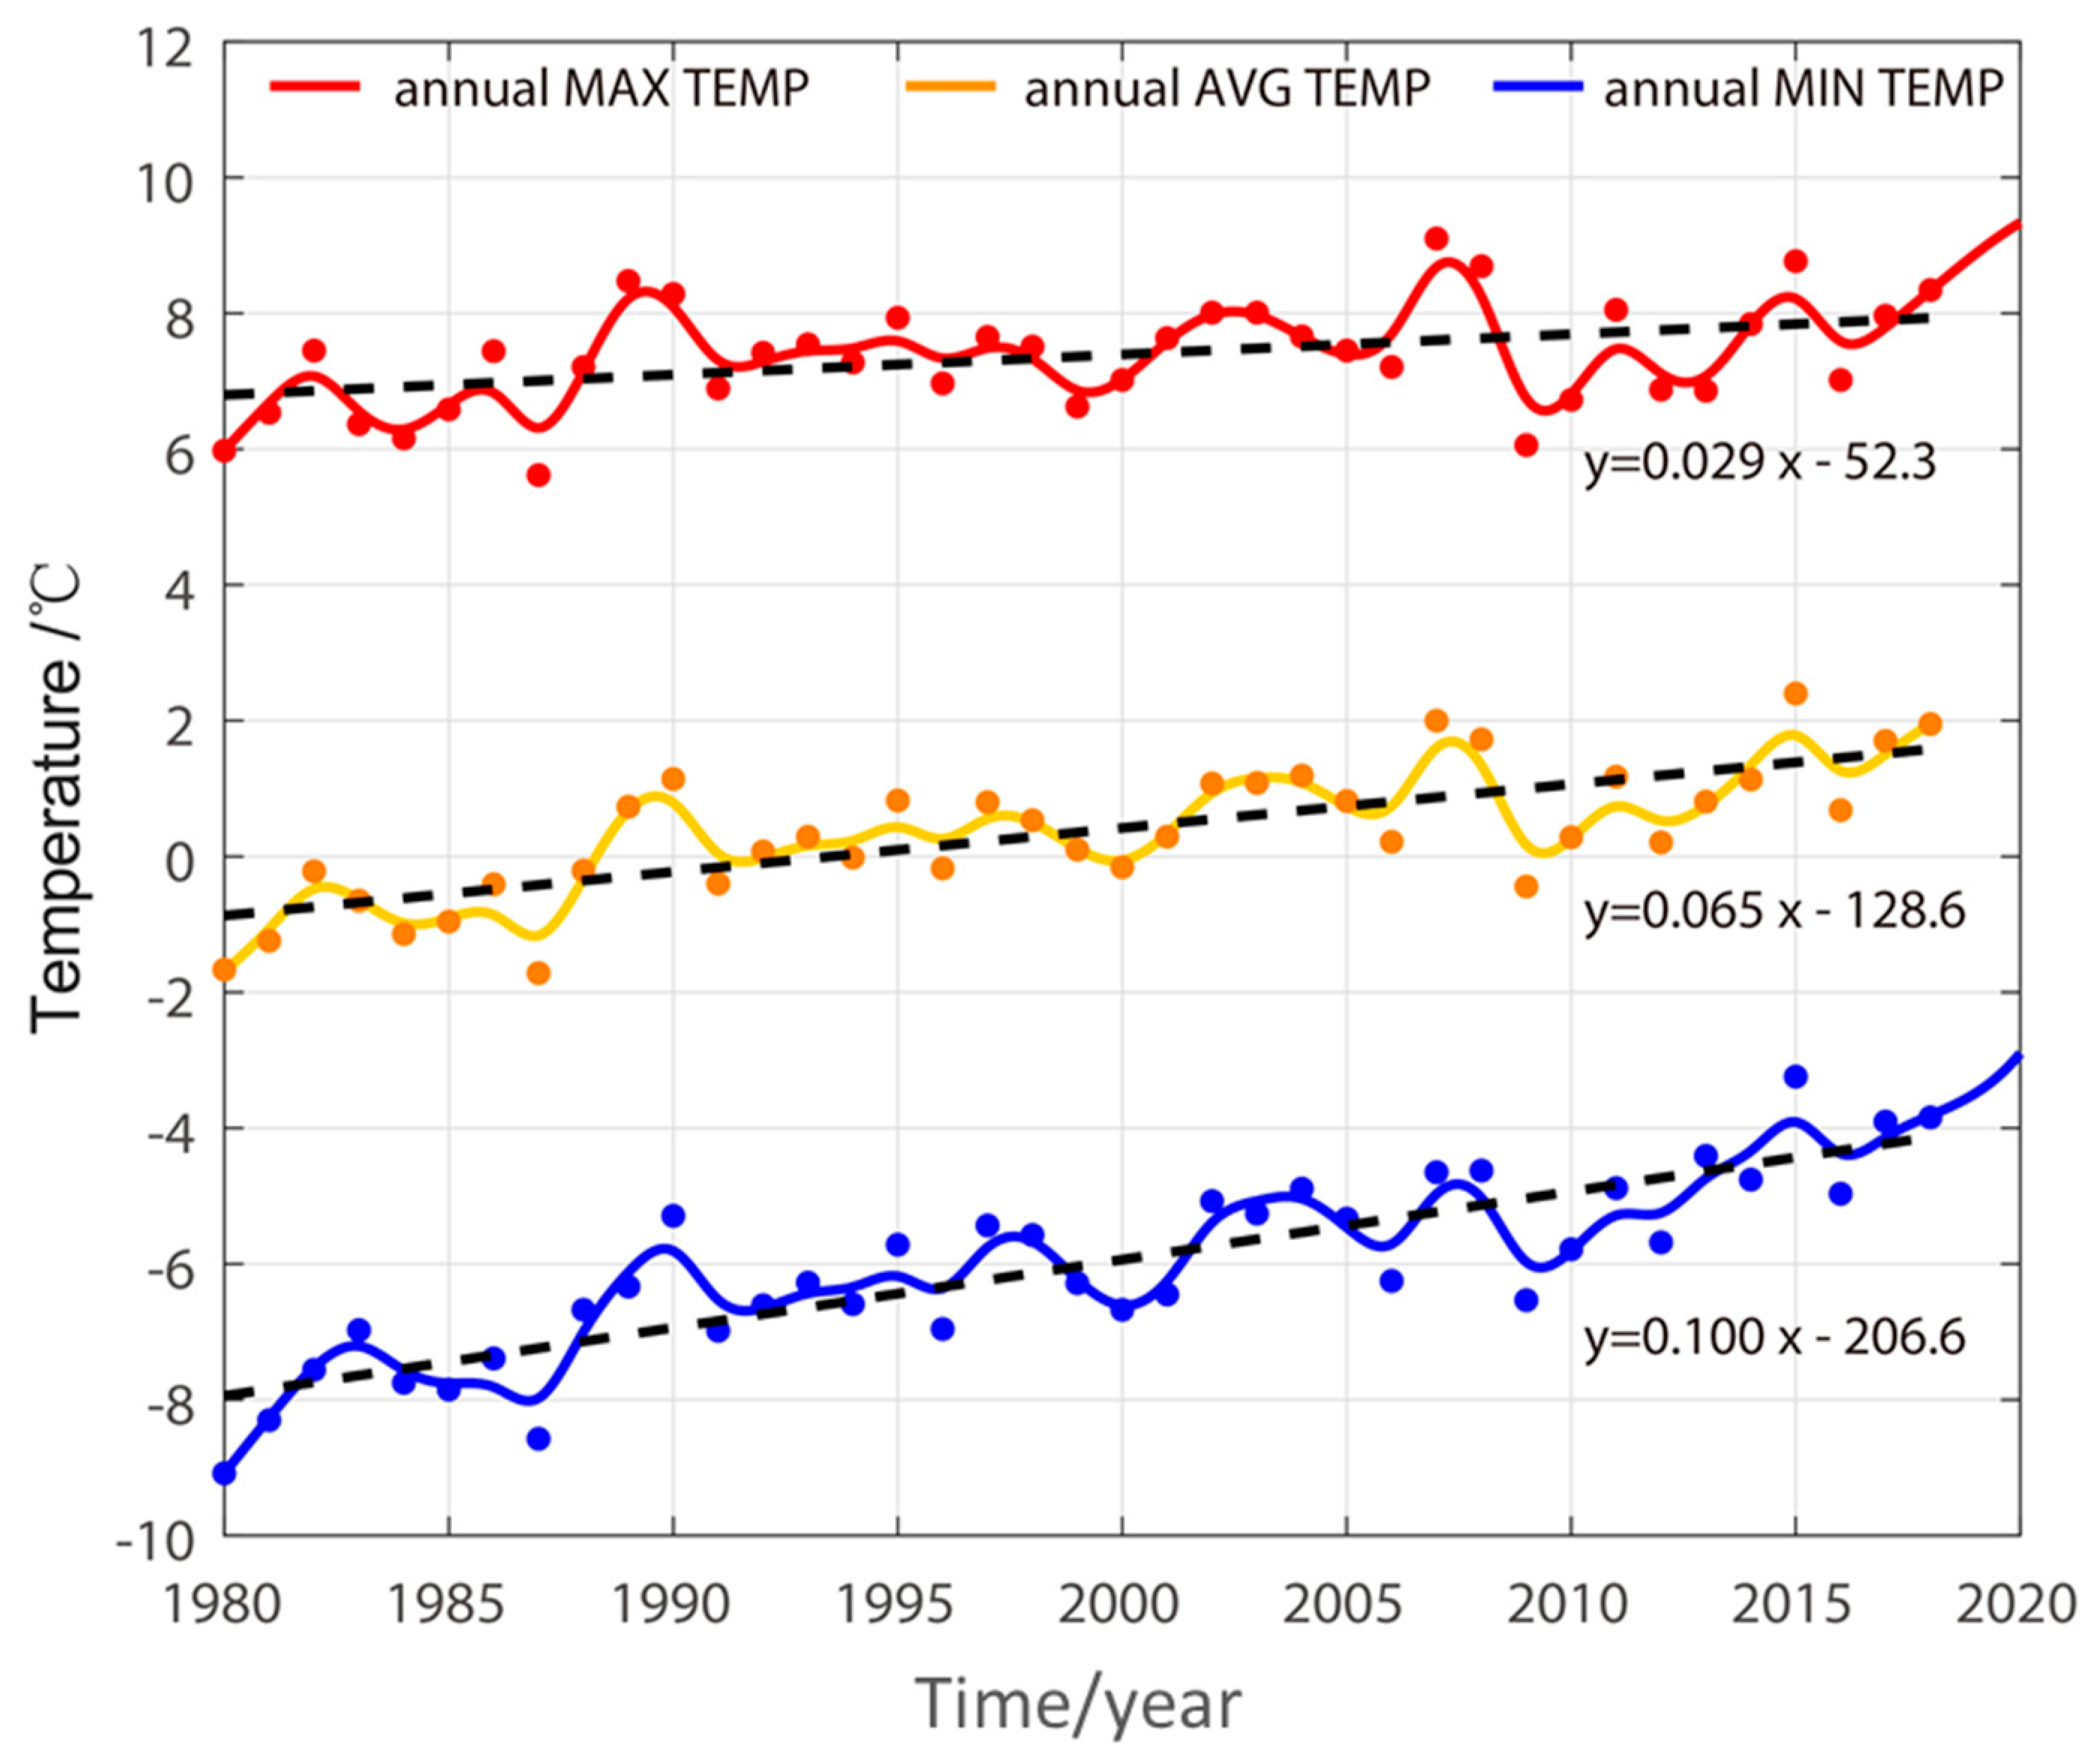
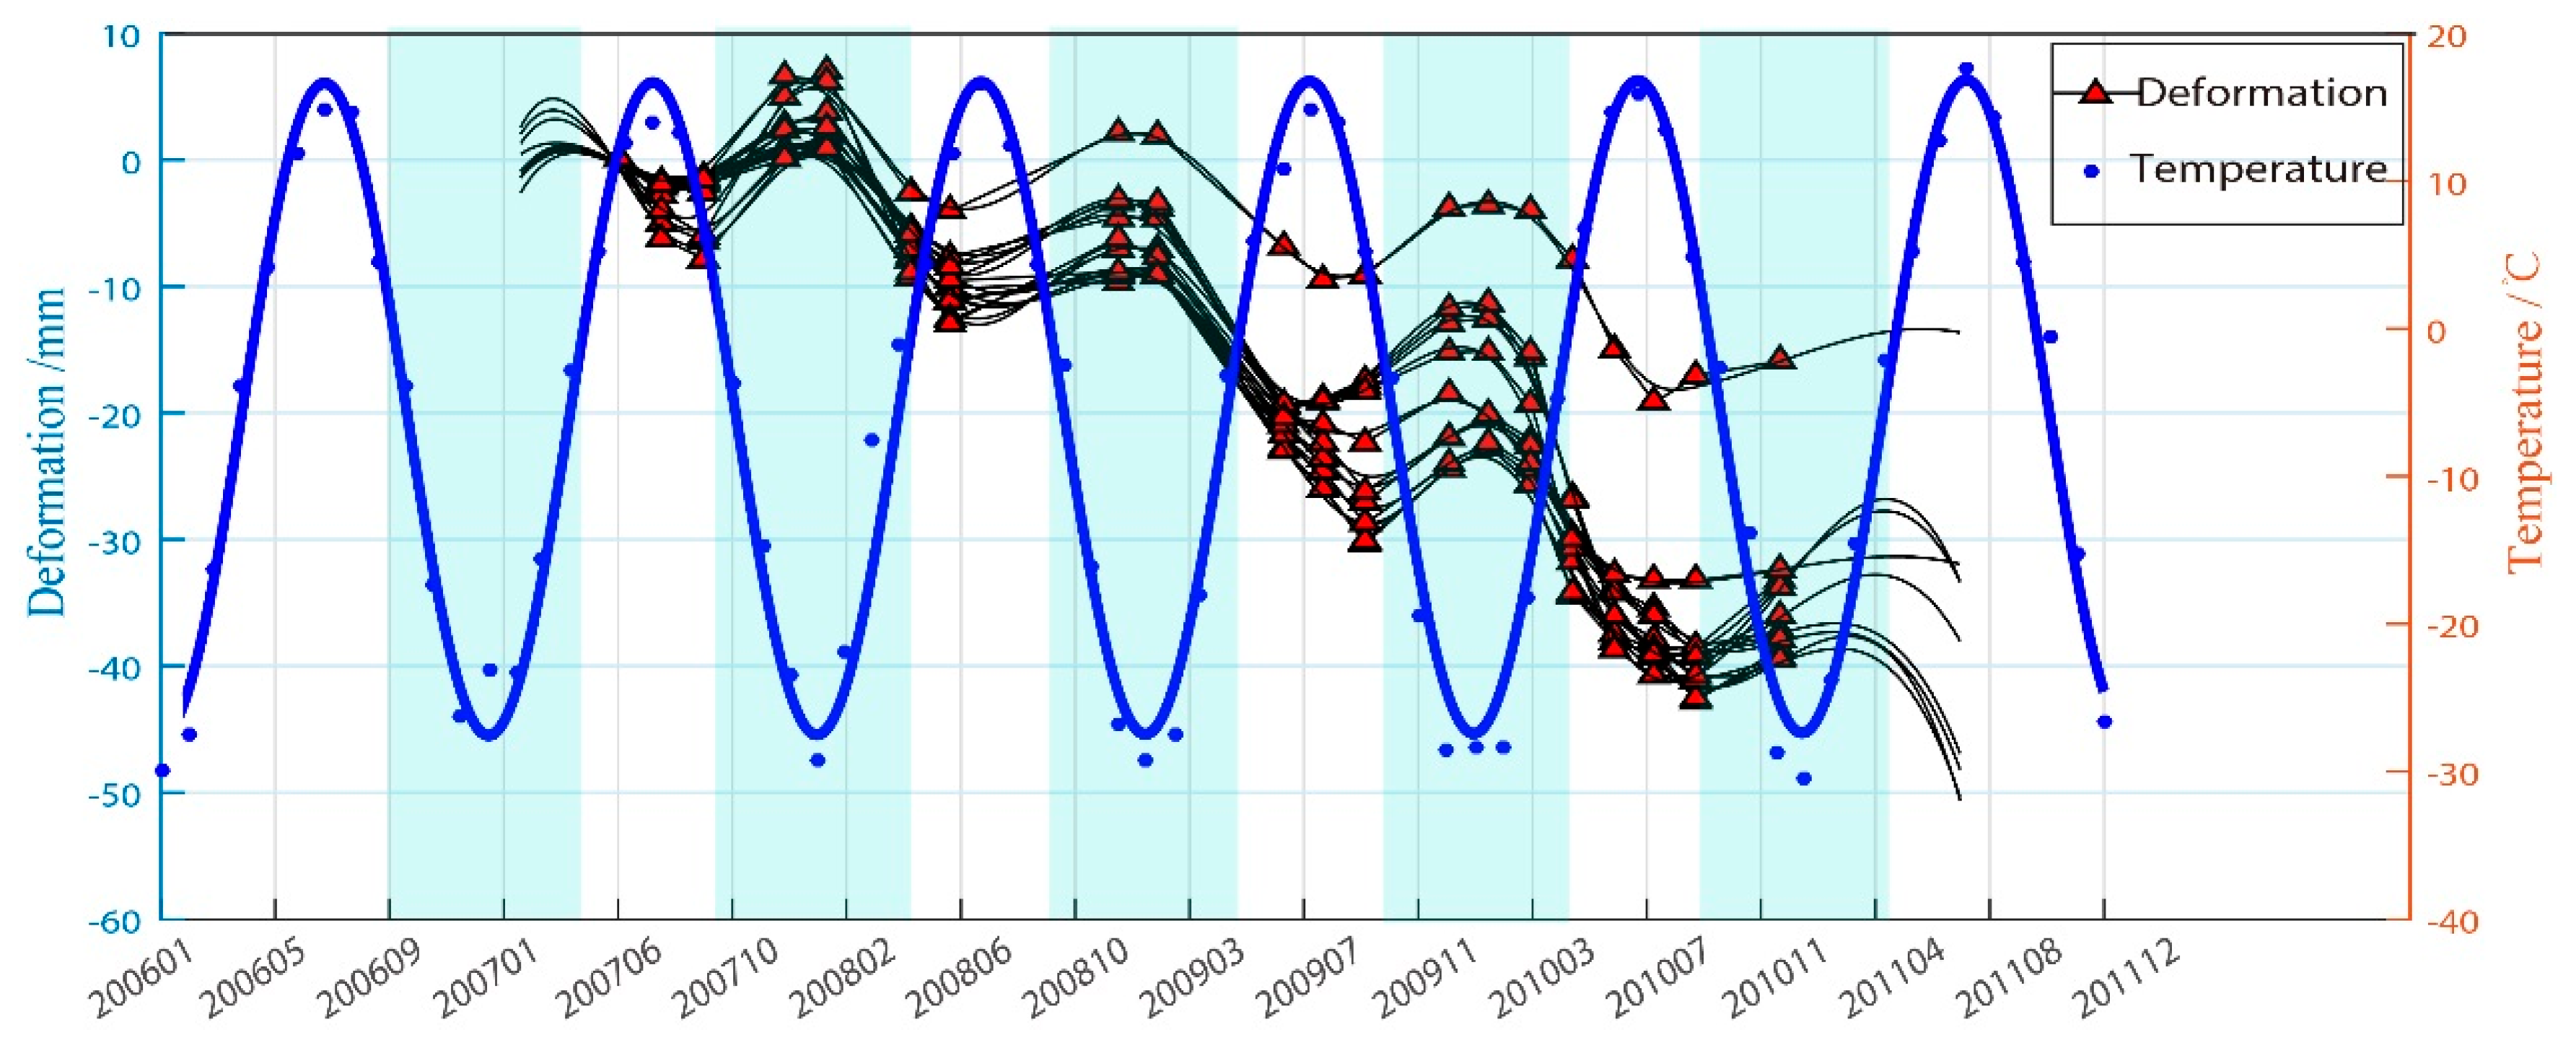
4.2. Correlation Analysis with Air Temperature
4.3. Potential Geological Hazards
5. Conclusions
- (1)
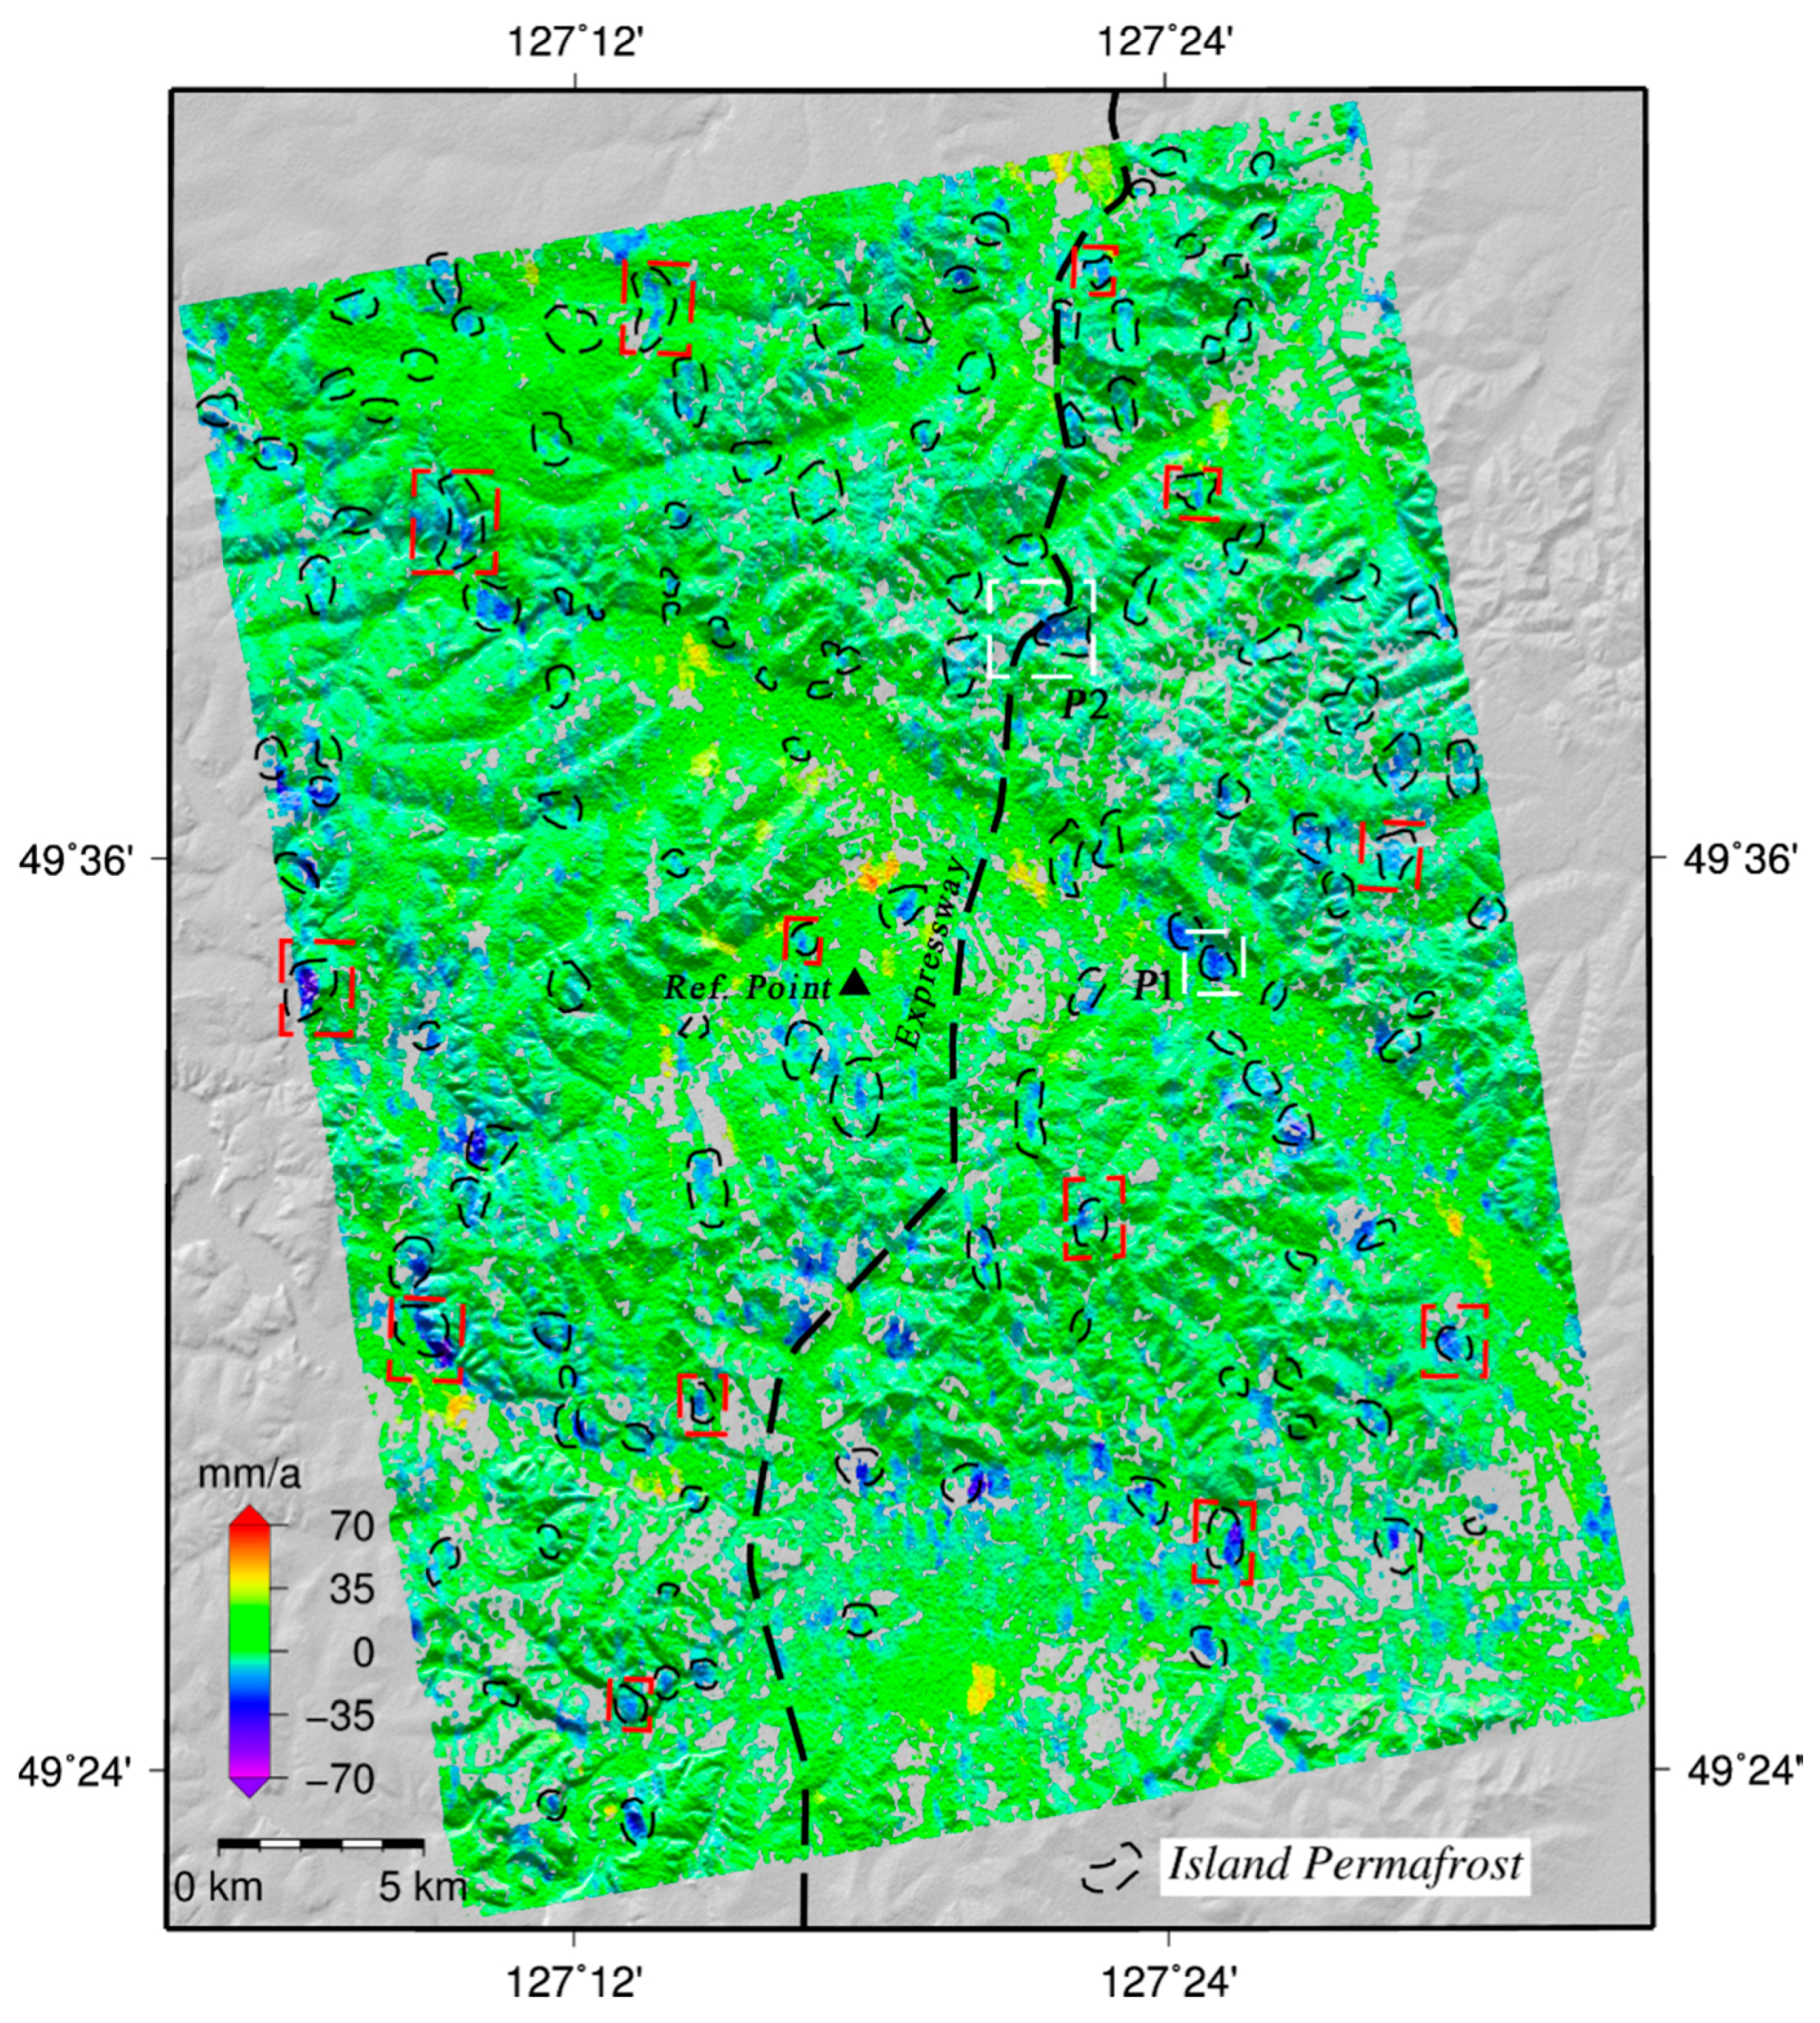
- The time deformation of the Bei’an–Heihe area was obtained. From 2007 to 2010, the area had a deformation rate of −70 to 70 mm/a. The ground deformation caused by the thawing of permafrost was greater than that caused by frost heaving. The settlement characteristics of the permafrost in the study area were closely related to the altitude, being mainly distributed in low-altitude areas.
- (2)
- The significant increase of temperature has intensified the development of warming and drying trends in the Heihe area. The island permafrost in the study area is sensitive to climate change. Based on a joint analysis with temperature, we found that the correlation between the deformation trend and temperature change varied from −0.78 to −0.85, with an average value of −0.80, indicating a significant correlation between degradation grade and temperature increase.
- (3)
- Permafrost degradation caused by rising temperature affects the safety of expressway construction in cold regions. Based on an analysis of the settlement on the side slope of a selected section, we believe that the influence of permafrost degradation will have an increasingly significant effect on construction in cold regions.
Author Contributions
Funding
Acknowledgments
Conflicts of Interest
References
- Ran, Y.H.; Xin, L.; Cheng, G.D.; Zhang, T.J.; Wu, Q.B.; Jin, H.J.; Rui, J. Distribution of permafrost in China: An overview of existing permafrost maps. Permafr. Periglac. Process. 2012, 23, 322–333. [Google Scholar] [CrossRef]
- Jorgenson, M.T.; Racine, C.H.; Walters, J.C.; Osterkamp, T.E. Permafrost degradation and ecological changes associated with a warmingclimate in central alaska. Clim. Chang. 2001, 48, 551–579. [Google Scholar] [CrossRef]
- Kharuk, V.I.; Shushpanov, A.S.; Im, S.T.; Ranson, K.J. Climate-induced landsliding within the larch dominant permafrost zone of central siberia. Environ. Res. Lett. 2016, 11, 045004. [Google Scholar] [CrossRef] [PubMed]
- Hooper, A.; Bekaert, D.; Spaans, K.; Arıkan, M. Recent advances in sar interferometry time series analysis for measuring crustal deformation. Tectonophysics 2011, 514, 1–13. [Google Scholar] [CrossRef]
- Ferretti, A.; Prati, C.; Rocca, F. Permanent scatterers in sar interferometry. IEEE Trans. Geosci. Remote Sens. 2001, 39, 8–20. [Google Scholar] [CrossRef]
- Berardino, P.; Fornaro, G.; Lanari, R.; Sansosti, E. A new algorithm for surface deformation monitoring based on small baseline differential sar interferograms. IEEE Trans. Geosci. Remote Sens. 2002, 40, 2375–2383. [Google Scholar] [CrossRef]
- Massonnet, D.; Rossi, M.; Carmona, C.; Adragna, F.; Peltzer, G.; Feigl, K.; Rabaute, T. The displacement field of the landers earthquake mapped by radar interferometry. Nature 1993, 364, 138–142. [Google Scholar] [CrossRef]
- Jiang, L.; Lin, H.; Jianwei, M.A.; Kong, B.; Wang, Y. Potential of small-baseline sar interferometry for monitoring land subsidence related to underground coal fires: Wuda (northern China) case study. Remote Sens. Environ. 2011, 115, 257–268. [Google Scholar] [CrossRef]
- Singhroy, V.; Mattar, K.E.; Gray, A.L. Landslide characterisation in canada using interferometric sar and combined sar and tm images. Adv. Space Res. 1998, 21, 465–476. [Google Scholar] [CrossRef]
- Deguchi, T.; Narita, T. Monitoring of Land Deformation Due to Oil Production by Insar Time Series Analysis. In Proceedings of the Fringe 2015 Workshop, Frascati, Italy, 23–27 March 2015. [Google Scholar]
- Bell, J.W.; Amelung, F.; Ferretti, A.; Bianchi, M.; Novali, F. Permanent scatterer insar reveals seasonal and long-term aquifer-system response to groundwater pumping and artificial recharge. Water Resour. Res. 2008, 44. [Google Scholar] [CrossRef]
- Rong, Z. Monitoring surface deformation over permafrost with an improved sbas-insar algorithm: With emphasis on climatic factors modeling. Remote Sens. Environ. 2016, 184, 276–287. [Google Scholar]
- Short, N.; Brisco, B.; Couture, N.; Pollard, W.; Murnaghan, K.; Budkewitsch, P. A comparison of terrasar-x, radarsat-2 and alos-palsar interferometry for monitoring permafrost environments, case study from herschel island, canada. Remote Sens. Environ. 2011, 115, 3491–3506. [Google Scholar] [CrossRef]
- Wang, C. Study on Surface Deformation in Degraded Permafrost Region of Northeast China Based on d-Insar. Ph.D. Thesis, Northeast Forestry University, Harbin, China, 2015. (In Chinese). [Google Scholar]
- Shi, P.J.; Shao, S.; Ming, W.; Ning, L.; Wang, J.A.; Jin, Y.Y.; Gu, X.T.; Yin, W.X. Climate change regionalization in China (1961–2010). Sci. Chin. Earth Sci. 2014, 57, 2676–2689. [Google Scholar] [CrossRef]
- Wei, S.; Hu, Z.; Ying, G.; Zhang, C.; Wang, C.; Hua, J.; Yao, L.; Xiao, J. The impact of climate change on landslides in southeastern of high-latitude permafrost regions of China. Front. Earth Sci. 2015, 3, 7. [Google Scholar]
- Edenhofer, O.; Seyboth, K. Intergovernmental panel on climate change (ipcc). Encycl. Energy Nat. Res. Environ. Econ. 2013, 26, 48–56. [Google Scholar]
- Zhou, Y.; Wang, Y.; Gao, X.; Yue, H. Ground temperature, permafrost distribution and climate warming in northeastern China. J. Glaciol. Geocryol. 1996, 139–146. [Google Scholar]
- He, R.-X.; Jin, H.-J.; Chang, X.-L.; Lv, L.-Z.; Yu, S.-P.; Yang, S.-Z.; Wang, S.-L.; Sun, G.-Y. Degradation of permafrost in the northern part of northeastern China:Present state and causal analysis. J. Glaciol. Geocryol. 2009, 31, 829–834. [Google Scholar]
- Zebker, H.A.; Villasenor, J. Decorrelation in interferometric radar echoes. IEEE Trans. Geosci. Remote Sens. 1992, 30, 950–959. [Google Scholar] [CrossRef]
- Rosen, P.A.; Hensley, S.; Joughin, I.R.; Li, F.K.; Madsen, S.N.; Rodriguez, E.; Goldstein, R.M. Synthetic aperture radar interferometry. Proc. IEEE 2000, 88, 333–382. [Google Scholar] [CrossRef]
- Werner, C.; Wegmüller, U.; Strozzi, T.; Wiesmann, A. Gamma Sar and Interferometric Processing Software; Citeseer: Gothenburg, Sweden, 2000; p. 1620. [Google Scholar]
- Hashimoto, M.; Fukushima, Y. An attempt to detect secular deformation associated with the subduction of the philippine sea plate with alos/palsar. In Proceedings of the Agu Fall Meeting, San Francisco, CA, USA, 14–18 December 2009. [Google Scholar]
- Jiang, M.; Ding, X.; Li, Z.; Jiang, M. Hybrid approach for unbiased coherence estimation for multitemporal insar. IEEE Trans. Geosci. Remote Sens. 2014, 52, 2459–2473. [Google Scholar] [CrossRef]
- Werner, C.; Wegmuller, U.; Strozzi, T.; Wiesmann, A. Interferometric point target analysis for deformation mapping. In Proceedings of the 2003 IEEE International Geoscience and Remote Sensing Symposium. (IEEE Cat. No. 03CH37477), Toulouse, France, 21–25 July 2003; pp. 4362–4364. [Google Scholar]
- Ferretti, A.; Prati, C.; Rocca, F. Nonlinear subsidence rate estimation using permanent scatterers in differential sar interferometry. IEEE Trans. Geosci. Remote Sens. 2000, 38, 2202–2212. [Google Scholar] [CrossRef]
- Costantini, M. A novel phase unwrapping method based on network programming. IEEE Trans. Geosci. Remote Sens. 1998, 36, 813–821. [Google Scholar] [CrossRef]
- Wang, C.; Wei, S.; Ying, G.; Hu, Z.; Hua, J. Permafrost Distribution Study Based on Landsat Etm+ Imagery of The Northwest Section of the Lesser Khingan Range, China; Springer: Berlin, Germany, 2014. [Google Scholar]
- Jin, H.J.; Shu xun, L.I.; Wang, S.L.; Zhao, L. Impacts of climatic change on permafrost and cold regions environments in China. Acta Geogr. Sin. 2000, 55, 161–173. [Google Scholar]
- Wang, J. Impact of Land Use Planning on Land Use Change in Sunwu County. Master’s Thesis, Northeast Forestry University, Harbin, China, 2012. (In Chinese). [Google Scholar]
- Jin, H.; Yu, Q.; Lü, L.; Guo, D.; He, R.; Yu, S.; Sun, G.; Li, Y. Degradation of permafrost in the xing’anling mountains, northeastern China. Permafr. Perigl. Process. 2010, 18, 245–258. [Google Scholar] [CrossRef]
- Shi, X.; Liao, M.; Teng, W.; Lu, Z.; Wei, S.; Wang, C. Expressway deformation mapping using high-resolution terrasar-x images. Remote Sens. Lett. 2014, 5, 194–203. [Google Scholar] [CrossRef]


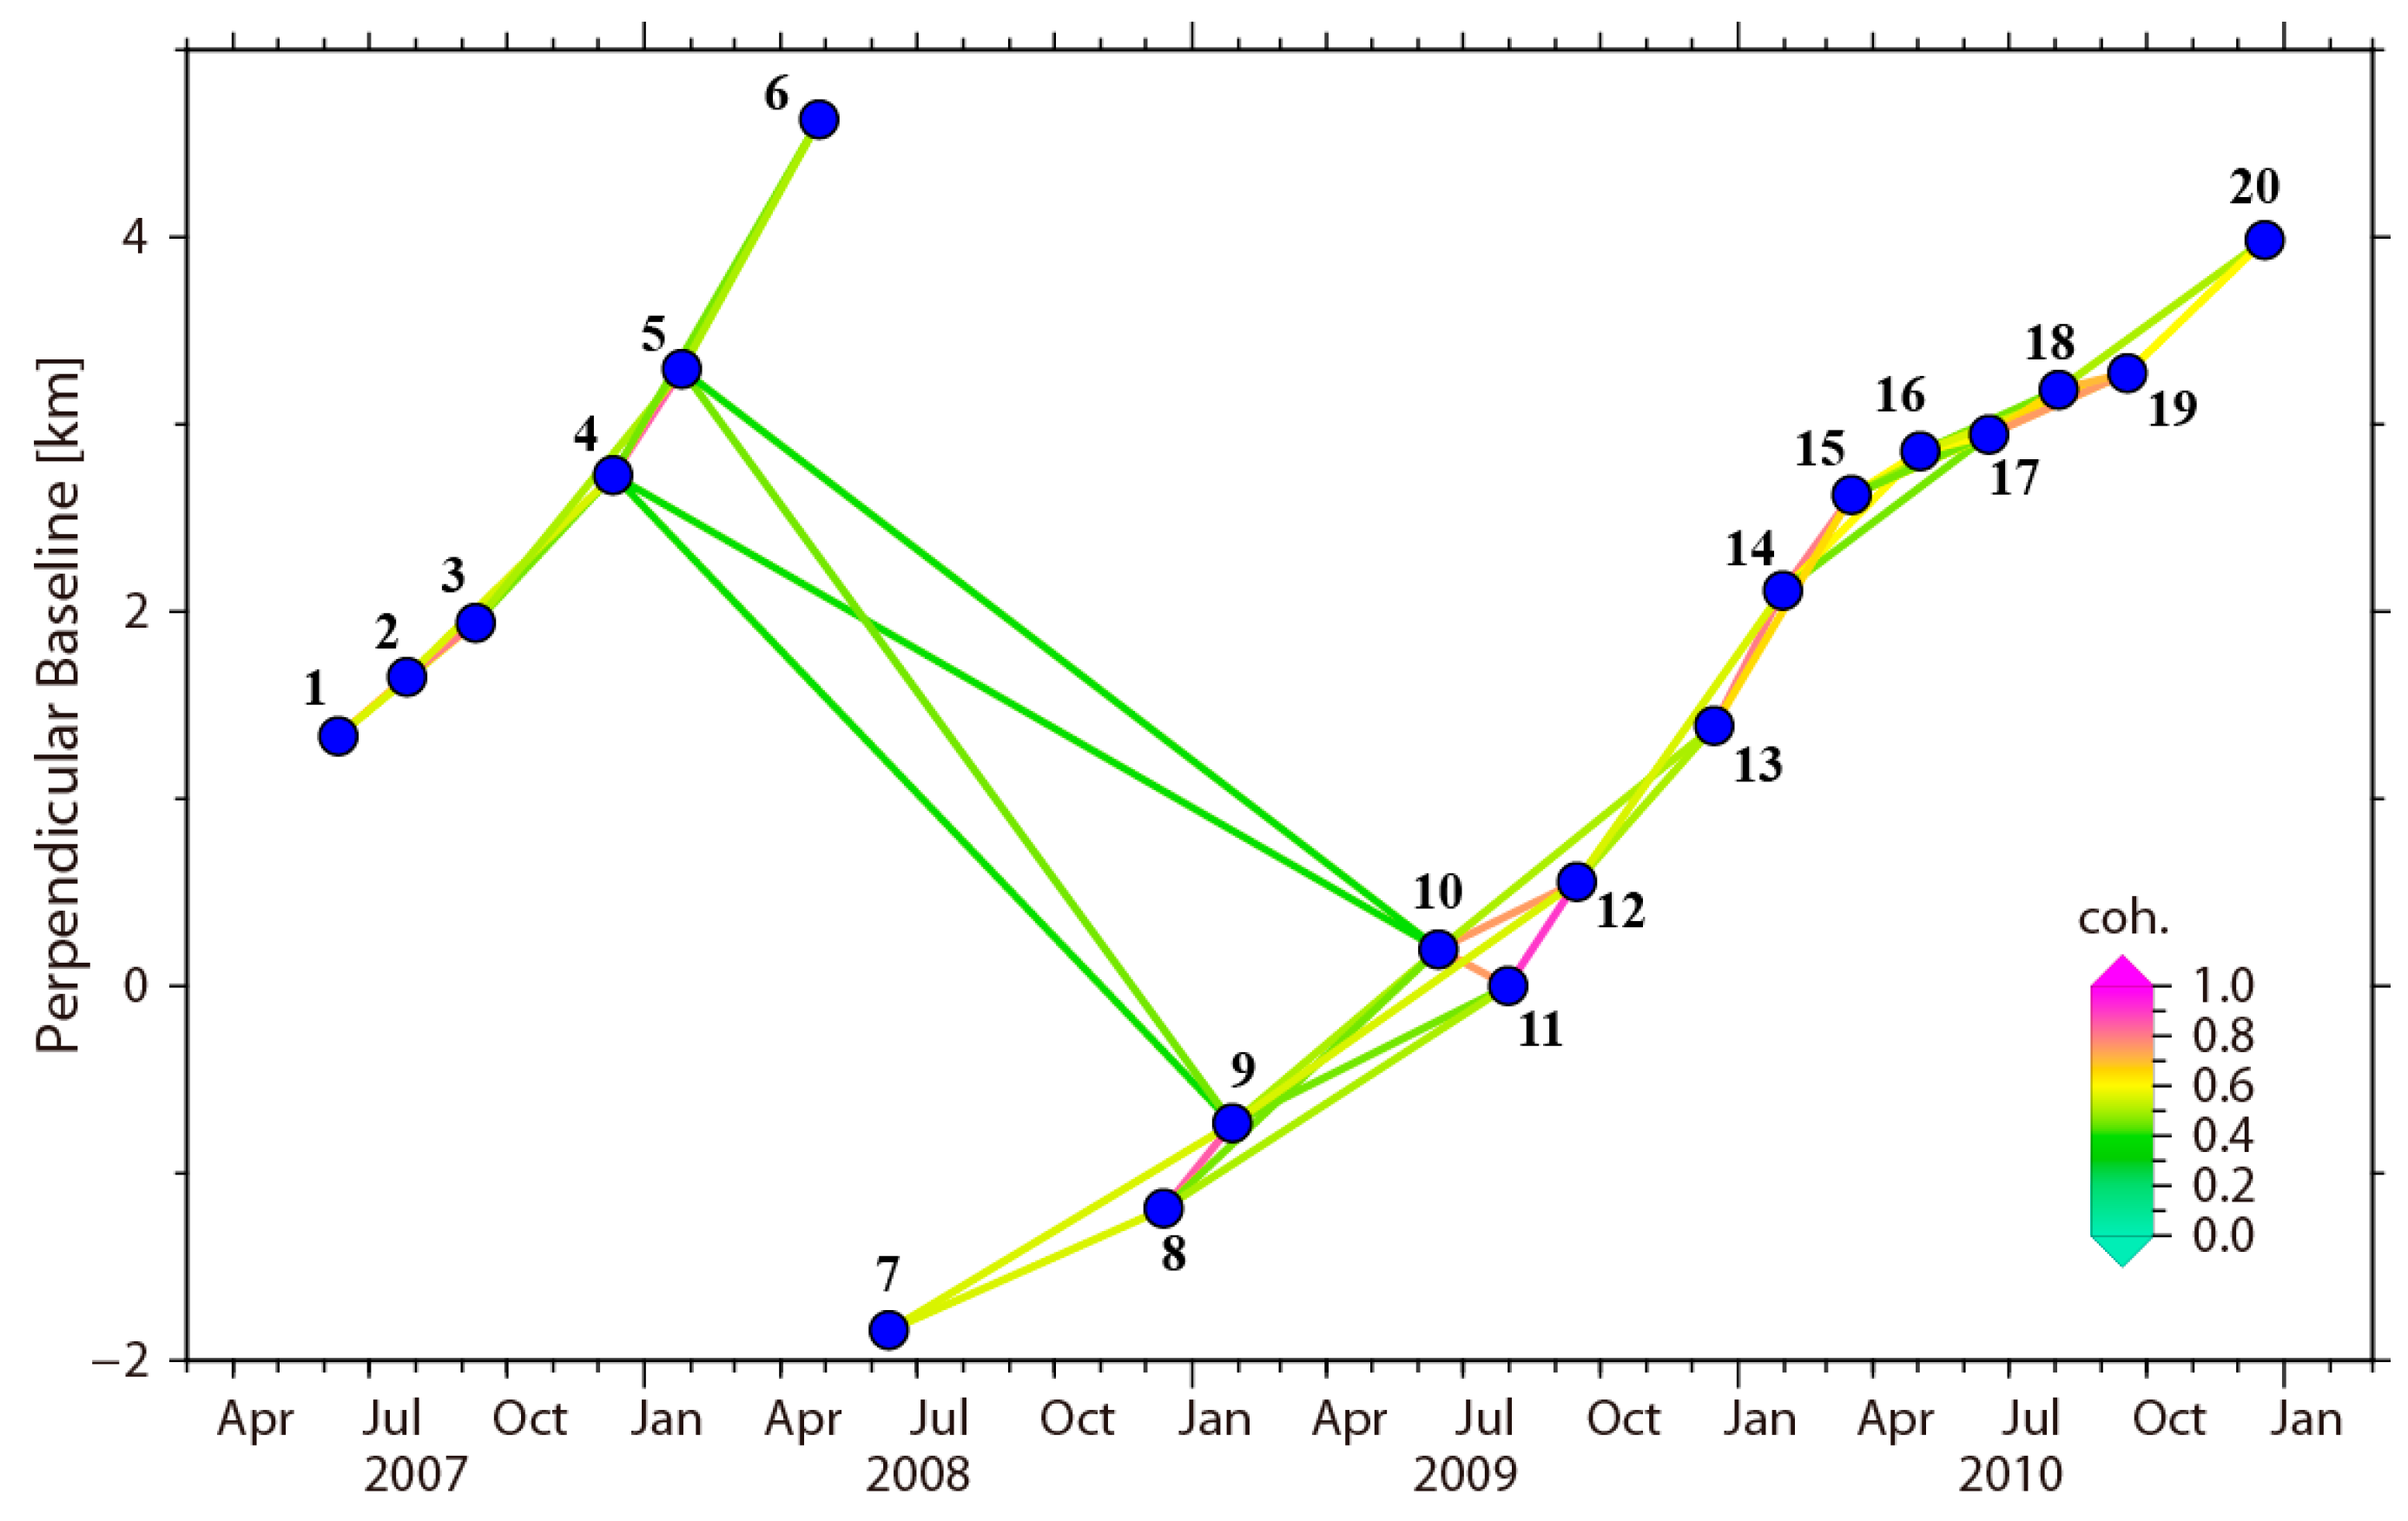
| No. | Acq. Date | Orbit | Frame | Mode | No. | Acq. Date | Orbit | Frame | Mode |
|---|---|---|---|---|---|---|---|---|---|
| 1 | 20070610 | 07330 | 980 | FBS | 11 | 20090731 | 18737 | 980 | FBS |
| 2 | 20070726 | 08001 | 980 | FBS | 12 | 20090915 | 19408 | 980 | FBS |
| 3 | 20070910 | 08672 | 980 | FBS | 13 | 20091216 | 20750 | 980 | FBD |
| 4 | 20071211 | 10014 | 980 | FBD | 14 | 20100131 | 21421 | 980 | FBD |
| 5 | 20080126 | 10685 | 980 | FBD | 15 | 20100318 | 22092 | 980 | FBD |
| 6 | 20080427 | 12027 | 980 | FBS | 16 | 20100503 | 22763 | 980 | FBS |
| 7 | 20080612 | 12698 | 980 | FBS | 17 | 20100618 | 23434 | 980 | FBS |
| 8 | 20081213 | 15382 | 980 | FBD | 18 | 20100803 | 24105 | 980 | FBS |
| 9 | 20090128 | 16053 | 980 | FBD | 19 | 20100918 | 24776 | 980 | FBS |
| 10 | 20090615 | 18066 | 980 | FBD | 20 | 20101219 | 26118 | 980 | FBD |
© 2019 by the authors. Licensee MDPI, Basel, Switzerland. This article is an open access article distributed under the terms and conditions of the Creative Commons Attribution (CC BY) license (http://creativecommons.org/licenses/by/4.0/).
Share and Cite
Wang, S.; Xu, B.; Shan, W.; Shi, J.; Li, Z.; Feng, G. Monitoring the Degradation of Island Permafrost Using Time-Series InSAR Technique: A Case Study of Heihe, China. Sensors 2019, 19, 1364. https://doi.org/10.3390/s19061364
Wang S, Xu B, Shan W, Shi J, Li Z, Feng G. Monitoring the Degradation of Island Permafrost Using Time-Series InSAR Technique: A Case Study of Heihe, China. Sensors. 2019; 19(6):1364. https://doi.org/10.3390/s19061364
Chicago/Turabian StyleWang, Sai, Bing Xu, Wei Shan, Jiancun Shi, Zhiwei Li, and Guangcai Feng. 2019. "Monitoring the Degradation of Island Permafrost Using Time-Series InSAR Technique: A Case Study of Heihe, China" Sensors 19, no. 6: 1364. https://doi.org/10.3390/s19061364
APA StyleWang, S., Xu, B., Shan, W., Shi, J., Li, Z., & Feng, G. (2019). Monitoring the Degradation of Island Permafrost Using Time-Series InSAR Technique: A Case Study of Heihe, China. Sensors, 19(6), 1364. https://doi.org/10.3390/s19061364