Monitoring Pilot’s Mental Workload Using ERPs and Spectral Power with a Six-Dry-Electrode EEG System in Real Flight Conditions

 , ,
, ,
Abstract
1. Introduction
2. Materials and Methods
2.1. Participants
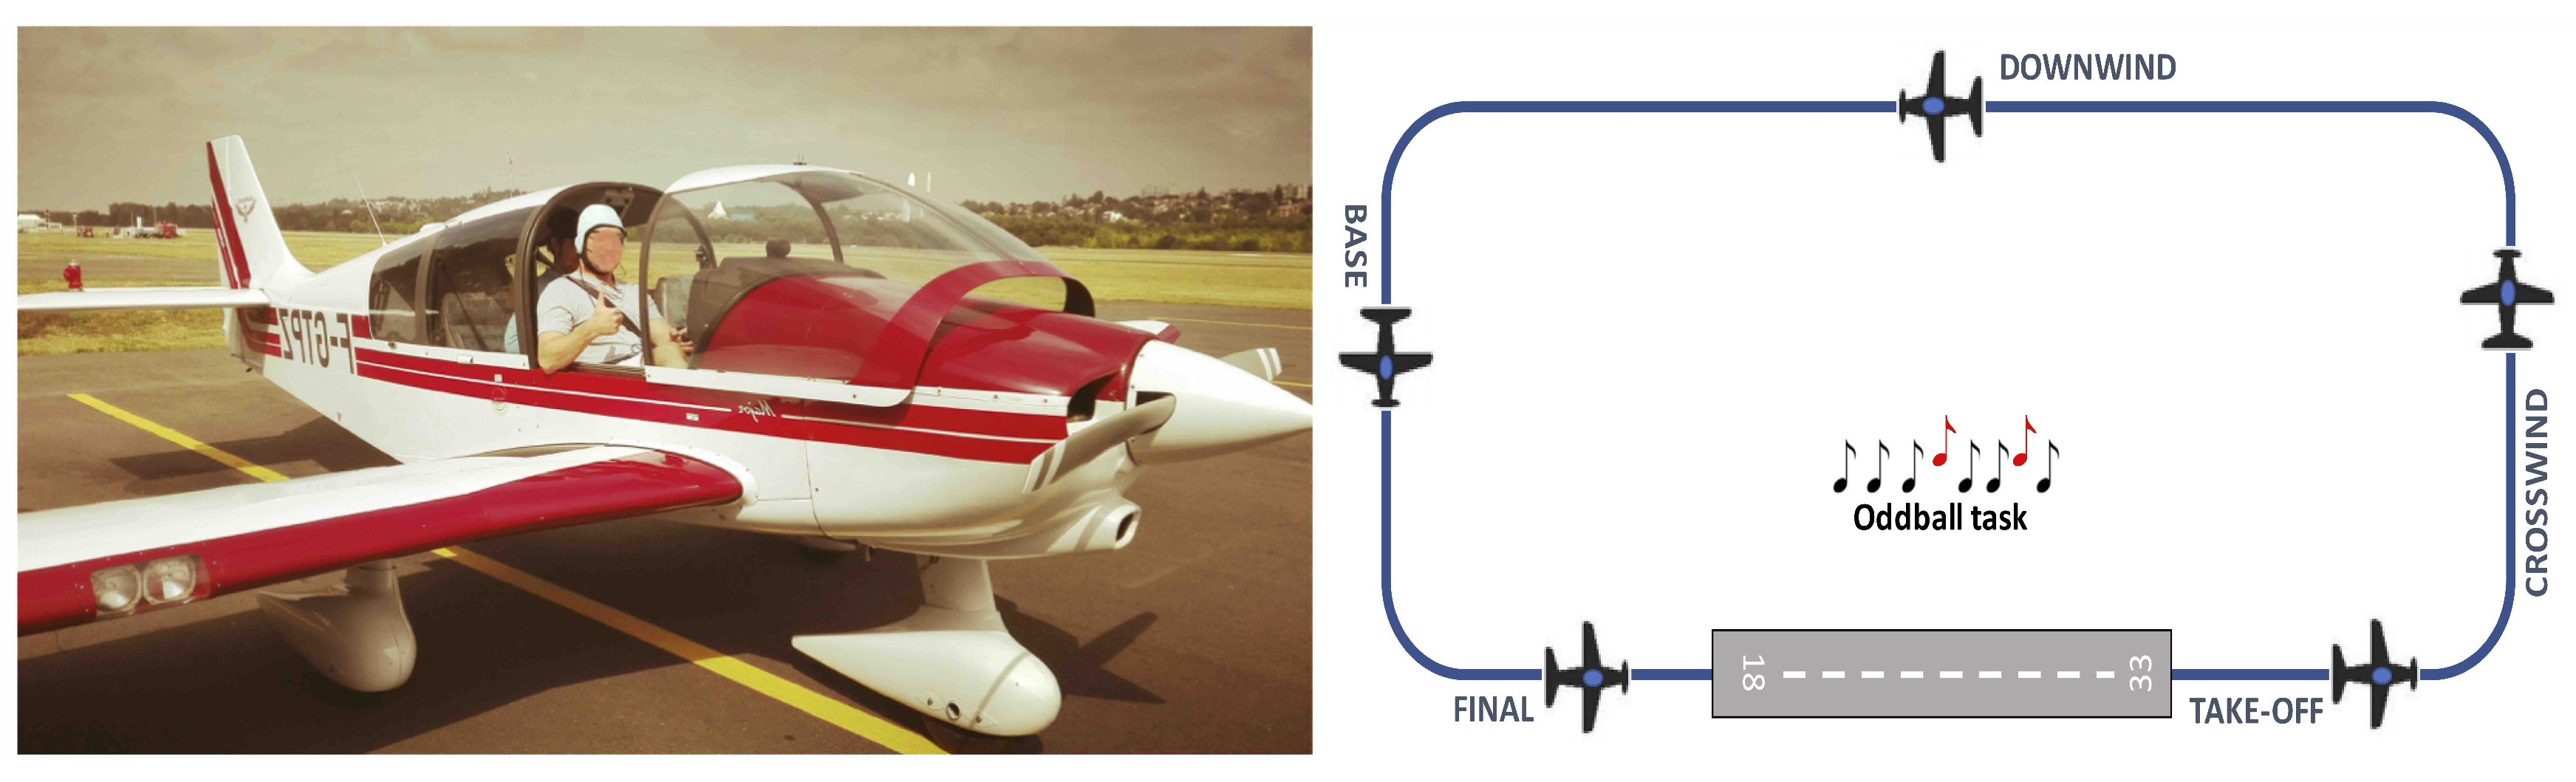
2.2. Airplane
2.3. Flight Scenario
2.4. EEG Analyses
2.4.1. EEG Recording
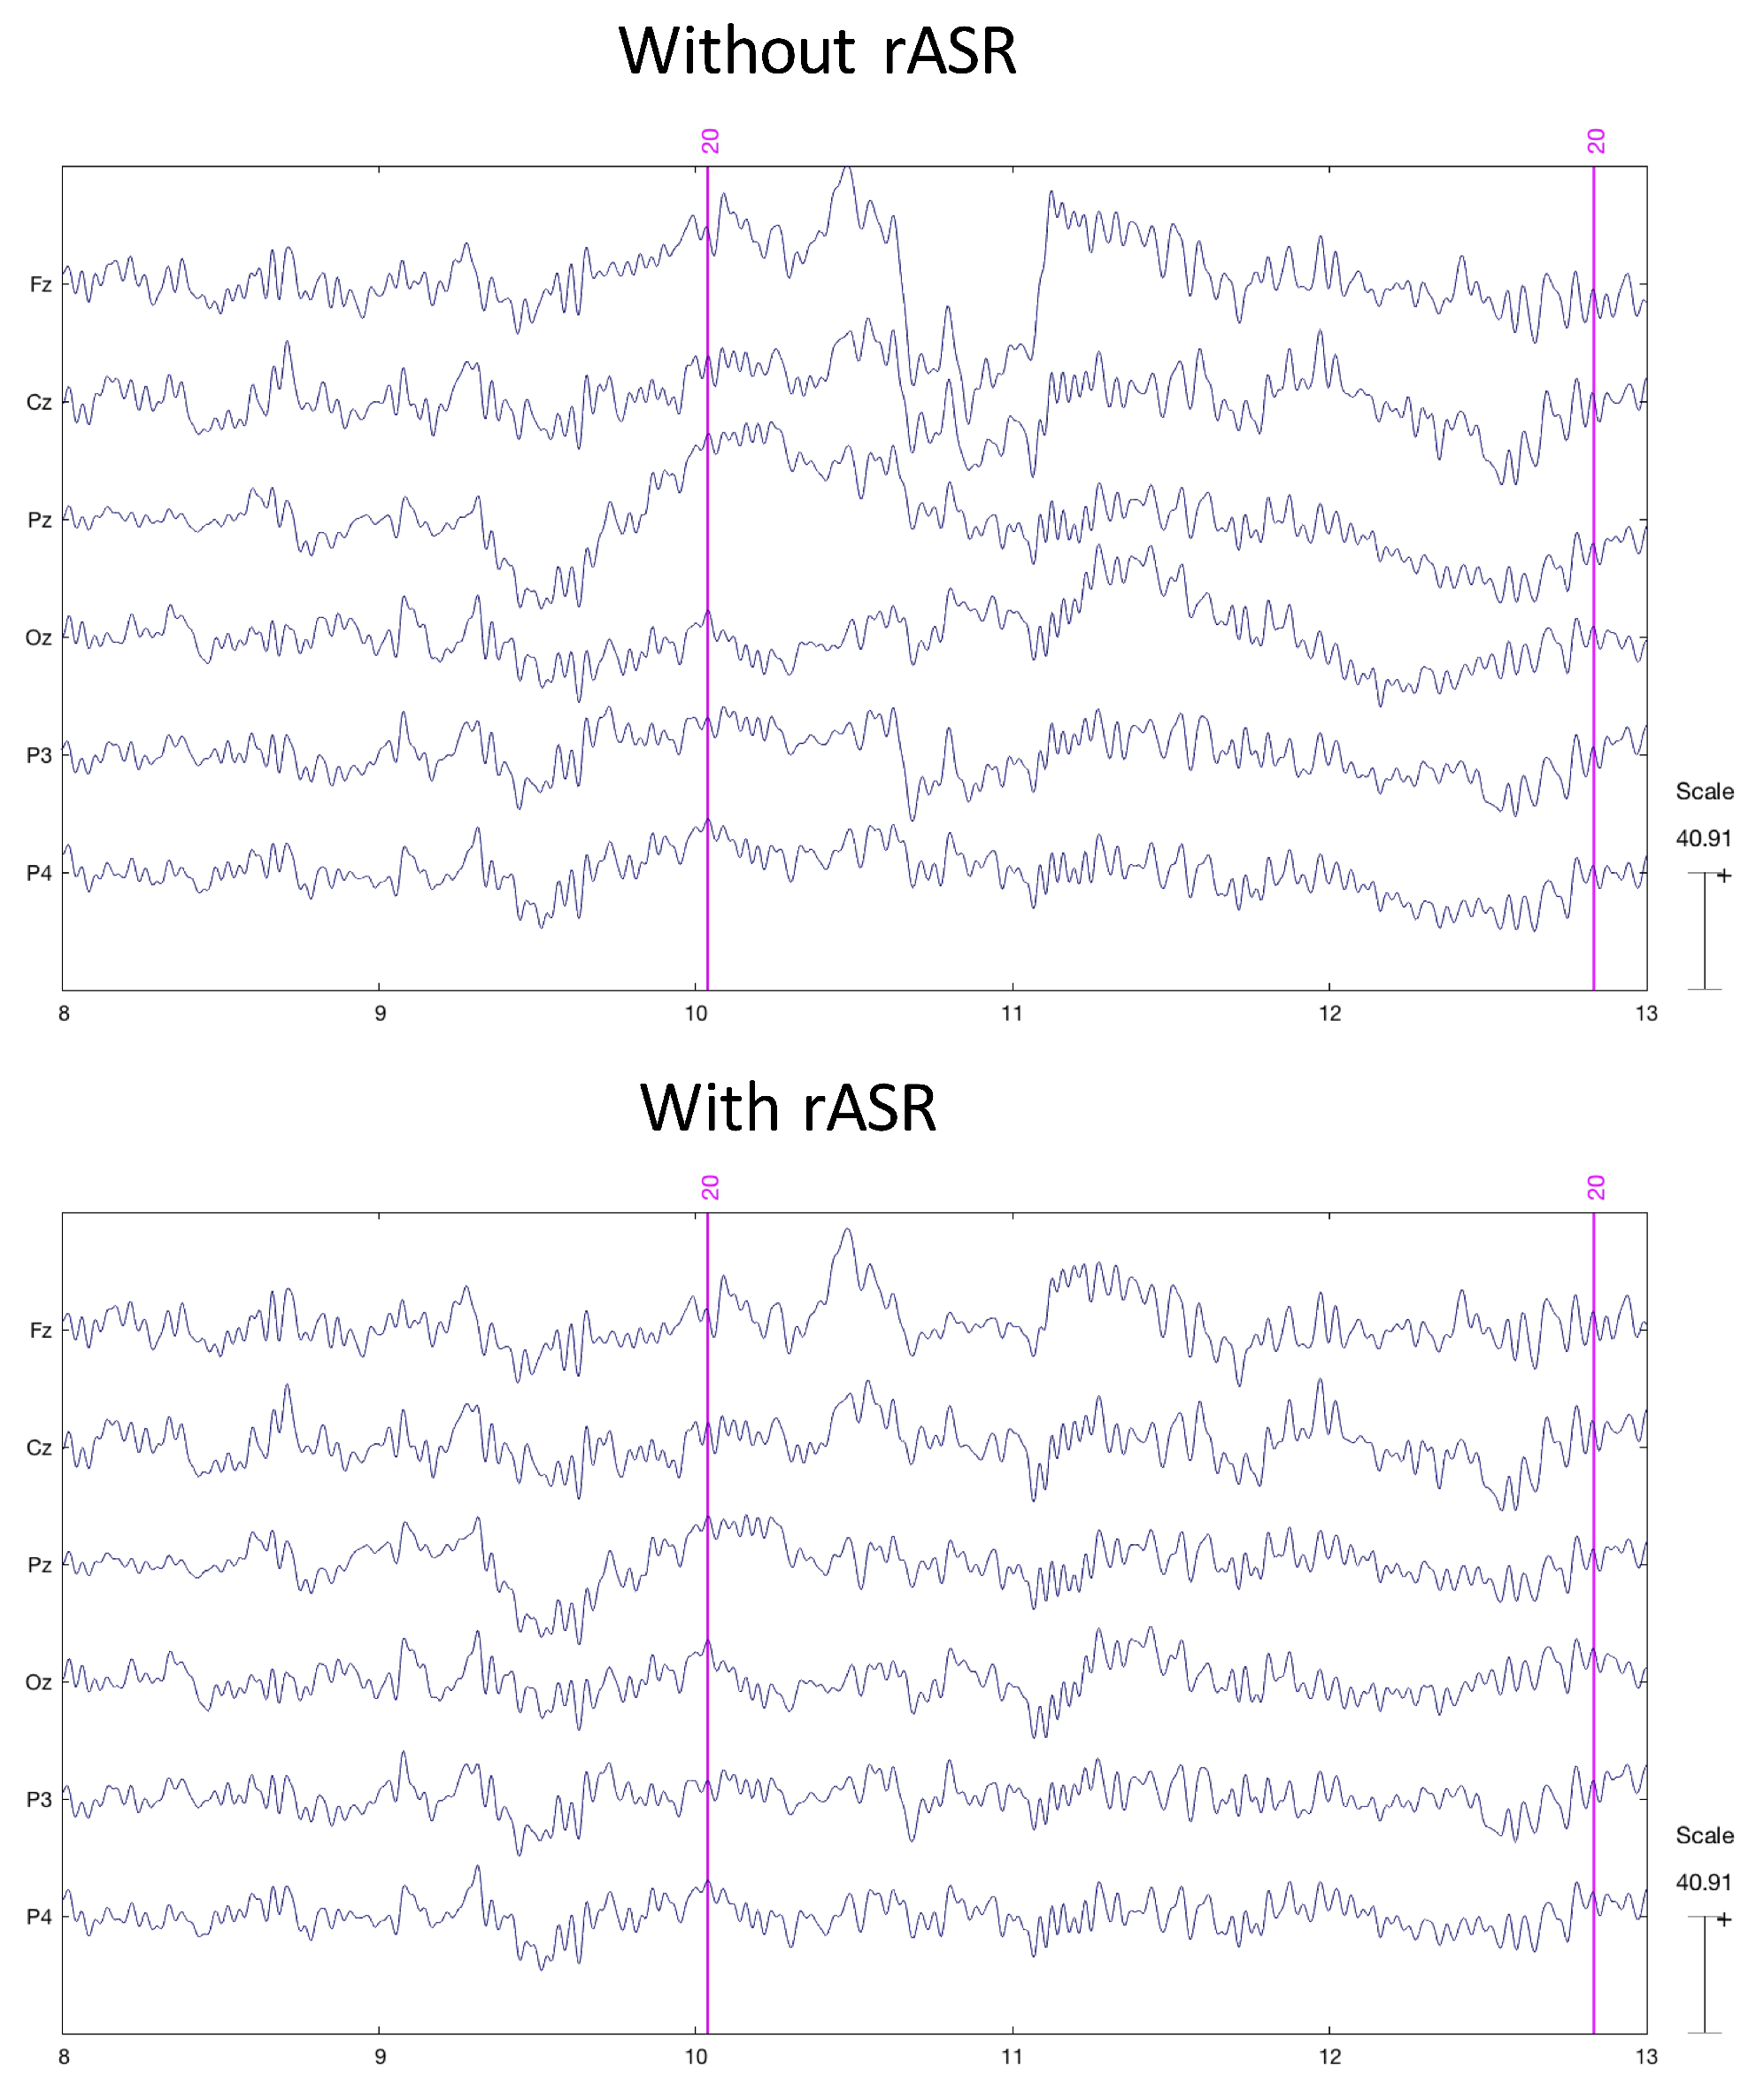
2.4.2. EEG Pre-Processing
2.4.3. EEG Statistical Analyses
2.4.4. EEG Processing for Single Trial Classification
3. Results
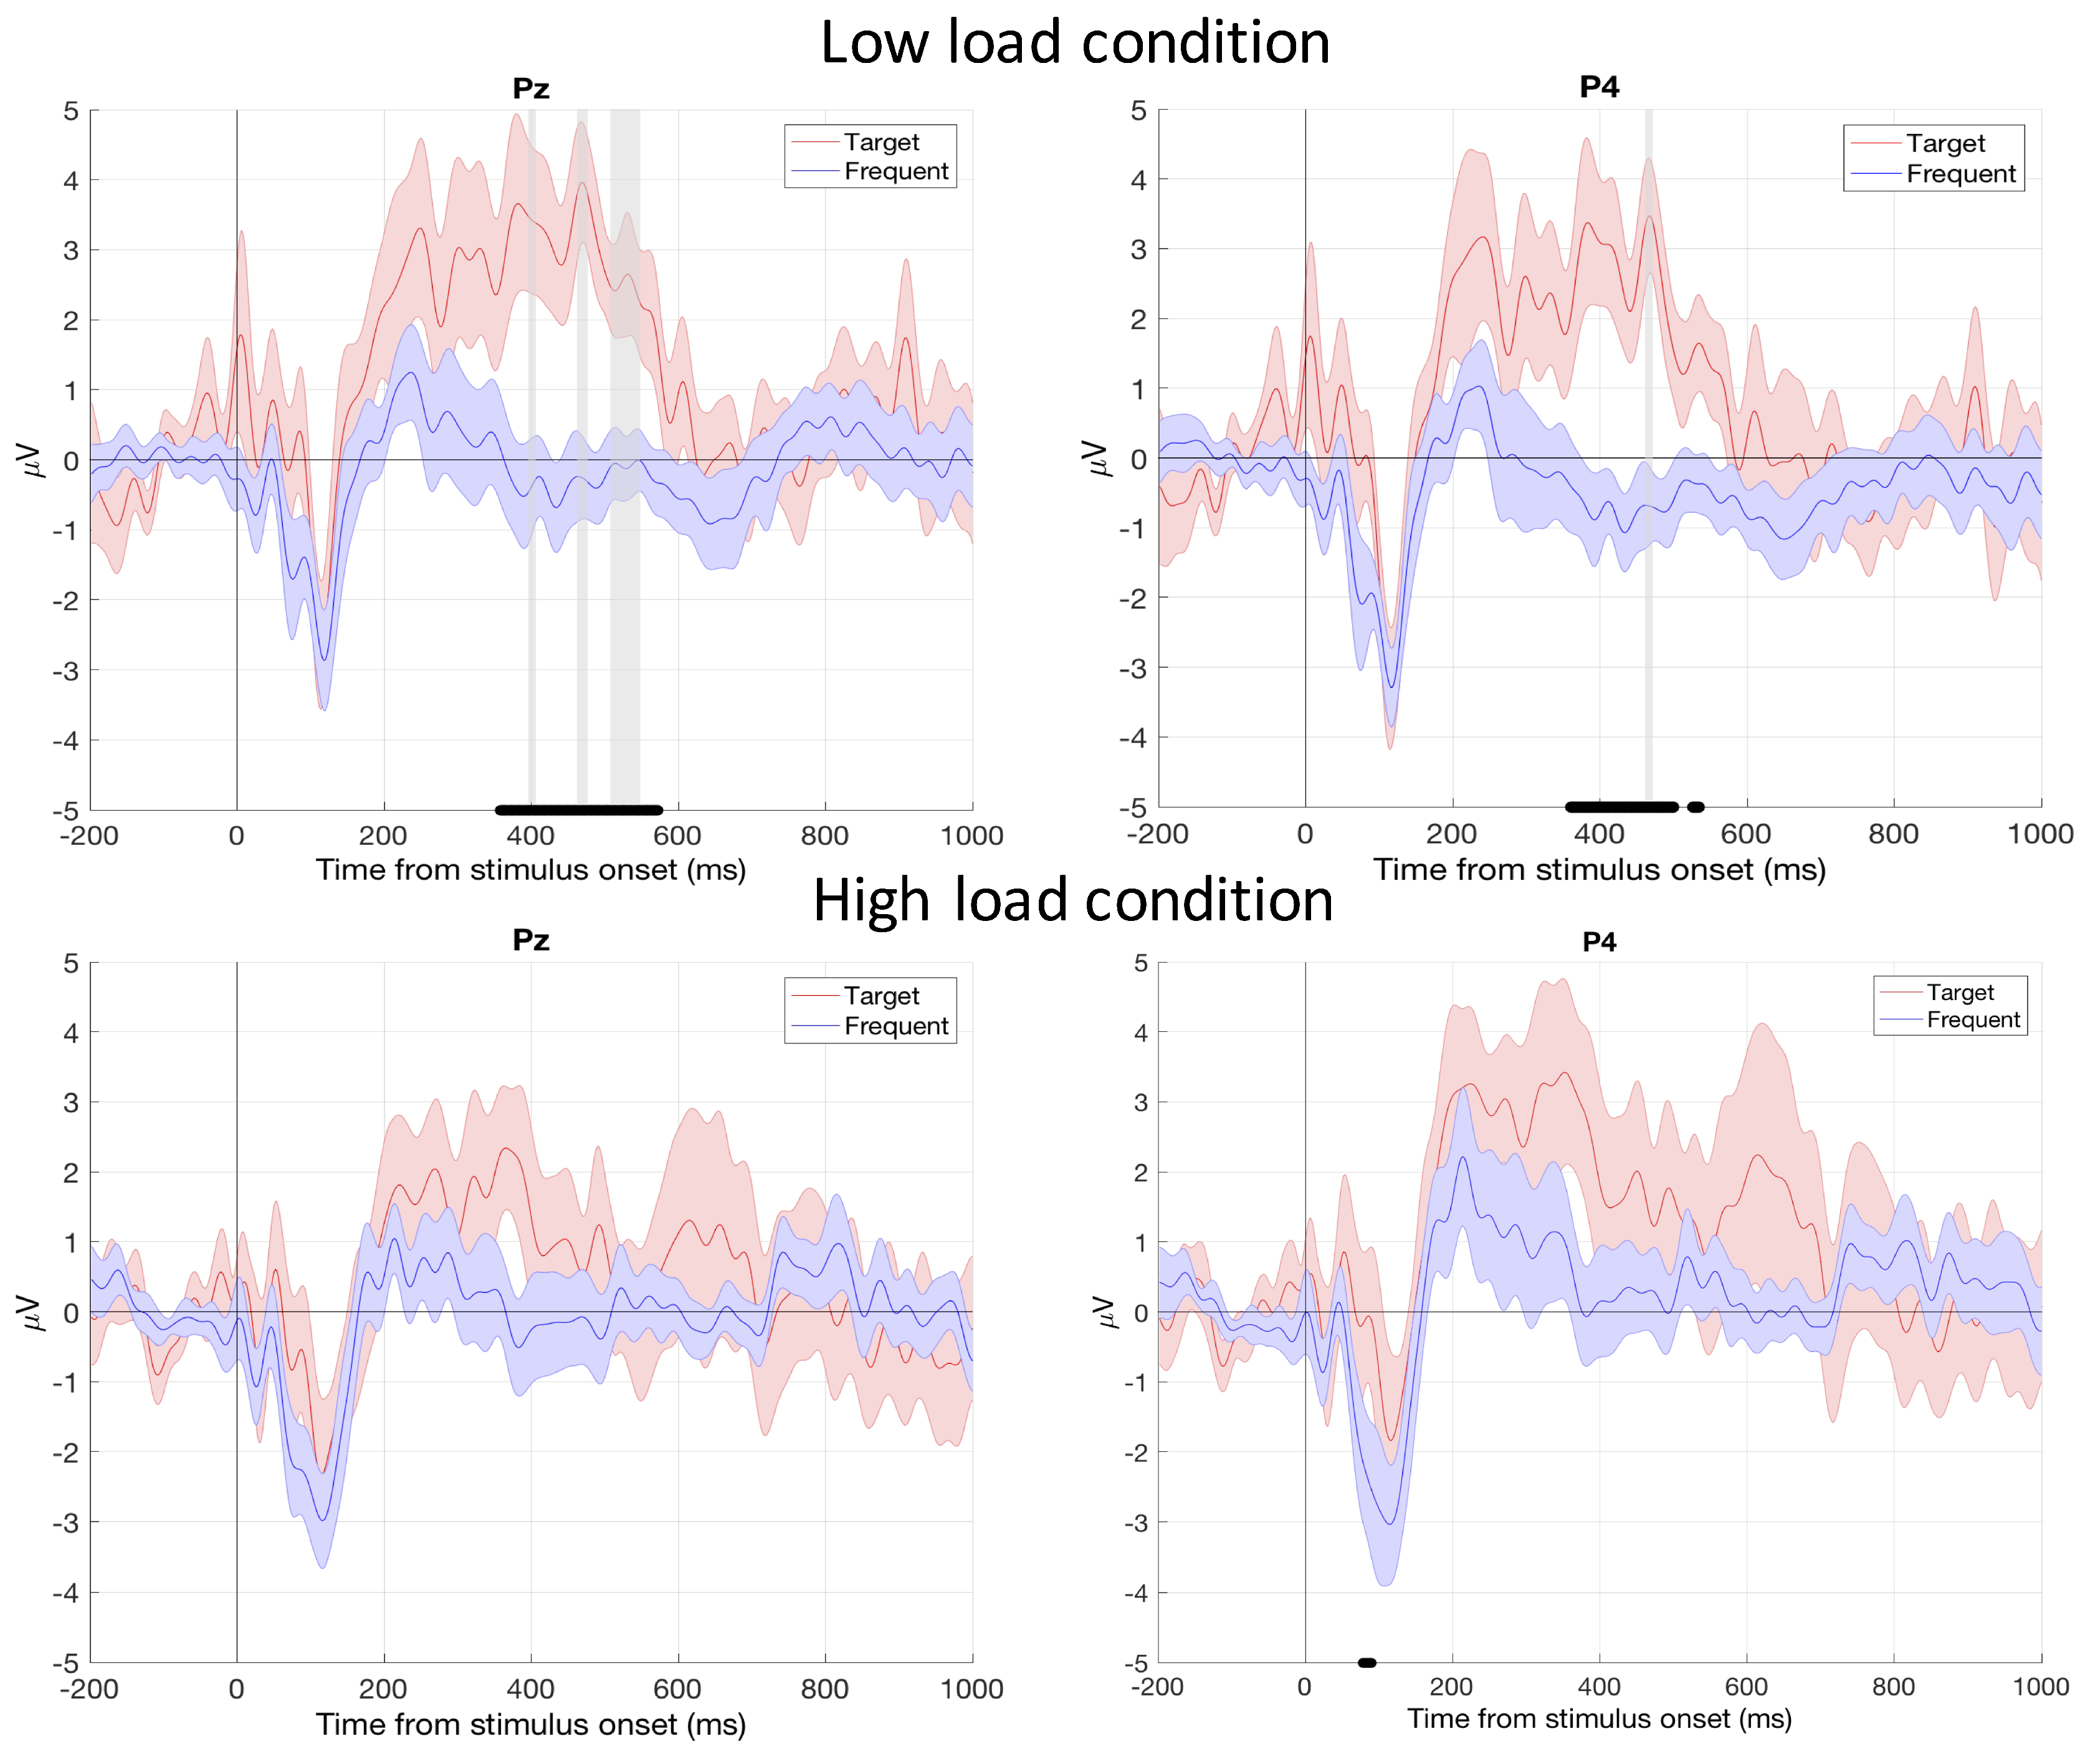
3.1. ERPs
Frequency Analyses
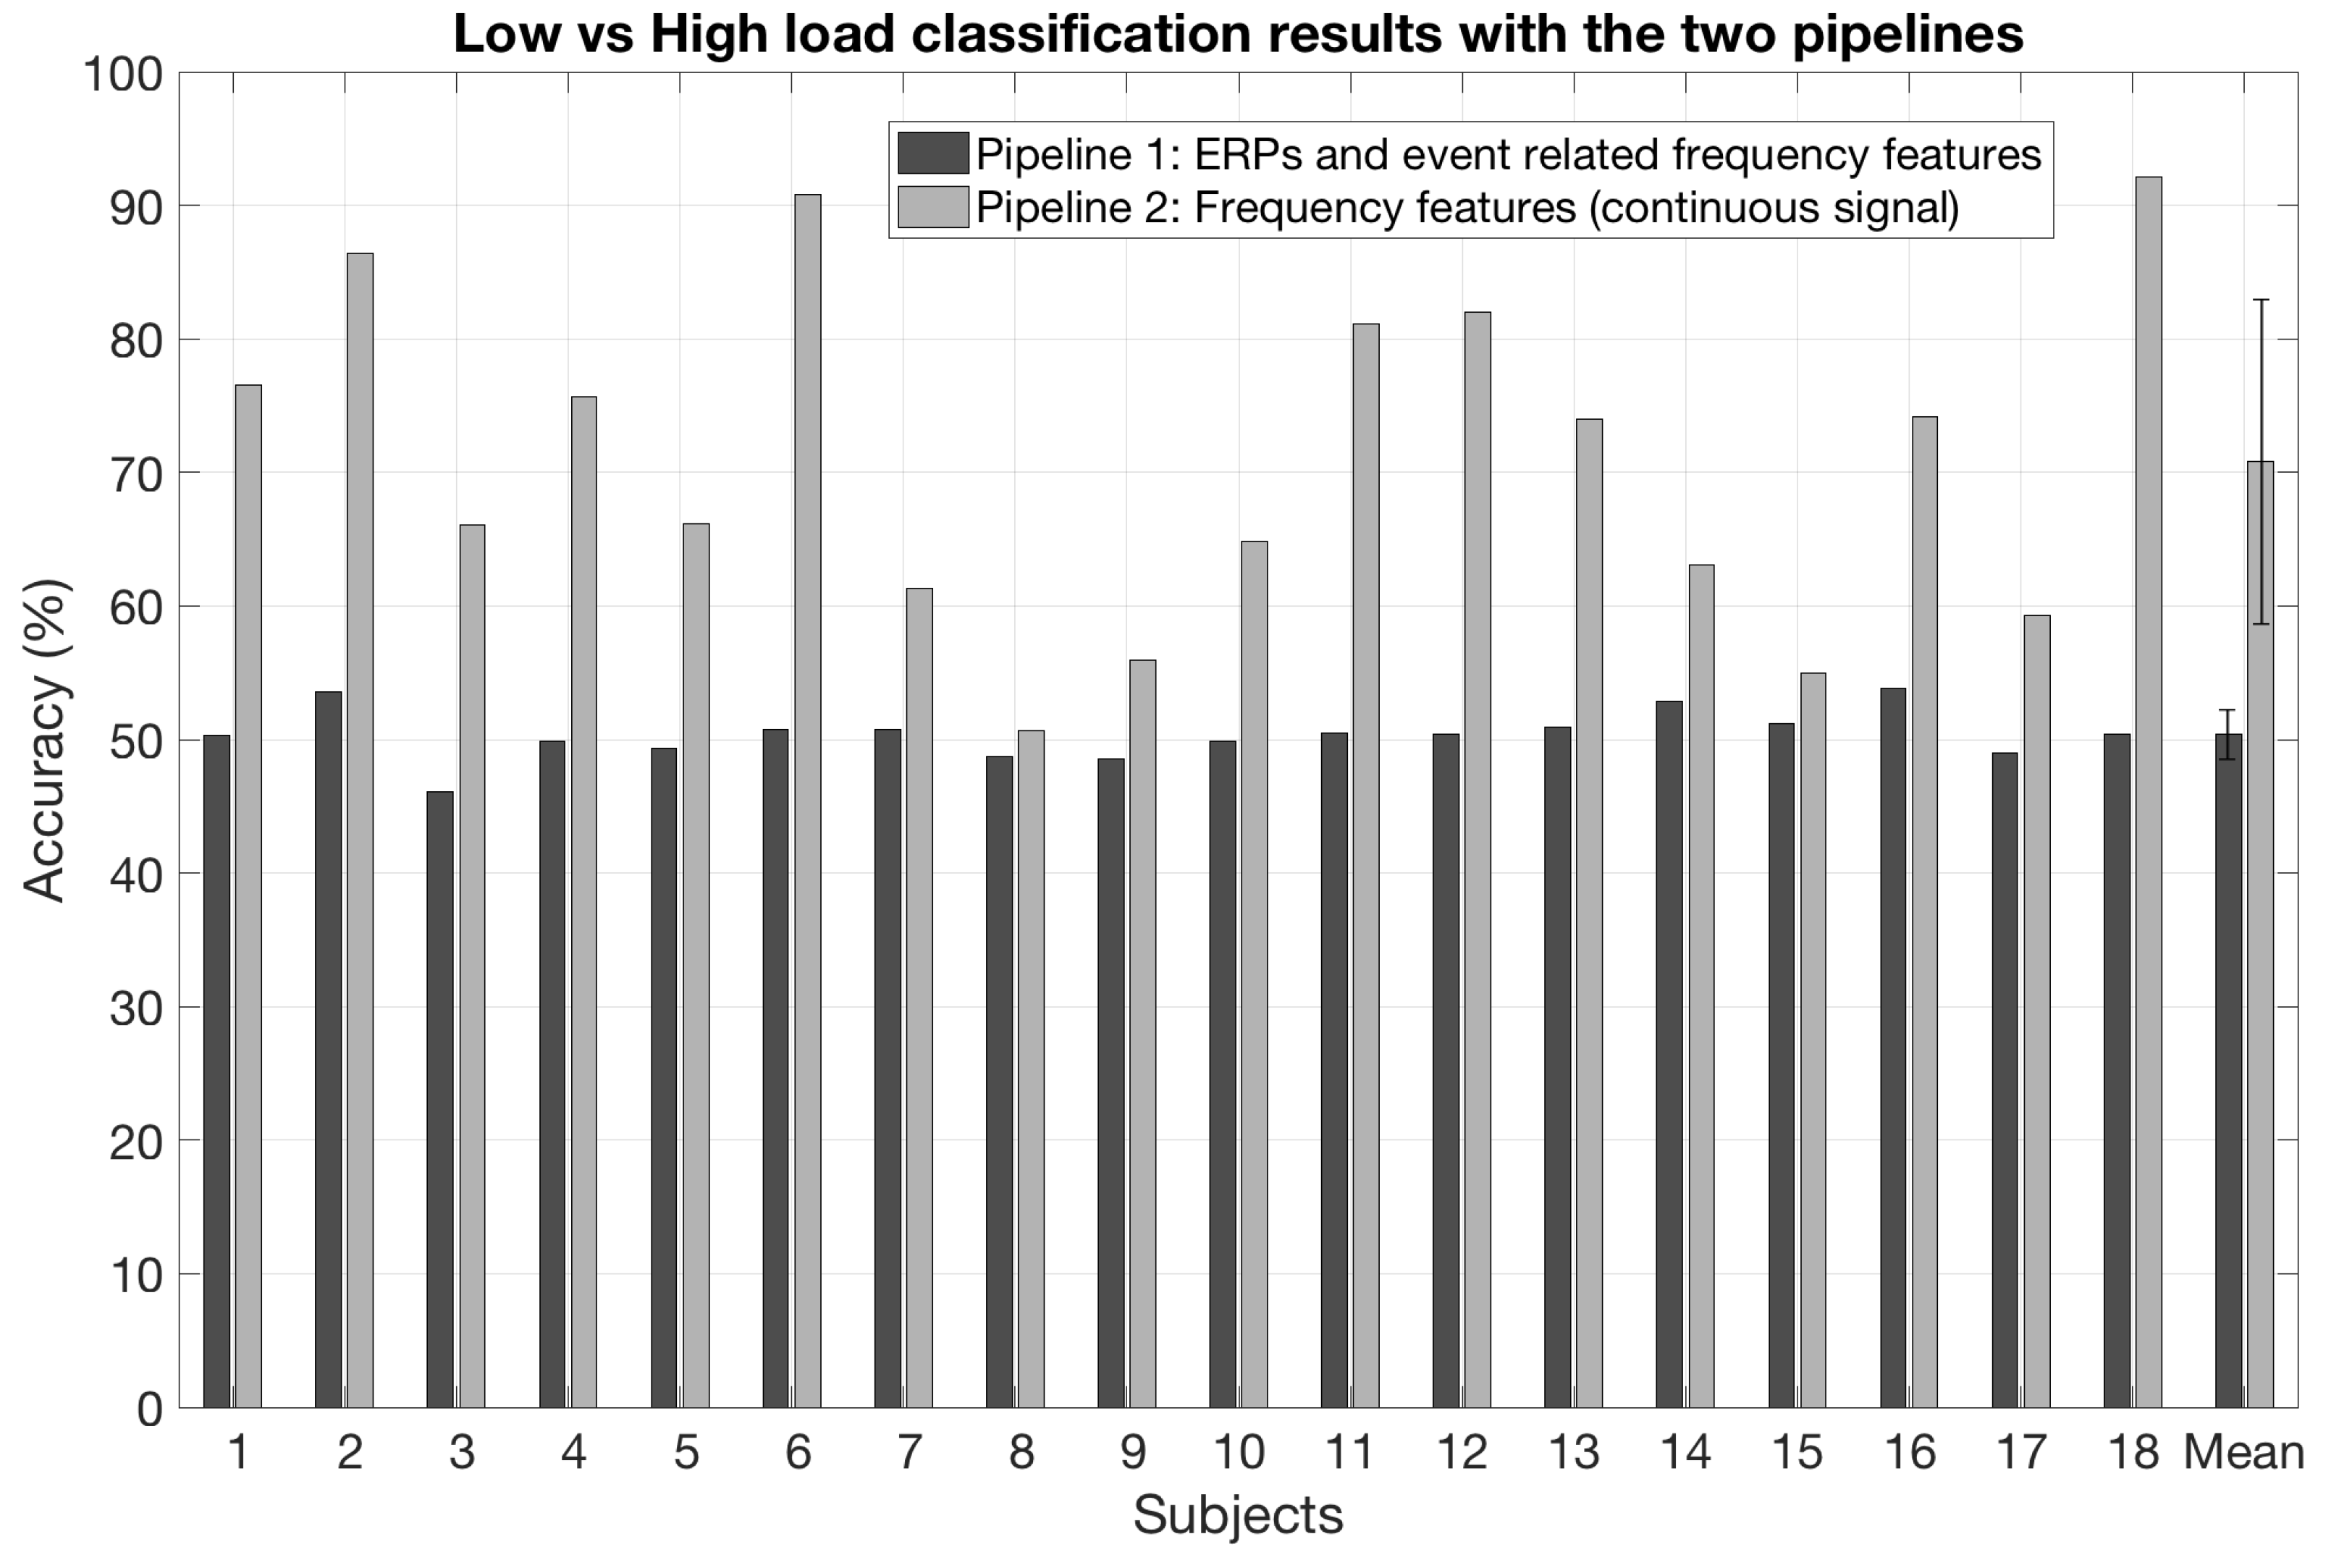
3.2. Single-Trial Classification Results
4. Discussion
5. Conclusions
Author Contributions
Funding
Acknowledgments
Conflicts of Interest
References
- Dehais, F.; Behrend, J.; Peysakhovich, V.; Causse, M.; Wickens, C.D. Pilot flying and pilot monitoring’s aircraft state awareness during go-around execution in aviation: A behavioral and eye tracking study. Int. J. Aerosp. Psychol. 2017, 27, 15–28. [Google Scholar] [CrossRef]
- Stokes, A.F.; Kite, K. Flight Stress: Stress, Fatigue and Performance in Aviation; Routledge: Abingdon, UK, 2017. [Google Scholar]
- Borghini, G.; Astolfi, L.; Vecchiato, G.; Mattia, D.; Babiloni, F. Measuring neurophysiological signals in aircraft pilots and car drivers for the assessment of mental workload, fatigue and drowsiness. Neurosc. Biobehav. Rev. 2014, 44, 58–75. [Google Scholar] [CrossRef] [PubMed]
- Durantin, G.; Gagnon, J.F.; Tremblay, S.; Dehais, F. Using near infrared spectroscopy and heart rate variability to detect mental overload. Behav. Brain Res. 2014, 259, 16–23. [Google Scholar] [CrossRef] [PubMed]
- Allsop, J.; Gray, R.; Bülthoff, H.H.; Chuang, L. Eye movement planning on Single-Sensor-Single-Indicator displays is vulnerable to user anxiety and cognitive load. J. Eye Mov. Res. 2017, 10, 1–15. [Google Scholar]
- Dehais, F.; Causse, M.; Vachon, F.; Régis, N.; Menant, E.; Tremblay, S. Failure to detect critical auditory alerts in the cockpit: Evidence for inattentional deafness. Hum. Factors 2014, 56, 631–644. [Google Scholar] [CrossRef] [PubMed]
- Dehais, F.; Causse, M.; Régis, N.; Menant, E.; Labedan, P.; Vachon, F.; Tremblay, S. Missing critical auditory alarms in aeronautics: Evidence for inattentional deafness? In Proceedings of the Human Factors and Ergonomics Society Annual Meeting; Sage Publications: Los Angeles, CA, USA, 2012; Volume 56, pp. 1639–1643. [Google Scholar]
- Taylor, J.L.; Yesavage, J.A.; Morrow, D.G.; Dolhert, N.; Brooks, J.O., III; Poon, L.W. The effects of information load and speech rate on younger and older aircraft pilots’ ability to execute simulated air-traffic controller instructions. J. Gerontol. 1994, 49, P191–P200. [Google Scholar] [CrossRef]
- Dismukes, R.; Young, G.E.; Sumwalt, R.L., III; Null, C.H. Cockpit Interruptions and Distractions: Effective Management Requires a Careful Balancing Act; Air Line Pilots Association: Washington, DC, USA, 1998. [Google Scholar]
- Orasanu, J.; Ames, N.; Martin, L.; Davison, J. Cognitive and contextual factors in aviation accidents: Decision errors. In Linking Expertise and Naturalistic Decision Making; Salas, E., Klein, G., Eds.; Lawrence Erlbaum Associates Publishers: Mahwah, NJ, USA, 2001; pp. 209–243. [Google Scholar]
- Zander, T.O.; Kothe, C. Towards passive brain-computer interfaces: Applying brain-computer interface technology to human-machine systems in general. J. Neural Eng. 2011, 8, 025005. [Google Scholar] [CrossRef] [PubMed]
- Lotte, F.; Bougrain, L.; Cichocki, A.; Clerc, M.; Congedo, M.; Rakotomamonjy, A.; Yger, F. A review of classification algorithms for EEG-based brain-computer interfaces: A 10 year update. J. Neural Eng. 2018, 15, 031005. [Google Scholar] [CrossRef]
- Lotte, F.; Roy, R.N. Brain-computer interface contributions to neuroergonomics. In Neuroergonomics; Elsevier: Amsterdam, The Nethrelands, 2019; pp. 43–48. [Google Scholar]
- Mühl, C.; Jeunet, C.; Lotte, F. EEG-based workload estimation across affective contexts. Front. Neurosc. 2014, 8, 114. [Google Scholar]
- Aricò, P.; Borghini, G.; Di Flumeri, G.; Colosimo, A.; Bonelli, S.; Golfetti, A.; Pozzi, S.; Imbert, J.P.; Granger, G.; Benhacene, R.; et al. Adaptive automation triggered by EEG-based mental workload index: A passive brain-computer interface application in realistic air traffic control environment. Front. Hum. Neurosci. 2016, 10, 539. [Google Scholar] [CrossRef]
- Ewing, K.C.; Fairclough, S.H.; Gilleade, K. Evaluation of an adaptive game that uses EEG measures validated during the design process as inputs to a biocybernetic loop. Front. Hum. Neurosci. 2016, 10, 223. [Google Scholar] [CrossRef] [PubMed]
- Shou, G.; Ding, L. Frontal theta EEG dynamics in a real-world air traffic control task. In Proceedings of the 35th Annual International Conference of the IEEE Engineering in Medicine and Biology Society (EMBC), Osaka, Japan, 3–7 July 2013; pp. 5594–5597. [Google Scholar]
- Fairclough, S.; Mulder, L. Psychophysiological processes of mental effort investment. In How Motivation Affects Cardiovascular Response: Mechanisms and Applications; American Psychological Association: Washington, DC, USA, 2011; pp. 61–76. [Google Scholar]
- Matthews, G.; Reinerman-Jones, L.; Abich, J., IV; Kustubayeva, A. Metrics for individual differences in EEG response to cognitive workload: Optimizing performance prediction. Personal. Individ. Differ. 2017, 118, 22–28. [Google Scholar] [CrossRef]
- Fitzgibbon, S.; Pope, K.; Mackenzie, L.; Clark, C.; Willoughby, J. Cognitive tasks augment gamma EEG power. Clin. Neurophysiol. 2004, 115, 1802–1809. [Google Scholar] [CrossRef] [PubMed]
- Roy, R.N.; Bonnet, S.; Charbonnier, S.; Campagne, A. Efficient workload classification based on ignored auditory probes: a proof of concept. Front. Hum. Neurosci. 2016, 10, 519. [Google Scholar] [CrossRef] [PubMed]
- Brouwer, A.M.; Hogervorst, M.A.; Van Erp, J.B.; Heffelaar, T.; Zimmerman, P.H.; Oostenveld, R. Estimating workload using EEG spectral power and ERPs in the n-back task. J. Neural Eng. 2012, 9, 045008. [Google Scholar] [CrossRef]
- Polich, J. Updating P300: An integrative theory of P3a and P3b. Clin. Neurophysiol. 2007, 118, 2128–2148. [Google Scholar] [CrossRef]
- Gateau, T.; Ayaz, H.; Dehais, F. In silico versus over the clouds: On-the-fly mental state estimation of aircraft pilots, using a functional near infrared spectroscopy based passive-BCI. Front. Hum. Neurosci. 2018, 12, 187. [Google Scholar] [CrossRef] [PubMed]
- Lotte, F.; Fujisawa, J.; Touyama, H.; Ito, R.; Hirose, M.; Lécuyer, A. Towards ambulatory brain-computer interfaces: A pilot study with P300 signals. In Proceedings of the International Conference on Advances in Computer Enterntainment Technology; ACM: New York, NY, USA, 2009; pp. 336–339. [Google Scholar]
- Debener, S.; Emkes, R.; De Vos, M.; Bleichner, M. Unobtrusive ambulatory EEG using a smartphone and flexible printed electrodes around the ear. Sci. Rep. 2015, 5, 16743. [Google Scholar] [CrossRef] [PubMed]
- Wilson, G.F.; Purvis, B.; Skelly, J.; Fullenkamp, P.; Davis, I. Physiological data used to measure pilot workload in actual flight and simulator conditions. In Proceedings of the Human Factors Society Annual Meeting; Sage Publications: Los Angeles, CA, USA, 1987; Volume 31, pp. 779–783. [Google Scholar]
- Sauvet, F.; Bougard, C.; Coroenne, M.; Lely, L.; Van Beers, P.; Elbaz, M.; Guillard, M.; Leger, D.; Chennaoui, M. In-flight automatic detection of vigilance states using a single EEG channel. IEEE Trans. Biomed. Eng. 2014, 61, 2840–2847. [Google Scholar] [CrossRef]
- Di Stasi, L.L.; Diaz-Piedra, C.; Suárez, J.; McCamy, M.B.; Martinez-Conde, S.; Roca-Dorda, J.; Catena, A. Task complexity modulates pilot electroencephalographic activity during real flights. Psychophysiology 2015, 52, 951–956. [Google Scholar] [CrossRef]
- Sterman, M.; Schummer, G.; Dushenko, T.; Smith, J. Electroencephalographic Correlates of Pilot Performance: Simulation and In-Flight Studies; Technical report; Advisory Group for Aerospace Research and Development: Neuilly-sur-Seine, France, 1988. [Google Scholar]
- Blum, S.; Debener, S.; Emkes, R.; Volkening, N.; Fudickar, S.; Bleichner, M.G. EEG recording and online signal processing on android: A multiapp framework for brain-computer interfaces on smartphone. BioMed Res. Int. 2017. [Google Scholar] [CrossRef] [PubMed]
- Guger, C.; Krausz, G.; Allison, B.Z.; Edlinger, G. Comparison of dry and gel based electrodes for P300 brain-computer interfaces. Front. Neurosci. 2012, 6, 60. [Google Scholar] [CrossRef] [PubMed]
- Searle, A.; Kirkup, L. A direct comparison of wet, dry and insulating bioelectric recording electrodes. Physiol. Meas. 2000, 21, 271. [Google Scholar] [CrossRef] [PubMed]
- Callan, D.E.; Gateau, T.; Durantin, G.; Gonthier, N.; Dehais, F. Disruption in neural phase synchrony is related to identification of inattentional deafness in real-world setting. Hum. Brain Map. 2018, 39, 2596–2608. [Google Scholar] [CrossRef] [PubMed]
- Dehais, F.; Roy, R.N.; Durantin, G.; Gateau, T.; Callan, D. EEG-engagement index and auditory alarm misperception: An inattentional deafness study in actual flight condition. In International Conference on Applied Human Factors and Ergonomics; Springer: Berlin, Germany, 2017; pp. 227–234. [Google Scholar]
- Dehais, F.; Duprès, A.; Di Flumeri, G.; Verdière, K.J.; Borghini, G.; Babiloni, F.; Roy, R.N. Monitoring pilot’s cognitive fatigue with engagement features in simulated and actual flight conditions using an hybrid fNIRS-EEG passive BCI. IEEE SMC 2018, 544–549. [Google Scholar] [CrossRef]
- Scholl, C.A.; Chi, Y.M.; Elconin, M.; Gray, W.R.; Chevillet, M.A.; Pohlmeyer, E.A. Classification of pilot-induced oscillations during in-flight piloting exercises using dry EEG sensor recordings. In Proceedings of the IEEE 38th Annual International Conference of the Engineering in Medicine and Biology Society (EMBC), Orlando, FL, USA, 17–20 August 2016; pp. 4467–4470. [Google Scholar]
- Callan, D.E.; Durantin, G.; Terzibas, C. Classification of single-trial auditory events using dry-wireless EEG during real and motion simulated flight. Front. Syst. Neurosci. 2015, 9, 11. [Google Scholar] [CrossRef]
- Delorme, A.; Makeig, S. EEGLAB: An open source toolbox for analysis of single-trial EEG dynamics including independent component analysis. J. Neurosci. Methods 2004, 134, 9–21. [Google Scholar] [CrossRef]
- Mullen, T.; Kothe, C.; Chi, Y.M.; Ojeda, A.; Kerth, T.; Makeig, S.; Cauwenberghs, G.; Jung, T.P. Real-time modeling and 3D visualization of source dynamics and connectivity using wearable EEG. In Proceedings of the IEEE 35th Annual International Conference of the Engineering in Medicine and Biology Society (EMBC), Osaka, Japan, 3–7 July 2013; pp. 2184–2187. [Google Scholar]
- Arad, E.; Bartsch, R.P.; Kantelhardt, J.W.; Plotnik, M. Performance-based approach for movement artifact removal from electroencephalographic data recorded during locomotion. PLoS ONE 2018, 13, e0197153. [Google Scholar] [CrossRef]
- Luu, T.P.; Brantley, J.A.; Nakagome, S.; Zhu, F.; Contreras-Vidal, J.L. Electrocortical correlates of human level-ground, slope, and stair walking. PLoS ONE 2017, 12, e0188500. [Google Scholar] [CrossRef]
- Blum, S.; Jacobsen, N.S.J.; Bleichner, M.G.; Debener, S. Riemannian Artifact Subspace Reconstruction for EEG Artifact Correction. 2019; manuscript submitted for publication. [Google Scholar]
- rASR Open Source Project Repository. Available online: https://github.com/s4rify/rASRMatlab (accessed on 8 January 2019).
- Käthner, I.; Wriessnegger, S.C.; Müller-Putz, G.R.; Kübler, A.; Halder, S. Effects of mental workload and fatigue on the P300, alpha and theta band power during operation of an ERP (P300) brain-computer interface. Biol. Psychol. 2014, 102, 118–129. [Google Scholar] [CrossRef]
- Efron, B.; Tibshirani, R.J. An Introduction to the Bootstrap; CRC Press: Boca Raton, FL, USA, 1994. [Google Scholar]
- Lotte, F. A tutorial on EEG signal-processing techniques for mental-state recognition in brain-computer interfaces. In Guide to Brain-Computer Music Interfacing; Springer: Berlin, Germany, 2014; pp. 133–161. [Google Scholar]
- Blankertz, B.; Tomioka, R.; Lemm, S.; Kawanabe, M.; Müller, K.R. Optimizing spatial filters for robust EEG single-trial analysis. IEEE Signal Process. Mag. 2008, 25, 41–56. [Google Scholar] [CrossRef]
- Lotte, F. Signal processing approaches to minimize or suppress calibration time in oscillatory activity-based brain-computer interfaces. Proc. IEEE 2015, 103, 871–890. [Google Scholar] [CrossRef]
- Peng, H.; Long, F.; Ding, C. Feature selection based on mutual information: Criteria of max-dependency, max-relevance, and min-redundancy. IEEE Trans. Pattern Anal. Mach. Intell. 2005, 27, 1226–1238. [Google Scholar] [CrossRef]
- Haufe, S.; Meinecke, F.; Görgen, K.; Dähne, S.; Haynes, J.D.; Blankertz, B.; Bießmann, F. On the interpretation of weight vectors of linear models in multivariate neuroimaging. Neuroimage 2014, 87, 96–110. [Google Scholar] [CrossRef]
- Natani, K.; Gomer, F.E. Electrocortical Activity and Operator Workload: A Comparison of Changes in the Electroencephalogram and in Event-Related Potentials; Technical report; McDonnell Douglas Astronautics Company: St. Louis, MO, USA, 1981. [Google Scholar]
- Sirevaag, E.J.; Kramer, A.; Reisweber, M.; Wickens, C.S.D.; Grenell, J.F. Assessment of pilot performance and mental workload in rotary wing aircraft. Ergonomics 1993, 36, 1121–1140. [Google Scholar] [CrossRef]
- Dehais, F.; Roy, R.; Scannella, S. Inattentional deafness to auditory alarms: Inter-individual differences, electrophysiological signature and single trial classification. Behav. Brain Res. 2018, 360, 51–59. [Google Scholar] [CrossRef]
- Durantin, G.; Dehais, F.; Gonthier, N.; Terzibas, C.; Callan, D.E. Neural signature of inattentional deafness. Hum. Brain Mapp. 2017, 38, 5440–5455. [Google Scholar] [CrossRef]
- Beatty, J.; Greenberg, A.; Deibler, W.P.; O’Hanlon, J.F. Operant control of occipital theta rhythm affects performance in a radar monitoring task. Science 1974, 183, 871–873. [Google Scholar] [CrossRef]
- Makeig, S.; Inlow, M. Lapse in alertness: Coherence of fluctuations in performance and EEG spectrum. Electroencephalogr. Clin. Neurophysiol. 1993, 86, 23–35. [Google Scholar] [CrossRef]
- Bleichner, M.G.; Debener, S. Concealed, unobtrusive ear-centered EEG acquisition: CEEGrids for transparent EEG. Front. Hum. Neurosci. 2017, 11, 163. [Google Scholar] [CrossRef]
- Bleichner, M.G.; Mirkovic, B.; Debener, S. Identifying auditory attention with ear-EEG: CEEGrid versus high-density cap-EEG comparison. J. Neural Eng. 2016, 13, 066004. [Google Scholar] [CrossRef]
- Scannella, S.; Peysakhovich, V.; Ehrig, F.; Lepron, E.; Dehais, F. Assessment of ocular and physiological metrics to discriminate flight phases in real light aircraft. Hum. Factors 2018, 60, 922–935. [Google Scholar] [CrossRef] [PubMed]
- Kubler, A.; Mushahwar, V.; Hochberg, L.R.; Donoghue, J.P. BCI meeting 2005—Workshop on clinical issues and applications. IEEE Trans. Neural Syst. Rehabil. Eng. 2006, 14, 131–134. [Google Scholar] [CrossRef] [PubMed]
- Kappel, S.L.; Rank, M.L.; Toft, H.O.; Andersen, M.; Kidmose, P. Dry-contact electrode ear-EEG. IEEE Trans. Biomed. Eng. 2018, 66, 150–158. [Google Scholar] [CrossRef] [PubMed]


| Pipeline | Mean Accuracy | Mean Sensitivity | Mean Specificity |
|---|---|---|---|
| #1: ERPs & frequency | 50.4% | 51.2% | 49.6% |
| #1: ERPs | 50.4% | 50.9% | 49.9% |
| #1: frequency | 63.1% | 61.7% | 64.5% |
| #2: frequency | 70.8% | 70.6% | 71% |
© 2019 by the authors. Licensee MDPI, Basel, Switzerland. This article is an open access article distributed under the terms and conditions of the Creative Commons Attribution (CC BY) license (http://creativecommons.org/licenses/by/4.0/).
Share and Cite
Dehais, F.; Duprès, A.; Blum, S.; Drougard, N.; Scannella, S.; Roy, R.N.; Lotte, F. Monitoring Pilot’s Mental Workload Using ERPs and Spectral Power with a Six-Dry-Electrode EEG System in Real Flight Conditions. Sensors 2019, 19, 1324. https://doi.org/10.3390/s19061324
Dehais F, Duprès A, Blum S, Drougard N, Scannella S, Roy RN, Lotte F. Monitoring Pilot’s Mental Workload Using ERPs and Spectral Power with a Six-Dry-Electrode EEG System in Real Flight Conditions. Sensors. 2019; 19(6):1324. https://doi.org/10.3390/s19061324
Chicago/Turabian StyleDehais, Frédéric, Alban Duprès, Sarah Blum, Nicolas Drougard, Sébastien Scannella, Raphaëlle N. Roy, and Fabien Lotte. 2019. "Monitoring Pilot’s Mental Workload Using ERPs and Spectral Power with a Six-Dry-Electrode EEG System in Real Flight Conditions" Sensors 19, no. 6: 1324. https://doi.org/10.3390/s19061324
APA StyleDehais, F., Duprès, A., Blum, S., Drougard, N., Scannella, S., Roy, R. N., & Lotte, F. (2019). Monitoring Pilot’s Mental Workload Using ERPs and Spectral Power with a Six-Dry-Electrode EEG System in Real Flight Conditions. Sensors, 19(6), 1324. https://doi.org/10.3390/s19061324